1 Effect of Topography on Weak and Moderate Tornadoes Mary Sue Passe‐Smith Lecturer Department of Geography University of Central Arkansas 201 Donaghey Avenue Conway, AR 72035 (501) 450‐3280 E‐mail [email protected]
Transcript
1
Effect of Topography on Weak and Moderate Tornadoes
Mary Sue Passe‐Smith Lecturer
Department of Geography University of Central Arkansas
201 Donaghey Avenue Conway, AR 72035 (501) 450‐3280
Effect of Topography on Weak and Moderate Tornadoes Mary Sue Passe-Smith University of Central Arkansas It is proposed that weaker and moderate (EF0-EF2) tornadoes are far more affected by local topography (roughness, slope, etc.) and perhaps changes in land cover/soil type as these attributes relate to moisture availability than are strong and violent (EF3-EF5) tornadoes, especially when synoptic conditions are not highly favorable. The pre-tornado surface characteristics for weak and moderate tornadoes will be assessed for dominant topographic traits over a confined area. The resulting model will be applied to a larger area to test its veracity. This information can alert forecasters to areas deemed highly favorable which may require special attention when approached by supercell or certain squall-line thunderstorms
3
Introduction
When I proposed this paper, little did I know that an often‐affected area in my own backyard
was about to undergo repeated hammering by tornadoes from January through May of 2008. On
January 7/8, February 5, April 9, May 2, and May 10, 2008, repeated outbreaks of tornadoes raked the
area within 25‐40 miles of my home, which even more intensely begs the question: why here, in this
small area? What about it is so different? Some small towns were hit or barely missed in three separate
outbreaks in a few months, such as those in northern Conway County (Jan 7, Feb 5, May 2) and affected
by another extremely severe storm on May 10. This area has been highlighted in studies I had done
previously. Sadly, the northeast quarter of Arkansas is also an area of numerous deaths in lower‐
intensity tornadoes as compared with some of the areas in the more ‘traditional’ Tornado Alley (Kansas,
Oklahoma, Texas).
My goal in this paper is to determine as definitively as possible whether there are any
topographic influences that repeatedly show up either upstream or downstream of weak or moderate
tornado ‘hotspots’—in other words, areas where ‘instigation’ of tornadoes is far more prevalent than in
other areas surrounding them. If these areas can be identified, all storms passing over this terrain
should be considered for all intents and purposes ‘armed and dangerous’ and of heightened interest to
local forecasters responsible for dissemination of warnings.
As discussed in Passe‐Smith (2006), there is some evidence that local topography is thought to
enhance or even initiate tornadogenesis. Bosart et al. (2004) notes that storms crossing a river valleys
perpendicular to their movement experience strong increases in shear within the parent supercell
thunderstorm; Peckham et al. (2004) discuss horizontal convective rolls which form along upslopes in
the Texas panhandle as related to enhanced convection; these rolls were likely a mechanism for
initiating convection on May 3, 1999 (the deadly Oklahoma City outbreak). Others have cited changes in
land cover or vegetation type as instigating factors (cf. Raddatz and Cummine, 2003; Weaver and
4
Avissar, 2001; Esau and Lyons, 2002). While little was found in 2006 other than a tendency for
long/strong tornado tracks to cross stream valleys perpendicularly, there is also the possibility that
stronger storms are less affected by local topography than are weak and moderate (EF0‐EF2 on the
Enhanced Fujita scale for measuring tornado intensity) tornadoes. This hypothesis will be explored in
the following pages.
Methodology For this study, I used Spatial Analyst to calculate the density of tornado paths, not just
touchdowns, as this gives a far more accurate result for how often an area is visited by a tornado at any
point along its path. The resulting raster output is shown below in Figure 1.
Figure 1: F2 or greater intensity tornado path density in U.S., 1950‐2007. The high, .23, shows areas where 23 square miles of any 100 square mile area were affected by a tornado at some point in the 57‐year period.
5
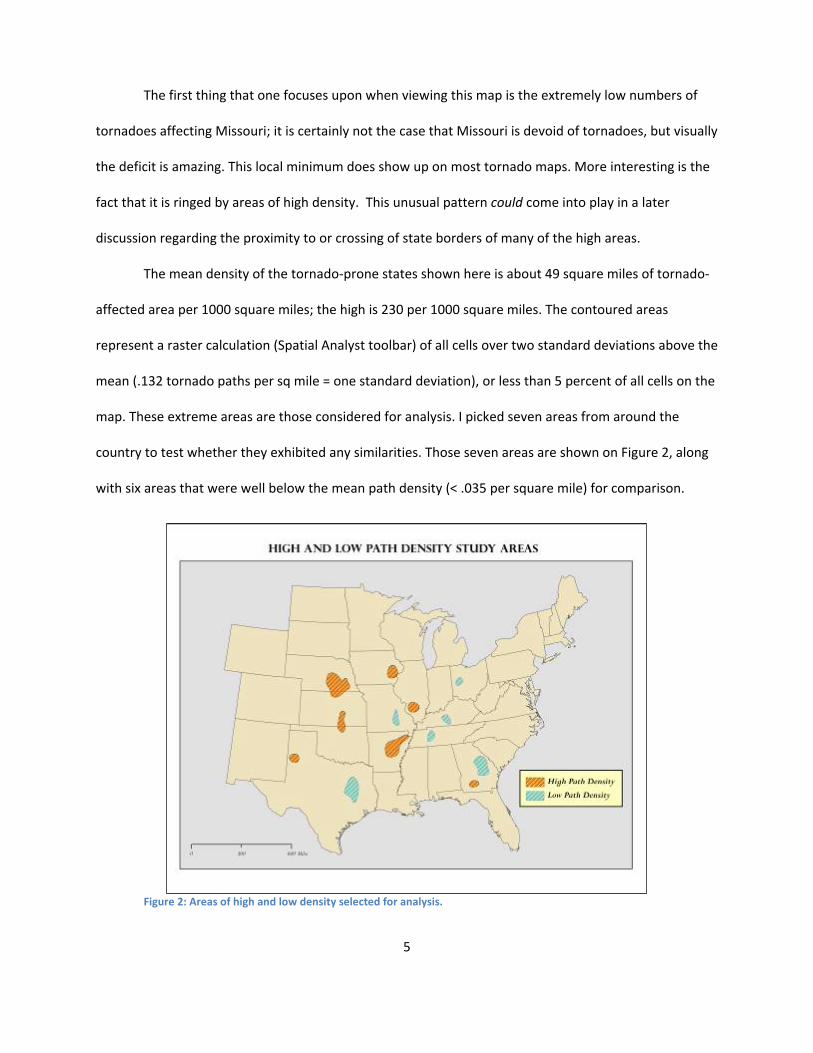
The first thing that one focuses upon when viewing this map is the extremely low numbers of
tornadoes affecting Missouri; it is certainly not the case that Missouri is devoid of tornadoes, but visually
the deficit is amazing. This local minimum does show up on most tornado maps. More interesting is the
fact that it is ringed by areas of high density. This unusual pattern could come into play in a later
discussion regarding the proximity to or crossing of state borders of many of the high areas.
The mean density of the tornado‐prone states shown here is about 49 square miles of tornado‐
affected area per 1000 square miles; the high is 230 per 1000 square miles. The contoured areas
represent a raster calculation (Spatial Analyst toolbar) of all cells over two standard deviations above the
mean (.132 tornado paths per sq mile = one standard deviation), or less than 5 percent of all cells on the
map. These extreme areas are those considered for analysis. I picked seven areas from around the
country to test whether they exhibited any similarities. Those seven areas are shown on Figure 2, along
with six areas that were well below the mean path density (< .035 per square mile) for comparison.
Figure 2: Areas of high and low density selected for analysis.
6
The largest area (in Mississippi, Louisiana, and southeast Arkansas), was not chosen due to the
number of layers needed for analysis; the remaining largest area is in northeast Arkansas and includes
the fringes of the areas affected in 2008 mentioned in the opening. Weak and moderate tornadoes are
also responsible for 18 fatalities, or about 2 fatalities per 1000 square miles in this area. The area in
southwest Georgia was chosen because it actually has a higher density of fatalities in weak/moderate
tornadoes (5, or about 3 per 1000 square miles) and it is in an area not usually synonymous with
tornadoes. The large Nebraska area has only 2 fatalities, and Iowa 1, while the Kansas‐Oklahoma area,
the Texas area, the Illinois area have no fatalities despite the high numbers of tornadoes. It would seem
that the ‘traditional’ Tornado Alley folks are better prepared to deal with tornadoes for whatever
reason. Perhaps it is simply that tornadoes are easier to see and avoid in the Plains states, as all of these
areas are actually local ‘tornado alleys’ whether in the ‘traditional’ area or not. In fact, the term
“Tornado Alley” may simply be misused simply because most dramatic pictures of tornadoes are from
Texas, Kansas, and Oklahoma; a high‐tornado‐density area is an alley regardless.
Using Zonal Statistics, I calculated the mean density in the Arkansas area to be .164 (164 mi2
affected/per 1000 mi2; the high is .23, the highest in the U.S. (shared only with a small corner of
northeast Louisiana in one of the non‐analyzed regions). The area with the second highest density is
Nebraska, with a mean of .2. The other states had densities of.16 and .17. We would expect that the
Arkansas area would display more difference in the variable being tested (surface roughness, land cover,
soil moisture regime, etc.) than would other areas should the hypothesis that surface factors enhance
tornadogenesis be correct.
In order to operationalize ‘roughness,’ I first used USGS’s Seamless Data Distribution site to
obtain National Elevation Datasets for the areas both inside the maximum path density contours (those
two standard deviations above mean density or above) and in a 50‐km buffer around these areas. This
arrangement should allow the visualization and statistical testing of not only the core high weak/
7
moderate tornado path density areas, but also their surroundings to assess what differences may exist. I
then used Spatial Analyst to calculate the slope for each region. To create ‘roughness’ I used the
neighborhood analyst to create a layer based on standard deviation from the mean slope—those areas
with high standard deviations are much rougher than are surrounding areas. These layers were then
analyzed using Zonal Statistics to calculate the mean underlying topographic characteristics along the
paths, the mean within the high area, and the mean within the 50‐km buffer. Should no differences
between the buffer and the maximum exist, the hypothesis that some change in topography near the
high density areas is responsible for the high numbers of tornadoes will be nullified. The results are
presented in Table 1.
Table 1: Mean Roughness in High/Low Density Tornado Path Areas and Along Paths
Arkansas Georgia Nebraska KS‐OK Border Iowa Texas Illinois OH Low MO Low Tenn Low GA Low
Mean path density 0.164 0.145 0.16 0.14 0.14 0.15 0.15
Highest path density 0.23 0.16 0.2 0.16 0.16 0.17 0.17
While ‘nothing’ is a legitimate finding in a study, as my students are always told, it was disappointing to
find no statistically important similarities between the high areas, and little difference between the high
and low areas. The high areas display a high range in roughness (Arkansas) to nearly flat (Texas) and
tornado‐prone areas are both rougher and smoother than their surroundings. Interestingly, they often
are one or the other. For example, visually Arkansas’ mean, the same as Iowa’s, is quite deceptive, as
half of the high‐density area is quite rough and the other quite flat (Figure 3), a fact that shows in the
range within the high area in Table 1. This fact spells out why GIS visualizations are vitally important to a
study such as this. Figure 3 also shows the use of ArcToolbox’s Spatial Statistics, which was used to
8
produce the mean direction and path length of the tornado paths in the high areas (those that
intersected the contour line), as well as the mean direction of streams in a 100‐km radius of the study
area (National Atlas data). The Arkansas high‐density area’s mean direction of path and centroid lies
along the juxtaposition of the Mississippi Embayment physiographic region and the Ozark plateau. The
Ozark area is quite rough; in fact, even the mean path roughness is equal to or rougher than three of the
four lowest density weak/moderate tornado areas. Areas of rough terrain have long
Figure 3: Arkansas mean roughness, direction of paths, and direction of streams.
been thought to inhibit all but the strongest tornadoes; this is certainly not the case in Arkansas. As
noted, this area has one of two highest weak/moderate tornado densities in the country, meaning the
proximity to a sudden uplift that runs parallel to the direction of storm movement would seem to be of
great interest. The mean direction of travel of tornadoes is also clearly nearly perpendicular (difference
9
is 95.4°) to the direction of stream valleys, lending some support to river‐valley enhancement of shear. It
is important to point out, however, that the river valley alignment should not be thought of as a
definitive predictor; in almost all other areas, including low density areas, tornadoes and their parent
storms appear to move in a perpendicular direction relative to river valleys. More interesting is that
several areas have other abrupt changes in elevation/slope/roughness that lie immediately before or
after the high‐density area, as shown in Figure 4.
Figure 4: Comparison of four high‐density regions with increased roughness in the direction of mean storm travel (before or after path density max).
Generally, the mean direction of streams (National Atlas website) within each high‐density area
were perpendicular to the mean direction of tornado travel. This, however interesting I would like it to
be, is also rather mundane in that a tornado traveling parallel to a river valley is not likely to cross it!
10
However, the fact that many of these areas contain rivers that lie at either the beginning or end of the
high‐density areas is certainly of interest (Figure 4).
Figure 5: Kansas/Oklahoma and Georgia study areas: roughness, elevation, and slope change
The area in Texas is the most uniform of all; it is relatively flat (and also of the same soil drainage
and predominant land cover type), and has little roughness at all, and certainly no difference between
the buffer and high area. The only item of interest in this region is the sudden drop‐off visible in Figure 4
just to the northeast of the high‐density area; there could be enhanced uplift over this area flowing into
storms entering the area. The southeast Iowa area also ends with a broad area of rougher terrain;
tornadic storms also cross two major rivers entering this area (the Des Moines and Iowa Rivers). Most of
the tornadoes in the area form in an area of low roughness relative to the surroundings, but less so than
other areas. The Nebraska/Kansas border area lies mostly in a relatively flat area in the Platte River
11
valley surrounded by areas of increased roughness, especially to the northwest, but also to the
northeast of the high area. In Southwest Georgia, an area not normally thought of as any type of
tornado alley, many long‐track weak/moderate tornadoes occur in an area of an abrupt rise, relatively
rougher than its surroundings (Figure 5; the rise is easier to see on the Elevation map) and the high area
ends with another drop off to the northeast. Thus, areas with abrupt changes in roughness or elevation
to the northeast of storm travel may be key in tornadogenesis and also the end of many paths; in each
case, almost all paths end before the roughness begins. Even in Arkansas, Crowley’s Ridge, an abrupt
rise from the flat Mississippi Embayment, lies to the northeast of the high area (Figure 3).
The entire eastern border of the Kansas/Oklahoma border high‐density area is an area of
relatively low slope and roughness, and like Arkansas, is juxtaposed with a higher, rougher area along its
length. In keeping with the others (although not quite as directly to the northeast of mean path travel),
most paths end at or just before this rough, elevated area. The Arkansas River valley also bisects the
high area from northwest to southeast, nearly perpendicular to the direction of travel of most
tornadoes, and many of the paths either begin or end here.
In conclusion, while there are few measurable similarities within the high regions or their
surrounding 50‐km buffers, a visual inspection shows many of the areas have a change of
roughness/elevation/slope adjacent, usually perpendicular to direction of storm travel.
Comparison with Areas Below Mean Path Density
Although there is not much to be said about the ‘model’ high‐density area, there are some
small differences with areas that are low density. Specifically, I looked at not only roughness, but soil
and land cover in areas of below‐mean density (< .035 per mi2) that were near areas of high density
(Georgia, Texas, and Missouri just north of the Arkansas high‐density area) or surrounded by at least
average numbers of weak and moderate tornadoes (Tennessee and Ohio). The area in Tennessee is in
fact adjacent to an area that has been struck repeatedly in the last few years by stronger tornadoes, but
12
is a local minima for weaker tornadoes, which may be related to the effect of topography on weaker
storms that does not similarly affect violent tornadoes. In general, Table 1 shows these areas are
rougher than are the high areas, with the exception of Ohio (Texas was not included in the roughness
study). Both the mean roughness and range are higher in the Missouri and Tennessee low‐density areas,
and the Georgia low area is rougher than all of the higher areas except for Arkansas, which seems to be
an anomaly of sorts, yet, as it has the highest density of tornadoes in the country, may point to a
possibility that there is not any way to predict tornadoes by using surface characteristics. In fact, the
low‐density area of Ohio, also anomalous among the minima, adds frustrating fuel to the fire, as will be
shown in the next few pages.
Land Use/Land Cover
The Arkansas land use/land cover data obtained from the State of Arkansas’ Geostor site is
relevant for the time of year that tornadoes form most in the state (Spring, March of 2004). It depicts a
marked change from forested and pasture (upland) land cover to, at the time of year it was created,
fallow cropland (Figure 6). While this is an interesting change in cover, it is not clear whether the land
cover change or the elevation/roughness change is responsible for the high density of tornado paths in
the area, or the position of Crowley’s Ridge upwind from the direction of storm travel which may
enhance inflow. This is a problem for many of these areas, as a change in elevation and/or slope almost
always is accompanied by a change in land cover and/or soil type; it could be that it is a combination of
factors that enhances incidence of tornadoes. Like Arkansas, the eastern Kansas/Oklahoma density
maximum’s border is delimited by an abrupt shift from predominantly crop to grass/range, reflecting its
shift in slope/elevation. The Texas Panhandle region is predominantly crop and grassland/range/ shrub,
with a shift from more grassland to nearly solid crop about midway across the high area. The other four
areas are fairly uniform within and nearby.
13
Figure 6: Land Use/Land Cover comparison among high‐density areas.
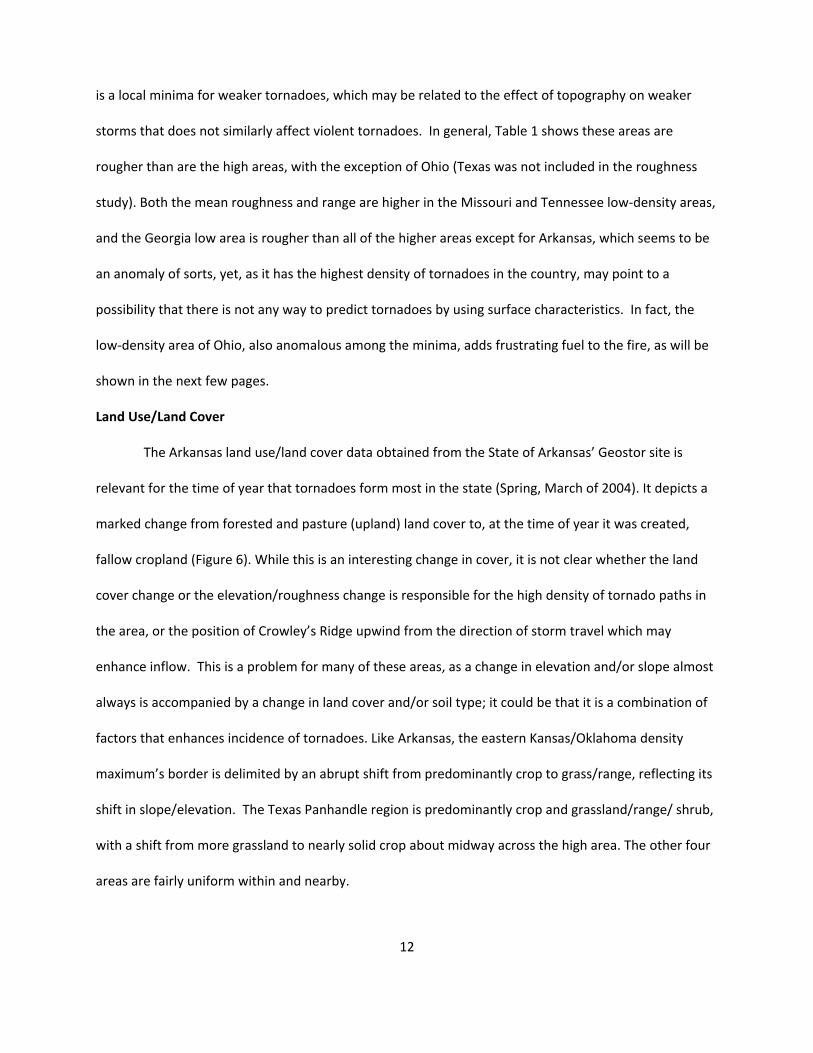
When comparing Georgia’s high and low tornado density areas (Figure 7), I used the raster
calculator and Analysis Extent to determine that the high area contains 40 percent less forest than does
the low area. Texas’s high and low land cover regions are very different; again we are seeing far less
forest (33% less), as well as less shrub (17%) in the high area. Missouri, as compared with both Arkansas
and nearby Southwest Illinois, is problematic due to the fact that the data selected for Arkansas has
fallow fields rather than being labeled ‘crop’. I would redo this work in the future, but in reality, it is
likely that in many parts of the country during tornado season crops may not yet be planted or may be
in various stages of growth that would preclude direct comparison. Illinois, like the other two
comparisons, has far less forest (‐31%) and far more crop (+23%) than the Missouri low area. However,
14
Figure 7: Comparison of land cover in regions where high and low tornado density are spatially near one another.
what is different from the other findings is that the Missouri low and Arkansas high have almost the
same percentage of forested land. Again, Arkansas comes up as the anomaly.
Tennessee’s low area is 72 percent forest as well; on the other hand, Ohio’s low area is not only
more urban than any other area so a lack of reporting is certainly not the issue, but is 80% crop and/or
grass and pasture. The fact remains, however, that there is considerable evidence, both here and in past
studies (Passe‐Smith 2004 and 2005) that areas of low tornado density are often forested. Whether this
15
reflects an inability to see tornadoes, a lack of human occupancy, or a true surface variable, it is a fairly
good predictor of low tornado areas.
Soil
The last variable to be considered is soil; I chose to look at the drainage characteristics of soil, as
it is soil moisture that likely could play a role in enhancing storms moving over an area, along with the
likely hundreds of other variables contributing to a tornado’s birth. As seen in Figure 8, at the
Nebraska/Kansas border, the high area is about 50/50 Well‐ and Moderately‐Well‐Drained soils; most
tornadoes seem to be generated near areas of change (well‐drained to poorly‐drained in the Platte River
area, and at the juxtaposition of well‐ and moderately‐well‐drained soils). Iowa is definitely centered
around a boundary between well and moderately well drained soils, as is the Oklahoma/Kansas region;
however, the bulk of tornadoes in Oklahoma/Kansas form over consistently well‐drained soils. Arkansas,
again, is at a region of extreme changes; for soil, the change is from well‐ and moderately‐well‐drained
to poorly drained soils of the flat Mississippi Embayment. There is not much consistency here; some
changes are from moister‐to‐drier soils, while others are the opposite. Texas is 100% well‐drained; soil
type is definitely not a factor (thus not included in figure). Georgia (Figure 9) is predominantly well‐
drained, but interspersed regularly with poorly drained river valleys which run perpendicular to the
mean of tornado paths; Illinois is primarily poorly drained , but moving off of an area of well‐drained
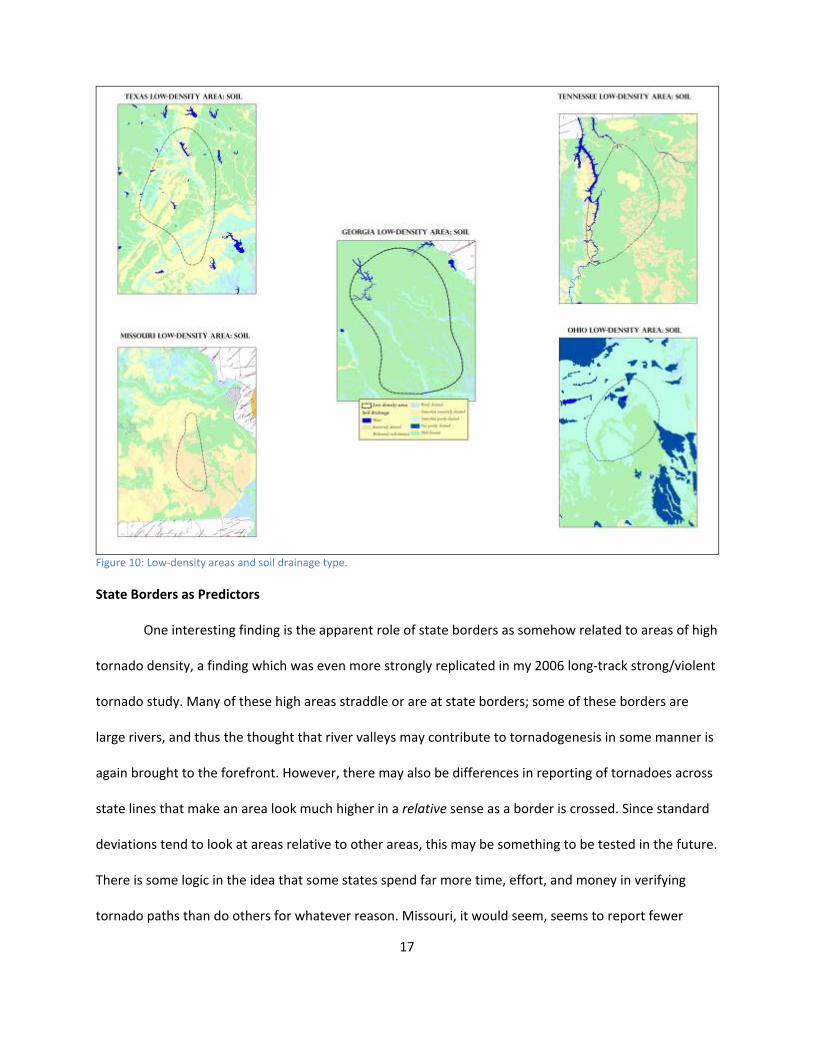
soils. Those areas of low tornado density run the gamut (Figure 10) from predominantly well‐drained
(Georgia) to half poorly drained (Ohio) to a little of everything (Texas). Certainly there is nothing
consistent to model here.
16
Figure 8: Four path density maximum areas with marked changes in soil drainage type within boundaries.
Figure 9: Two high density areas with small changes in soil drainage type (Texas not shown; no change found across study area).
17
Figure 10: Low‐density areas and soil drainage type.
State Borders as Predictors
One interesting finding is the apparent role of state borders as somehow related to areas of high
tornado density, a finding which was even more strongly replicated in my 2006 long‐track strong/violent
tornado study. Many of these high areas straddle or are at state borders; some of these borders are
large rivers, and thus the thought that river valleys may contribute to tornadogenesis in some manner is
again brought to the forefront. However, there may also be differences in reporting of tornadoes across
state lines that make an area look much higher in a relative sense as a border is crossed. Since standard
deviations tend to look at areas relative to other areas, this may be something to be tested in the future.
There is some logic in the idea that some states spend far more time, effort, and money in verifying
tornado paths than do others for whatever reason. Missouri, it would seem, seems to report fewer
18
tornadoes in general—that could explain why so many of the high‐density areas ring Missouri! Missouri
also, of course, might simply be an area with minimal tornado action due to the Ozark uplands.
Conclusions
There are many interesting visualizations contained in this study—which contradict to a small
extent the statistical data, yet still lead to a conclusion that little consistency exists across areas of high
or low tornado density. The most interesting study to be done to follow up the current one would be a
survey of reporting techniques in all of the states between the Atlantic and Rocky Mountains to
determine if there is any difference there causing the result of proximity to borders. It might be that
Missouri is indeed far more careful in technique; no double reports ever make it to the National Climatic
Data Center; on the other side of the coin, perhaps some of the offices do not verify at all. National
Weather Service forecast areas cross state lines; it would be interesting to see how many tornadoes are
reported in areas outside of the home state of those verifying. There is some weak—and I stress the
term weak—evidence that rather abrupt changes in elevation, slope, or roughness contained within the
high density maxima enhance tornadogenesis, at least for weak and moderate tornadoes, and larger
river valleys perpendicular to the general direction of parent storm movement may also contribute, but
certainly there is nothing consistent enough upon which to build a model. Operationalization of these
variables would also be difficult, consisting of very large elevation datasets that are at this time beyond
my current computing capabilities and time constraints, but certainly might be considered in the future.
19
References
Bosart, L., K. LaPenta, A. Seimon, and M. Dickinson. 2004. Terrain‐Influenced tornadogenesis in the Northeastern United States: An examination of the 29 May 1995 Great Barrington, Massachusetts, tornado. Preprints, 22nd Conference on Severe Local Storms, American Meteorological Society, 4‐8 October, 2004, Hyannis, MA. Last referenced online July 10, 2008 at http://ams.confex.com/ams/pdfpapers/81734.pdf.
Esau, I.N. and Lyons, T.J. 2002. Effect of sharp vegetation boundary on the convective atmospheric boundary layer. Agricultural and Forest Meteorology 114: 3‐13.
Passe‐Smith, M.S. 2006. Exploring Local Tornado Alleys for Predictive Environmental Parameters. Proceedings of the 2006 ESRI International Users Conference. Online publication, http://gis.esri.com/library/userconf/proc06/papers/papers/pap_1339.pdf.
‐‐‐‐‐‐‐‐‐. 2005. Test‐driving a tornado likelihood model. Proceedings of the 2005 ESRI International Users Conference. Online publication, http://gis.esri.com/library/userconf/proc04/docs/pap1062.pdf.
‐‐‐‐‐‐‐‐‐‐‐. 2004. Modeling the tornado threat in Arkansas with GIS. Proceedings of the 2004 ESRI International Users Conference. Online publication, http://gis.esri.com/library/userconf/proc05/papers/pap1185.pdf.
Peckham, S.E. and R.B. Wilhelmson, L.J. Wicker, and C.L. Ziegler. 2004. Numerical simulation of the interaction between the dryline and horizontal convective rolls. Monthly Weather Review, 132, No. 7, pp. 1792‐1812.
Raddatz, R.L. and Cummine, J.D. 2003. Interannual variability of moisture flux from the prairie agro‐ecosystem: Impact of crop phenology on the seasonal pattern of tornado days. Boundary‐Layer Meteorology 106:283‐95.
Weaver, C.P. and R. Avissar. 2001. Atmospheric disturbance caused by human modification of the landscape. Bulletin of the American Meteorological Society 82, No. 2, pp. 269‐77.
Data sources (all last accessed in July 2008)
Soil: all states from Soil Data Mart Natural Resources Conservation Service at
Land Use/Land Cover: GAP analysis site at http://gapanalysis.nbii.gov/portal/community/GAP_Analysis_Program/Communities/Maps,_Data,_&_Reports/Find_GAP_Data/ for Kansas, Tennessee, Oklahoma, and Texas
20
USGS National Map Seamless Server (http://seamless.usgs.gov/): Iowa, Illinois, Ohio (would have done all but site was not available for several days).
State of Arkansas GeoStor GIS data server (http://www.geostor.arkansas.gov/Portal/index.jsp) : Spring 2004 image of land cover
ArcToolbox (Projections and Transformations, Raster mosaic, Spatial Statistics – mean direction)
21
Author Information: Mary Sue Passe‐Smith Lecturer Department of Geography University of Central Arkansas 201 Donaghey Avenue Conway, AR 72035 (501) 450‐3280 (Office phone) (501) 450‐ 5185 (Fax) E‐mail [email protected]