24
Lakshan De Silva [email protected] Effective Commercial Lines Underwriting using Big Data and Risk Analytics
| Date post: | 07-Jan-2017 |
| Category: |
Economy & Finance |
| Upload: | intellectseec |
| View: | 134 times |
| Download: | 0 times |
Lakshan De [email protected]
Effective Commercial Lines Underwriting using Big Data and Risk Analytics

WHO IS THE WRITER? WHERE IS THE DATA FROM?What is so unusual about this?CLUE: Is it not in the content
2

A quality first quarter earnings announcement could push shares of H.J. Heinz (HNZ) to a new 52-week high as the price is just 49 cents off the milestone heading into the company’s earnings release on Wednesday, August 29, 2012.
The Wall Street consensus is 80 cents per share, up 2.6% from a year ago when H.J reported earnings of 78 cents per share.
The consensus estimate remains unchanged over the past month, but it has decreased from three months ago when it was 82 cents. Analysts are expecting earnings of $3.52 per share for the fiscal year. Analysts project revenue to fall 0.3% year-over-year to $2.84 billion for the quarter, after being $2.85 billion a year ago. For the year, revenue is projected to roll in at $11.82 billion.
The company has seen steady earnings for the last eight quarters, but income has been sliding year-over-year by an average of 7.3% over the last four quarters. The biggest drop came in the most recent quarter, when profit dipped by 21.7%.
Most analysts think investors should stand pat on H.J, with eight of 16 analysts rating it hold. Analysts have grown increasingly optimistic about the stock in the last three months. The stock price has increased from $53.59 on May 29, 2012 to $55.51 over the past quarter.
"
"Source: http://www.forbes.com/sites/narrativescience/2012/08/24/forbes-earnings-preview-h-j-heinz-3/ 3
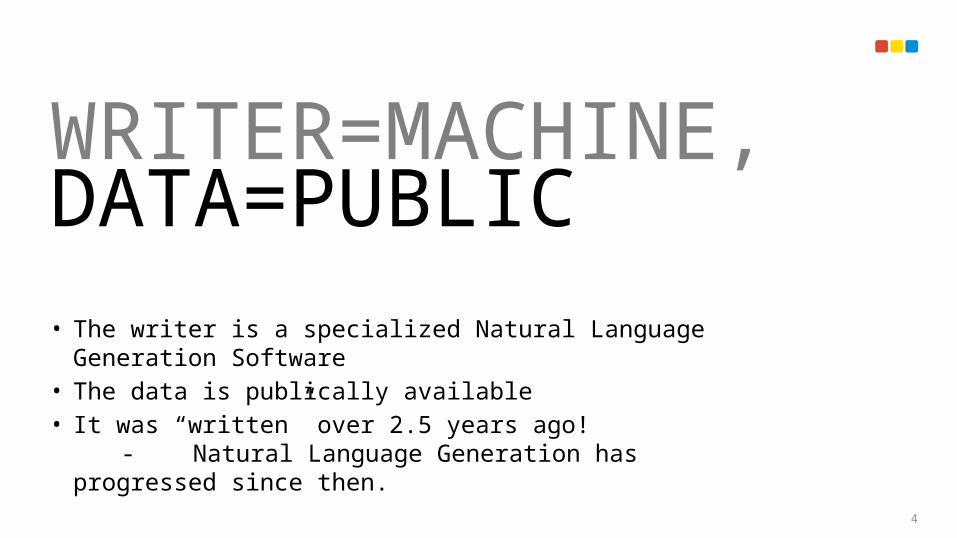
WRITER=MACHINE, DATA=PUBLIC• The writer is a specialized Natural Language Generation Software• The data is publically available• It was “written” over 2.5 years ago!
- Natural Language Generation has progressed since then.
4
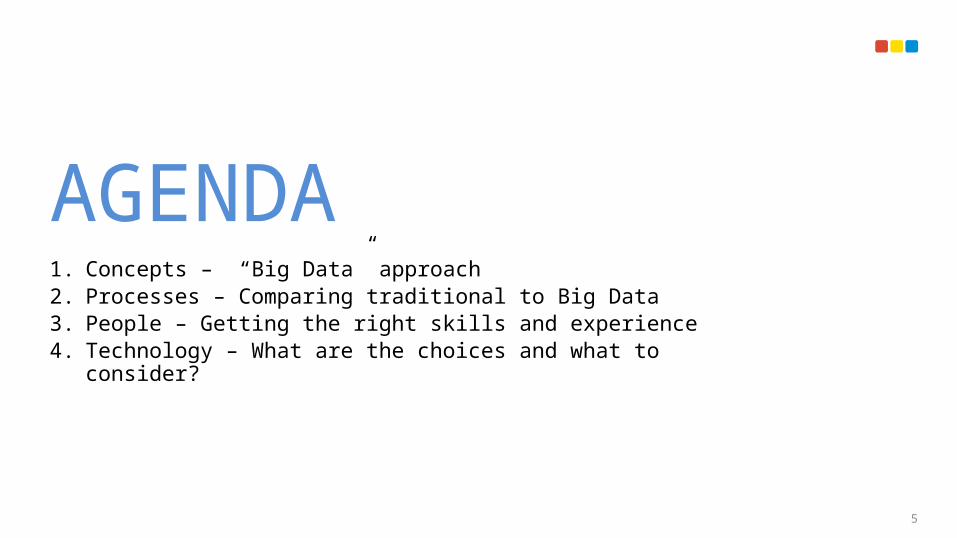
AGENDA1. Concepts – “Big Data” approach2. Processes – Comparing traditional to Big Data3. People – Getting the right skills and experience4. Technology – What are the choices and what to consider?
5
BIG DATA REQUIRES RETHINKING YOUR APPROACH TO DATA6
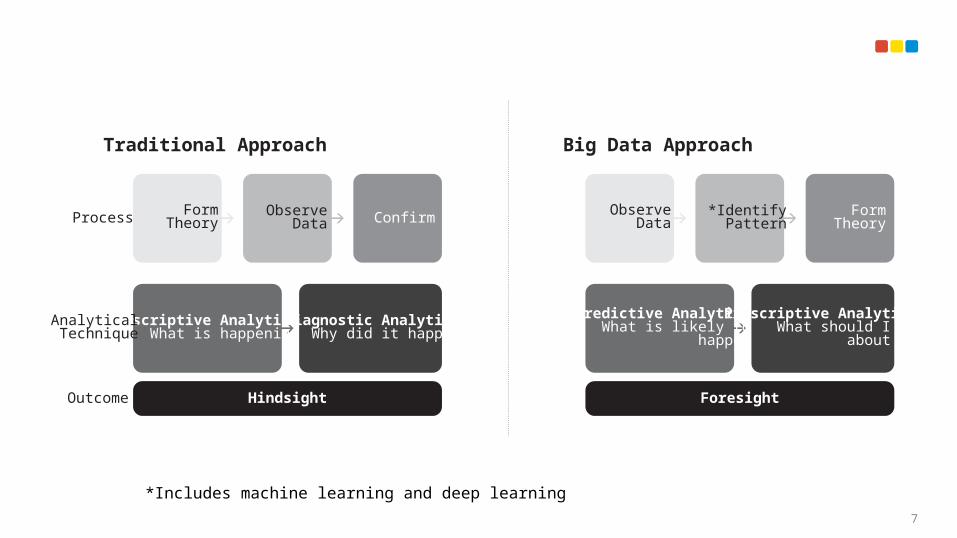
*Includes machine learning and deep learning
Descriptive AnalyticsWhat is happening
Confirm
Hindsight
AnalyticalTechnique
Outcome
Process
Traditional Approach
FormTheory
ObserveData
Diagnostic AnalyticsWhy did it happen
Predictive AnalyticsWhat is likely to
happen
FormTheory
Foresight
Big Data Approach
ObserveData
*IdentifyPattern
Prescriptive AnalyticsWhat should I do
about it
7
BIG DATA APPROACH IS ADDITIVE TO TRADITIONAL APPROACHES8

Traditional Approach Big Data Approach
Volume Fewer sources – just store everything we need to make the decisions of today
Large number of sources – store everything for the questions and decisions you are yet to think of
Velocity Managed changes done infrequently Changes done constantly – crowd sourced
Variety Structured – internal/external Structured – internal/external, Unstructured – external
Veracity Source Level – e.g. this is the “source of truth” for FTE, perils, crime etc.
Data Level – e.g. number of sources of FTE data with certainty scores for each
Feedback Manual cleansing from fewer people – scholarly “encyclopedia approach”
Crowd sourced or via machine learning algorithms – “Wikipedia Approach”
Visualizing Graphs, tables, one way reports Alerts, graphs, interactive applications
ExamplesPolicies, Quote, Claims, Billing RiskMeter, D&B, Pitney Bowes, Lexis Nexis, Verisk
All of traditional data + LinkedIn company profile, Facebook, Twitter, Yahoo BOSS, Google Search, Urbanspoon, Yelp, Glassdoor
9

FASTER. AUDITABLE. WITH THE ABILITYTO LEARN FROM YOU10
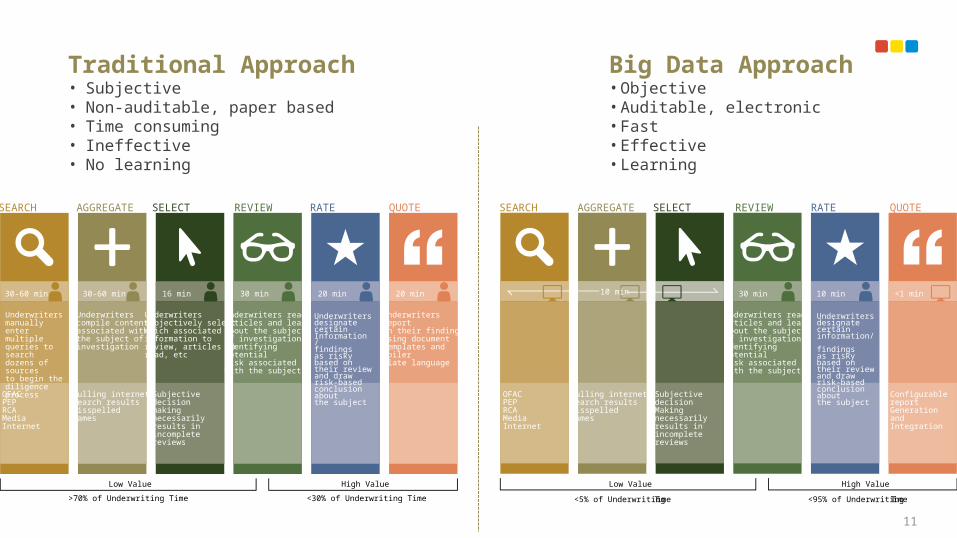
Traditional Approach• Subjective• Non-auditable, paper based• Time consuming• Ineffective• No learning
Big Data Approach• Objective• Auditable, electronic• Fast• Effective• Learning
Underwritersmanually entermultiple queries to search dozens of sourcesto begin thediligence process
30-60 min 30-60 min 16 min 30 min 20 min 20 min
OFACPEPRCAMediaInternet
SEARCH AGGREGATE SELECT REVIEW RATE QUOTE
Low Value High Value
Underwriterscompile contentassociated withthe subject ofinvestigation
Underwriterssubjectively selectwhich associatedinformation toreview, articles toread, etc
Underwriters readarticles and learnabout the subject of investigation,Identifyingpotentialrisk associatedwith the subject
Underwritersdesignate certainInformation / findingsas risky based on their reviewand drawrisk-basedconclusion aboutthe subject
Underwritersreporton their findingsusing documenttemplates andboilerplate language
Culling internetsearch resultsMisspellednames
Subjective decisionmaking necessarilyresults inincompletereviews
>70% of Underwriting Time <30% of Underwriting Time
30 min 10 min <1 min
<5% of UnderwritingTime <95% of UnderwritingTime
10 min
SEARCH AGGREGATE SELECT REVIEW RATE QUOTE
Underwritersdesignate certaininformation/ findingsas risky based on their review and drawrisk-basedconclusion aboutthe subject
Underwriters readarticles and learnabout the subject of investigation,identifying potentialrisk associatedwith the subject
OFACPEPRCAMediaInternet
Culling internetsearch resultsMisspellednames
SubjectivedecisionMakingnecessarilyresults inincompletereviews
Low Value High Value
ConfigurablereportGenerationandIntegration
11

TURNING UNDERWRITING TO BE BOTH DEDUCTIVE + INDUCTIVE Underwriters usually do not have the time or do not see value in re-checking assumptions
12
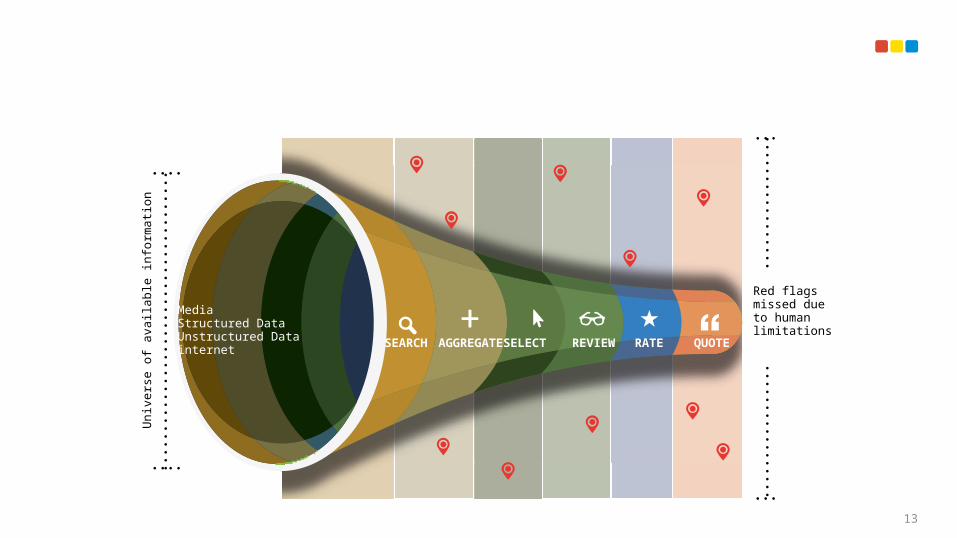
SEARCH AGGREGATE SELECT REVIEW RATE QUOTE
MediaStructured DataUnstructured Datainternet
Univ
erse
of a
vaila
ble
info
rmati
on
Red flagsmissed dueto humanlimitations
13

SUPPLEMENTING TRADITIONAL QUESTIONS WITH SCIENTIFIC QUESTIONS14
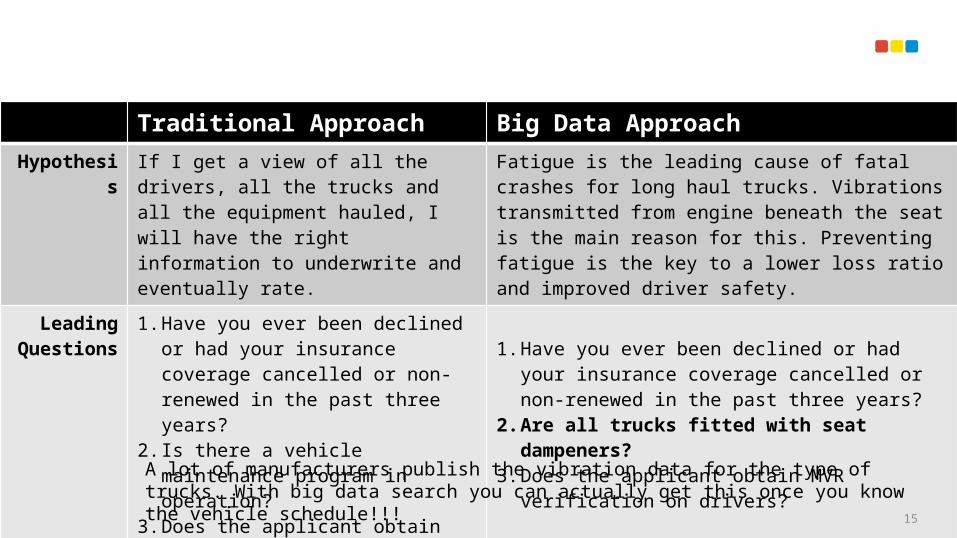
Traditional Approach Big Data ApproachHypothesis If I get a view of all the drivers, all the trucks
and all the equipment hauled, I will have the right information to underwrite and eventually rate.
Fatigue is the leading cause of fatal crashes for long haul trucks. Vibrations transmitted from engine beneath the seat is the main reason for this. Preventing fatigue is the key to a lower loss ratio and improved driver safety.
Leading Questions
1. Have you ever been declined or had your insurance coverage cancelled or non-renewed in the past three years?
2. Is there a vehicle maintenance program in operation?
3. Does the applicant obtain MVR?
1. Have you ever been declined or had your insurance coverage cancelled or non-renewed in the past three years?
2. Are all trucks fitted with seat dampeners?3. Does the applicant obtain MVR verification on drivers?
Outcomes Dismiss good risk and missed chance to institute loss prevention programs
Uncover good risk and drive good risk management within clients
A lot of manufacturers publish the vibration data for the type of trucks. With big data search you can actually get this once you know the vehicle schedule!!!
15

LOOKTO OTHER INDUSTRIESTO FINDTHE RIGHT SKILLS16

Traditional Approach Big Data ApproachSkills Actuarial, Business Analysis, Accounting,
Defining Data, Defining Data RelationshipsNatural Language Processing, Artificial Intelligence, Software Engineering, Search, Experimenting with Data
Experience Common to find with 10+ years in insurance Rare to find professional with more than 3 years of experience
17
BI / EDW Professional Data Scientist

BIG DATA TOOLS ARE MATURING - THE TIME IS RIGHT TO EXPERIMENTTools that were traditionally IT related are now available to mainstream business users – remember making webpage used to be an IT job!
18

Traditional Approach Big Data ApproachStatistical Packages
R, Julia, Matlab Is your team based on a statistical background or IT/data science background?
Databases Hbase, Cassandra, MongoDB,Google BigTable
Are you looking at transaction (Billing) vs. documents (Underwriting)
Do you want it real time? Do want it in-premise or in the cloud? Do you want to pay licenses or maintenance?
Languages* Pig, Hive Is your team familiar with SQL (working with databases) or writing procedural (Excel Macros)?
Visualization Pentaho, Tableau, Google Do want it in-premise or in the Cloud? Do you have a insurance DWH? How structured is your data? Do you want to geo-overlays?
* Assume Hadoop/ HDFS has been installed19
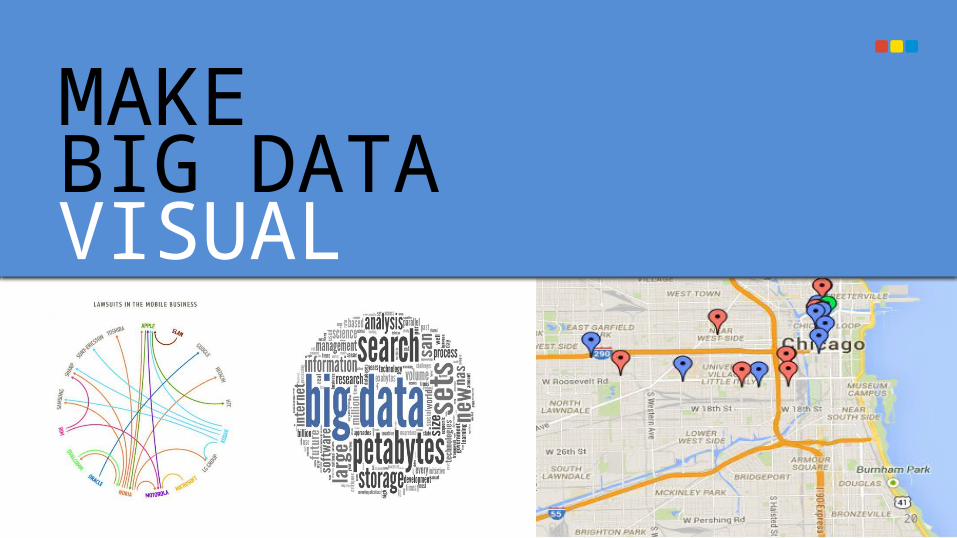
MAKEBIG DATAVISUAL
20
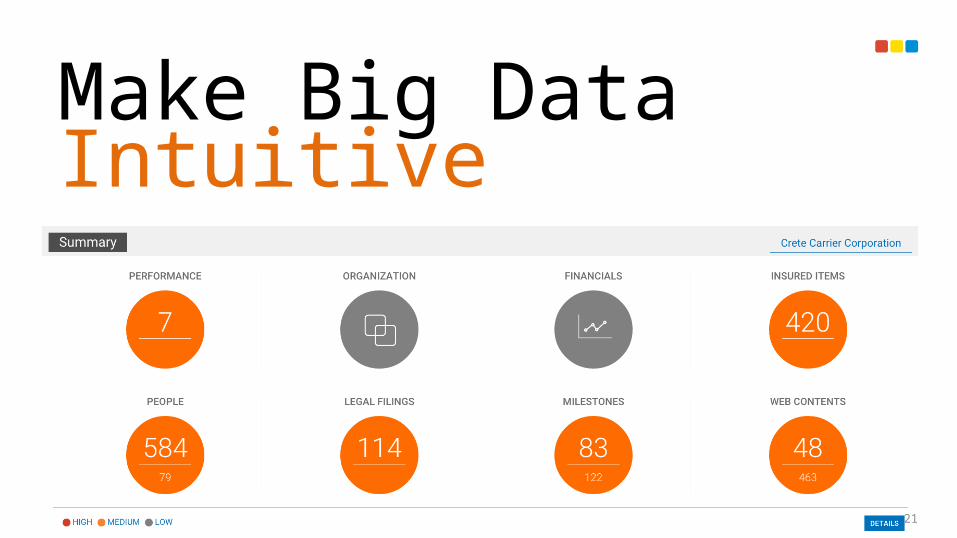
Make Big Data Intuitive
21

KEYLEARNINGS• Big Data means re-thinking your approach to data processing
- You may only know about a part of the problem you will solve up front
- The data may show additional problems and answers• Re-look at how and when data is used in the underwriting process
- With Big Data tools you can speed up and uncover additional risks• Are you asking the right underwriting questions?
- Ask less and more pertinent questions and pre-fill information
• Look outside of insurance to build your Big Data team• The technology is evolving rapidly – start experimenting early before
the competition gets far too ahead 22
© 2015, Intellect Design Arena Limited.All rights reserved. These materials are confidential and proprietary to Intellect and no part of these materials should be reproduced, published in any form by any means, electronic or mechanical including photocopy or any information storage or retrieval system nor should the materials be disclosed to third parties without the express written authorization of Intellect Design Arena Limited.

© 2015, Intellect Design Arena Limited.All rights reserved. These materials are confidential and proprietary to Intellect and no part of these materials should be reproduced, published in any form by any means, electronic or mechanical including photocopy or any information storage or retrieval system nor should the materials be disclosed to third parties without the express written authorization of Intellect Design Arena Limited.


