Effective Crowd Anomaly Detection Through
Spatio-temporal Texture Analysis
Yu Hao 1,2 Zhi-Jie Xu 2 Ying Liu 1 Jing Wang 3 Jiu-Lun Fan 1
1 School of Computer Science and Technology, Xi′an University of Posts and Telecommunications, Xi′an 710121, China
2 School of Computing and Engineering, University of Huddersfield, Huddersfield HD1 3DH, UK
3 Faculty of Arts Computing Engineering and Sciences, Sheffield Hallam University, Sheffield S1 1WB, UK
Abstract: Abnormal crowd behaviors in high density situations can pose great danger to public safety. Despite the extensive installa-tion of closed-circuit television (CCTV) cameras, it is still difficult to achieve real-time alerts and automated responses from current sys-tems. Two major breakthroughs have been reported in this research. Firstly, a spatial-temporal texture extraction algorithm is de-veloped. This algorithm is able to effectively extract video textures with abundant crowd motion details. It is through adopting Gabor-filtered textures with the highest information entropy values. Secondly, a novel scheme for defining crowd motion patterns (signatures)is devised to identify abnormal behaviors in the crowd by employing an enhanced gray level co-occurrence matrix model. In the experi-ments, various classic classifiers are utilized to benchmark the performance of the proposed method. The results obtained exhibit detec-tion and accuracy rates which are, overall, superior to other techniques.
Keywords: Crowd behavior, spatial-temporal texture, gray level co-occurrence matrix, information entropy.
1 Introduction
Closed-circuit television (CCTV) cameras are widely
installed in city centers, along main roads and highways,
fixed and/or moving locations inside stadiums, concert
halls, shopping malls, and other key installations for en-
suring public welfare and safety. The live video feeds are
often sent to various control centers for processing and
storage. If the monitored crowds exhibit unusual behavi-
oral (motion) patterns, immediate actions can be taken in
response, to avoid potential damage or even casualties.
For example, when the population density of a crowd in a
public event is rapidly increasing and reaching a threshold,
measures might need to be taken quickly to avoid a stam-
pede; or, when people in a tightly packed tube station
suddenly disperse and run away, an alarm needs to be
immediately triggered in the control room. However, the
main operational mode today in many countries still re-
lies on human operators to constantly monitor live video
streams from multiple sources. This is often in the form
of a multi-screen monitor wall, which is a tedious job that
easily leads to fatigue, slow-response or even oversight,
not to mention the cost of staffing. The primary goal of
this research is to design an automatic detection system
which could alert human operators to the occurrence of
abnormal crowd events, or even predict them.
Many approaches have been proposed for designing
crowd behavioral analysis algorithms over the last two
decades[1–7]. The main objectives of analyzing crowd beha-
viors focus on two topics: global scale (or macroscopic)
analysis, local scale (or microscopic) analysis. In global
scale analysis, the crowd of similar motions is treated as a
single entity. Its main goal is to recognize the dominant
and/or anti-dominant patterns of this entity, without
concerning itself with any individual behaviors. For ex-
ample, the congestion or stampede scenarios are a conver-
gence of a crowd′s locomotion. The global scale analysis,
therefore, concentrates on the overall tendencies of the
critical mass rather than specific behavior such as wav-
ing or jumping. In local scale analysis, the detection of an
individual behavior, or more specifically, actions, among
other crowd entities becomes a focus, and poses a challen-
ging question, especially when crowd density is high. This
includes, e.g., occlusions that make the segmentation of a
particular individual a challenging task.
For global feature-based approaches, feature patterns
such as optical flow are often extracted from entire video
footage, and corresponding histograms are constructed. In
the bag of visual word (BoW) technique[8], histograms
with similar patterns are clustered to train a dictionary,
and then the crowd behavior in a testing video is classi-
fied with its histogram. Solmaz et al.[1] proposed an al-
gorithm to identify crowd behaviors based on optical flow
information. In their research, the optical flow method is
Research Article
Special Issue on Addressing Global Changlleges through Auto-mation and Computing
Manuscript received March 13, 2018; accepted June 6, 2018;published online September 27, 2018Recommended by Associate Editor Jie Zhang
© The Author(s) 2018
International Journal of Automation and Computing 16(1), February 2019, 27-39DOI: 10.1007/s11633-018-1141-z
reproduced and evaluated, and then optimization work is
carried out to introduce the particle angles as a new para-
meter for sorting and clustering the so-called regions of
interests (RoI) model. By investigating the signature val-
ues calculated from the Jacobian matrix of pixel values in
each RoI, different behavioral types can then be determ-
ined. Krausz and Bauckhage[2] followed a different route
in tackling the problem by computing the histograms of
the motion direction and magnitude extracted from the
optical flow through applying the non-negative matrix
factorization (NMF). The obtained histograms are then
readily clustered. The essence of the process relies on a
signature named as the symmetry value being calculated
on the averaged histograms to check if the current cluster
is in a congested state or otherwise. For local-feature-
based approaches, each individual is treated as a single
agent and its motion analyzed independently. One typic-
al approach is the social force model (SFM) proposed by
Helbing and Molnar[9]. The assumption of SFM is that
the behaviors of each agent in a crowd are determined by
multiple types of interaction forces. The extracted flow-
based feature is mapped to each agent according to the
rules of SFM to define individuals′ abnormal behaviors.
Yan et al.[10] proposed a technique using SFM to detect
sudden changes in crowd behavior. In this approach, the
interaction force in SFM is directly calculated from the
code stream to increase efficiency, then the BoW al-
gorithm is applied to generate histograms on intensity
and angles of interaction force flow. With the histograms
obtained, the crowd′s moving state can be distinguished
to detect the anomalies.
Despite the varied approaches mentioned above, the
common pitfall of them is the heavy time consumption of
calculating optical flow for every frame[11]. In order to
maintain the detection accuracy while keeping the work-
load as low as possible, spatio-temporal information is ex-
plored in this research, with the aim of developing a prac-
tical crowd anomaly detection and classification framework.
Spatio-temporal information is widely used for single
human action recognition, such as gesture, gait, and pose
estimation. Niyogi and Adelson[12] used spatio-temporal
texture (STT) to analyze human walking patterns, such
as gaits at the ankle level. In this research, the key pat-
terns of gaits were firstly defined as various braided
streaks extracted from STT, and then the rough estima-
tion of the walker′s pattern was refined using snakes
(modeled streaks) proposed by Kass et al.[13]. The walker′sbody was modeled by merging the Snake contours into
one before the general combinatory contour was classi-
fied using the predefined gait signatures. In Wang′s re-
search[14], dynamic events and actions were modeled and
represented by various geometrical and topological struc-
tures extracted from identified spatio-temporal volumes
(STV) in a scene. Similar to the individual′s behavior,
crowd behavior would also generate abundant motion
patterns in the spatio-temporal space. Hence, by extract-
ing the spatio-temporal information from regions-of-in-
terest (RoIs) in a crowd, background and irrelevant in-
formation can be culled thus saving precious computa-
tional time. In recent research by Van Gemeren[15], a nov-
el model is proposed to detect the interaction of two per-
sons in unsegmented videos using spatio-temporal localiz-
ation. In this research, the spatio-temporal information is
utilized to help model the person′s body pose and motion
in detailed coordination with designed part detectors. The
researcher claims to have obtained robust detection res-
ults when training on only small numbers of behavioral
sequences. Ji et al.[16] introduced an approach using the
combination of local spatio-temporal features and global
positional distribution information to extract 3-dimen-
sional (3D) scale-invariant feature transform (SIFT)
descriptors on detected points-of-interest. Then, the SVM
is applied to the descriptor for human action classifica-
tion and recognition.
An abstract pipeline of the crowd anomaly detection
framework proposed in this research is shown in Fig. 1.
Once the raw video data is acquired, the first phase of
the procedure is to perform the preprocessing operations,
including noise filtering and background subtraction. Ini-
tial steps for the construction of STVs from raw video
data also occur at this stage. In the second phase, main
crowd features and patterns are extracted from the
filtered data, where the features are modeled as
descriptors (or signature vectors) for the classification/re-
cognition purpose. In the third phase, extracted crowd
patterns are sorted using various machine-learning mod-
els such as classifiers and templates. Once the crowd be-
haviors are identified, the abnormal ones can be treated
as anomalies in further studies such as semantic analysis.
This paper is organized as follows: Section 2 intro-
duces a novel model for identifying and extracting spa-
tial-temporal textures (STT) from video footage.
Raw video dataprocessing
Featureextraction and
modeling
Crowdbehaviors
recognition
Detectedanomaly
Backgroundsubtraction
STVconstruction
Optical flow
Textures Templatematching
SVMHistograms
Fig. 1 A general structure of crowd abnormal behavior detection system
28 International Journal of Automation and Computing 16(1), February 2019
Section 3 defines a salient STT signature using a gray
level co-occurrence matrix for crowd anomaly labeling.
Section 4 presents the experimental results of using the
proposed gray level co-occurrence matrix (GLCM) signa-
ture on various classifiers. Section 5 concludes the paper.
2 Effective spatio-temporal textureextraction
Because automatic classification of crowd patterns in-
cludes abrupt and abnormal changes, a novel approach
for extracting motion “textures” from dynamic STV
blocks formulated by live video streams has been pro-
posed. This section starts by introducing the common ap-
proach for STT construction and corresponding spatio-
temporal texture extraction techniques. Next, the crowd
motion information contained within the random STT
slices is evaluated based on the information entropy the-
ory to cull the static background and noises occupying
most of the STV spaces. A preprocessing step using
Gabor filtering for improving the STT sampling effi-
ciency and motion fidelity has been devised and tested.
The technique has been applied on benchmarking video
databases for proof-of-concept and performance evalu-
ation. Preliminary results have shown encouraging out-
comes and promising potential for its real-world crowd
monitoring and control applications, detailed in Section 4.
2.1 STV-based motion encapsulation andSTT feature representation
STV is first proposed by Aldelson and Bergen[17].
Fig. 2 illustrates the STV construction process. The live
video signal is first digitized and stored as continuous and
evolving 3-dimensional (3D) STV blocks. The construc-
tion of a typical STV block from video can be described
as the stacking up of consecutive video frames to a fixed
time capsule (normally of a few seconds) that consists of
evenly spread grey-scale (for black-and-white video) or
colored (for color video) mini-cubes over the 3D space,
enclosed by the borders of the frame and the length (de-
cided by the STV length in seconds and the video frame
rate) along the time axis (Fig. 2(a)). Actually those cubes
are 2D pixels of each frame “stretched” into 3D voxels
(volumetric-pixels) filling up the STV block (Fig. 2(b)).
Compared to 2D frames, a STV block naturally encapsu-
lates dynamic information, such as object movements, as
well as static scene information in its structure. 2D neigh-
boring frame-based tracking techniques such as the optic-
al flow[18] study the consecutive frame pairs for gradual
object motions that work well for continuous human and
vehicle tracking. However, this technique has major draw-
backs when it comes to evaluating sudden changes, espe-
cially concerning a large group of fast moving objects
within a dense crowd. In order to further process the con-
structed STVs, slices of a STV called spatio-temporal tex-
tures (STTs) can be extracted to learn patterns recorded
in each texture, resembling the medical operations of 3D
ultrasonic scan or magnetic resonance imaging (MRI).
For example, Niyogi and Adelson[12] used STTs to ana-
lyze the gait (walking style) of individual pedestrian. In
Fig. 2(c), STV is sliced either horizontally or vertically at
certain position along time axis, to obtain STTs, and
Fig. 2(d) shows an example of extracted STTs describing
pedestrians′ motion through time.
STV and STT techniques have been widely studied in
the last two decades. Bolles et al.[19] used STV for geo-
metric and structure recovery from static scenes. Baker et
al.[20, 21] used STV for 3D scene segmentation. Ngo et
al.[22] used STT techniques for the detection of camera
cuts, wipes and dissolves in a video sequence. In this ap-
proach, a STT was analyzed by first convolving with the
first derivative Gaussian, and then processed using Gabor
decomposition, in which the real components of multiple
spatial-frequency channel envelopes were retrieved to
form the texture feature vector. A Markov energy-based
image segmentation algorithm was then used to locate
the color and texture discontinuities at region boundaries.
The approach was tested on different types of videos, in-
cluding news and movies. The results show sound per-
formance on “cut” detection with accuracy reaching 95%,
but only 64% for the “wipe” detection.
Because of the way a STV block is constructed and
the random nature of real-life events, the “useful” inform-
ation distributed over a STV space is usually uneven and
irregular. Thus, one important problem is how to obtain
the STT slices from a STV block with the highest inform-
ation density. Core to the challenge is how to differenti-
ate useful information such as voxels formed by crowd
movement from noise such as static background. In this
research, instead of an even cut and computation on all
STT slices from a STV block, an optimized technique is
developed to obtain the specific STT with rich motion in-
formation as shown in Fig. 3.
(a) Consecutive frames (b) Stacked frames toform spatio-temporal volume
(c) Vertical STV slice alongtime axis
(d) Obtained spatio-temporaltexture
Fig. 2 Procedures to obtain STV and STT from raw video data
Y. Hao et al. / Effective Crowd Anomaly Detection Through Spatio-temporal Texture Analysis 29
2.2 Implementation strategy
A typical pipeline of the crowd abnormality detecting
system contains three processing phases[23] as shown in
Fig. 1. In the first video data acquisition phase, the raw
video signals are collected and stored in suitable digital
formats. Then, static or dynamic features contained with-
in the information packets will be extracted; and at last,
predefined feature patterns describing signal-level, statist-
ical-level, and/or even semantic-level explanations of the
“video events” will be used to evaluate the similarity and
differences of the features extracted from the live
feeds[24–26].
In this research, at the STT extraction phase, an in-
formation entropy evaluation model has been devised to
help the sampling and selection of “meaningful” feature
containers before feeding them into the feature (crowd
patterns) extraction module. This design ensures the STT
that contains the most of the crowd dynamics will be se-
lected based on the magnitude and richness of motion
“trails” along the time axis in the continuously evolving
STV blocks. After that, motion features are extracted
from the selected STTs and are modeled into feature vec-
tors (signatures). In the last step of the devised frame-
work, the identified STT RoIs are classified according to
their motion signatures.
2.3 Information entropy-based STT selec-tion
Information entropy (also referred as Shannon en-
tropy) is proposed by Shannon[27]. It is a concept from in-
formation theory that calculates how much information
there is in an event. The information gain is a measure of
the probability of a certain result to occur[28]. Liang et
al.[29] proposed an approach to detect encoded malicious
web pages based on their information entropy counts.
Zhang et al.[30] used information entropy to detect mobile
payment anomaly through recursively training devised
entropy mechanism using verified data. The idea of in-
formation entropy could also be used as an index to
measure the informational value of the extracted STTs. If
a STT has higher entropy, it is likely to contain higher
motion and scene update information.
As illustrated in Fig. 2, multiple horizontal and vertic-
al cuts can be applied to a STV block for obtaining
STTs. All of the cuts are along the time axis. The
sampling density of the cuts is customizable and depends
on actual application scenarios. When the density is set
to a higher value, it can be predicted that the result
would be closer to optimal, yet the computational bur-
den will increase. In the third step of Fig. 2, once the
STTs are obtained, the information entropy is calculated
for each STT. The slice with the highest information en-
tropy will then be selected as the target STT for crowd
behavior analysis.
The information entropy can be expressed as (1).
H(X) = −n∑
i=1
P (xi)log2P (xi). (1)
n
xi
i P (xi)
i H(X)
In (1), represents the total number of different gray
scale levels in a STT, represents the amount of pixels
of the gray scale level in it, represents the probab-
ility of gray scale level in the STT, and is the cal-
culated information entropy.
Fig. 4 shows the calculated information entropy val-
ues of a group of extracted STTs from a single STV. The
STTs are displayed in descending order according to the
calculated entropies. It can be observed that STTs with
higher information entropy show abundant motion in-
formation as indicated by the ribbon-shape trajectories.
However, when directly applied to a test video data-
base as shown in Table 1, the immediate results do not
STVconstruction
STTextraction
Featuremodeling
Textureclassification
Anomalydetection
Normal texture Abnormal textureFig. 3 Optimized framework of crowd behavior detection based on spatio-temporal information
(a) 2.577 7 (b) 2.522 0 (c) 2.231 0
(d) 2.019 8 (e) 1.706 0 (f) 1.571 6
Fig. 4 Entropy values of random STTs
30 International Journal of Automation and Computing 16(1), February 2019
seem to yielding consistent and satisfactory outcomes
against intuition, where UMN3, UMN5 and UMN6 even
show higher entropy values yet contain less motion fea-
tures than UMN1 and UMN2.
2.4 Optimization through Gabor filtering
In Section 2.3, the information entropy is calculated
on all extracted STTs, the STT with largest entropy
would be selected as target for further pattern analysis.
However, preliminary tests have shown unsatisfactory
pairing between STT slices with high entropy values from
the ones actually containing more crowd motion “rib-
bons”. Close inspection revealed that the main cause of
the problem is due to the traces left on STTs caused by
non-moving objects and background regions, especially
those with high color contrast. For example, the ob-
tained sample STTs from UMN3 to UMN8 patches have
shown explicit parallel stripes caused by the background.
To address this issue, in this research, the Gabor wavelet
filtering is exploited for removing the STT background.
Fig. 5 shows the renovated processes. Instead of applying
the information entropy calculation directly on the ex-
tracted STTs, they are firstly converted into gray scale
images. Then, the background of STTs is removed
through implementing the convolutions of the STTs with
the Gabor filter before the entropy measures are calculated.
The Gabor transformation is a special case of the
short-time Fourier transformation. Because the Gabor
wavelet is very similar to a single cell′s response to visual
stimulus from the human vision system, it is sensitive to
the border of an image, but not so much so to the change
of light, which made it ideal in many application areas in
image processing and computer vision. Panda and
Meher[31] introduced a hierarchical algorithm for both
block-based and pixel-based background subtraction ap-
proaches based on the Gabor transformed magnitude fea-
ture. Zhou et al.[32] extracted features using circular
Gabor filters at five different frequencies, to solve the
challenge that conventional background subtraction al-
gorithms struggle to achieve.
In the spatial domain, a two dimensional Gabor filter
is the product of a sinusoidal function and a Gaussian
function, it is also called the window function. In prac-
tice, the Gabor filter can extract features from multiple
scales and orientations. For this research, it is expressed
as
G(x, y, θ, f) =
exp(−1
2
((x′
sx
)2
+
(y′
sy
)2))
× cos(2πfx′). (2)
sx sy x y
x sx
sx y sy
sy θ f
In (2), and are the window sizes along and
axis, and the value of varies from negative to posit-
ive , the value of varies from negative to positive
. defines the orientation of the extraction process.
defines the frequency of the sinusoidal function. And
x′ = x cos θ + y sin θ
y′ = y cos θ + x sin θ. (3)
The convolution of the Gabor filter and an original
STT is then applied to obtain the filtered version.
sx sy f√4.99
√3.9
In a real-life scenario, the motion of crowd recorded in
a STV block could be towards any direction, thus the
Gabor filtering is applied in eight directions (like the no-
tions of N, S, E, W, NE, SE, NW and SW on a map) to
increase the accuracy. Fig. 6 shows the detailed steps of
the procedure. The first and second row illustrate the
filtered STTs in eight orientations respectively. Note that
the parameters of Gabor filter are adjusted accordingly.
In this case, values of and are set to 2, and is set
to on Fig. 6(b)–6(e) and on Fig. 6(g)–6(j).
Once the filtering steps are completed, all 8 filtered STTs
are accumulated together to formulate a combined one as
shown in Fig. 6(f), where Fig. 6(a) is the original STT.
wht O(n3)
By using this method, the long computational time of
calculating flow-based information in every frame can be
greatly shortened. The extraction of flow-based informa-
tion involves the calculation on every pixel in the video
data. The amount of pixels needing to be analyzed is
, therefore the computational complexity is .
Table 1 Results of selected target STTs′ information entropy values
UMN1 UMN2 UMN3 UMN4 UMN5 UMN6 UMN7
STT
Entropy 2.577 7 2.692 9 3.217 6 3.249 4 3.240 4 2.695 1 2.724 8
Raw video STV STTs Filtered STTs
STVconstruction
STVextraction
Gaborfiltering
Informationentropy
evaluationTargetSTT
Fig. 5 Updated structure of the proposed STT extraction technique
Y. Hao et al. / Effective Crowd Anomaly Detection Through Spatio-temporal Texture Analysis 31
(N + 1)wt+ (M + 1)ht
O(n2)
The proposed algorithm only has to collect several STTs
at certain positions, the amount of pixels needing to be
analyzed is then reduced to , thus
the overall computational complexity is . Also, be-
cause patterns of STTs with varied signature values ex-
hibit different behavioral types, by carefully selecting,
some patterns could be modeled into a feature signature
which could be used for further texture classification. Un-
like the change detection algorithm introduced in the pre-
vious chapter, the classification of textures is capable of
potentially labeling different scenarios in input video
streams.
3 GLCM signaturing for classification
In order to achieve automatic warning of hazardous
crowd behaviors, a spatio-temporal volume (STV) signa-
ture modeling method is proposed to detect crowd abnor-
mality recorded in CCTV streams using the texture ex-
traction algorithm proposed in Section 2. Once the optim-
al STTs are extracted, the gray level co-occurrence mat-
rix (GLCM) can be formulated to measure the crowd be-
haviors identified. In this section, the proposed STT sig-
natures based on the GLCM indices have been defined.
The proposed model has shown a promising accuracy and
efficiency in detecting crowd abnormal behaviors. It has
been proven that the STT signatures are suitable
descriptors for detecting certain crowd events, which
provides an encouraging direction for real-time surveil-
lance applications.
3.1 STT feature categorization
Depending on different construction patterns, STT
features can be roughly classified into statistical texture
features, model type texture features and signal domain
texture features according to Junior et al.[33] Statistical
texture features are obtained by transforming the gray
scale values between a target pixel and its neighbors in
the first-order, second-order and even higher-order filter-
ing process to denote information – often described in the
conventional terms of contrast, variance, etc. The most
frequently used statistical texture features is the grey
level co-occurrence matrix (GLCM)[34], which will be dis-
cussed in the next section. The model type texture fea-
tures assume that a texture can be described by certain
parameters controlled by probabilistic distribution mod-
els. How to recover the most accurate parameter values is
the core issue of this approach. Benezeth et al.[35] pro-
posed an algorithm using a hidden Markov model (HMM)
associated with a spatio-temporal neighborhood co-occur-
rence matrix to describe the texture feature. In the sig-
nal domain texture features, textures are defined in a
transformational domain by certain filters such as the
wavelet[36]. It is based on the assumption that the energy
distribution within the frequency domain can be used to
classify textures.
The grey level co-occurrence matrix (GLCM), known
as grey tone spatial dependency matrix, is first proposed
by Haralick et al.[34] By definition, the GLCM is a statist-
ic tabulation of the probability of different pixel grey
scale values occurred in an image. In brief, assuming the
gray scale of current image is divided into three levels,
GLCM will store all the neighboring pairs of these three
levels.
In this research, the GLCM patterns have been ex-
plored to test their performance on STT signature identi-
fication. The main strategy of this approach is to extract
raw GLCM texture features from relevant STTs. Once
these features are acquired, a signature could be modeled
for classification purpose. A five-stage process flow of this
approach is shown in Fig. 7.
G
G
G
In order to obtain the GLCM indices from a STT, the
very first step is to transform a STT from RGB image to
gray scale, and then the raw GLCM, labeled as , can be
calculated based on the algorithm introduced in [37]. In
most cases, the gray scale value distribution of STTs is
irregular, thus the obtained results of are often asym-
metric. According to the GLCM definition, represents
the gray-scale pair relations along one direction, the
transposed matrix is then calculated to represent the rela-
(a) Original STT (b) θ = (c) θ = −
(d) θ = 0 (e) θ = π
(f) Combination oftransformed STTs
(g) θ = (h) θ = −3
(i) θ = 3 (j) θ = −
2π−2
π−
4π−4
π−
4π−4
π−
Fig. 6 Gabor filtering results along eight directions
32 International Journal of Automation and Computing 16(1), February 2019
S G′ G
P S
tion matrix along the opposite direction, and then the
symmetric matrix can be obtained by adding and ,
to represent the complete relations along this direction.
The next step is the normalization, where the probability
matrix is obtained from by using (4).
Pi,j =Si,j
N−1∑i,j=0
Si,j
(4)
i j
S P P
N
N
N
N
N
N
P
where the obtained and are the row and column
indices of matrix and . Obtained probability matrix
has two properties: 1) According to the definition of
GLCM algorithm, assuming that the gray scale value of
the original image is divided into levels, then the
column and row numbers are also . Thus, the more
levels the gray scales are divided into, the larger will
be, which means the size of the GLCM will be larger.
Also, the range of is usually from 3 to 10. If it is too
large, the GLCM will be sparse and its descriptive ability
will be affected. In order to reduce the computation time
and to avoid overly sparse GLCMs, a proper value of
should be selected. In this research, the value of is set
to 8 based on experiments. 2) is symmetric along the
diagonal. The diagonal elements represent pixels which
do not have gray level differences, and the farther away
from the diagonal, the greater the differences between the
pixel gray levels. According to this property, patterns like
the contrast can be readily retrieved in a look-up table
style.
P
Next, texture patterns can be calculated from the
probability matrix . The resulting low level texture pat-
terns are named here as contrast patterns, orderliness
patterns, and descriptive statistical patterns.
3.2 Contrast patterns of GLCM
P
Contrast patterns describe how the gray scale value of
current image varies in terms of contrast, dissimilarity,
homogeneity and similarity. The farther the pixel pairs
from the central diagonal line in , the bigger the differ-
ence it represents within the gray scale, thus the con-
trast can be obtained by (5).
CON =
N−1∑i,j=0
Pi,j(i− j)2. (5)
Similar to contrast, dissimilarity also represents differ-
ence in gray scale values, except it increases linearly in-
stead of exponentially. Dissimilarity can be obtained by
(6).
DIS =
N−1∑i,j=0
Pi,j |i− j|. (6)
Homogeneity is also called inverse different moment
(IDM). On the contrary, homogeneity represents how
consistent the contrast is, when the contrast of an image
is low, the value of its homogeneity will be large. Equa-
tion (7) shows how to calculate homogeneity.
HOM =
N−1∑i,j=0
Pi,j
1 + (i− j)2. (7)
Similar to dissimilarity, the linear version of homogen-
eity can be obtained by (8).
SIM =
N−1∑i,j=0
Pi,j
1 + |i− j| . (8)
Table 2 gives a comparison of the contrast related
patterns for sample images. The GLCM window size is
set to 50 by 50 pixels, where the direction is set to hori-
zontal with the step size fixed at 1 pixel. The gray scale
level number is set to 8. The patch in Table 2(a) is less
contrastive than the one in Table 2(d), thus the result
shows that patch in Table 2(a) has less GLCM contrast
and dissimilarity values, and larger homogeneity and sim-
ilarity values.
3.3 Orderliness patterns of GLCM
Orderliness related patterns describe how orderly or
regular the distribution of gray scale values in an image
is, including angular second moment, energy and entropy.
The concept of angular second moment (ASM) comes
from physics[21] for measuring rotational acceleration.
ASM could be obtained using (9). Its value increases
while the orderliness distribution is high.
ASM =
N−1∑i,j=0
Pi,j2. (9)
TargetSTT
RawGLCM
Orderlinessfeature
Descriptivefeature
Contrastfeature
STTsignature Classify
Fig. 7 Structure of the proposed approach
Y. Hao et al. / Effective Crowd Anomaly Detection Through Spatio-temporal Texture Analysis 33
The energy equals to the square root of ASM, as (10).
It is often used in fingerprint recognition[38] and plant
classification[39].
ENR =√
ASMi,j . (10)
On contrary to energy, entropy describes how irregu-
lar current gray scale distribution is, where the value of
entropy decreases when the distribution is less orderly.
Entropy can be expressed as (11).
ENT =
N−1∑i,j=0
Pi,j(−lnPi,j). (11)
In Table 2, the orderliness of six different images are
measured. The patch in Table 2(a) clearly shows more
regular patterns than the patch in Table 2(d), so it can
be expected that the Entropy of the patch in Table 2(a)
is less than the one in Table 2(d).
3.4 Descriptive statistical patterns of
GLCM
P
Descriptive statistical related patterns consist of stat-
istics derived from a GLCM matrix, including mean, vari-
ance and correlation. It needs to be emphasized that
these patterns describe the statistical pixel pair relations,
but not typical gray scale value explicitly. Two GLCM
mean values can be obtained by using (12), note that be-
cause the probability matrix is symmetric, the two
mean values are identical.
µi =
N−1∑i,j=0
i(Pi,j)
µj =
N−1∑i,j=0
j(Pi,j). (12)
σ2 σGLCM variance and standard deviation can be
obtained through (13).
σi2 =
N−1∑i,j=0
Pi,j(i− µi)2
σj2 =
N−1∑i,j=0
Pi,j(j − µj)2. (13)
Finally, according to the calculated mean and vari-
ance, the GLCM correlation can be obtained by (14).
COR =
N−1∑i,j=0
Pi,j
[(i− µi)(j − µj)√
(σi2)(σj
2)
]. (14)
3.5 GLCM signature modeling
In this section, patterns of GLCM matrices are
modeled as signatures for crowd motion classification. Six
STT patches are extracted at different parts of the STV
model in Table 2, Patches (a)–(c) are obtained from tex-
ture with normal motion, and Patches (d)–(f) are ob-
tained from texture with abnormal motion. By compar-
ing pattern values of normal and abnormal patches, the
following patterns can be identified. Firstly, a texture
patch at a normal state usually has lower contrast, en-
Table 2 Comparison between texture patterns of STT patches
Patch (a) Patch (b) Patch (c) Patch (d) Patch (e) Patch (f)
Contrast 0.243 7 0.323 7 0.266 9 0.685 3 0.573 5 0.647 3
Dissimilarity 0.192 2 0.211 0 0.193 5 0.394 7 0.364 5 0.427 8
Homogeneity 0.908 5 0.904 9 0.910 3 0.830 2 0.837 9 0.807 8
Similarity 0.910 1 0.909 4 0.913 2 0.840 5 0.845 9 0.817 4
Angular second moment 0.353 8 0.213 4 0.412 4 0.185 3 0.206 2 0.176 7
Energy 0.594 8 0.461 9 0.642 2 0.430 4 0.454 1 0.420 3
Entropy 1.297 7 2.085 8 1.529 4 2.332 5 2.174 7 2.359 9
Mean 2.493 3 4.759 8 2.786 5 4.063 5 2.641 0 2.826 5
Variance 0.385 9 3.711 5 0.672 8 2.515 0 1.050 9 2.826 5
Standard deviation 0.621 2 1.926 5 0.820 2 1.585 9 1.025 1 1.072 9
Correlation 0.684 3 0.956 4 0.801 6 0.863 8 0.727 2 0.718 8
Normal Yes Yes Yes No No No
34 International Journal of Automation and Computing 16(1), February 2019
tropy and variance, e.g., Patches (a)–(c) all have lower
contrast than Patches (d)–(f). Secondly, a texture patch
with normal behavior usually has higher ASM value than
patches at abnormal state. Thirdly, among all other pat-
terns, contrast, ASM, entropy and variance show most
significant changes between normal and abnormal states.
Thus, these four GLCM-based patterns are selected as
the most appropriate measures for detecting abnormal
crowd states, and are denoted accordingly in Table 2.
Fig. 8(a) displays the gray scale image transformed
from a STT obtained in Fig. 2(d), the actual test video is
chosen from the University of Minnesota (UMN) dataset.
All videos from this dataset start with a normal crowd
scene followed by an abnormal event, mostly panic beha-
vior. The ground truth of normal and abnormal behavi-
ors is manually marked on Fig. 8(a), by using a color bars
at the bottom of the figure. The grey color indicates nor-
mal state and the black color indicates abnormal state. It
can be observed that different visual patterns of this fig-
ure match the labeled ground truth. It is expected that
the differences of patterns will reflect the defined STT
signatures too. According to the definition of STT, the
column index represents the frame index in the original
video, thus by summing up each column calculated by
GLCM texture features, the change of GLCM feature
patterns over time can be quantified and evaluated.
Figs. 8 (b)–8 (e) show the trends of contrast patterns of
the STT in Fig. 8 (a). As the anomaly occurs, patterns
which describe pixel pair dissimilarity, such as contrast
and dissimilarity, increase rapidly. However, patterns de-
scribing pixel pair similarity such as Homogeneity and
Similarity do not change significantly. Figs. 8 (f)–8 (h) show the trends of orderliness patterns of Fig. 8(a).
When the anomaly occurs, patterns describing image ir-
regularity such as entropy increase quickly, while the an-
gular second moment shows a significant drop though the
energy holds steady. Figs. 8 (i)–8 (l) show the trends of
statistic related pattern measures. When the anomaly oc-
curs, the mean value does not show significant change.
Variance, standard deviation and correlation value also
change slightly. Hence, in summary, the contrast (CON),
angular second moment (ASM), entropy (ENT) and vari-
ance (VAR) are selected as candidates for forming the
STT signature vector for classification due to their sali-
ent variance magnitude. As the linear version of contrast,
dissimilarity is discarded to control the dimension of the
signature, the same decision process has been applied to
the standard deviation and correlation. The final signa-
ture (SIG) for classification is modeled as (15).
SIG = [CON,ASM,ENT, V AR]. (15)
4 Test and evaluations
In this section, an experimental system equipped with
the devised signature model and process pipeline has been
constructed to classify the crowd motion videos as shown
in Fig. 9. The extracted STT is firstly filtered with the
six-orientation Gabor transform to amplify the motion
details. Once a STT is processed, it is divided into a col-
lection of texture patches, and the patterns are extracted
from these patches to model the signature for classifica-
tion. In the classification phase, the texture patches are
classified with a trained classifier using the modeled sig-
natures. TAMURA texture patterns[40] are also utilized to
model a signature for performance comparison. The val-
ues of coarseness, contrast, line likeness and regularity are
modeled as a four dimensional TAMURA signature.
Several classifiers are implemented on these two pat-
terns to assess the performance, including the K nearest
neighbor (KNN), Naïve Bayes, discriminant analysis clas-
sifier (DAC), random forest and support vector machine
(SVM). In the training stage for the classifier, extracted
STTs with congestion and panic scenarios are divided in-
to manually labeled texture patches to train the classifier.
The texture patches for training are categorized into four
different types, which are empty, normal, congested and
panic. The empty texture contains no pedestrians but
only background. The normal texture contains pedestri-
ans walking casually in a scene. The congested texture
contains pedestrians with slow moving velocity and high
density. The panic texture contains pedestrians escaping
of high velocity.
Once the classifier is trained, STTs for testing are
firstly divided into patches and the patterns are extrac-
ted to model the signature for classification. The details
of parameter setting for classifiers are as follows. The size
of patches is set to 50 by 50 pixels. For the KNN, the
number of neighbors is set to 4, since in training phase
only four types of anomaly are defined. For the random
forest classifier, the number of trees is set to 5. The para-
meters of Naïve Bays, DAC and SVM are set as default.
One of classification results is shown as Fig. 10, the KNN
classifier is applied on the GLCM signature. The blue line
grid marks the boundary of each divided patch. The Dash
(a) Ground truth (b) Contrast (c) Dissimilari-ty
(d) Homogene-ity
(e) Similarity (f) ASM (g) Energy (h) Entropy
(i) Mean (j) Variance (k) Deviation (l) Correlation
Fig. 8 Trends of GLCM patterns along time
Y. Hao et al. / Effective Crowd Anomaly Detection Through Spatio-temporal Texture Analysis 35
line stands for the empty texture, cross for the normal
texture, triangle for the congested texture, and oblique
cross for the panic texture. Since agent′s velocity is high-
er in uncongested state, the spatial shifting along time
will be larger than when it is in a congested state. As
consequence, the texture stripe in STT will have larger
slope value. On the contrary, textures containing conges-
ted behaviors will have parallel stripes with gently slop-
ing value. Therefore, in visual expression, texture patch
with more horizontal stripes stands for the congestion be-
havior, and the one with more vertical stripes stands for
the normal states. In summary, congested texture patches
have relatively smaller contrast, entropy, variance values
and larger angular second moment value.
The TAMURA signatures for the same STT set have
also been applied to the KNN classifier to compare the
performance. The result is shown in Fig. 11. Comparing
to Fig. 10, a number of texture patches with no motion
patterns are marked as normal, and some with normal
pedestrian behaviors are marked as congested, as high-
lighted in Fig. 11. The comparison indicated that the
GLCM-based signature (feature vectors) outperformed
the TAMURA in detecting crowd motion patterns.
The detection of panic scenes is also carried out. In
Fig. 12, STTs extracted from the UMN dataset are pro-
cessed using the proposed procedure. A comparison is
made between the GLCM and TAMURA texture pat-
terns. Fig. 12(a) shows the detection result using GLCM,
and Fig. 12(b) shows the detection result using
TAMURA. Similar to Figs. 10 and 11, agents with panic
behavior are likely to have higher moving speed. Thus,
the texture patch with panic behavior will show stripes in
higher slope value.
Ci,j
A
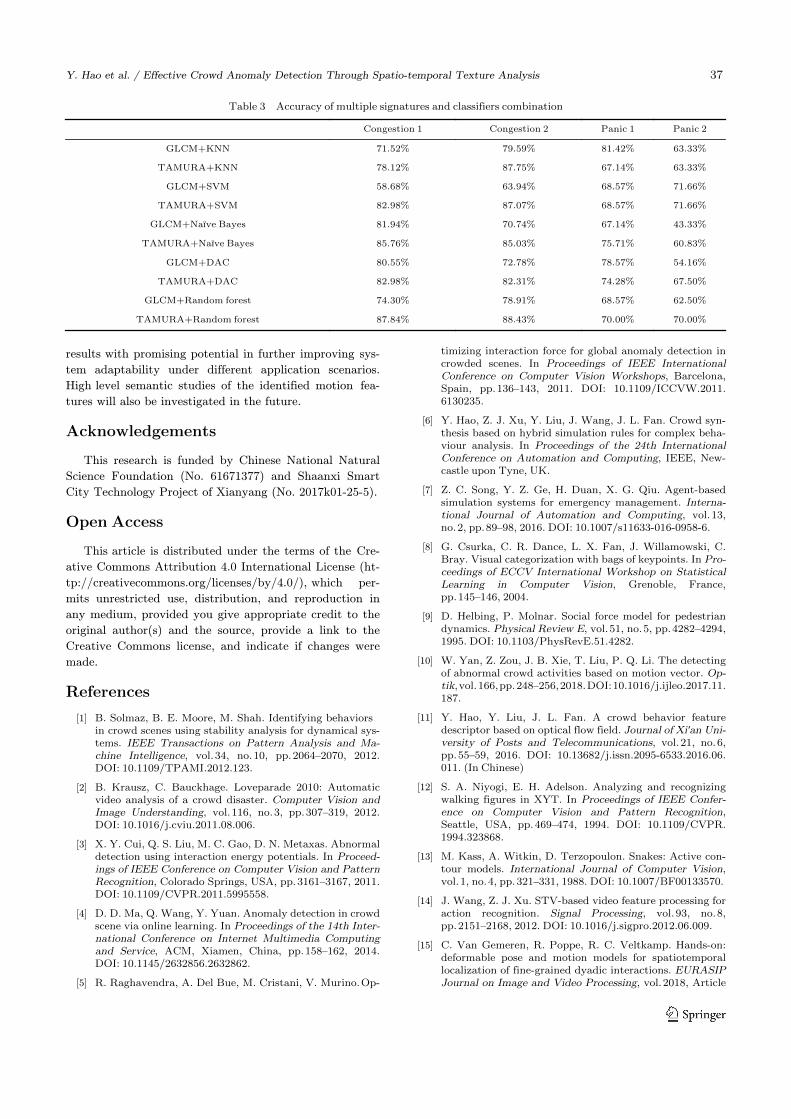
In order to measure the performance, all sample test
patches are manually labeled with the four texture types
in the training phase. If the results equal to the labeled
ground truths, then it is considered a correct detection,
and the label value is set to 1, otherwise a failed one
and the label value is set to 0. The detection accuracy
can be calculated using (16). Table 3 shows the accuracy
between various combination of signatures and classifiers.
A =
N∑i,j=0
Ci,j
i× j. (16)
5 Conclusions and future work
Real-time and effective monitoring of high density
crowds for public safety is of increasing demand in the
real world. In this research, a novel crowd anomaly detec-
tion framework is proposed that satisfies continuous feed-
in of spatio-temporal information from live CCTVs. Nov-
el STT selection, filtering, and feature modelling tech-
niques have been devised and tested. Evaluation against
state-of-the-art benchmarking systems yields satisfactory
STT Filtered STT STT patches Signature
ClassificationExtractpatterns
Dividedinto patches
Gabor pre-processing
[Patterns]
[Patterns]
[Patterns]
[Patterns]
Result
Fig. 9 Structure of proposed classification approach
Fig. 10 Detection result using GLCM signature and KNN
Fig. 11 Detection result using TAMURA signature and KNN
(a) GLCM and KNN (b) TAMURA and KNN
Fig. 12 Comparison of detection results on panic state
36 International Journal of Automation and Computing 16(1), February 2019
results with promising potential in further improving sys-
tem adaptability under different application scenarios.
High level semantic studies of the identified motion fea-
tures will also be investigated in the future.
Acknowledgements
This research is funded by Chinese National Natural
Science Foundation (No. 61671377) and Shaanxi Smart
City Technology Project of Xianyang (No. 2017k01-25-5).
Open Access
This article is distributed under the terms of the Cre-
ative Commons Attribution 4.0 International License (ht-
tp://creativecommons.org/licenses/by/4.0/), which per-
mits unrestricted use, distribution, and reproduction in
any medium, provided you give appropriate credit to the
original author(s) and the source, provide a link to the
Creative Commons license, and indicate if changes were
made.
References
B. Solmaz, B. E. Moore, M. Shah. Identifying behaviorsin crowd scenes using stability analysis for dynamical sys-tems. IEEE Transactions on Pattern Analysis and Ma-chine Intelligence, vol. 34, no. 10, pp. 2064–2070, 2012.DOI: 10.1109/TPAMI.2012.123.
[1]
B. Krausz, C. Bauckhage. Loveparade 2010: Automaticvideo analysis of a crowd disaster. Computer Vision andImage Understanding, vol. 116, no. 3, pp. 307–319, 2012.DOI: 10.1016/j.cviu.2011.08.006.
[2]
X. Y. Cui, Q. S. Liu, M. C. Gao, D. N. Metaxas. Abnormaldetection using interaction energy potentials. In Proceed-ings of IEEE Conference on Computer Vision and PatternRecognition, Colorado Springs, USA, pp. 3161–3167, 2011.DOI: 10.1109/CVPR.2011.5995558.
[3]
D. D. Ma, Q. Wang, Y. Yuan. Anomaly detection in crowdscene via online learning. In Proceedings of the 14th Inter-national Conference on Internet Multimedia Computingand Service, ACM, Xiamen, China, pp. 158–162, 2014.DOI: 10.1145/2632856.2632862.
[4]
R. Raghavendra, A. Del Bue, M. Cristani, V. Murino. Op-[5]
timizing interaction force for global anomaly detection incrowded scenes. In Proceedings of IEEE InternationalConference on Computer Vision Workshops, Barcelona,Spain, pp. 136–143, 2011. DOI: 10.1109/ICCVW.2011.6130235.
Y. Hao, Z. J. Xu, Y. Liu, J. Wang, J. L. Fan. Crowd syn-thesis based on hybrid simulation rules for complex beha-viour analysis. In Proceedings of the 24th InternationalConference on Automation and Computing, IEEE, New-castle upon Tyne, UK.
[6]
Z. C. Song, Y. Z. Ge, H. Duan, X. G. Qiu. Agent-basedsimulation systems for emergency management. Interna-tional Journal of Automation and Computing, vol. 13,no. 2, pp. 89–98, 2016. DOI: 10.1007/s11633-016-0958-6.
[7]
G. Csurka, C. R. Dance, L. X. Fan, J. Willamowski, C.Bray. Visual categorization with bags of keypoints. In Pro-ceedings of ECCV International Workshop on StatisticalLearning in Computer Vision, Grenoble, France,pp. 145–146, 2004.
[8]
D. Helbing, P. Molnar. Social force model for pedestriandynamics. Physical Review E, vol. 51, no. 5, pp. 4282–4294,1995. DOI: 10.1103/PhysRevE.51.4282.
[9]
W. Yan, Z. Zou, J. B. Xie, T. Liu, P. Q. Li. The detectingof abnormal crowd activities based on motion vector. Op-tik, vol. 166, pp. 248–256, 2018. DOI: 10.1016/j.ijleo.2017.11.187.
[10]
Y. Hao, Y. Liu, J. L. Fan. A crowd behavior featuredescriptor based on optical flow field. Journal of Xi′an Uni-versity of Posts and Telecommunications, vol. 21, no. 6,pp. 55–59, 2016. DOI: 10.13682/j.issn.2095-6533.2016.06.011. (In Chinese)
[11]
S. A. Niyogi, E. H. Adelson. Analyzing and recognizingwalking figures in XYT. In Proceedings of IEEE Confer-ence on Computer Vision and Pattern Recognition,Seattle, USA, pp. 469–474, 1994. DOI: 10.1109/CVPR.1994.323868.
[12]
M. Kass, A. Witkin, D. Terzopoulon. Snakes: Active con-tour models. International Journal of Computer Vision,vol. 1, no. 4, pp. 321–331, 1988. DOI: 10.1007/BF00133570.
[13]
J. Wang, Z. J. Xu. STV-based video feature processing foraction recognition. Signal Processing, vol. 93, no. 8,pp. 2151–2168, 2012. DOI: 10.1016/j.sigpro.2012.06.009.
[14]
C. Van Gemeren, R. Poppe, R. C. Veltkamp. Hands-on:deformable pose and motion models for spatiotemporallocalization of fine-grained dyadic interactions. EURASIPJournal on Image and Video Processing, vol. 2018, Article
[15]
Table 3 Accuracy of multiple signatures and classifiers combination
Congestion 1 Congestion 2 Panic 1 Panic 2
GLCM+KNN 71.52% 79.59% 81.42% 63.33%
TAMURA+KNN 78.12% 87.75% 67.14% 63.33%
GLCM+SVM 58.68% 63.94% 68.57% 71.66%
TAMURA+SVM 82.98% 87.07% 68.57% 71.66%
GLCM+Naïve Bayes 81.94% 70.74% 67.14% 43.33%
TAMURA+Naïve Bayes 85.76% 85.03% 75.71% 60.83%
GLCM+DAC 80.55% 72.78% 78.57% 54.16%
TAMURA+DAC 82.98% 82.31% 74.28% 67.50%
GLCM+Random forest 74.30% 78.91% 68.57% 62.50%
TAMURA+Random forest 87.84% 88.43% 70.00% 70.00%
Y. Hao et al. / Effective Crowd Anomaly Detection Through Spatio-temporal Texture Analysis 37
number 16, 2018. DOI: 10.1186/s13640-018-0255-0.
X. F. Ji, Q. Q. Wu, Z. J. Ju, Y. Y. Wang. Study of humanaction recognition based on improved spatio-temporal fea-tures. International Journal of Automation and Comput-ing, vol. 11, no. 5, pp. 500–509, 2014. DOI: 10.1007/s11633-014-0831-4.
[16]
E. H. Aldelson, J. R. Bergen. Spatiotemporal energy mod-els for the perception of motion. Journal of the Optical So-ciety of America A, vol. 2, no. 2, pp. 284–299, 1985. DOI:10.1364/JOSAA.2.000284.
[17]
Y. Iwashita, M. Petrou. Person identification from spatio-temporal volumes. In Proceedings of the 23rd Internation-al Conference Image and Vision Computing, IEEE, Christ-church, New Zealand, 2008. DOI: 10.1109/IVCNZ.2008.4762086.
[18]
R. C. Bolles, H. H. Baker, D. H. Marimont. Epipolar-planeimage analysis: an approach to determining structure frommotion. International Journal of Computer Vision, vol. 1,no. 1, pp. 7–55, 1987. DOI: 10.1007/BF00128525.
[19]
H. H. Baker, R. C. Bolles. Generalizing epipolar-plane im-age analysis on the spatiotemporal surface. In Proceedingsof the Computer Society Conference on Computer Visionand Pattern Recognition, IEEE, Ann Arbor, USA,pp. 33–49, 1988. DOI: 10.1109/CVPR.1988.196209.
[20]
G. Kuhne G, S. Richter, M. Beier. Motion-based segment-ation and contour-based classification of video objects. InProceedings of the 9th ACM international conference onMultimedia, Ottawa, Canada, pp. 41–50, 2001. DOI:10.1145/500141.500150.
[21]
C. W. Ngo, T. C. Pong, R. T. Chin. Detection of gradualtransitions through temporal slice analysis. In Proceed-ings of IEEE Computer Society Conference on ComputerVision and Pattern Recognition, Fort Collins, USA,pp. 41–46, 1999. DOI: 10.1109/CVPR.1999.786914.
[22]
Y. Hao, Z. J. Xu, J. Wang, Y. Liu, J. L. Fan. An approachto detect crowd panic behavior using flow-based feature.In Proceedings of the 22nd International Conference onAutomation and Computing, IEEE, Colchester, UK,pp. 462–466, 2016. DOI: 10.1109/IConAC.2016.7604963.
[23]
J. H. Xiang, H. Fan, J. Xu. Abnormal behavior detectionbased on spatial-temporal features. In Proceedings of In-ternational Conference on Machine Learning and Cyber-netics, IEEE, Tianjin, China, pp. 871–876, 2013. DOI:10.1109/ICMLC.2013.6890406.
[24]
H. H. Alqaysi, S. Sasi. Detection of abnormal behavior indynamic crowded gatherings. In Proceedings of IEEE Ap-plied Imagery Pattern Recognition Workshop, IEEE,Washington DC, USA, pp. 1–6, 2013. DOI: 10.1109/AIPR.2013.6749309.
[25]
C. Li, Z. J. Han, Q. X. Ye, J. B. Jiao. Abnormal behaviordetection via sparse reconstruction analysis of trajectory.In Proceedings of the 6th International Conference on Im-age and Graphics, IEEE, Hefei, China, pp. 807–810, 2011.DOI: 10.1109/ICIG.2011.104.
[26]
C. E. Shannon. A mathematical theory of communication.Bell System Technical Journal, vol. 27, no. 3, pp. 379–423,1948. DOI: 10.1002/j.1538-7305.1948.tb01338.x.
[27]
K. He, S. X. Wang. Study on denoising of fractal signalbased on Shannon entropy. In Proceedings of Internation-al Conference on Neural Networks and Signal Processing,IEEE, Nanjing, China, pp. 751–755, 2003. DOI: 10.1109/ICNNSP.2003.1279384.
[28]
S. Liang, Y. Ma, Y. Y. Huang, J. Guo, C. F. Jia. The[29]
scheme of detecting encoded malicious web pages based oninformation entropy. In Proceedings of the 10th Interna-tional Conference on Innovative Mobile and Internet Ser-vices in Ubiquitous Computing, IEEE, Fukuoka, Japan,pp. 310–312, 2016. DOI: 10.1109/IMIS.2016.82.
Z. J. Zhang, X. N. Wang, L. Sun. Mobile payment anom-aly detection mechanism based on information entropy.IET Networks, vol. 5, no. 1, pp. 1–7, 2014. DOI: 10.1049/iet-net.2014.0101.
[30]
D. K. Panda, S. Meher. Hierarchical background subtrac-tion algorithm using Gabor filter. In Proceedings of IEEEInternational Conference on Electronics, Computing andCommunication Technologies, Bangalore, India, pp. 1–6,2015. DOI: 10.1109/CONECCT.2015.7383876.
[31]
D. X. Zhou, H. Zhang, N. Ray. Texture based backgroundsubtraction. In Proceedings of IEEE International Confer-ence on Information and Automation, Changsha, China,pp. 20–23, 2008. DOI: 10.1109/ICINFA.2008.4608070.
[32]
J. C. S. J. Junior, S. R. Musse, C. R. Jung. Crowd analysisusing computer vision techniques. IEEE Signal ProcessingMagazine, vol. 27, no. 5, pp. 66–77, 2010. DOI: 10.1109/MSP.2010.937394.
[33]
R. M. Haralick, K. Shanmugam, I. Dinstein. Textural fea-tures for image classification. IEEE Transactions on Sys-tems, Man, and Cybernetics, vol. SMC-3, no. 6, pp. 610–621, 1973. DOI: 10.1109/TSMC.1973.4309314.
[34]
Y. Benezeth, P. M. Jodoin, V. Saligrama, C. Rosenberger.Abnormal events detection based on spatio-temporal Co-occurences. In Proceedings of IEEE Conference on Com-puter Vision and Pattern Recognition, Miami, USA,pp. 2458–2465, 2009. DOI: 10.1109/CVPR.2009.5206686.
[35]
J. B. Shen, X. G. Jin, C. Zhou, H. L. Zhao. Dynamic tex-tures using wavelet analysis. In Proceedings of Interna-tional Conference, Springer, Berlin Heidelberg, Germany,pp. 1070–1073, 2006. DOI: 10.1007/11736639_132.
[36]
The GLCM Tutorial. [Online], Available: http://www.fp.ucalgary.ca/mhallbey/tutorial.htm, June 28, 2018.
[37]
S. B. Nikam, S. Agarwal. Wavelet energy signature andGLCM features-based fingerprint anti-spoofing. In Pro-ceedings of the International Conference on Wavelet Ana-lysis and Pattern Recognition, IEEE, Hong Kong, China,pp. 717–723, 2008. DOI: 10.1109/ICWAPR.2008.4635872.
[38]
G. Mukherjee, A. Chatterjee, B. Tudu. Study on the po-tential of combined GLCM features towards medicinalplant classification. In Proceedings of the 2nd Internation-al Conference on Control, Instrumentation, Energy andCommunication, IEEE, Kolkata, India, pp. 98–102, 2016.DOI: 10.1109/CIEC.2016.7513746.
[39]
R. K. Ranjan, A. Agrawal. Video summary based on F-sift, Tamura textural and middle level semantic feature.Procedia Computer Science, vol. 89, pp. 870–876, 2016.DOI: 10.1016/j.procs.2016.06.075.
[40]
Yu Hao received the B. Sc. degree in elec-tronic engineering from Xidian University,China in 2008, and the M. Sc. degree incomputer science from the Wichita StateUniversity, USA in 2011, and he is thePh. D. degree candidate in computing andengineering from the University of Hud-dersfield, UK since 2015. Currently, he is alecturer in School of Computer Science and
Technology, Xi′an University of Posts and Telecommunications,China. He has published about 7 refereed journal and conference
38 International Journal of Automation and Computing 16(1), February 2019
papers during his Ph. D. program. His research interest is crowd abnormal behavior analysis. E-mail: [email protected] ORCID iD: 0000-0002-6820-5243
Zhi-Jie Xu received the B. Sc. degree incommunication engineering from the Xi′anUniversity of Science and Technology,China in 1991. After graduation, he hasworked for one of the major Chinese Elec-trical and Machinery Companies – HHYellow River Ltd for four years as an elec-tronics engineer. He then traveled to theUK and spent a year working in a robotics
labratory in Derby, UK. In 1996, he registered and became apostgraduate student at the University of Derby, UK. His re-search topic is virtual reality for manufacturing simulations. In2000, he has completed his Ph. D. study and immediately beenoffered a tenured academic post at the University of Hudder-sfield, UK. He has published over 100 peer-reviewed journal andconference papers as well as editing 5 books in the relevant fields.He has supervised 11 postgraduate (including 8 Ph. D.) studentsto completion and been continuously winning substantial re-search and development grants in his career to date. He is amember of the IEEE, Institution of Engineering and Technology(IET), British Computer Society (BCS), The British MachineVision Association (BMVA) and a fellow of Higher EducationAcademy (HEA). In addition, he has been serving as an editor,reviewer and chair for many prestigious academic journals andconferences. His research interests include visual computing, vision sys-tems, data science and machine learning. E-mail: [email protected] (Corresponding author) ORCID iD: 0000-0002-0524-5926
Ying Liu received the Ph. D. degree incomputer vision from the Monash Uni-versity, Australia in 2007. And she workedas a post doctor researcher at NanyangTechnological University, Singapore until2010. She is the chief engineer of ShaanxiForensic Science Digital InformationLaboratory Research Center, China since2012. Currently, she is the assistant dean
of School of Communications and Information Engineering atXi′an University of Posts and Telecommunications, China. She
has published over 60 peer-reviewed journal and conference pa-pers in the relevant fields. She was grant annual best paper ofPattern Recognition and Tier A paper from Australia ResearchCouncil. Her research interest include pattern recognition, machinelearning and forensic science. E-mail: ly_ [email protected] ORCID iD: 0000-0003-1796-8045
Jing Wang received the B. Sc. degree inmachine and electronic technology fromthe Xidian University, China in 2006.After graduation, he was appointed assoftware engineer and carried out develop-ment work on computer vision (CV)-basedquality control systems, such as assemblyline monitoring and industrial robotic con-trols. In 2008, he began his postgraduate
study at the University of Huddersfield and received his Ph. D.degree in computer vision from University of Huddersfield, UKin 2012. He then became a research fellow and carried out inde-pendent researches on image processing, analysing and under-standing. Since 2008, He has published more than 20 journal andconference papers in the relative fields. He is a member of theBritish Machine Vision Association (BMVA) and British Com-puter Society (BCS). He has also served as chair and editor forthe International Conference on Automation and Computing. His research interest is real-world applications of computervision systems. E-mail: [email protected] ORCID iD: 0000-0002-8579-8765
Jiu-Lun Fan received the B. Sc. andM. Sc. degrees in mathematics from theShaanxi Normal University, China in 1985and 1988, respectively, and the Ph. D. de-gree in electronic engineering from theXidian University, China in 1998. Cur-rently, he is the president of Xi′an Uni-versity of Posts and Telecommunications,China since 2015. He has published over
200 peer-reviewed journal and conference papers in the relevantfields. His research interests include signal processing, pattern recog-nition and communications security. E-mail: [email protected]
Y. Hao et al. / Effective Crowd Anomaly Detection Through Spatio-temporal Texture Analysis 39