29
EFFECTIVE RESEARCH METHODOLOGY FOR CONSUMER BEHAVIOR IMPACT ASSESSMENT PAM OSTERLOH & JORDAN MICHEL October 11, 2012
EFFECTIVE RESEARCH METHODOLOGY FOR CONSUMER BEHAVIOR IMPACT ASSESSMENT
PAM OSTERLOH & JORDAN MICHELOctober 11, 2012
AGENDA
•
Background◦
About AEP Texas◦
In-Home Displays◦
AEP Texas’s SMART View Program •
Research Best Practices•
SMART View Research Methodology
2

3
BACKGROUND

ABOUT AEP TEXAS
•
Delivers electricity to nearly 1 million customers in South and West Texas areas
•
Constructs and maintains power
lines, restores service after storms
and other outages, reads meters for
REPs, connects and disconnects
based on REP orders•
Headquartered in Corpus Christi•
37,868 miles of distribution lines,
8,889 miles of transmission lines•
Serves 97,000 square miles
4
AEP TEXAS ENERGY EFFICIENCY
•
Current residential programs include:◦
Residential Standard Offer Program◦
Hard-to-Reach Standard Offer Program◦
Targeted Low-Income Weatherization Program◦
ENERGY STAR New Homes Market Transformation Program◦
SMART Source Solar PV Program◦
Cool Saver AC Tune-Up Market Transformation Program
5
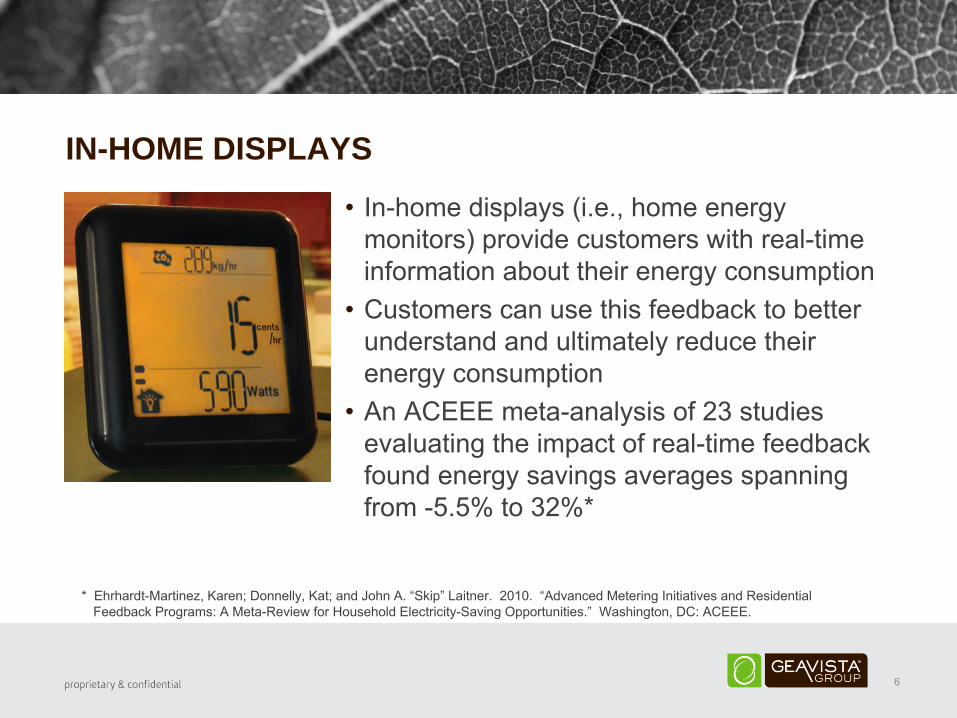
IN-HOME DISPLAYS
•
In-home displays (i.e., home energy monitors) provide customers with real-time information about their energy consumption
•
Customers can use this feedback to better understand and ultimately reduce their energy consumption
•
An ACEEE meta-analysis of 23 studies evaluating the impact of real-time feedback found energy savings averages spanning from -5.5% to 32%*
6
* Ehrhardt-Martinez, Karen; Donnelly, Kat; and John A. “Skip”
Laitner. 2010. “Advanced Metering Initiatives and Residential
Feedback Programs: A Meta-Review for Household Electricity-Saving Opportunities.”
Washington, DC: ACEEE.
AEP TEXAS SMART VIEW PROGRAM
•
AEP Texas’s SMART View Program is a research project that aims to:◦
Test 2-3 in-home displays for customer acceptance and ease of use
◦
Enable test participants to receive energy usage data and use that data to make informed decisions about their energy usage
◦
Develop a plan to measure and verify energy and demand savings related to the use of in-home displays
7

8
RESEARCH BEST PRACTICES
OVERVIEW
•
Begin with a soft launch•
Align the sample with the population•
Include a control group•
Isolate impacts of research variables•
Recruit sufficient sample•
Gather relevant data
9
BEGIN WITH A SOFT LAUNCH
•
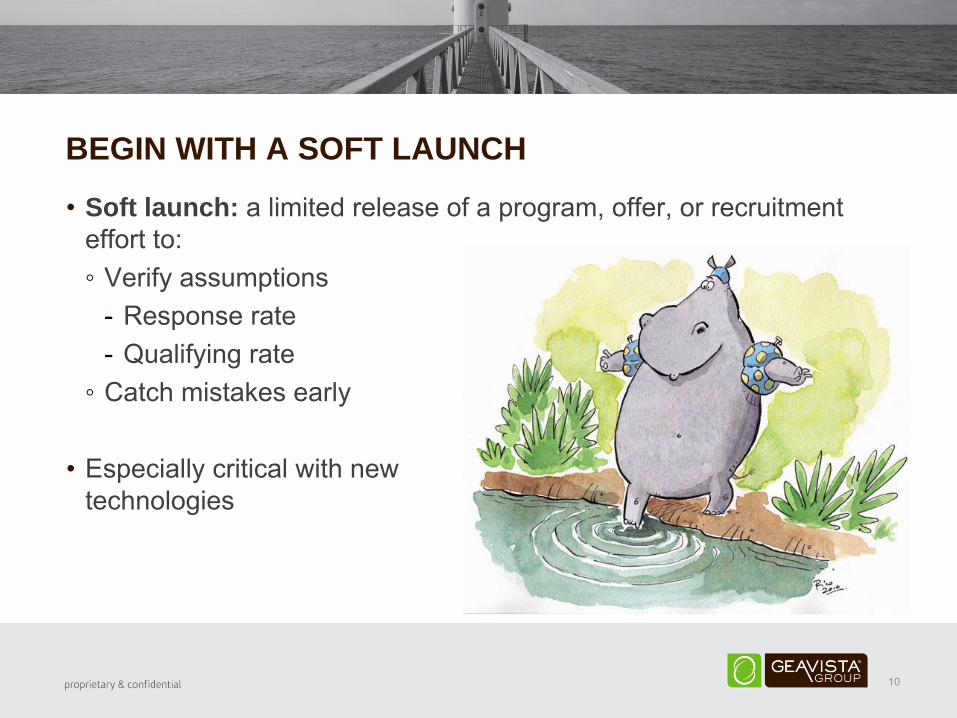
Soft launch: a limited release of a program, offer, or recruitment effort to:◦
Verify assumptions-
Response rate-
Qualifying rate◦
Catch mistakes early
•
Especially critical with new
technologies
10
ALIGN THE SAMPLE WITH THE POPULATION
•
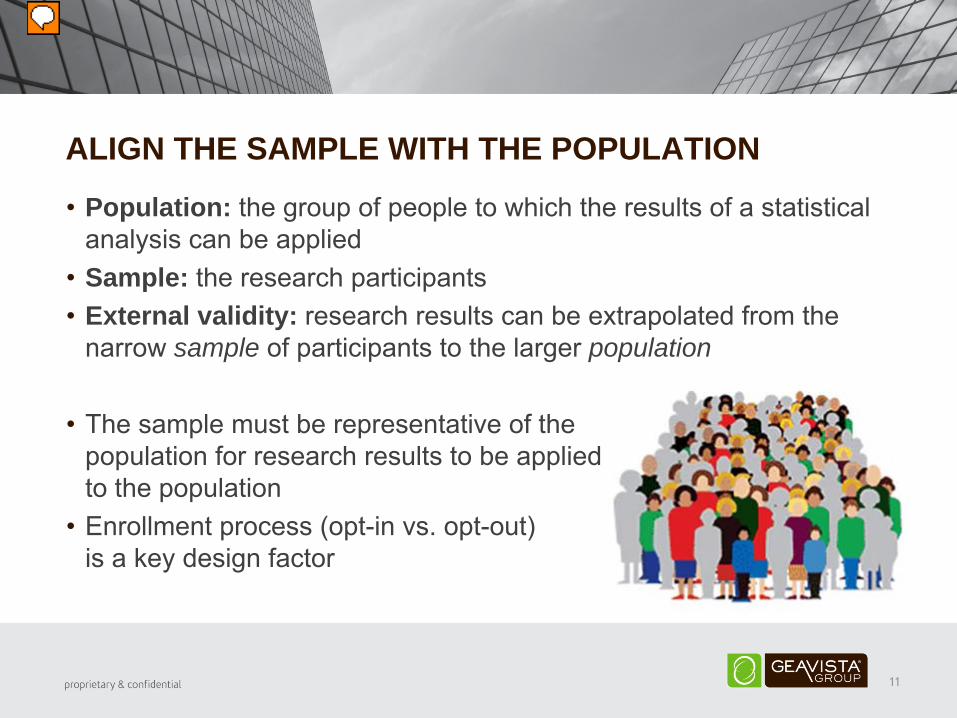
Population: the group of people to which the results of a statistical analysis can be applied
•
Sample: the research participants•
External validity: research results can be extrapolated from the narrow sample of participants to the larger population
•
The sample must be representative of the
population for research results to be applied
to the population•
Enrollment process (opt-in vs. opt-out)
is a key design factor
11
INCLUDE A CONTROL GROUP
•
Control Group: participants who do not receive the treatment•
Internal Validity: ability to determine a cause-and-effect relationship between an independent variable and a dependent variable
•
When the control group is similar to
the treatment group, differences in the
dependent variable can be attributed to
the treatment•
Random assignment to treatment/control
groups eliminates selection bias, increasing
internal validity
12
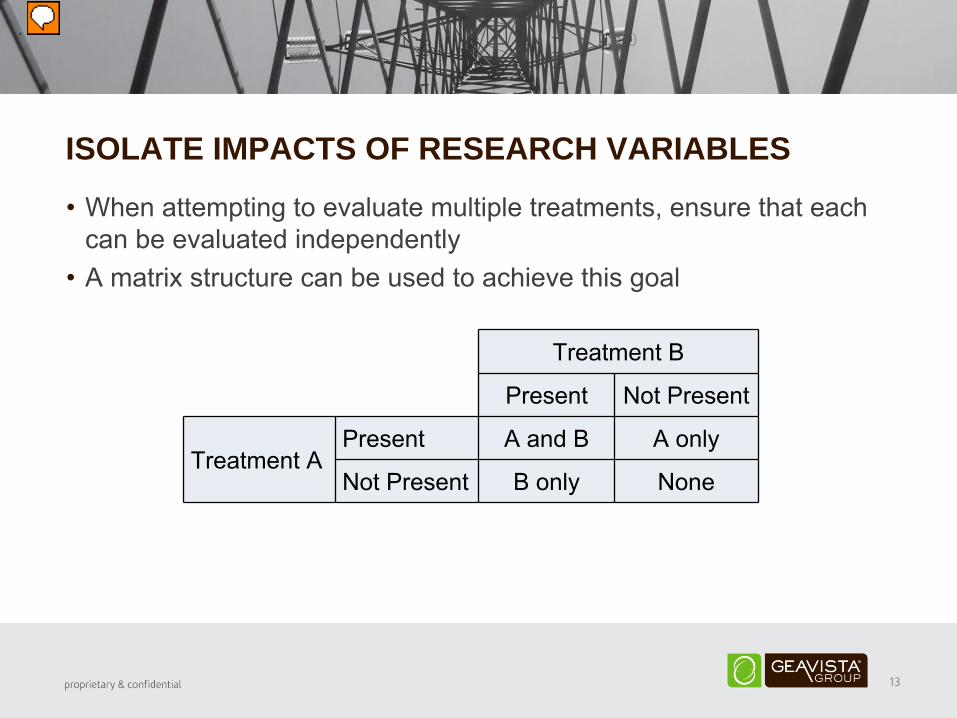
ISOLATE IMPACTS OF RESEARCH VARIABLES
•
When attempting to evaluate multiple treatments, ensure that each can be evaluated independently
•
A matrix structure can be used to achieve this goal
13
Treatment B
Present Not Present
Treatment APresent A and B A only
Not Present B only None
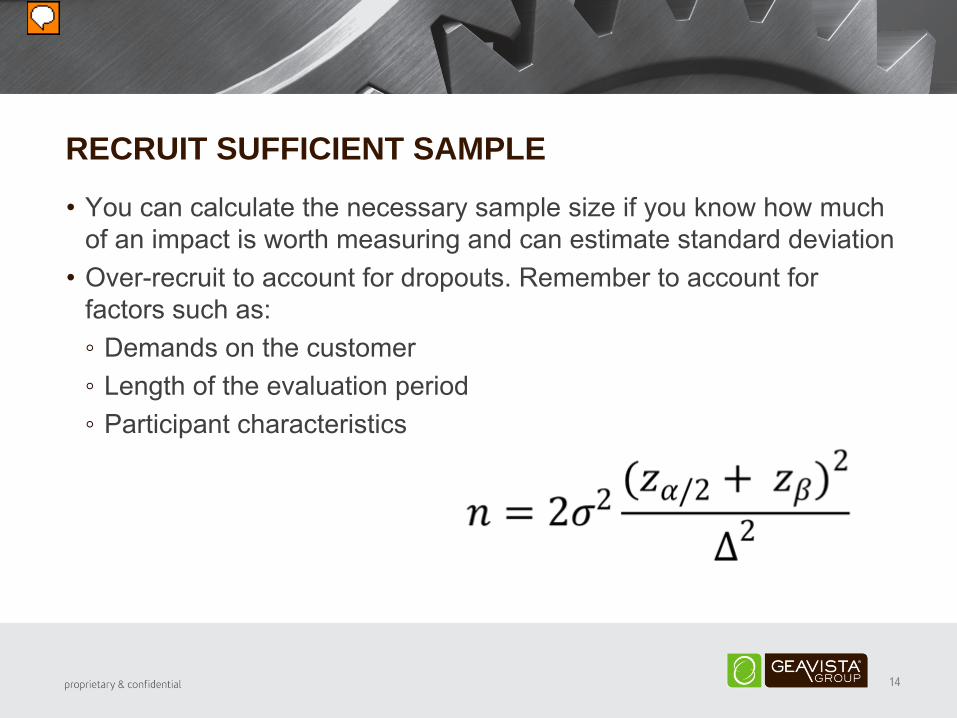
RECRUIT SUFFICIENT SAMPLE
•
You can calculate the necessary sample size if you know how much
of an impact is worth measuring and can estimate standard deviation•
Over-recruit to account for dropouts. Remember to account for factors such as:◦
Demands on the customer◦
Length of the evaluation period◦
Participant characteristics
14
GATHER RELEVANT DATA
•
Plan for an assessment period sufficient for evaluation of long-term impacts; results cannot be assumed to extend for a longer period
than they have been evaluated•
Combine various data sources to
improve understanding of impacts,
for example:◦
Weather data◦
Data from other utility programs ◦
Participant characteristics
and feedback
15

16
CASE STUDY: AEP TEXAS SMART VIEW PROGRAM
INTERNAL PILOT
•
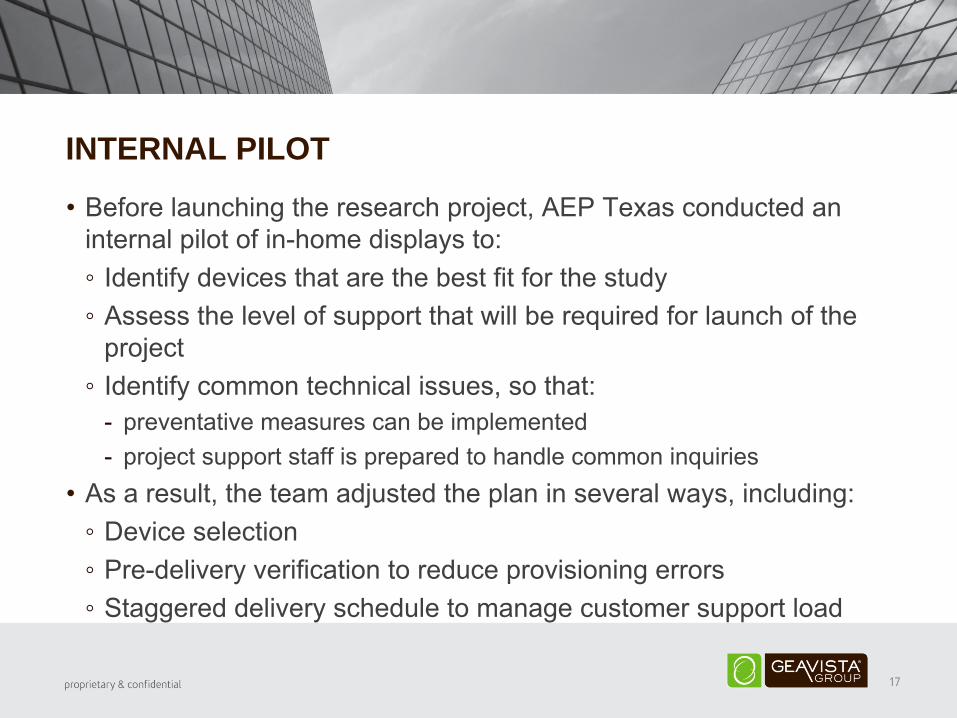
Before launching the research project, AEP Texas conducted an internal pilot of in-home displays to:◦
Identify devices that are the best fit for the study◦
Assess the level of support that will be required for launch of the project
◦
Identify common technical issues, so that:-
preventative measures can be implemented -
project support staff is prepared to handle common inquiries•
As a result, the team adjusted the plan in several ways, including:◦
Device selection◦
Pre-delivery verification to reduce provisioning errors◦
Staggered delivery schedule to manage customer support load
17
SAMPLING PLAN AND SCREENING METHODOLOGY
•
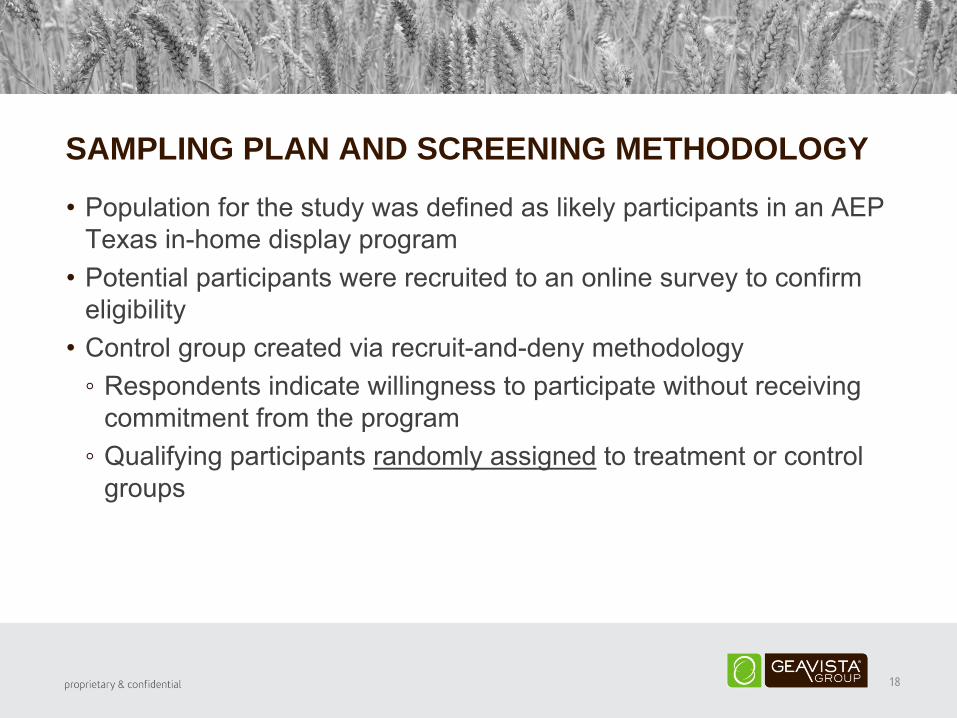
Population for the study was defined as likely participants in an AEP Texas in-home display program
•
Potential participants were recruited to an online survey to confirm eligibility
•
Control group created via recruit-and-deny methodology◦
Respondents indicate willingness to participate without receiving commitment from the program
◦
Qualifying participants randomly assigned
to treatment or control groups
18

BEST PRACTICES CHECKLIST
•
Begin with a soft launchAlign the sample with the population•
Include a control group•
Isolate impacts of research variables•
Recruit sufficient sample•
Gather relevant data
19
RECRUITMENT SOFT LAUNCH
•
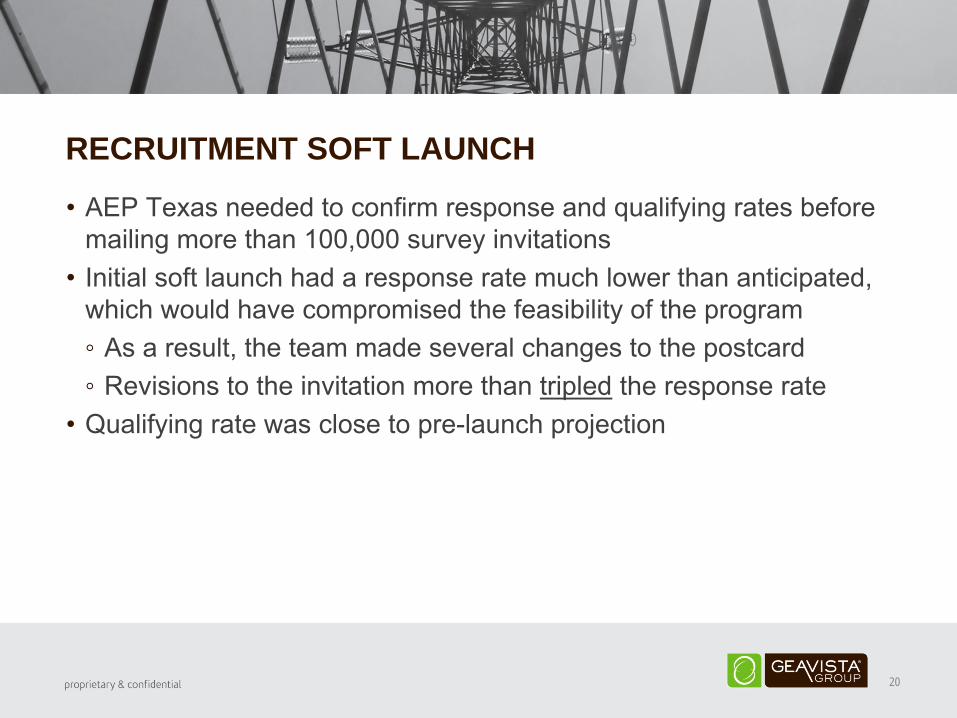
AEP Texas needed to confirm response and qualifying rates before
mailing more than 100,000 survey invitations•
Initial soft launch had a response rate much lower than anticipated, which would have compromised the feasibility of the program◦
As a result, the team made several changes to the postcard◦
Revisions to the invitation more than tripled
the response rate•
Qualifying rate was close to pre-launch projection
20

BEST PRACTICES CHECKLIST
Begin with a soft launchAlign the sample with the population•
Include a control group•
Isolate impacts of research variables•
Recruit sufficient sample•
Gather relevant data
21
TREATMENT GROUPS
•
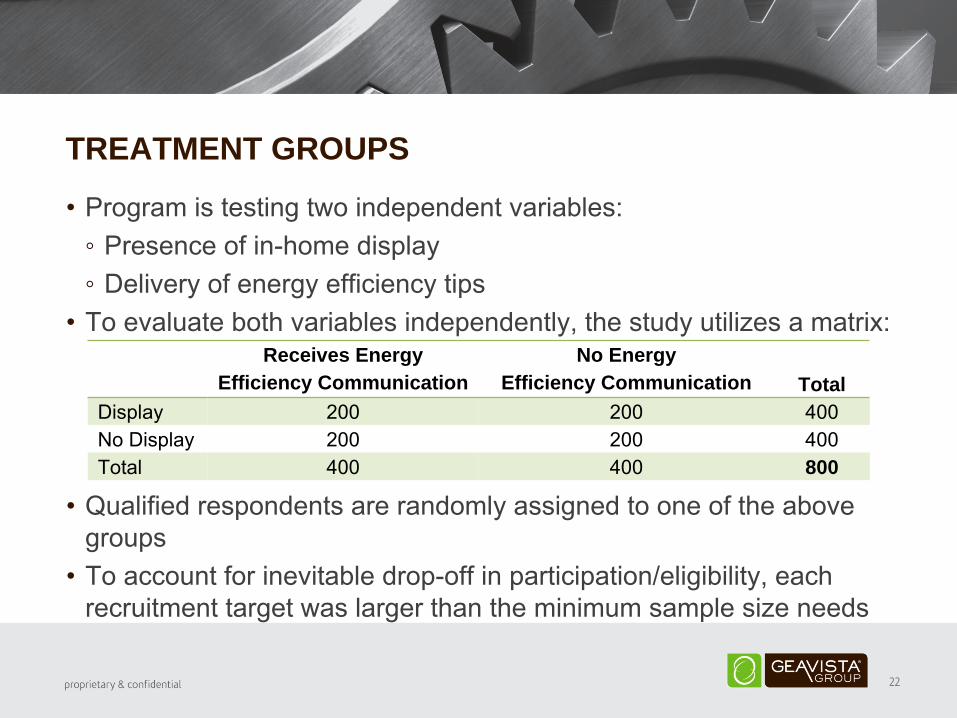
Program is testing two independent variables:◦
Presence of in-home display◦
Delivery of energy efficiency tips•
To evaluate both variables independently, the study utilizes a matrix:
•
Qualified respondents are randomly assigned to one of the above groups
•
To account for inevitable drop-off in participation/eligibility, each recruitment target was larger than the minimum sample size needs
22
Receives Energy Efficiency Communication
No Energy Efficiency Communication Total
Display 200 200 400No Display 200 200 400Total 400 400 800

BEST PRACTICES CHECKLIST
Begin with a soft launchAlign the sample with the populationInclude a control groupIsolate impacts of research variables•
Recruit sufficient sample•
Gather relevant data
23
SAMPLE SIZE
•
Minimum sample size was calculated based on the formula for a two-
sided test comparing means of independent samples•
Because the calculated minimum sample size was low, a second calculation was used to demonstrate the value of increasing the sample size beyond the minimum required◦
This calculation was based on the confidence interval for comparing means of independent samples
◦
The “n”
was manipulated upwards to demonstrate how more participants lead to more precision
24

BEST PRACTICES CHECKLIST
Begin with a soft launchAlign the sample with the populationInclude a control groupIsolate impacts of research variablesRecruit sufficient sample•
Gather relevant data
25
ASSESSMENT PERIOD
•
Due to a hard deadline at the end of 2013, the AEP Texas SMART View Program will include an assessment period of ~14 months◦
Provides a window into impacts beyond the first year◦
If savings are achieved in the final months of the program, follow-up analysis will be recommended to assess full persistence of impacts
26
POST-TREATMENT SURVEY
•
After the completion of the assessment period, the program team will conduct a survey of participants to assess:◦
Participant perception of IHDs’
impact◦
Participant satisfaction with the device◦
Changes in awareness/understanding levels evaluated during initial survey
◦
Other factors that may have impacted energy usage•
Survey data will be combined with participation data from other AEP Texas energy efficiency programs to provide insight into:◦
Cross-program benefits◦
Qualitative participant experience feedback◦
Additional factors that impact energy saving
27
BEST PRACTICES CHECKLIST
Begin with a soft launchAlign the sample with the populationInclude a control groupIsolate impacts of research variablesRecruit sufficient sampleGather relevant data
28


![[PPT]Consumer Behavior and Marketing Strategy - Lars … to CB.ppt · Web viewIntro to Consumer Behavior Consumer behavior--what is it? Applications Consumer Behavior and Strategy](https://static.documents.pub/doc/80x56/5af357b67f8b9a74448b60fb/pptconsumer-behavior-and-marketing-strategy-lars-to-cbpptweb-viewintro.jpg)


