48
Effective Writing at Harold Washington College Harold Washington College Assessment Committee Spring 2013 30 E. Lake St. Chicago, IL. 60601 312-553-5600/ hwc.ccc.edu

Effective Writing at
Harold Washington College
Harold Washington College Assessment Committee Spring 2013
30 E. Lake St.
Chicago, IL. 60601
312-553-5600/ hwc.ccc.edu
1
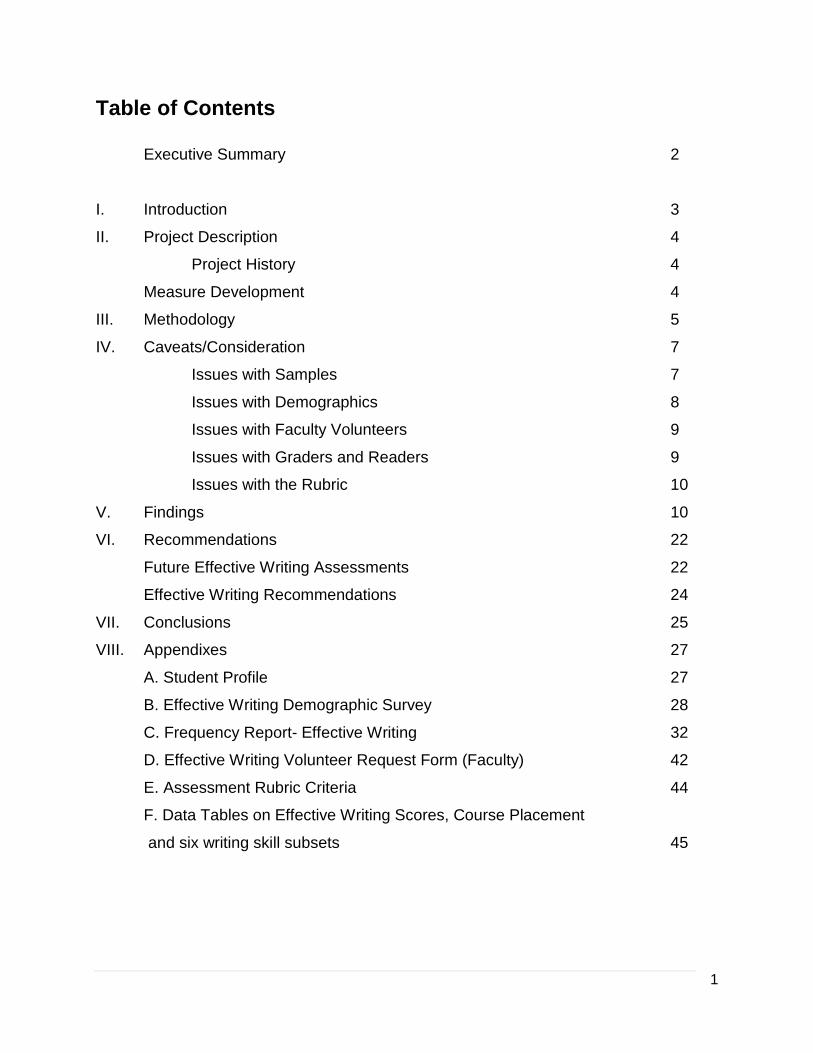
Table of Contents
Executive Summary 2
I. Introduction 3
II. Project Description 4
Project History 4
Measure Development 4
III. Methodology 5
IV. Caveats/Consideration 7
Issues with Samples 7
Issues with Demographics 8
Issues with Faculty Volunteers 9
Issues with Graders and Readers 9
Issues with the Rubric 10
V. Findings 10
VI. Recommendations 22
Future Effective Writing Assessments 22
Effective Writing Recommendations 24
VII. Conclusions 25
VIII. Appendixes 27
A. Student Profile 27
B. Effective Writing Demographic Survey 28
C. Frequency Report- Effective Writing 32
D. Effective Writing Volunteer Request Form (Faculty) 42
E. Assessment Rubric Criteria 44
F. Data Tables on Effective Writing Scores, Course Placement
and six writing skill subsets 45

2
Executive Summary
This report outlines the methodology, key findings and recommendations from the
Effective Writing Assessment, undertaken by the Harold Washington College
Assessment Committee (HWCAC) in the fall semester, 2011. Forty-nine class sections
submitted a total of 714 usable samples of student writing for this specific college-wide
assessment. The sample size was just under 10% of the student population and a close
match in key demographic areas such as gender, race and ethnicity. It is noted that
these categorizations have become more complex than those used in federal reporting
requirements.
A team of ten faculty graders was recruited: five from the English Department and five
from other college disciplines. A small-scale pilot ran in the summer of 2011, and inter-
rater reliability training was provided at the beginning of fall semester before this large-
scale grading task was undertaken. Grading faculty were compensated by a reduction
in their registration hours, a new strategy for recognizing the additional and necessary
work required for large scale college-wide assessments. Despite concerns expressed
by non-English faculty, there was no significant difference in their grading capabilities;
indeed, their scores for student writing samples were a little tougher. It was also found
that handwritten student writing samples were graded significantly lower than those that
were typed. Additionally, a range of caveats is explored, revealing lessons to be
learned in future iterations of our Effective Writing Assessment.
Effective Writing findings are presented in two key areas: methodological and writing
outcomes in relation to a range of student variables. No correlation was found between
the strength of students’ writing and the number of college credit courses they had
completed at HWC or elsewhere. The amount of writing expected of students across
different college disciplines is explored, as is the key impact of initial placement in
English courses on effective writing skill in aggregate and in six specific subset skills
that constitute this vital student capability.
The report concludes with seven important recommendations for the improvement of
effective writing at Harold Washington College. Most significant in these
recommendations is the call for fundamental changes in the placement, outcomes and
success trajectories of students who enter college underprepared for college-level
writing. This call for change is placed within the national context of the important
successful completion agenda and provides solid evidence to support significant
reforms in community college practices to improve effective writing outcomes.

3
Introduction
This report outlines the methodology, key findings and recommendations from the
Effective Writing Assessment undertaken by the Harold Washington Assessment
Committee (HWCAC) in the fall semester, 2011
In the fall of 2011, the HWCAC conducted a college-wide assessment of effective
writing as a part of the broader general education outcome of Oral and Written
Communication. This project began two years earlier when it was decided by the
committee to look at student writing in the broadest context possible. The committee
developed the learning outcomes associated with effective writing, and subsequently a
methodology for how the assessment was to take place. It was decided that the way to
get the most authentic writing samples from across the campus was to collect writing
from assignments that were already taking place in the classrooms across all
disciplines. Although this created challenges for data collection, the committee was
committed to assessing writing that came from within the classroom experience-not
writing that was created specifically for the Effective Writing Assessment.
A sub-committee drafted a broad rubric that could be used for a variety of writing
samples. A comprehensive demographic survey was written that would capture student
demographic data, academic progress and attitudinal information.
In fall 2011, a pilot was conducted with approximately 100 writing samples from a small
sample of classes. The demographic survey was administered to the students in order
to look for potential problems, to test strategies for the general assessment and to
minimize any technological difficulties in advance of the full data collection process.
The pilot also provided the writing samples that were used to train the readers for the
actual assessment as part of our inter-rater reliability strategy for the multiple faculty
graders required for this college-wide writing sample.
As is common practice at HWC, faculty volunteers were solicited to gather student
writing samples from their courses and to administer the survey to those same students.
The committee was hoping for a sample of 1,000 students, however, just over 700
student samples were collected. Faculty volunteers came from the English, Math,
Humanities, Art, and Applied Sciences departments. The writing samples varied greatly
in content and length. Each writing sample was submitted anonymously, yet numbered
to match their demographic survey information.
Ten faculty members assessed the writing samples using an effective writing rubric.
Each “reader” assessed just over 70 samples in the first round, the same number in the

4
second round, and only 10 or 11 samples for a third round. The reading and grading
process was completed during the spring 2012 semester.
This report was completed during the summer and fall of 2012.
II. Project Description
Project History
The Assessment Committee began the task of defining the general education goal of
Oral and Written Communication as far back as 2003. A cross-disciplinary group of
faculty and administrators defined the outcomes and the then-current (2010-2011)
Assessment Committee wrote the student learning outcomes associated with the
specific subportion of the goal that was called “written communication.”
The SLO’s for effective writing were formally approved in spring of 2011.
Student Learning Outcomes - The student will be able to:
1. Compose texts across multiple disciplines and for various audiences, occasions and
purposes.
2. Construct texts for communication, information, and expression which adhere to the
rules of Standard Written English;
3. Compose texts that are focused, well-organized, and well-developed.
Once the SLO’s were approved by the HWCAC, the plan to move forward was
approved. A measure was developed, a rubric was written, and a timeline was created.
The pilot, the assessment itself, and the grading were completed during the fall
semester 2011 and the spring semester 2012.
Measure Development
The demographic portion of the assessment was developed to capture student
demographic data as well as perceptions about writing. The primary goal of this portion
of the assessment was to check the validity of the sample and to test links between the
affective domain and actual writing skills. It was also designed to examine students’
perceptions as they relate to the process of writing, their feelings about writing, and their
experiences about writing at HWC and in their lives outside of school.
The demographic survey was divided into several sections. The first was purely
demographic, asking about gender and background. The second part asked about
student academic status, such as credits completed at HWC and/or other institutions

5
and levels of writing courses completed. We have previously used these data to create
methodological student journeys to capture skill shifts as students progress through
college.
The third portion asked about student understanding of the role of writing in their lives
and their futures. The fourth section looked at student’s self-assessments about the
levels of their ability and confidence in their writing skills. The fifth and final section
asked about how frequently students were assigned writing tasks in the departments of
the college, so that we could ascertain how and where students report practicing their
writing skills.
The five-section survey, the grading rubric, and the student writing samples made up
the whole of the Effective Writing Assessment.
III. Methodology
The Effective Writing Subcommittee and the Assessment Committee as a whole spent a
considerable amount of time considering a variety of assessment measures to examine
our general education goal of effective writing. It was decided by committee to develop
a measure that was commensurate with the kinds of writing that is assigned throughout
the college. We wanted to look closely at a variety of writing samples that were a true
sample of how students write in a variety of disciplines, for a variety of purposes, and for
a variety of audiences.
Through that process, it was decided that the assessment would look at writing samples
that came from coursework occurring throughout the college during a three-week span
from week 10 to week 13 of the semester. From experience we knew that waiting until
the latter half of the semester would provide us with samples from students who were
steadfast in their studies with intentions to complete the semester.
The Effective Writing Subcommittee wrote and revised a rubric that would capture the
stated learning outcomes for effective writing. It consisted of six categories (areas of
attainment): Focus, Organization, Voice, Coherent Development and Elaboration,
Conventions, and Style and Diction. Each of these categories correlated to a three-point
scoring scale:
3 2 1 0
Very Competent Competent Below Competent Unsatisfactory

6
During the fall semester 2011, the Assessment Committee conducted a pilot of the
Assessment. This was done to reveal out any potential problems, to train graders to
read writing samples and use the rubric to assess them.
After completing the pilot, the subcommittee developed a timeline for completion of the
assessment. This consisted of a 12 week schedule to ensure that the college was well-
informed of the upcoming assessment, to ask for and confirm faculty volunteers, plan
the distribution of surveys to the selected course sections, and develop written
instructions for the administration of the survey and for the collection of the writing
samples.
As per past practices at HWC, faculty members across the disciplines were asked to
participate by volunteering course work for assessment. An open invitation from the
Chair of the sub-committee was posted electronically to all full-time and part-time
faculty. After the volunteers had been identified, instructions explaining the process
were communicated to them. Faculty volunteered 55 sections of courses, but it was
determined that 6 were ineligible to participate. Those sections were excluded either
because they were developmental (therefore not in the purview of our charge) or they
were not college courses at all (e.g. Tutoring Center). The total number of prospective
writing samples from the 49 volunteered sections totaled 1,291.
The hope of the committee was to collect writing samples from 10% of the credit-
earning students at that time, providing a target of 1,000 student writing samples.
Although we had 49 eligible sections of courses volunteered, we only garnered 714
samples. This can be attributed to class attrition, overestimation of completed and
submitted assignments by faculty, and a small number of faculty who did not participate
even though they had volunteered. The samples came from a broad range of courses
throughout the college. Day students, night students, and Saturday students were
represented in the sample. Each department participated except Social Sciences and
Business/CIS.
Each writing sample was scored in six areas: focus; organization; voice; coherent
development and elaboration; writing conventions; and, style and diction. We used ten
volunteer faculty graders, mostly HWCAC members and others recruited specifically for
the task. All received inter-rater reliability training and were given remission from
registration hours so that they had the time to undertake this large additional grading
obligation. Graders reported that scoring the writing samples was challenging because
there was a great variety of assignments from different courses and departments. Also,
faculty are used to grading student work only from within their own discipline rather than
from a campus-wide sample of writing artifacts. After each sample was read twice, the
scores were analyzed to determine inter-reader agreement.

7
The distribution of the absolute differences of the two raters was modeled as a
probability distribution of a gamma function to account for both spread and skewness.
The fitting was accomplished by least squares optimization implemented in the GNU
Scientific Library for C (GSL 1.15). This type of optimization is appropriate since it seeks
to optimize the ordinate data (rater difference) respective to a constrained abscissa. A
cumulative Krippendorff’s alpha agreement test was applied to the data in statistical R
2.15.2. A cutoff of .8, the de facto standard determined by Fleiss JL, Levin B, Paik MC
(Statistical methods for rates and proportions, 3rd ed. Hoboken: John Wiley & Sons
2003) to be “very good”, was chosen for this analysis. The Krippendorff alpha test was
chosen over other Alpha and Kappa tests since it can be applied to interval data and is
not limited to two raters. Essays that had less than a .8 alpha agreement were selected
for a third read. With this statistical analysis and testing 91 samples needed a third
round of reading.
These 714 student writing samples revealed the variety of writing assignments in the
disciplines and departments, and the broad range of students’ writing abilities. The
assessment also showed academic departments’ strong commitment to the ideal of
writing across the disciplines.
IV. Caveats and Considerations
During spring, 2012, the Effective Writing Subcommittee brainstormed a list of all of the
obvious and not-so-obvious caveats, problems and considerations that were
encountered during the planning, execution and reading of the Effective Writing
Assessment. For the purposes of this report, they are listed in no particular order, but
each should be taken into account when reading and interpreting the data, as well as
when planning our next Effective Writing assessment. These points of methodological
learning fall into five distinct categories. These are: issues with samples, issues with
demographic categories, issues with faculty volunteers, issues with faculty graders, and
issues with our grading rubric.
Issues with the Samples
Despite instructions for faculty to submit ungraded and unmarked student writing
samples, this was not always the case. There was also huge variety in the length of
student writing samples, although parameters for length were also provided beforehand.
Graders had to apply the same rubric to 12-page essays and to one-paragraph
responses.
In our request for writing samples, instructors were asked to provide the context and or
the prompts provided to students that generated the specific submitted student writing

8
samples. In actuality, not all volunteered writing samples provided this information;
meaning graders did not have the context and prompts provided by instructors.
However, some of the assignments included detailed instructions that seemed to
provide the foundation for the student’s written work, thus graders could easily
understand the context of these writing samples.
Issues with the Demographics
Students were asked about the number of HWC courses numbered 101 and above they
have “successfully completed” at HWC, we do not know if some students counted
earning an “F” or a “D” as completion, while others may have only counted the courses
that they passed. This is an issued we must consider in future assessments when we
ask students to self-report course completion. Adding definitional guidance in these
questions would help gain clarity and increase validity in these aspects of our survey.
The survey’s questions about the first writing course completed at HWC and the
highest-level writing course completed at HWC with a “C” or better did not take into
account the number of courses that had to be repeated in relation to the student’s
performance on the Effective Writing Assessment. Nor did we ascertain, through
student self-report the level at which each student actually began his/her college career
if that student first took writing courses at other colleges. Therefore, the data presented
here concentrates predominantly on HWC course experience and skill development.
The survey’s question about the highest-level writing course students had completed at
HWC with a grade of “C” or better does not take into account the total number of
college-level English/Composition courses taken by a student. Therefore, a student
who took several college-level English/Composition classes at another college or
university, and who had not taken any English/Composition courses at HWC might be a
very strong writer as a result of his/her past experiences in college-level writing courses.
On the survey, this student is indistinguishable from another student who had never
taken any college-level English/Composition courses, but in reality these students have
very different academic backgrounds that are not completely accounted for by the data.
In our protocol and the subsequent college-wide writing sample we have no way of
knowing if the submitted work was immediately produced or writing that had been
revised. Therefore, the same rubric was applied to first drafts and to third or final drafts.
This is in large part an effect of a data gathering methodology in which our usual “test”
conditions had been removed. However, it probably reflects the diversity of student
work, in that some will be well researched, planned and the result of numerous drafts
and some will be rushed responses with little planning, research and drafting. In the

9
future, it would be helpful to have data about the nature of the writing sample factored
into the writing sample.
Issues with the Faculty Volunteers
This is the first time we have collected authentic student writing samples as our primary
assessment data. This required considerable effort on behalf of contributing faculty and
also required that they followed our well-thought out protocol. This was an unreal
expectation for a campus-wide data gathering process. As previously noted, guidelines
about writing sample length were not always followed, nor was the provision of the
writing prompts to accompany a batch of student writing samples.
In rare cases, faculty submitted student responses to numbered questions (without
necessarily providing the corresponding questions) instead of submitting well developed
writing samples from students; these samples provided challenges for graders.
Despite a range of attempts to encourage student samples from across campus
including all departments and disciplines, we were unable to secure writing samples
from the Social Sciences Department, and the Business/CIS Department.
Issues with the Graders and Readers
Inter-rater reliability training included two writing samples from different disciplines but
similar length that matched the protocol guidelines. Inter-rater reliability training did not
include detailed explanations for what to do in the cases of writing samples that were
outside the scope of what was requested. Therefore, writing samples that were
answers to numbered questions, or one-sentence responses, or of a variety of lengths,
were left to the individual judgments of graders.
We were also deliberate in having a mix of English faculty and non-English faculty as
our graders. This led to some concern from non-English faculty graders about their own
skill level in reading and grading such a broad diversity of writing samples. In allocating
writing samples, we were intentional in ensuring an English faculty member and a non-
English faculty member graded every writing sample. This speaks to the strength and
diversity of HWC’s Assessment Committee participation. All graders we supported in
this extensive and extra grading workload by an agreement with HWC administration to
use registration hours for this tasks. This was a no-cost strategy developed by the
HWCAC in response to our more restricted funding environment and the belief that
additional, and extensive, assessment committee work must be institutionally supported
to sustain a strong assessment culture across campus.

10
Issues with the Rubric
We used a six-category rubric to assess the writing samples. There was considerable
debate among sub-committee members about the use of a “Voice” category in our
assessment. For some disciplines this is an important criteria and for others less so.
Some subcommittee members would have preferred to subsume “Voice” into the “Style
and Diction” category.
It was decided to create a descriptive rubric rather than a holistic rubric. Each of the
categories is a better indicator of student performance in specific areas of Effective
Writing than the total score is. This is important to remember when considering our
findings.
These total scores do not translate easily or directly into percentages or equivalent
grades, as this would be impossible in a decontextualized assessment. Much
discussion took place over how to make sense of these total scores. Whereas, the total
score may be an overall indicator of student performance on some level, (a total score
of 6 indicates an overall poor performance on this assessment), a score of 11 may
indicate several things (very high scores in 2 categories and very low scores in others).
In the presentation of findings we present the actual grading number from the 0 to 18
scale. We also accompany these actual grades with a roughly equivalent percentage
grade. This is done for reasons of accessibility of the findings. Caution should be used
in over-interpreting these normalized percentage scores: no student writing was graded
on a 0 to 100 scale.
V. Findings
1. Sample Validity
In fall 2011 Harold Washington College had 5,158 full-time students and 4,193 part-time
students for a total of 9,351 students. This census data is from October 2011 and is
based on the Day-10 enrollment information. The assessment committee wanted to
sample 10% of the student body with a goal of just around 1000 writing samples. Once
all of the samples were gathered, we had just over 700 samples. Historically, the
enrollment at the halfway mark is far less than that of the day-10 enrollment and it
continues to decline as the semester progresses. Our samples were collected from the
tenth through twelfth week of the semester, when enrollment has dropped dramatically.
Whether or not our sample comprised 10% of the enrollment population is unclear,
however, the 714 students represent what we believe to be very close to the 8-10%
mark.

11
2. Demographics
In fall 2011, 54.9% of the student population was female and 45.1% of the student
population was male. In our assessment we asked more complex gender questions
and thus our student sample self-identified as 65.69% female, 33.75% male and 0.56%
“other”. It is not known why we achieved a student sample that was more female,
perhaps there are different and gendered persistence rates leading to our week 10
through week 12 sample losing male students.
The racial/ethnic breakdown is shown below, where again our assessment committee
demographic categories are not an exact match for those required by Federal racial and
ethnic higher education reporting requirements.
HWC Total Effective Writing Sample Total
Asian 9.56%
Asian/Pacific Islander 11.9%
Native Hawaiian/Pacific Islander 1.19%
American Indian or Native Alaskan 0.4% 1.88%
Black/Non- Hispanic 35.7% 37.88%
Hispanic 30.4% 42.9%
White/Non Hispanic 18.3% 29.35%
Unknown 3.3%
Multi-Racial 20.14%
It is clear from the above chart, that our sample represented a wide range of racial and
ethnic self-identifications and indicates a close, if not perfect, sample of the HWC
student body.

12
Findings 3: Total Effective Writing Scores
The above distribution graph represents the total median score of each essay, with a
score of 11.5. Below are the mean, median and standard deviation.
Findings 4: Effective Writing Scores across six grading categories
Section Mean Median S.D.
Section Mean Median S.D.
Total Essay 11.68 11.50 3.00

13
Focus 2.23 2.33 0.53
Organization 1.93 2 0.57
Voice 2.10 2 0.54
Development 1.90 2 0.61
Conventions 1.67 1.5 0.66
Style 1.85 2 0.62
This chart represents the breakdown of score based on the 6 areas of the rubric.
Students scored the highest on Focus, with a 2.33 out of 3, and the lowest on
Conventions, with a 1.5 out of 3.
We also wanted to investigate the data to see if other effective writing issues, ones that
had much concerned the assessment committee during our planning stages, could be
supported in these data. Thus we looked at whether the disputed category of “Voice”
had any influence in the overall ratings of these diverse writing samples. These data tell
us that there is no statistical difference in total scores after removing “Voice” as a
category.
0
20
40
60
80
100
120
0 1 2 3 4 5 6 7 8 9 10 11 12 13 14 15
Fre
qu
en
cy
Total Essay Score Without Voice
Total Essay Score Distribution Without Voice

14
Findings 5: Performance differences between typed samples and handwritten samples
We had also expressed some concern, when seeing the vast array of samples we had
collected, as to whether well-presented and typed student writing samples would be
graded differently from those that were handwritten. Some of the handwritten samples
were clearly challenging in terms of legibility.
Typed Writing Sample
Handwritten Writing Sample
Mean 66.47% 63.58%
Median 66.67% 62.96%
S.D. 15.93% 17.47%
p-value 0.0218
The data chart above compares handwritten writing samples to those that were typed.
Typed samples scored on average 3% better than handwritten samples. This is a
statistically significant difference. We may have an expectation that all college-level
written work should be word processed, perhaps this finding should be clearly
communicated to all students, to ensure they are receiving the maximum grade for their
work.
Findings 6: Faculty grader differences – comparison between English and non-English faculty As already identified, we had expressed some concerns about faculty grading
differences, despite successful inter-rater grading reliability training. This was
especially the case with non-English faculty who, in large part, felt less confident in their
grading capabilities than English faculty who were both experienced in the mass
grading of student written work. The following table shows the mean grading
performance of each grader.
Grader Mean S.D. Discipline
1 12.00 4.00 Non-English
2 12.02 3.10 English
3 11.49 4.51 English
4 13.75 3.80 English
Section Mean Median S.D.
Total Essay 9.58 9.50 2.56

15
5 9.90 3.41 Non-English
6 11.49 3.25 English
7 10.69 3.48 Non-English
8 12.15 2.51 English
9 12.00 4.30 Non-English
10 10.94 2.93 Non-English
Grader Mean S.D T-test
English 12.18 0.93 0.10
Non-English 11.10 0.90
The above data charts describe the variations in grading means between the 10 graders
as well as the difference between English faculty as graders and non-English faculty as
graders. The means ranged from a high of 13.75 (from an English faculty grader) and a
low of 9.90 (from a non-English faculty grader). There is no statistical difference
between the English faculty and non-English faculty graders as two distinct groups. It
also appears non-English faculty were a little tougher in their grades in general.
Methods Pearson Correlation Cohen’s
Kappa
Krippendorff’s
Alpha
2 reads 0.59 0.56 0.62
3 reads 0.83 0.78 0.89
This data chart indicates that samples that are read three times result in higher inter-
rater reliability. The Pearson Correlation, Cohen’s Kappa and Krippendorff’s Alpha data
analysis describes a perfect correlation or agreement as “1”. Three readers score much
closer to “1” than two readers. In reality, the choice of number of readers was both a
resource and quality decision. We decided that both a non-English and an English
faculty member should grade all writing samples. Third reads were only allocated when
the two grades difference fell below the .8 alpha cut-off.

16
Findings 7: Effective Writing Performance and Number of Courses
Taken
We are always interested in exploring student capabilities and how these are impacted
as they progress in their academic journey with us and with other higher education
institutions. We use broad credit course categories to represent student progress.
Credits HWC Other HE Institutions
60+ 62.16% 68.59%
45-60 65.71% 70.41%
31-45 67.09% 65.56%
16-30 66.29% 64.20%
0-15 64.90% 64.90%
Pearson Correlation 0.0044 0.0751
According to the above data chart, there is no correlation between the total essay score
and the number of credits obtained at Harold Washington College. This is also true of
credits taken at another institution. Therefore, the number of credits a student has
taken was not a good indicator of how students performed in this Effective Writing
Assessment.
Finding 7: Effective Writing Performance compared to self-reported
confidence in specific writing skills.
We asked students to report their confidence levels in overall writing and in six specific
skill areas through which we could differentiate effective writing quality. The six skills
sets are: Focus, Organization, Use of Supportive Evidence, Correct Spelling and
Diction, and Grammatical Fluency.
Confidence and Focus:
“I am confident in my ability to write a clearly focused essay.”
Focus Confidence Mean Focus Mean Total
Agree Strongly 78.78% 69.52%
Agree 74.21% 64.71%
Disagree 68.58% 58.75%

17
Disagree Strongly 75.93% 57.41%
Pearson Correlation 0.1625 0.2050
There is a very low correlation between the focus score and student confidence in that
area. There is a very low correlation between the total essay score and student
confidence in the area of focus. Student confidence is better correlated with their total
score than the specific area of focus.
Confidence and Organization:
“I am confident in my ability to effectively organize and essay.”
Organization Confidence Mean Organization Mean Total
Agree Strongly 67.09% 68.53%
Agree 64.90% 64.97%
Disagree 58.85% 59.16%
Disagree Strongly 62.50% 59.38%
Pearson Correlation 0.1156 0.1693
There is a very low correlation between the effective organization score and student
confidence in that area. There is a very low correlation between the total essay score
and student confidence in the area of effective organization. Student confidence is
better correlated with their total score than the specific area of effective organization.
Confidence and Supporting Evidence:
“I am confident in my ability to use examples and evidence from text, experience,
or imagination to support my thesis.”
Coherence Confidence Mean Coherence Mean Total
Disagree Strongly 67.34% 69.20%
Disagree 62.25% 64.42%
Agree 64.37% 63.47%
Agree Strongly 60.37% 62.24%
Pearson Correlation 0.0986 0.1273

18
There is a very low correlation between the coherence score and student confidence in
that area. There is a very low correlation between the total essay score and student
confidence in the area of coherence. Student confidence is better correlated with their
total score than the specific area of coherence.
Confidence and Correct Spelling and Diction:
“I am confident in my ability to write an essay using correct spelling and diction.”
Style and Diction Confidence Mean Style and Diction Mean Total
Disagree Strongly 60.97% 69.69%
Disagree 55.61% 65.05%
Agree 50.62% 61.23%
Agree Strongly 50.88% 61.94%
Pearson Correlation 0.1381 0.1795
There is a very low correlation between the style and diction score and student
confidence in that area. There is a very low correlation between the total essay score
and student confidence in the area of style and diction. Student confidence is better
correlated with their total score than the specific area of style and diction.
Confidence and Grammatical Fluency:
“I am confident in my ability to demonstrate grammatical fluency through mastery
of standard forms of verb conjugation, punctuation, pronoun use, and complete
sentences.”
Convention Confidence Mean Convention Mean Total
Agree Strongly 67.24% 69.32%
Agree 61.55% 64.87%
Disagree 58.33% 62.19%
Disagree Strongly 53.85% 60.47%
Pearson Correlation 0.1224 0.1474
There is a very low correlation between the convention score and student confidence in
that area. There is a very low correlation between the total essay score and student
confidence in the area of conventions. Student confidence is better correlated with their
total score than the specific area of conventions.

19
Finding 8: Overall self-assessment as a writer and effective writing total score:
“How would you rate yourself as a writer?”
Rating Mean Total
Excellent 69.25%
Above Average 70.25%
Average 63.52%
Below Average 58.77%
Poor 54.29%
Pearson Correlation 0.2178
The above data chart describes students’ self-reports as writers. There is a positive
correlation between how students rate themselves as writers and their scores on the
effective writing assessment. Student confidence in a particular aspect of their writing is
better correlated with their overall writing than that area. These students are not
capable of specifying their confidences or abilities in the skill subsets identified by our
grading rubric.
Finding 9: Effective Writing Performance and highest English course passed with
a C.
In all of our assessments we are interested in student journeys and how these may
impact competence in the general education disciplines. Our English curriculum
contains sequences of courses that students can test into and thus begin their effective
writing journey. There is considerable debate about the testing and placement of
students into English courses and this is an issue we will also specifically address in our
conclusions.
Highest Writing Course Mean S.D.
English 98/99 59.78% 14.53%
English 100/125 59.01% 16.53%
English 100 54.94% 18.79%
English 101 66.23% 17.23%
English 102 68.38% 15.25%
None/ Does not apply 65.53% 17.47%

20
Pearson correlation* 0.2402
The above chart shows a gradual increase in scores from a mean of 59.78% in English
98/99 to a mean of 68.38% in English 102. This is a low positive correlation, but is
statistically significant with a p-value of 0.0369. However, students who completed
English 100/125 as their highest English course scored significantly better than those
who completed the English 100 course only (without the Reading 125).
Finding 10: Effective Writing Performance and Current English Class
Class comparison p-value Mean Score
98/99 - 100 0.8794 59.78% - 54.94%
98/99 - 100/125 0.2906 59.78% - 59.01%
98/99 - 101 0.1618 59.78% - 66.23%
98/99 - 102 0.0369 59.78% - 68.38%
100/125 - 100 0.3623 59.01% - 54.94%
100/125 - 101 0.1007 59.01% - 66.23%
100/125 - 102 0.0182 59.01% - 68.38%
100 - 101 0.0007 54.94% - 66.23%
100 - 102 0.0000 54.94% -68.38%
101 - 102 0.0990 66.38% - 68.38%
This data chart compares the overall scores of students currently in English courses.
The biggest difference in student performance is between students in English 100 and
English 102, followed by English 100-English 101, English 100/125-English 102 and
English 98/99 – English 102. These are statistically significant differences in theses
scores with 95% confidence between the courses.
Total Essay Score
Highest
Course
First Course
English 98/99 English 100/125 English 100 English 101 English 102
Mean SD N Mean SD N Mean SD N Mean SD N Mean SD N
English
98/99
58% 14% 15 - - 0 - - 0 - - 1 - - 0
English - - 8 - - 11 - - 2 - - 0 - - 0

21
100/125
English
100
54% 22% 21 - - 1 56% 17% 27 - - 0 - - 0
English
101
57% 21% 20 57% 11% 16 69% 16% 17 69% 17% 10
5
- - 1
English
102
57% 13% 25 62% 18% 13 63% 17% 20 73% 13% 78 70% 14
%
27
This Effective Writing Assessment discovered a correlation between the students’ initial
placement in HWC’s English Composition courses and the students’ scores on the
assessment. The sequence of composition courses from the lowest to the highest is
the following: English 98/Reading 99 (a developmental course covering writing and
reading); English 100/Reading 125 (a developmental course covering writing and
reading); English 100 (a developmental writing course without reading instruction);
English 101 (a college level writing course); and English 102 (a college level writing
course). In general, the higher students’ initial placement, the higher their mean scores
in our Effective Writing sample.
Students who placed in college level composition courses (101 and 102) were more
likely to receive scores on this assessment equivalent to 70% and higher on the
standard college grading scale. Students who placed in developmental courses (98/99,
100/125, and 100) were more likely to receive scores on this assessment equivalent to
a grade below 70% on the standard college scale. The issue of writing placement and
the findings of this assessment will be discussed further in the conclusion to this report.
However, there were some anomalies in the relation between course placement and
students’ Effective Writing assessment scores. For example, students who placed at
the 101 level and later took 102 received the highest mean score (equivalent to 73%).
However, students who placed at the 102 level received a slightly lower mean score
(equivalent to 70%).
As for students who placed in developmental courses, their scores did not increase to
70% when they reached the 102 level. Indeed, at the 98/99 level, the scores actually
decreased: from 58% to 57%. At the 100 level, there was improvement in their
progress to the 102 level, but the students did not reach the 70% score: 100/125 (from
56% to 62%) and 100 (from 56% to 63%). Thus, the average student requiring
remediation was unable to receive a score on the assessment equivalent to a passing
college grade, despite his or her progress through the composition-course sequence.
These results remained consistent when we tested each of our assessment rubric
criteria individually. The pattern was consistent in focus, organization, voice,

22
development, conventions, and style. The data charts for these findings can be found in
Appendix F.
Finding 11: Effective Writing Performance and Reported Writing Frequency
Never Seldom Sometimes Often
English 35.19% 60.93% 61.60% 65.71%
Humanities 59.29% 61.51% 65.76% 67.82%
Social Sciences 60.24% 61.81% 64.59% 68.09%
Mathematics 65.57% 67.75% 62.00% 62.05%
Natural Sciences 63.08% 65.79% 65.63% 66.31%
Average 56.67% 63.56% 63.92% 65.99%
This data chart shows an increase in performance on the Effective Writing Assessment
based on how frequently the students were asked to write in their English, Humanities,
and Social Sciences courses. We don’t see that same increase in the Math and
Science courses.
VI. Recommendations
The data gathered from the Effective Writing Assessment is revealing. This section is
divided into two distinct areas both intended to support improved student writing across
campus and build our strong body of assessment knowledge. The first set of
recommendations concerns our methodological learning and is intended to improve
future iterations of our effective writing assessment. The second set of
recommendations concentrate on changes, grounded in the extensive data presented
here, designed to improve the quality of effective student writing at HWC.
Future Effective Writing Assessments
Before planning the next Effective Writing Assessment, HWAC members should be
aware of the range of sample issues identified in this report. This was a largely
successful attempt at gathering authentic student writing samples from across campus.
However, as many college managers and administrators know, expecting exact
compliance to complex instructions across all faculty, is a challenge. This reality should
be factored into the next iteration of any Effective Writing Assessment.
We did not reach our target sample size and this probably has a relationship to the
complexity of the task we were asking faculty to do when they volunteered their class
sections. We recommend that any future Effective Writing assessment, that utilizes

23
authentic student writing samples, has a much longer lead-in time to work with
contributing faculty to identify, through advance planning and in their syllabi, the exact
writing samples to be collected and assessed.
It will be up to the Assessment Committee of the future to decide whether or not to
remove the Voice category from the rubric. Although these data do not suggest that
there is any statistical difference between the use of our 6-category rubric, we will no
doubt continue to debate the use of a 5-category rubric, where Voice is subsumed
within the Style category.
As is always the case, the demographics portion of the survey should be revisited so
that it accurately reflects the race, ethnicity and gender categorizations that are
inclusive and accurately capture the diversity of our student body. It should also be
noted we did not look at English 101/197 specifically, and this course should be
included in future Effective Writing assessments.
Despite the initial concerns about equivalency across all ten of our faculty graders, the
data presented here demonstrates strong inter-rater reliability. Our training was short
and completely electronic. It is suggest that future training includes bringing faculty
together to discuss the two writing samples and their grades. Grading faculty should
also discuss a range of “what if” scenarios, to cover the sample issues we encountered
in this assessment.
This was the first time that the graders were compensated for their time by
reassignment of registration duties. This worked as a whole; however, the graders
should be made aware that if the grading continues into the semester, as it did in 2012,
it is their responsibility to ensure that the work gets done, even though registration is
long over.
A minimum amount of writing must be insisted on for the next round of this assessment.
The variations in length proved to be challenging, both as some samples were far too
long and others were far too short. Volunteering faculty should be partnered with well in
advance to maximize the submission of “developed” pieces of student writing. Some
very long full essay samples were less problematic as there was more to base the
scores on; however, they proved to be taxing for the graders.
The next Effective Writing Assessment should include questions in the survey that
probe the use of support services in the college, i.e., the tutoring center, writing tutors,
embedded tutors, etc. Data collected from these types of questions could be useful in
determining who needs services, who seeks services and where those students go for

24
services. We have a strong investment in services to support student writing, it would
be very helpful to know by whom and how these are accessed. It would be informative
to evaluate use and access of writing tutorial support and match this with Effective
Writing assessment results. All college stakeholders have a clear mandate to improve
student skills in effective writing. We recommend that HWC administration explore
ways in which Effective Writing Assessment findings can be matched with strategies to
improve all student support services in maximizing student achievement through strong
writing skills.
It should be noted that neither the Business/CIS Department nor the Social Sciences
Department volunteered any sections for participation in this assessment. Both
departments were appealed to directly and still did not volunteer any writing samples.
Ideally, writing samples should be collected from every department in the college, so
that we can speak across departments and disciplines more thoroughly.
Effective Writing Recommendations
The data contained in this report indicates clear areas for improvement in all three of
our intended student learning outcomes for Effective Writing. Our student learning
outcomes should be reiterated here.
Students at Harold Washington College will be able to:
1. Compose texts across multiple disciplines and for various audiences, occasions and
purposes.
2. Construct texts for communication, information, and expression which adhere to the
rules of Standard Written English;
3. Compose texts that are focused, well-organized, and well-developed.
The data presented here demonstrates that only a proportion of our students are
meeting the above SLO’s and there are many who struggle in their Effective Writing
skills. This is not unexpected, knowing what we know about our student body and their
skills upon entry to college.
We recommend the following:
1. Students who place into English 100 should also be placed in English 125 as
there is clear evidence that the Reading Section (125), which can also be seen
as “wrap around” English preparatory support, is making a difference in student
performance in Effective Writing.

25
2. Students who placed into pre-college English did not perform as well on the
Effective Writing Assessment as those who came in at college level English. In
light of Reinvention Goal #4, the effectiveness of remedial courses needs to be
re-examined with special focus on student learning outcomes, course content,
and teaching/learning pedagogy.
3. Criteria for successful course completion from remedial courses to college-level
English should be re-examined.
4. Application of completion criteria in transitioning students from lower to higher-
level courses should also be re-examined. The data presented here indicate that
approximately a third of this student sample need more practice in the mastery of
the basic writing skills.
5. The data clearly indicates that students who are asked to write more often in
English, Humanities, and the Social Sciences perform better in Effective Writing
than those who are asked to write less often. More frequent writing should be
expected in those disciplines across the board.
6. The data also indicates that there is no correlation in the math and science
disciplines between the frequency of writing that students are asked to do and
how they performed on this assessment. Numeracy issues rightly concern Math
and Science Departments, first and foremost. These departments should be
asked to review how and where student writing is expected in their courses and
how math and science courses can contribute to improving effective student
writing.
7. These students have difficulty assessing themselves as writers. They have more
difficulty assessing themselves in terms of the specific areas of writing (Focus,
Organization, Voice, Elaboration, Conventions, and Style and Diction). When
providing feedback to students about their writing, faculty should provide specific
feedback about where the problems are and how the student can improve in
those areas. Broad statements about written work, in general, are not helpful
and will not improve student writing. Professional development should be
provided to work with all faculty in the best way to give useful feedback to
students to improve student writing specifically.
VII. Conclusions
In HWCAC’s Effective Writing assessment over 700 students provided authentic writing
samples in which there was huge variability. Some writers had a unique voice,
organized and developed their ideas skillfully, and wrote with technical proficiency. On
the other hand, some authors failed to organize and develop their ideas, and clearly
struggled with the basic skills of grammar, punctuation and spelling. There were many
essays and reports that were somewhere between these two extremes.

26
Effective writing is an essential skill for everyone. Harold Washington students who
graduate with a recognized academic qualification should be, at least, competent writers
who are able to produce written communications that serves a diversity of purposes.
The world of work, at all levels, requires people who can write well and effectively
communicate what is required of them. Effective writing is a necessary and much
sought after skill. The data presented here indicate that for a good proportion of our
students, effective writing is a challenge. More specifically, students who test into our
developmental courses, do not perform as strongly as they should at the college level.
Although it is not examined here, we suggest that speedy success in developmental
English courses must be improved, since our data clearly shows that students placing in
pre-credit writing courses continue to underperform in effective writing skills. There a
range of strategies such as gateway courses, embedded tutors, cohorts with mandated
support and services, that are being tested and showing positive results in allowing our
least able students to quickly progress, rather than become disheartened and drop out.
In “Core Principles for Transforming Remedial Education: A Joint Statement”
(December 2012) by the Charles A. Dana Center, Complete College America, Inc.,
Education Commission of the States, and Jobs for the Future, a clear case is made for
change with regard to the success of students who place into what we classify as
developmental courses. On page one they state:
“As states and institutions embark on ambitious reforms, it has become increasingly clear that improving the success of students who are currently assessed and then placed into remedial education courses is pivotal to the college completion agenda in states. With half of all students in postsecondary education taking one or more remedial education courses and college completion rates for those students well below state and national goals, it is critical that remedial education reform is an essential component of state and national college completion efforts at both the institutional and state policy level
This Effective Writing assessment provides specific findings that strongly support this broader picture. As a college we must develop new strategies and responses that change and improve how we respond to students who arrive at our doors unprepared for college-level writing. These data show that HWC students beginning their academic journey with us at higher levels of English capabilities are significantly better at effective writing. This is a key skill that opens up the full college experience to them, broadens their educational understanding and presents more highly valued employment opportunities.
It is hoped this assessment contributes to a college-wide dialogue about how we can all
contribute to improved student writing and thus college success.

27
Appendix A
Student Profile - Fall, 2011
Prepared by the CCC Office of Research and Evaluation, October 10, 2011
Gender
Women Men Total
Number Percentage Number Percentage Number
5,131 54.9% 4,220 45.1% 9,351
Ethnic Background
Total Percentage
Asian/Pacific Islander 1,115 11.9%
American Indian or Alaskan Native 40 0.4%
Black/Non Hispanic 3,335 35.7%
Hispanic 2,843 30.4%
White/Non Hispanic 1,709 18.3%
Unknown 309 3.3%
Enrollment Status
Full-Time-12 or more credits 5,158 55.2%
Part-Time-fewer than 12 credits 4,193 44.8%

28
Appendix B
Effective Writing Demographic Survey
Please fill in marks like this: not like this:
Demographics
1. What is your gender?
o Female
o Male
o Other
2. Are you Hispanic/ Latino? (A Hispanic or Latino is a person of Cuban, Mexican, Puerto Rican,
South or Central American, or other Spanish culture or origin, regardless of race)
o Yes
o No
3. Select one designation from the races in the following list:
o Black or African American
o Native Hawaiian or Other Pacific Islander
o White
o Asian
o American Indian or Alaskan Native
o Multi-racial
4. What is your age? o Less than 20
o 21-25
o 26-40
o 41-60
o 61 +
5. Please indicate your current academic status:
o Full Time
o Part Time
6. How many credits have you successfully completed at HWC (from courses numbered
101 or above)?
o 0-15
o 16-30
o 31-45
o 45-60
o 60+

29
7. How many credits have you successfully completed at other colleges or universities (from
courses numbered 101 or above)?
o 0-15
o 16-30
o 31-45
o 45-60
o 60+
8. What is the first writing course you completed at HWC?
o English 98/99 (Formerly INTCOMM 99)
o English 100/125 (Formerly INCOMM 100)
o English 100
o English 101
o English 102
o None/ Does not apply
9. What is the highest-level writing course you have completed at HWC with a C or
better?
o English 98/99 (Formerly INTCOMM 99)
o English 100/125 (Formerly INCOMM 100)
o English 100
o English 101
o English 102
o None/ Does not apply
10. In which college-level writing course are you currently enrolled? Check all that apply
o English 98/99
o English 100/125
o English 100
o English 101
o English 102
o Creative Writing
o Journalism
o Advanced Composition
o None/ Does not apply

30
Please indicate your level of agreement or
disagreement with each statement. There
are no correct or incorrect answers.
Agree
Strongly
Agree Disagree Strongly
Disagree
11. Writing helps me understand the
world around me. ○ ○ ○ ○
12. For me, writing involves exploration,
investigation and/or creativity. ○ ○ ○ ○
13. I need to be able to write well in order
to achieve my career goals. ○ ○ ○ ○
14. Writing is an important tool that helps
me learn other subjects. ○ ○ ○ ○
15. Writing allows me to be creative and
discover things for myself. ○ ○ ○ ○
16. Writing helps me make intelligent
decisions about my life. ○ ○ ○ ○
17. Writing is useful not only to people
who do specialized work but also to
everyday life. ○ ○ ○ ○
18. An accomplished writer needs only to
know sentence structure, punctuation,
grammar and spelling. ○ ○ ○ ○
19. Writing is a form of experimentation. ○ ○ ○ ○
20. I don’t need to write well in order to
achieve my career goals. ○ ○ ○ ○
21. There are different styles of writing
depending on the audience. ○ ○ ○ ○
22. There are different styles of writing
depending on the purpose. ○ ○ ○ ○
23. I am confident in my ability to write a
clearly focused essay. ○ ○ ○ ○
24. I am confident in my ability to
effectively organize an essay. ○ ○ ○ ○
25. I am not confident in my ability to use
examples and evidence from text, experience,
or imagination to support my thesis. ○ ○ ○ ○
26. I am not confident in my ability to write
an essay using correct spelling and diction. ○ ○ ○ ○
27. I am confident in my ability to
demonstrate grammatical fluency through
mastery of standard forms of verb
conjugation, punctuation, pronoun use,
and complete sentences.
○ ○ ○ ○
28. An accomplished writer needs to know
only organization, development, focus and
voice. ○ ○ ○ ○
31
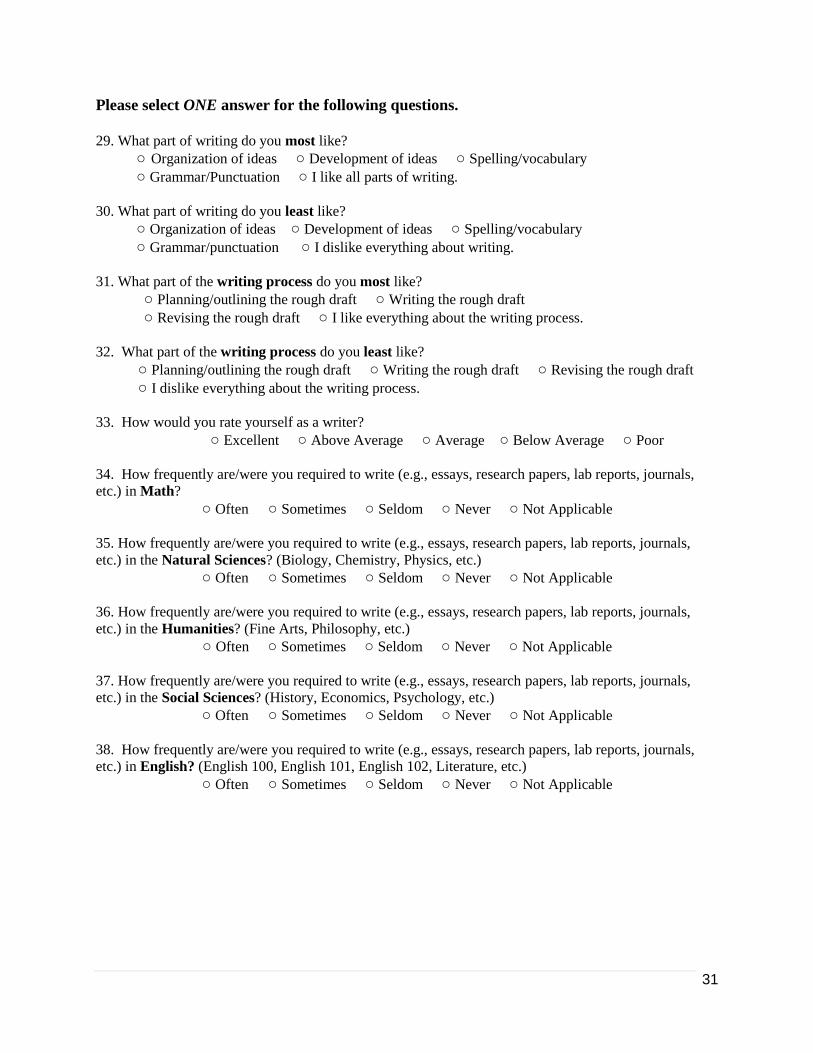
Please select ONE answer for the following questions.
29. What part of writing do you most like?
○ Organization of ideas ○ Development of ideas ○ Spelling/vocabulary
○ Grammar/Punctuation ○ I like all parts of writing.
30. What part of writing do you least like?
○ Organization of ideas ○ Development of ideas ○ Spelling/vocabulary
○ Grammar/punctuation ○ I dislike everything about writing.
31. What part of the writing process do you most like?
○ Planning/outlining the rough draft ○ Writing the rough draft
○ Revising the rough draft ○ I like everything about the writing process.
32. What part of the writing process do you least like?
○ Planning/outlining the rough draft ○ Writing the rough draft ○ Revising the rough draft
○ I dislike everything about the writing process.
33. How would you rate yourself as a writer?
○ Excellent ○ Above Average ○ Average ○ Below Average ○ Poor
34. How frequently are/were you required to write (e.g., essays, research papers, lab reports, journals,
etc.) in Math?
○ Often ○ Sometimes ○ Seldom ○ Never ○ Not Applicable
35. How frequently are/were you required to write (e.g., essays, research papers, lab reports, journals,
etc.) in the Natural Sciences? (Biology, Chemistry, Physics, etc.)
○ Often ○ Sometimes ○ Seldom ○ Never ○ Not Applicable
36. How frequently are/were you required to write (e.g., essays, research papers, lab reports, journals,
etc.) in the Humanities? (Fine Arts, Philosophy, etc.)
○ Often ○ Sometimes ○ Seldom ○ Never ○ Not Applicable
37. How frequently are/were you required to write (e.g., essays, research papers, lab reports, journals,
etc.) in the Social Sciences? (History, Economics, Psychology, etc.)
○ Often ○ Sometimes ○ Seldom ○ Never ○ Not Applicable
38. How frequently are/were you required to write (e.g., essays, research papers, lab reports, journals,
etc.) in English? (English 100, English 101, English 102, Literature, etc.)
○ Often ○ Sometimes ○ Seldom ○ Never ○ Not Applicable

32
Appendix C Frequency Report - Effective Writing Demographic Survey Results
Gender
Gender Frequency Percent Cum Freq Cum Per
Female 469 65.69 469 65.69
Male 241 33.75 710 99.44
Other 4 .56 714 100.00
Hispanic
Hispanic Frequency Percent Cum Freq Cum Per
Yes 305 42.9 305 42.9
No 406 57.1 711 100.00
Race/Ethnicity
Race Frequency Percent Cum Freq Cum Per
Black or African American 222 37.88 222 37.88
Native Hawaiian or Pacific Islander 7 1.19 229 39.08
White 172 29.35 401 68.43
Asian 56 9.56 457 77.99
American Indian or Alaskan Native 11 1.88 468 79.86
Multi-Racial 118 20.14 586 100.00
Frequency Missing =128
Age
Age Frequency Percent Cum Freq Cum Percent
Less than 20 239 33.61 239 33.61
21-25 274 38.54 513 72.15
26-40 143 20.11 656 92.26
41-60 50 7.03 706 99.30
61+ 5 .70 711 100.00
Frequency Missing = 3
Academic Status
Academic Status Frequency Percent Cum Freq Cum Percent
Full-Time 568 79.55 568 79.55
Part-Time 146 20.45 714 100.00

33
Credits at HWC
Credits at HWC Frequency Percent Cum Freq Cum Percent
0-15 376 53.03 376 53.03
16-30 162 22.85 538 75.88
31-45 81 11.42 619 87.31
45-60 59 8.32 678 95.63
60+ 31 4.37 709 100.00
Frequency Missing = 5
Credits at Other Colleges
Credits at Other Colleges Frequency Percent Cum Freq Cum Percent
0-15 501 71.67 501 71.67
16-30 78 11.16 579 82.83
31-45 31 4.43 610 87.27
45-60 26 3.72 636 90.00
60+ 63 9.01 699 100.00
Frequency Missing=15
First Writing Course
Frequency Percent Cum Freq Cum Percent
English 98/99 Formerly INTCOMM 99
89
12.55 89 12.55
English 100/125 Formerly INTCOMM 100
42 5.92 131 18.48
English 100 69 9.73 200 28.21
English 101 202 28.49 402 56.70
English 102 34 4.80 436 61.50
None/Does Not Apply 273 38.50 709 100.00
Frequency Missing=5
Highest Writing Course
Highest Writing Course Frequency Percent Cum Freq Cum Percent
English 98/99 Formerly INTCOMM 99
16 2.27 16 2.27
English 100/125 Formerly INTCOMM 100
22 3.12 38 5.38
English 100 50 7.08 88 12.46

34
English 101 163 23.09 251 35.55
English 102 169 23.94 420 59.49
None/Does Not Apply 286 40.51 706 100.00
Frequency Missing = 8
Current Writing Course Frequency Percent Cum Freq Cum Percent
English 98/99 Formerly INTCOMM 99
4 .56 4 .56
English 100/125 Formerly INTCOMM 100
6 .84 10 1.41
English 100 10 1.41 20 2.81
English 101 211 29.68 231 32.49
English 102 142 19.97 373 52.46
Creative Writing 3 .42 376 52.88
Advanced Comp 3 .42 379 53.31
None/Does Not Apply 332 46.69 711 100.00
Question # 11-Writing helps me understand the world around me.
Frequency Percent Cum Freq Cum Per
Agree Strongly 236 33.15 236 33.15
Agree 383 53.79 619 86.94
Disagree 83 11.66 701 98.6
Disagree Strongly 10 1.4 712 100.00
Frequency Missing =2
Question # 12-For me, writing involves exploration, investigation and/or creativity.
Frequency Percent Cum Freq Cum Per
Agree Strongly 340 47.82 340 47.82
Agree 340 47.82 680 95.64
Disagree 26 3.66 706 99.30
Strongly Disagree 5 .70 711 100.00
Frequency Missing = 3
Question # 13-. I need to be able to write well in order to achieve my career goals.
Frequency Percent Cum Freq Cum Per

35
Agree Strongly 411 57.89 411 57.89
Agree 252 35.49 663 93.38
Disagree 41 5.77 704 99.15
Disagree Strongly 6 .85 710 100.00
Frequency Missing = 4
Question # 14-Writing is an important tool that helps me learn other subjects.
Frequency Percent Cum Freq Cum Per
Agree Strongly 331 46.62 331 46.62
Agree 332 46.76 663 93.38
Disagree 41 5.77 704 99.15
Disagree Strongly 6 .85 710 100.00
Frequency Missing = 4
Question # 15-Writing allows me to be creative and discover things for myself.
Frequency Percent Cum Freq Cum Per
Agree Strongly 311 43.68 311 43.68
Agree 334 46.91 645 90.59
Disagree 59 8.29 704 98.88
Disagree Strongly 8 1.12 712 100.00
Frequency Missing = 2
Question # 16-Writing helps me make intelligent decisions about my life.
Frequency Percent Cum Freq Cum Per
Agree Strongly 196 27.72 196 27.72
Agree 353 49.93 549 77.65
Disagree 143 20.23 692 97.99
Disagree Strongly 15 2.12 707 100.00
Frequency Missing = 7
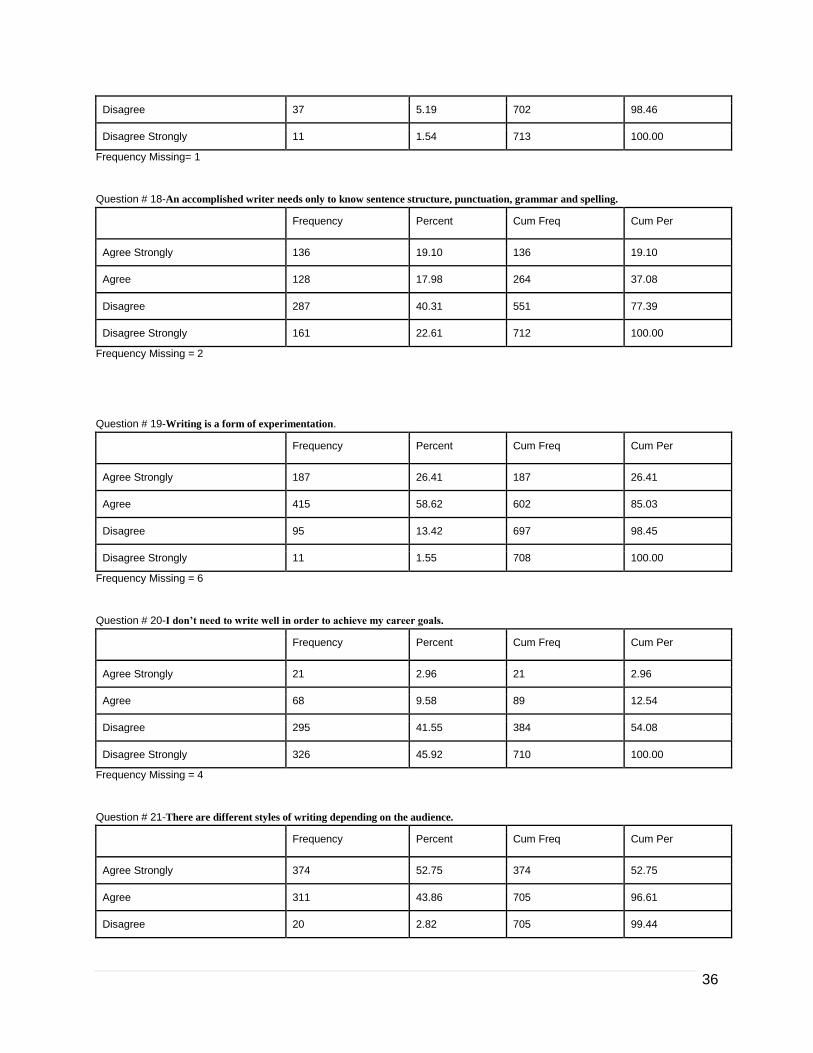
Question # 17-Writing is useful not only to people who do specialized work but also to everyday life.
Frequency Percent Cum Freq Cum Per
Agree Strongly 334 46.84 334 46.84
Agree 331 46.42 665 93.27
36
Disagree 37 5.19 702 98.46
Disagree Strongly 11 1.54 713 100.00
Frequency Missing= 1
Question # 18-An accomplished writer needs only to know sentence structure, punctuation, grammar and spelling.
Frequency Percent Cum Freq Cum Per
Agree Strongly 136 19.10 136 19.10
Agree 128 17.98 264 37.08
Disagree 287 40.31 551 77.39
Disagree Strongly 161 22.61 712 100.00
Frequency Missing = 2
Question # 19-Writing is a form of experimentation.
Frequency Percent Cum Freq Cum Per
Agree Strongly 187 26.41 187 26.41
Agree 415 58.62 602 85.03
Disagree 95 13.42 697 98.45
Disagree Strongly 11 1.55 708 100.00
Frequency Missing = 6
Question # 20-I don’t need to write well in order to achieve my career goals.
Frequency Percent Cum Freq Cum Per
Agree Strongly 21 2.96 21 2.96
Agree 68 9.58 89 12.54
Disagree 295 41.55 384 54.08
Disagree Strongly 326 45.92 710 100.00
Frequency Missing = 4
Question # 21-There are different styles of writing depending on the audience.
Frequency Percent Cum Freq Cum Per
Agree Strongly 374 52.75 374 52.75
Agree 311 43.86 705 96.61
Disagree 20 2.82 705 99.44

37
Disagree Strongly 4 .56 709 100.00
Frequency Missing = 5
Question # 22-There are different styles of writing depending on the purpose.
Frequency Percent Cum Freq Cum Per
Agree Strongly 397 55.68 397 55.68
Agree 307 43.06 704 98.74
Disagree 8 1.12 712 99.86
Disagree Strongly 1 .14 713 100.00
Frequency Missing = 1
Question # 23-I am confident in my ability to write a clearly focused essay.
Frequency Percent Cum Freq Cum Per
Agree Strongly 212 29.87 212 29.86
Agree 402 56.62 614 86.48
Disagree 87 12.25 701 98.73
Disagree Strongly 9 1.27 710 100.00
Frequency Missing = 4
Question # 24-I am confident in my ability to effectively organize an essay.
Frequency Percent Cum Freq Cum Per
Agree Strongly 224 31.64 224 31.64
Agree 395 55.79 619 87.43
Disagree 81 11.44 700 98.87
Disagree Strongly 8 1.13 708 100.00
Frequency Missing = 6
Question # 25-. I am not confident in my ability to use examples and evidence from text, experience, or imagination to support my
thesis.
Frequency Percent Cum Freq Cum Per
Agree Strongly 45 6.34 45 6.34
Agree 146 20.56 191 26.90
Disagree 337 47.46 528 74.37
Disagree Strongly 182 25.63 710 100.00
Frequency Missing = 4

38
Question # 26-. I am not confident in my ability to write an essay using correct spelling and diction.
Frequency Percent Cum Freq Cum Per
Agree Strongly 38 5.36 38 5.36
Agree 153 21.58 191 26.94
Disagree 315 44.43 506 71.37
Disagree Strongly 203 28.63 709 100.00
Frequency Missing = 5
Question # 27-I am confident in my ability to demonstrate grammatical fluency through mastery of standard forms of verb conjugation,
punctuation, pronoun use, and complete sentences.
Frequency Percent Cum Freq Cum Per
Agree Strongly 165 22.31 165 22.31
Agree 392 55.27 557 78.67
Disagree 138 19.49 695 98.16
Disagree Strongly 13 1.84 708 100.00
Frequency Missing = 3
Question # 28-An accomplished writer needs to know only organization, development, focus and voice.
Frequency Percent Cum Freq Cum Per
Agree Strongly 105 14.77 105 14.77
Agree 154 21.66 259 36.43
Disagree 330 46.41 589 82.84
Disagree Strongly 122 17.18 711 100.00
Frequency Missing = 3
Question # 29 - What part of writing do you most like?
Frequency Percent Cum Freq Cum Per
Organization of Ideas 138 19.63 138 19.63
Development of Ideas 41 5.83 179 25.46
Spelling/ Vocabulary
345 49.08 524 74.54
Grammar/ Punctuation
131 18.63 655 93.17
I like all parts of writing. 48 6.83 703 100.00
Frequency Missing = 11

39
Question # 30 - What part of writing do you least like?
Frequency Percent Cum Freq Cum Per
Organization of Ideas 148 21.61 148 21.61
Development of Ideas 315 45.99 463 67.59
Spelling/ Vocabulary
85 12.41 548 80.00
Grammar/ Punctuation
40 5.84 588 85.84
I like all parts of writing. 97 14.16 685 100.00
Frequency Missing=29
Question #31- What part of the writing process do you most like?
Frequency Percent Cum Frequency Cum Percent
Planning/ outlining the rough draft 229 32.86 229 32.86
Writing the rough draft 167 23.96 396 56.81
Revising the rough draft 211 30.27 607 87.09
I like everything about the writing process 90 12.91 697 100.00
Frequency Missing= 17
Question #32- What part of the writing process do you least like?
Frequency Percent Cum Frequency Cum Percent
Planning/ outlining the rough draft 259 37.98 259 37.98
Writing the rough draft 42 6.16 301 44.13
Revising the rough draft 147 21.55 448 65.69
I like everything about the writing process 234 34.31 682 100.00
Frequency Missing = 17
Question #33- How would you rate yourself as a writer?
Frequency Percent Cum Frequency Cum Percent
Excellent 33 4.67 33 4.67
Above Average 209 29.60 242 34.28
Average 408 57.79 650 92.07
Below Average 45 6.37 695 98.44
Poor 11 1.56 706 100.00
Frequency Missing = 32

40
Question #34 - How frequency are/were you required to write (e.g., essays, research papers, lab reports, journals, etc.) in Math?
Frequency Percent Cum Frequency Cum Percent
Often 92 13.03 92 13.05
Sometimes 90 12.77 182 25.82
Seldom 182 25.82 364 51.63
Never 268 38.01 632 89.65
NA 73 10.35 705 100.00
Frequency Missing=9
Question # 35- How frequency are/were you required to write (e.g., essays, research papers, lab reports, journals, etc.) in the
Natural Sciences ?(Biology, Chemistry, Physics, etc.)
Frequency Percent Cum Frequency Cum Percent
Often 131 18.66 131 18.66
Sometimes 198 28.21 329 46.87
Seldom 164 23.36 493 70.23
Never 56 7.98 549 78.21
NA 153 21.79 702 100.00
Frequency Missing=12
Question # 36- How frequency are/were you required to write (e.g., essays, research papers, lab reports, journals, etc.) in the
Humanities ?(Fine Arts, Philosophy, etc.)
Frequency Percent Cum Frequency Cum Percent
Often 335 47.38 335 47.38
Sometimes 151 21.36 486 68.74
Seldom 46 6.51 532 75.25
Never 30 4.24 562 79.49
NA 145 20.51 707 100.00
Frequency Missing = 7
Question #37 - How frequency are/were you required to write (e.g., essays, research papers, lab reports, journals, etc.) in the
Social Sciences ? (History, Economics, Psychology, etc.)
Frequency Percent Cum Frequency Cum Percent
Often 286 40.45 286 40.45
Sometimes 194 27.44 480 67.89
Seldom 68 9.62 548 77.51
Never 34 4.81 582 82.32
NA 125 17.68 707 100.00

41
Frequency Missing = 7
Question # - How frequency are/were you required to write (e.g., essays, research papers, lab reports, journals, etc.) in English?
(English 100, 101, 102, Literature, etc.)
Frequency Percent Cum Frequency Cum Percent
Often 629 88.97 629 88.97
Sometimes 34 4.81 663 93.78
Seldom 10 1.41 673 95.19
Never 3 .42 676 95.62
NA 31 4.38 707 100.00
Frequency Missing = 7

42
Appendix D
Effective Writing Volunteer Request Form
Between the 10th week and the 12th week of the fall, 2011 semester, the
Assessment Committee will be collecting student writing samples from across the
college in order to assess the general education outcome of Effective Writing.
We are looking for faculty from all disciplines in college credit courses to collect
writing samples from their students, have those same students complete a short
demographic questionnaire (10 minutes) and then submit the samples and the
questionnaires to the Assessment Committee. The samples and questionnaires
will be anonymous and will not be connected to any particular instructor or
student.
We are seeking volunteer faculty from a wide range of disciplines and time
periods (day, evening and weekend classes) to assess a broad range of the
college's students. Please help us in achieving our target of 1,000 writing
samples. Volunteering a class will not necessarily result in the section being
chosen to participate in the assessment. If chosen, you will be notified, with
further instructions before week #10. Acceptable writing samples include; journal
entries, essays, creative writing assignments, long answer exam questions,
laboratory writing, etc. The writing simply needs to be something that would
happen organically in your class and is long enough to assess.
Please complete the following form and submit it as soon as possible. The
Assessment Committee thanks you in advance for your time and attention to this
exciting assessment.
Your name
1. I am willing to volunteer the following course:

43
This course meets on (day of the week)
This course meets (at what time)
How many students are in this section?
2. I am willing to volunteer the following course:
This course meets on (day of the week)
This course meets (at what time)
How many students are in this section?
3. I am willing to volunteer the following course:
This course meets on (day of the week)
This course meets (at what time)
How many students are in this section?

44
Appendix E
HWC Effective Writing Assessment Part 2 Writing Sample Written by HWC Assessment Committee, 2011 Between the 10th week and the 12th week of the fall, 2012 semester, the Assessment Committee will be collecting student writing samples from across the college in order to assess the general education outcome of Effective Writing. We are looking for faculty from all disciplines in college credit courses to collect writing samples from their students, have those same students complete a short demographic questionnaire (10 minutes) and then submit them to the Assessment Committee. These writing samples will be anonymous and will not be connected to any particular instructor or student. We are seeking volunteer faculty from a wide range of disciplines and time periods (day, evening and weekend classes) to assess a broad range of the college's students. Please help us in achieving our target of 1,000 writing samples. Volunteering a class will not necessarily result in the section being chosen to participate in the assessment. If chosen, you will be notified, with further instructions before week #10. Acceptable writing samples include; journal entries, essays, creative writing assignments, long answer exam questions, laboratory writing, etc. The writing simply needs to be something that would happen organically in your class and is long enough to assess (3-4 paragraphs or one page of text, at a minimum). Below is the rubric that will be used to grade the writing samples:
Focus Writing is clearly focused. It holds the reader’s attention.
Organization Writing includes a strong beginning, middle, and end with clear transitions and a focused closure.
Voice Writes with a distinct, unique voice/point of view. Writing is skillfully adapted to the audience.
Coherent Development and Elaboration Writing makes clear sense and flows logically. Relevant details enrich the writing. The thesis and purpose are clear to the reader and closely match the writing task.
Conventions Follows the conventions of Standard Written English (SWE), e.g., grammar, sentence structure, mechanics, and punctuation.
Style and Diction Sentences are varied, complex, and employed for effect. Diction is precise, appropriate, using college-level vocabulary.
Very Competent 3 Competent 2 Below Competent 1 Unsatisfactory 0
Very Competent 3 Competent 2 Below Competent 1 Unsatisfactory 0
Very Competent 3 Competent 2 Below Competent 1 Unsatisfactory 0
Very Competent 3 Competent 2 Below Competent 1 Unsatisfactory 0
Very Competent 3 Competent 2 Below Competent 1 Unsatisfactory 0
Very Competent 3 Competent 2 Below Competent 1 Unsatisfactory 0

45
Appendix F
Data tables showing relationships between Reading and Writing course placement and
individual Effective Writing assessment criteria.
Focus Focus Essay Score
Highest
Course
First Course
English 98/99 English 100/125 English 100 English 101 English 102
Mean S.D. N Mean S.D. N Mean S.D. N Mean S.D. N Mea
n
S.D. N
English
98/99
71% 20% 15 - - 0 - - 0 - - 1 - - 0
English
100/125
- - 8 - - 11 - - 2 - - 0 - - 0
English
100
67% 24% 21 - - 1 65% 20% 27 - - 0 - - 0
English
101
66% 25% 20 68% 14% 16 77% 17% 17 78% 18% 10
5
- - 1
English
102
68% 16% 25 74% 17% 13 77% 19% 20 83% 15% 78 81% 12% 27
Organization Organization Essay Score
Highest
Course
First Course
English 98/99 English 100/125 English 100 English 101 English 102
Mean S.D. N Mean S.D. N Mean S.D. N Mean S.D. N Mean S.D. N
English
98/99
59% 19% 15 - - 0 - - 0 - - 1 - - 0
English
100/125
- - 8 - - 11 - - 2 - - 0 - - 0
English
100
59% 27% 21 - - 1 57% 18% 27 - - 0 - - 0
English
101
58% 24% 20 59% 16% 16 69% 20% 17 67% 20% 105 - - 1
English
102
58% 15% 25 63% 19% 13 65% 20% 20 71% 16% 78 67% 16% 27
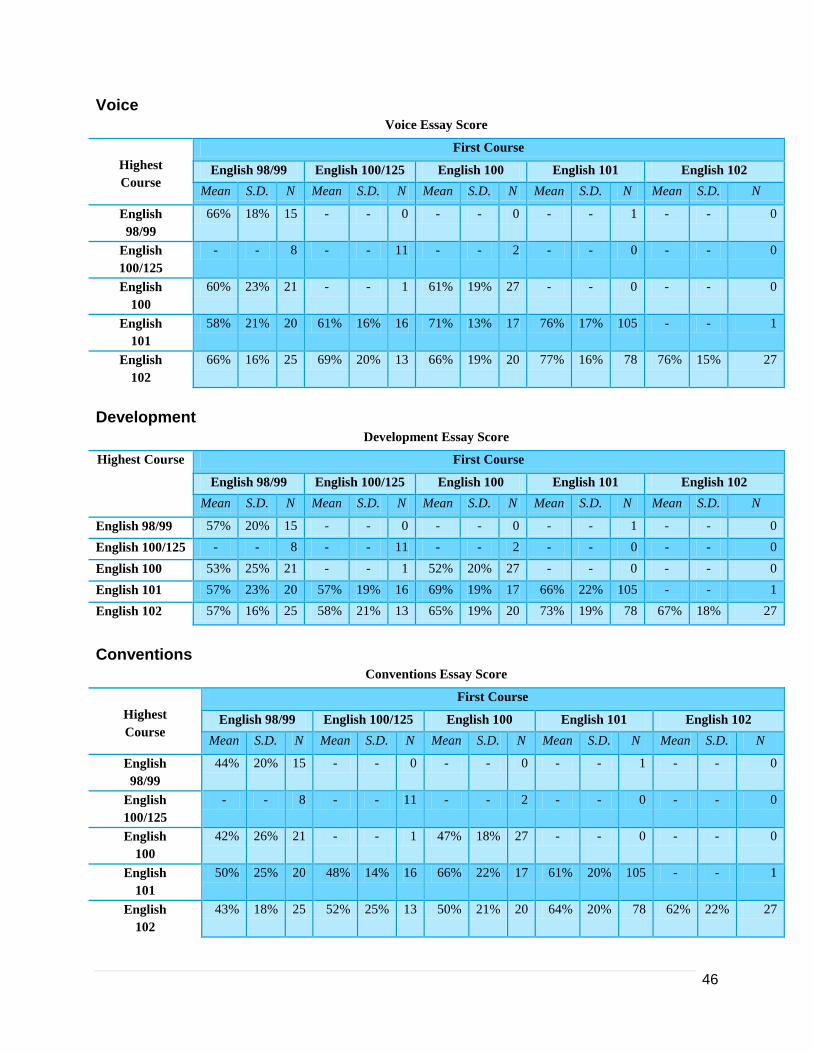
46
Voice Voice Essay Score
Highest
Course
First Course
English 98/99 English 100/125 English 100 English 101 English 102
Mean S.D. N Mean S.D. N Mean S.D. N Mean S.D. N Mean S.D. N
English
98/99
66% 18% 15 - - 0 - - 0 - - 1 - - 0
English
100/125
- - 8 - - 11 - - 2 - - 0 - - 0
English
100
60% 23% 21 - - 1 61% 19% 27 - - 0 - - 0
English
101
58% 21% 20 61% 16% 16 71% 13% 17 76% 17% 105 - - 1
English
102
66% 16% 25 69% 20% 13 66% 19% 20 77% 16% 78 76% 15% 27
Development
Development Essay Score
Highest Course First Course
English 98/99 English 100/125 English 100 English 101 English 102
Mean S.D. N Mean S.D. N Mean S.D. N Mean S.D. N Mean S.D. N
English 98/99 57% 20% 15 - - 0 - - 0 - - 1 - - 0
English 100/125 - - 8 - - 11 - - 2 - - 0 - - 0
English 100 53% 25% 21 - - 1 52% 20% 27 - - 0 - - 0
English 101 57% 23% 20 57% 19% 16 69% 19% 17 66% 22% 105 - - 1
English 102 57% 16% 25 58% 21% 13 65% 19% 20 73% 19% 78 67% 18% 27
Conventions Conventions Essay Score
Highest
Course
First Course
English 98/99 English 100/125 English 100 English 101 English 102
Mean S.D. N Mean S.D. N Mean S.D. N Mean S.D. N Mean S.D. N
English
98/99
44% 20% 15 - - 0 - - 0 - - 1 - - 0
English
100/125
- - 8 - - 11 - - 2 - - 0 - - 0
English
100
42% 26% 21 - - 1 47% 18% 27 - - 0 - - 0
English
101
50% 25% 20 48% 14% 16 66% 22% 17 61% 20% 105 - - 1
English
102
43% 18% 25 52% 25% 13 50% 21% 20 64% 20% 78 62% 22% 27
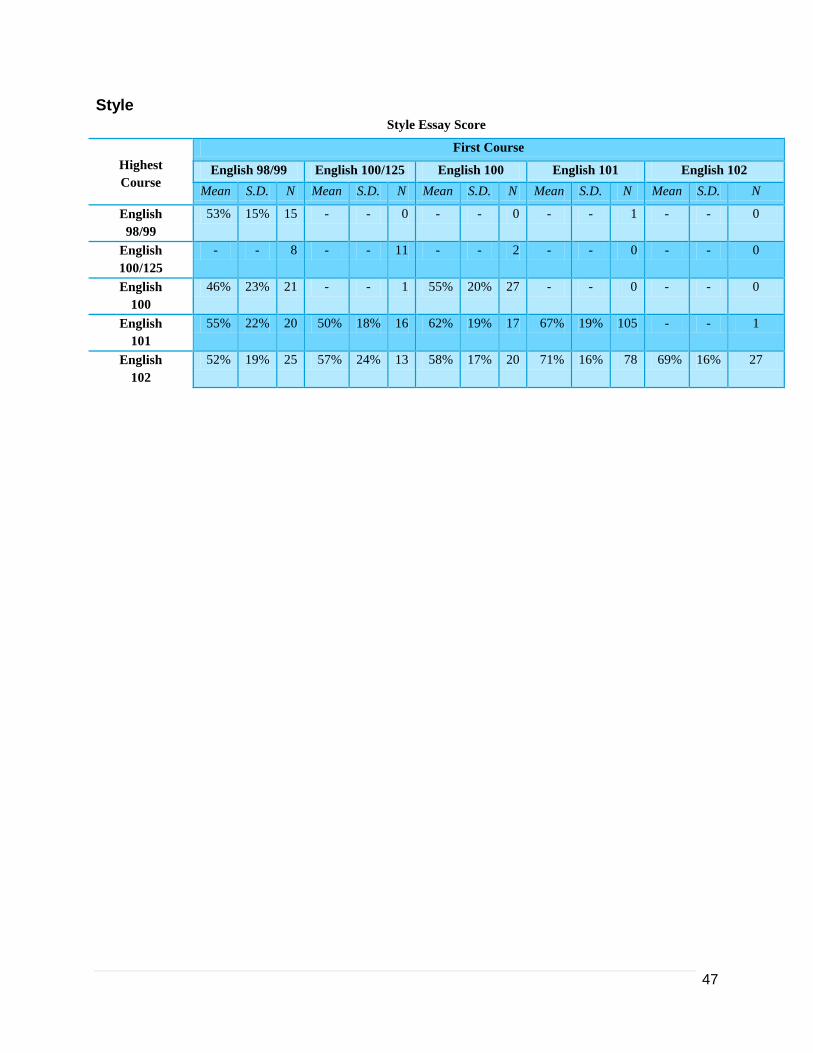
47
Style Style Essay Score
Highest
Course
First Course
English 98/99 English 100/125 English 100 English 101 English 102
Mean S.D. N Mean S.D. N Mean S.D. N Mean S.D. N Mean S.D. N
English
98/99
53% 15% 15 - - 0 - - 0 - - 1 - - 0
English
100/125
- - 8 - - 11 - - 2 - - 0 - - 0
English
100
46% 23% 21 - - 1 55% 20% 27 - - 0 - - 0
English
101
55% 22% 20 50% 18% 16 62% 19% 17 67% 19% 105 - - 1
English
102
52% 19% 25 57% 24% 13 58% 17% 20 71% 16% 78 69% 16% 27


