Page 1
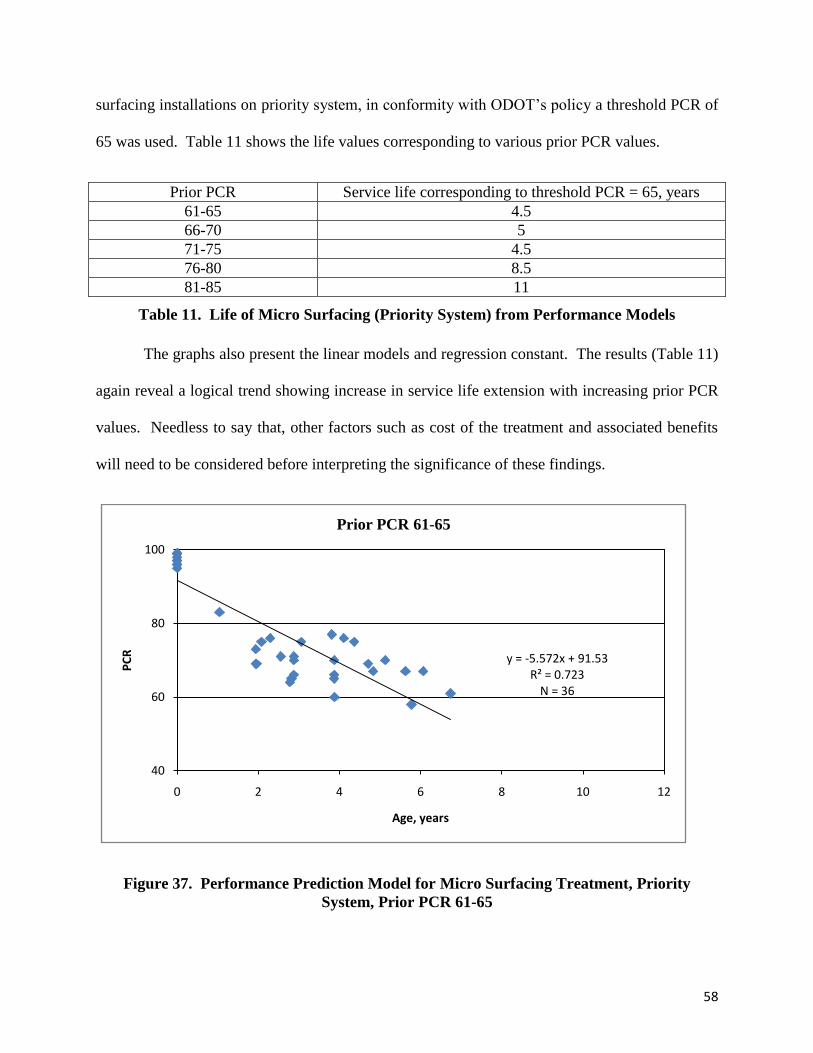
2300 East Kemper Road. Suite A-17. Cincinnati OH 45241-6501
Ph: 513.826.4338 Fax: 513.826.4340 Web: www.inframeinc.com Email: [email protected]
EFFECTIVENESS OF CHIP SEALING AND MICRO SURFACING ON
PAVEMENT SERVICEABILITY AND LIFE
FINAL REPORT
Arudi Rajagopal, Ph.D.
INFRAME, 2300 East Kemper Road, Suite A-17
Cincinnati, OH 45241-6501
State Job No. 134299
May 2010
Prepared in cooperation with
The Ohio Department of Transportation and
The U.S. Department of Transportation Federal Highway Administration
Page 3
TABLE OF CONTENTS
1.0 GENERAL ............................................................................................................................ 1
2.0 OHIO DEPARTMENT OF TRANSPORTATION SPECIFICATIONS AND QUALITY
REQUIREMENTS ................................................................................................................ 4
2.1 Chip Seal ...................................................................................................................................... 4
2.2 Micro Surfacing ........................................................................................................................... 5
2.3 Unresolved Issues Affecting the Successful Use of Chip Seal and Micro Surfacing Treatments 5
2.3.1 Cost-Effectiveness .................................................................................................................................. 5
2.3.2 Treatment Timing ................................................................................................................................... 6
2.3.3 Integration of Preventive Maintenance and Pavement Management ...................................................... 7
3.0 CURRENT RESEARCH TRENDS ...................................................................................... 8
3.1 Specifications and Quality Requirements .................................................................................... 8
3.1.1 Chip Seals ............................................................................................................................................... 8
3.1.2 Micro surfacing .................................................................................................................................... 10
3.2 Analysis Methodology for Preventive Maintenance Treatments ............................................... 11
3.2.1 Optimal Treatment Timing ................................................................................................................... 11
3.2.2 Quantifying Effectiveness .................................................................................................................... 12
3.2.3 Cost-Effectiveness Models ................................................................................................................... 12
4.0 PRESENT STUDY – SCOPE AND OBJECTIVES ........................................................... 15
5.0 DESIGN OF EXPERIMENT .............................................................................................. 16
6.0 REVIEW OF ODOT‟S PAVEMENT MANAGEMENT DATABASE ............................. 18
7.0 THE SIMULATION OF THE FIELD EXPERIMENT ...................................................... 21
8.0 PERFORMANCE INDICATORS ...................................................................................... 23
8.1 Service life of treatments based on actual number of years in service ...................................... 24
8.2 Average Performance Gain ........................................................................................................ 25
8.3 Service Life of Treatments (using performance prediction models) .......................................... 27
8.4 Cost-effectiveness ...................................................................................................................... 29
8.5 Life Cycle Costs ......................................................................................................................... 32
9.0 ANALYSIS OF CHIP SEAL TREATMENTS .................................................................. 35
9.1 Chip Seal - Service Life from Historic Data .............................................................................. 35
9.2 Chip Seal - Average Performance Gain ..................................................................................... 36
Page 4
9.3 Chip Seal - Life of treatments (using performance prediction models) ..................................... 38
9.4 Chip Seal - Cost-effectiveness ................................................................................................... 43
9.5 Chip Seal - Life Cycle Costs ...................................................................................................... 45
10.0 ANALYSIS OF MICRO SURFACING TREATMENTS ON GENERAL SYSTEM ....... 46
10.1 Micro Surfacing (General System) - Service Life from Historic Data ...................................... 46
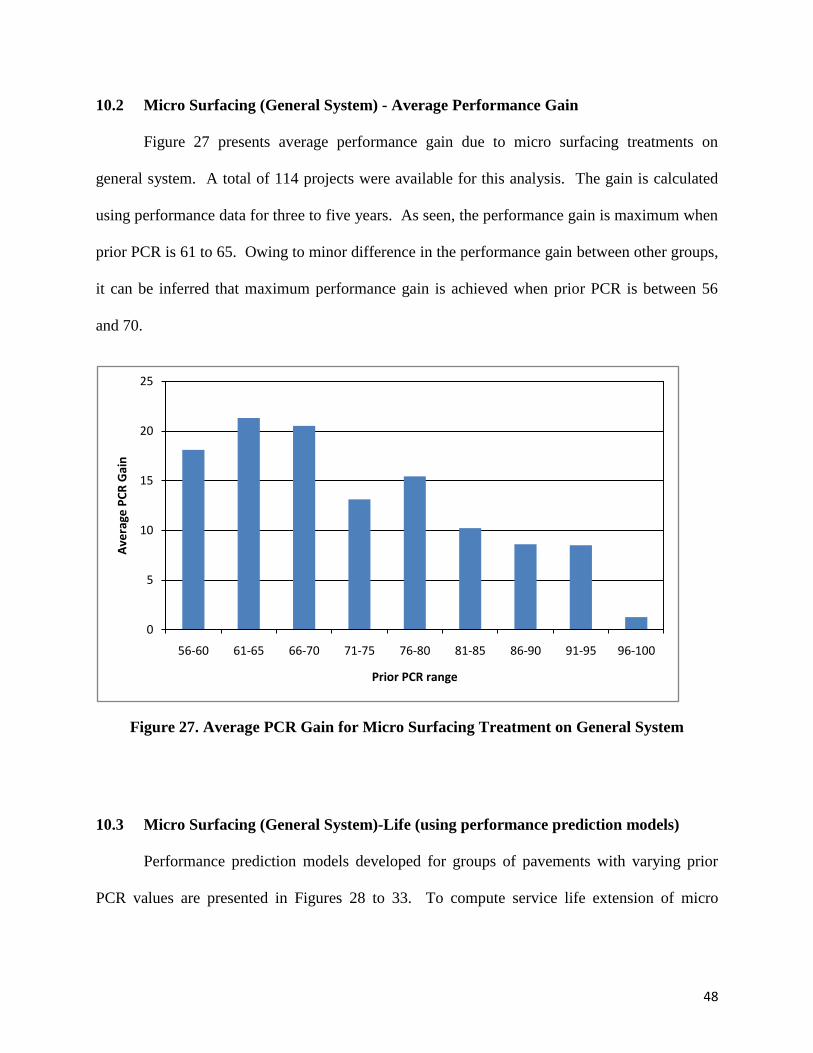
10.2 Micro Surfacing (General System) - Average Performance Gain ............................................. 48
10.3 Micro Surfacing (General System)-Life (using performance prediction models) ..................... 48
10.4 Micro Surfacing (General System) - Cost-effectiveness ........................................................... 52
10.5 Micro Surfacing (General System) - Life Cycle Costs .............................................................. 54
11.0 ANALYSIS OF MICRO SURFACING TREATMENTS ON PRIORITY SYSTEM ....... 55
11.1 Micro Surfacing (Priority System) - Service Life from Historic Data ...................................... 55
11.2 Micro Surfacing (Priority System) - Average Performance Gain .............................................. 57
11.3 Micro Surfacing (Priority System) - Life of Treatments (using performance prediction models)
................................................................................................................................................... 57
11.4 Micro Surfacing (Priority System) - Cost-effectiveness ............................................................ 61
11.5 Micro Surfacing (Priority System) - Life Cycle Costs ............................................................... 62
12.0 SUMMARY, CONCLUSIONS AND RECOMMENDATIONS ....................................... 64
REFERENCES ............................................................................................................................. 69
Page 5
LIST OF TABLES
Table 1. Chip Seal and Micro Surfacing Projects in Ohio ............................................................ 18
Table 2. Calculating Average Performance Gain ........................................................................ 27
Table 3. Service Life of Chip Seal Treatments ............................................................................ 36
Table 4. Number of Chip Seal Treatments vs. Prior PCR ............................................................ 37
Table 5. Life of Chip Seal Treatment from Performance Models ............................................... 38
Table 6. Relative Benefit Ratio of Chip Seal Treatments ............................................................ 43
Table 7. Service Life of Micro Surfacing Treatments on General System .................................. 47
Table 8. Life of Micro Surfacing (General System) from Performance Models ......................... 49
Table 9. Relative Benefit Ratio of Micro Surfacing Treatments on General System ................... 53
Table 10. Service Life of Micro Surfacing Treatments on Priority System ................................ 56
Table 11. Life of Micro Surfacing (Priority System) from Performance Models ....................... 58
Table 12. Relative Benefit Ratio of Micro Surfacing Treatments on Priority System ................ 61
Table 13. Summary of Results for Chip Seal Treatment ............................................................. 65
Table 14. Summary of Results for Micro Surfacing Treatment on General System ................... 65
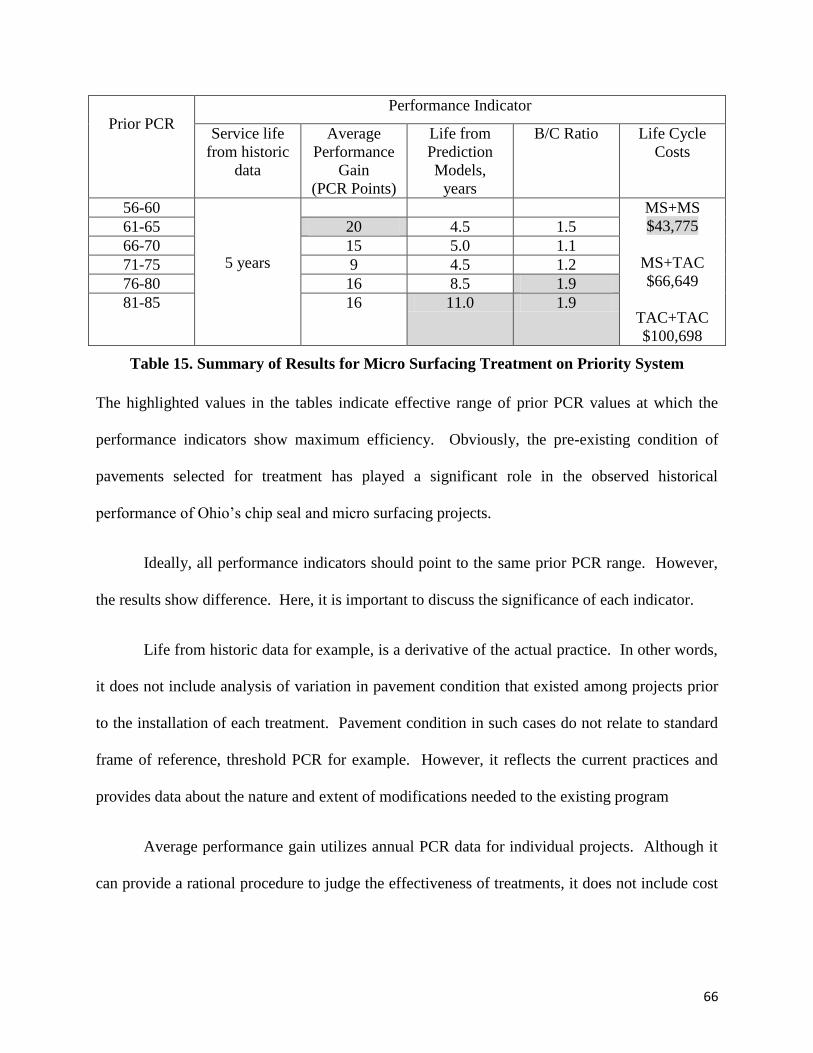
Table 15. Summary of Results for Micro Surfacing Treatment on Priority System .................... 66
Page 6
LIST OF FIGURES
Figure 1. Chip Seal Treatment in Progress .................................................................................... 1
Figure 2. Close-up View of Finished Chip Seal Project ................................................................ 2
Figure 3. Micro Surfacing Treatment in Progress ......................................................................... 3
Figure 4. Finished Micro Surfacing Project ................................................................................... 3
Figure 5. Chip Seal and Micro Surfacing Projects in Ohio ......................................................... 15
Figure 6. Condition of Pavements Before Chip Seal Treatment ................................................. 20
Figure 7. Condition of Pavements Before Micro Surfacing on Priority System ......................... 20
Figure 8. Condition of Pavements Before Micro Surfacing on General System ......................... 21
Figure 9. Calculating Service Life of Treatments Using Historic Data ....................................... 25
Figure 10. Calculating Performance Gain ................................................................................... 26
Figure 11. Calculating Life of Treatments Using Performance Prediction Models .................... 28
Figure 12. Benefit of Thin AC Overlay on General System Highway Network [31] .................. 30
Figure 13. Benefit of Thin AC Overlay on Priority System Highway Network [31] ................... 30
Figure 14. Computing Benefit of Treatment................................................................................ 31
Figure 15. Life Cycle Cost Analysis of Chip Seal Treatment ..................................................... 33
Figure 16. Service Life of Chip Seal Treatments ........................................................................ 35
Figure 17. Average PCR Gain Due to Chip Seal .......................................................................... 37
Figure 18. Performance Prediction Model for Chip Seal Treatment, Prior PCR 56-60 ............... 39
Figure 19. Performance Prediction Model for Chip Seal Treatment Prior, PCR 61-65 .............. 40
Figure 20. Performance Prediction Model for Chip Seal Treatment, Prior PCR 66-70 .............. 40
Figure 21. Performance Prediction Model for Chip Seal Treatment, Prior PCR 71-75 ............... 41
Figure 22. Performance Prediction Model for Chip Seal Treatment, Prior PCR 76-80 ............... 41
Figure 23. Performance Prediction Model for Chip Seal Treatment, Prior PCR 81-85 ............... 42
Figure 24. Performance Prediction Model for Chip Seal Treatment, Prior PCR 86-90 ............... 42
Figure 25. Summary of Relative Benefit of Chip Seal Treatment ............................................... 44
Figure 26. Service Life of Micro Surfacing Treatments on General System ............................... 47
Figure 27. Average PCR Gain for Micro Surfacing Treatment on General System .................... 48
Figure 28. Performance Prediction Model for Micro Surfacing Treatment, General System, Prior
PCR 56-60 ................................................................................................................... 49
Figure 29. Performance Prediction Model for Micro Surfacing Treatment, General System, Prior
PCR 61-65 ................................................................................................................... 50
Figure 30. Performance Prediction Model for Micro Surfacing Treatment, General System, Prior
PCR 66-70 ................................................................................................................... 50
Figure 31. Performance Prediction Model for Micro Surfacing Treatment, General System, Prior
PCR 71-75 ................................................................................................................... 51
Figure 32. Performance Prediction Model for Micro Surfacing Treatment, General System,
Prior PCR 76-80 .......................................................................................................... 51
Page 7
Figure 33. Performance Prediction Model for Micro Surfacing Treatment, General System,
Prior PCR 81-85 .......................................................................................................... 52
Figure 34. Summary of Relative Benefit of Micro Surfacing on General System ....................... 53
Figure 35. Service Life of Micro Surfacing Treatments on Priority System ................................ 56
Figure 36. Average PCR Gain Due to Micro Surfacing on Priority System ............................... 57
Figure 37. Performance Prediction Model for Micro Surfacing Treatment, Priority System, Prior
PCR 61-65 ................................................................................................................... 58
Figure 38. Performance Prediction Model for Micro Surfacing Treatment, Priority System, Prior
PCR 66-70 ................................................................................................................... 59
Figure 39. Performance Prediction Model for Micro Surfacing Treatment, Priority System, Prior
PCR 71-75 ................................................................................................................... 59
Figure 40. Performance Prediction Model for Micro Surfacing Treatment, Priority System, Prior
PCR 76-80 ................................................................................................................... 60
Figure 41. Performance Prediction Model for Micro Surfacing Treatment, Priority System, Prior
PCR 81-85 ................................................................................................................... 60
Figure 42. Summary of Relative Benefit of Micro Surfacing on Priority System ....................... 62
Page 9
1. Report No.
FHWA/OH-2010/8
2. Government Accession No.
3. Recipient’s Catalog No.
4. Title and subtitle
Effectiveness of Chip Sealing and Micro Surfacing on Pavement Serviceability and
Life
5. Report Date
May 2010
6. Performing Organization Code
7. Author(s)
Dr. Arudi Rajagopal
Page 11
ACKNOWLEDGMENTS
The investigators wish to convey their appreciation to Mr. David Humphrey, Mr. Roger Green,
Mr. Aric Morse and Mr. Adam Au of the Office of Pavement Engineering, Ohio Department of
Transportation, for their help throughout the life of this project. Thanks are also due to Mr.
Andrew Williams for providing the data and responding to our queries. The cooperation
extended by the Office of Research and Development is duly acknowledged.
Page 12
DISCLAIMER
The contents of this report reflect the views of the authors who are responsible for the facts and
the accuracy of the data presented herein. The contents do not necessarily reflect the official
views or policies of the Ohio Department of Transportation or the federal Highway
Administration. This report does not constitute a standard, specification or regulation.
Page 13
The Ohio Department of Transportation Office of Research & Development Executive Summary Report
EFECTIVENSS OF CHIP SEALING AND MICRO SURFACING ON
PAVEMENT SERVICEABILITY AND LIFE
Start Date: 7/1/2006
Duration:
Completion Date: 12/31/2009
Report Date: May 2010
State Job Number: 134299
Report Number: FHWA/OH-2010/8
Funding:
Principal Investigators:
Dr. Arudi Rajagopal
ODOT Contacts:
Technical:
Roger Green, P.E.
Administrative:
Andrew Williams P.E.
Administrator
Innovations, Partnership & Energy
614-644-8175
For copies of this final report go to
www.dot.state.oh.us/research
or call 614-644-8173
Ohio Department of Transportation
Innovation, Research & Implementation Section
1980 West Broad Street
Columbus, OH 43223
Problem Statement Chip Seal and Micro Surfacing are important
components of ODOT’s pavement preventive
maintenance program. Thorough understanding
of how well these
treatments are
performing is critical to
the nature and extent of
their continued use in
the future. Currently,
there is a lack of
objective information on fundamental issues
such as the expected improvement in pavement
condition resulting from
the use of chip seal and
micro surfacing, the
extent to which the
treatments slow the
deterioration of the
pavement, and the optimum timing of the
treatment. As a result, present guidelines are
based on anecdotal observations and experience.
This study was initiated to systematically
evaluate and quantify the performance and cost-
effectiveness of ODOT’s current chip sealing
and micro surfacing practices using the data
from completed and in-service projects.
Objectives The study addressed three basic issues:
1. Treatment effectiveness: how well do chip
seals and micro surfacing improve the
condition of treated pavements?
2. Extension of pavement service life: to what
extent does each of the treatments delay the
pavement deterioration process?
Page 14
3. Influence of treatment time: what is optimal
time or pavement condition when the
treatment can be most effectively applied?
Methodology
A total of 225 chip seal and 214 micro surfacing
treatments were applied in Ohio between the
years 1999 and 2006. ODOT’s pavement
management information system consisted of
relevant information including project location,
dates of treatment, Pavement Condition Rating
(before the treatment and for every year after the
treatment), pavement type and functional
classification. An experiment was designed to
utilize this data to evaluate the effectiveness of
the treatments. In addition, control sections with
similar attributes were identified and used as
‘do-nothing’ sections. Effectiveness was
evaluated with the aid of following five
performance indicators:
1. Service life of treatments based on actual
number of years in service
2. Average performance gain
3. Service life of treatments using performance
models
4. Cost-effectiveness
5. Life cycle costs.
Service life was
calculated as the
time from the
period of treatment
installation till the
time another
activity was
reported in the
database.
Performance gain
was calculated for
each project as the
average difference
in the PCR for
each year between
the treated and ‘do-nothing’ sections.
Treated
pavements were
divided into
various groups
based on the PCR
prior to the treatment. Performance prediction
models were developed for each of these groups.
Life of treated pavements was obtained as the
number of years to reach a threshold PCR.
Benefit cost ratio
of the chip seal
and micro
surfacing
treatments was
obtained as the ratio of area of performance
curve and the cost of treatment.
From a previously completed study, benefit cost
ratios were available for Thin Asphalt Overlays,
another preventive maintenance treatment
practiced in Ohio.
Life cycle cost
analysis of chip
seal and micro
surfacing
treatments was
performed by
comparing the benefit cost ratios with that of
thin AC overlays.
Conclusions:
1. Chip seals are cost effective treatments.
They provide maximum benefits when
applied on pavements whose PCR is in the
range 66 to 80. Under such conditions, chip
seals can extend the service life of
pavements up to seven years.
2. Micro surfacing treatments on general
system (2-lane state routes) are reasonably
effective. The best range of prior PCR for
their installation is 61 to 70. Life of micro
surfacing treatments on general system is
nine years.
3. Micro surfacing treatments on priority
system (4-lane or more) are marginally
effective. The best range of prior PCR for
their installation is 61 to 70. Micro
surfacing on priority system can extend the
service life of treated pavements by eight
years.
Implementation Potential:
The results of the study can be translated into
appropriate revisions of ODOT’s Preventive
Maintenance Guidelines. With this, the district
and county officials will be better able to
identify which pavements are suited for chip seal
and micro surfacing treatments.
Page 15
1
EFFECTIVENESS OF CHIP SEALING AND MICRO SURFACING ON
PAVEMENT SERVICEABILITY AND LIFE
1.0 GENERAL
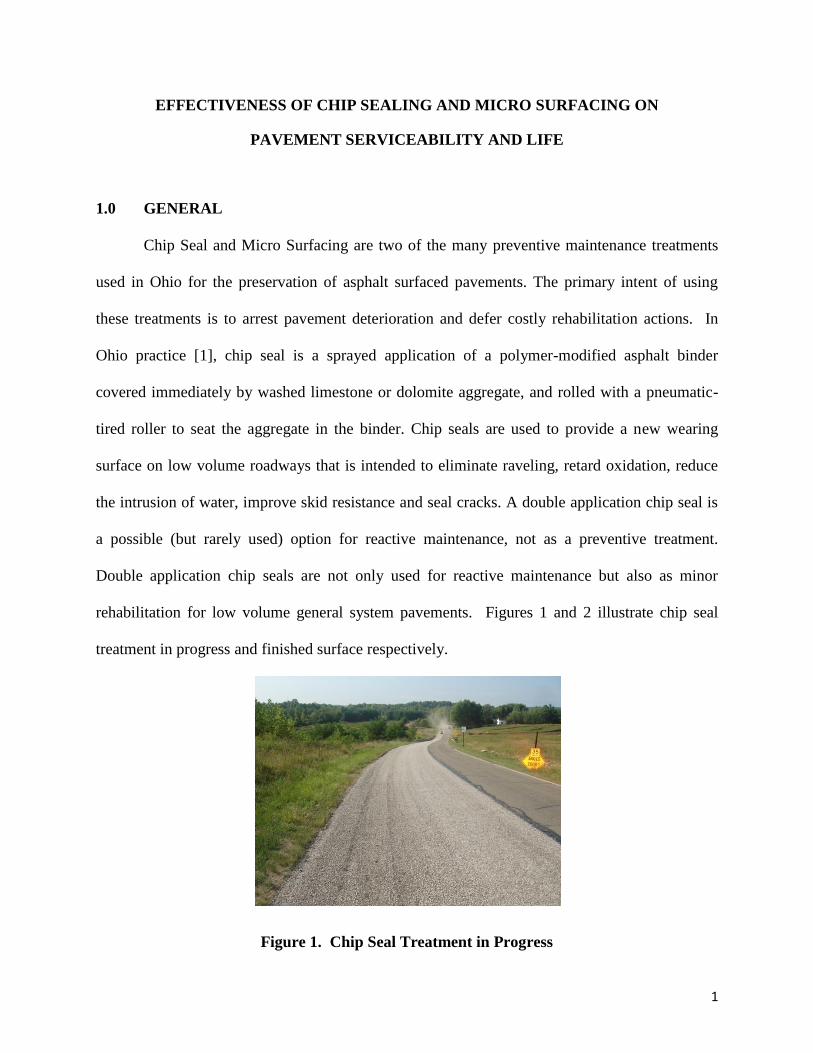
Chip Seal and Micro Surfacing are two of the many preventive maintenance treatments
used in Ohio for the preservation of asphalt surfaced pavements. The primary intent of using
these treatments is to arrest pavement deterioration and defer costly rehabilitation actions. In
Ohio practice [1], chip seal is a sprayed application of a polymer-modified asphalt binder
covered immediately by washed limestone or dolomite aggregate, and rolled with a pneumatic-
tired roller to seat the aggregate in the binder. Chip seals are used to provide a new wearing
surface on low volume roadways that is intended to eliminate raveling, retard oxidation, reduce
the intrusion of water, improve skid resistance and seal cracks. A double application chip seal is
a possible (but rarely used) option for reactive maintenance, not as a preventive treatment.
Double application chip seals are not only used for reactive maintenance but also as minor
rehabilitation for low volume general system pavements. Figures 1 and 2 illustrate chip seal
treatment in progress and finished surface respectively.
Figure 1. Chip Seal Treatment in Progress
Page 16
2
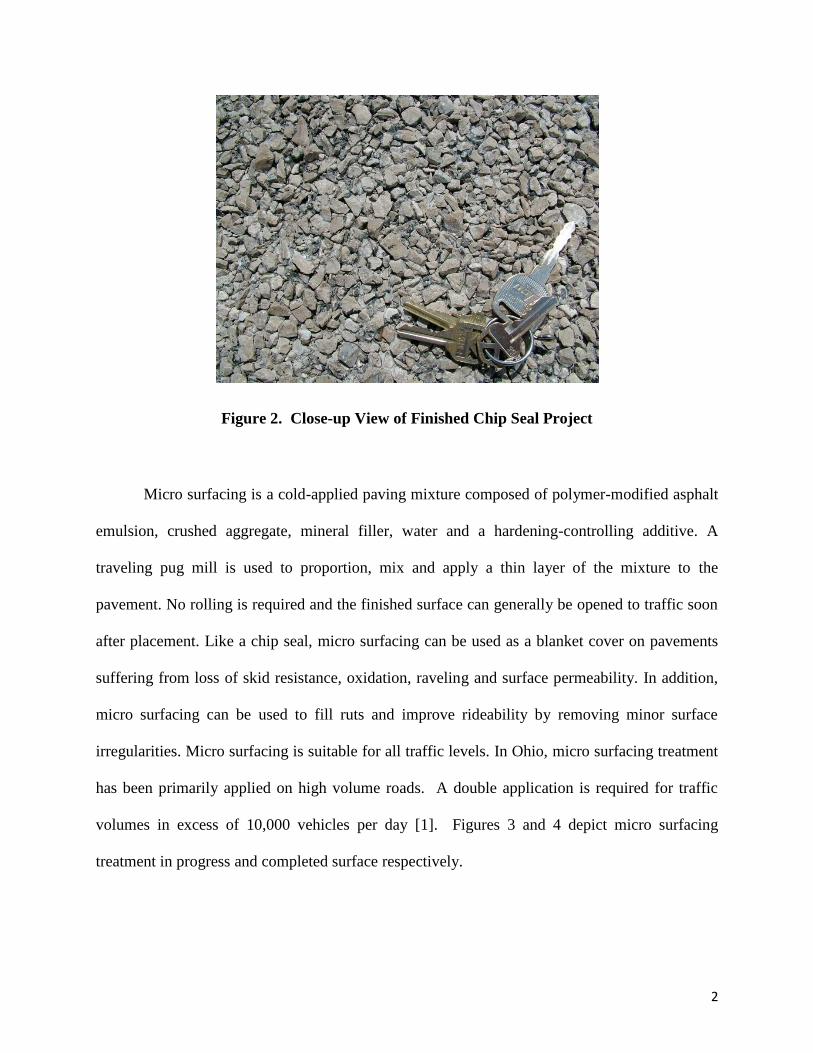
Figure 2. Close-up View of Finished Chip Seal Project
Micro surfacing is a cold-applied paving mixture composed of polymer-modified asphalt
emulsion, crushed aggregate, mineral filler, water and a hardening-controlling additive. A
traveling pug mill is used to proportion, mix and apply a thin layer of the mixture to the
pavement. No rolling is required and the finished surface can generally be opened to traffic soon
after placement. Like a chip seal, micro surfacing can be used as a blanket cover on pavements
suffering from loss of skid resistance, oxidation, raveling and surface permeability. In addition,
micro surfacing can be used to fill ruts and improve rideability by removing minor surface
irregularities. Micro surfacing is suitable for all traffic levels. In Ohio, micro surfacing treatment
has been primarily applied on high volume roads. A double application is required for traffic
volumes in excess of 10,000 vehicles per day [1]. Figures 3 and 4 depict micro surfacing
treatment in progress and completed surface respectively.
Page 17
3
Figure 3. Micro Surfacing Treatment in Progress
Figure 4. Finished Micro Surfacing Project
Page 18
4
2.0 OHIO DEPARTMENT OF TRANSPORTATION SPECIFICATIONS AND
QUALITY REQUIREMENTS
2.1 Chip Seal
In 1997, the ODOT specification for surface treatment item was Seal Coat (Item 409),
and consisted of a traditional cut-back asphalt binder and graded aggregate. In 2000, ODOT
adopted a supplementary specification which substituted a polymer-modified asphalt emulsion
for the traditional cut-back binder in surface treatments. In late 2001, the current chip seal item
was adopted as a supplementary specification (Item 821) and continued as a standard (Item 422)
in the 2002 Construction and Materials Specification (CMS) [2]. Among other refinements, the
new provisions provided for:
Use of a polymer-modified asphalt emulsion binder, which sets up more quickly, retains
chips better, and is generally more durable.
Use of a more restricted (uniform) aggregate gradation to promote chip retention.
Use of a job-mix formula to promote quality control of the aggregate gradation.
Use of a test strip to demonstrate that the contractor‟s materials and construction
techniques are capable of producing the desired result.
A unique evaluation criterion, based on visual observation of the finished surface, is in force for
the quality control and acceptance of chip seal jobs in Ohio [3]. Three types of defects are
evaluated namely, surface patterns, bleeding/flushing, and loss of cover aggregates. The finished
surface is reviewed to ensure: (i) a uniform pattern without alternate lean and heavy lines, (ii)
appropriate amount of binder not leading to bleeding/flushing, and (iii) no loss of aggregate from
the surface.
Page 19
5
2.2 Micro Surfacing
While micro surfacing is a more recent development than chip sealing, it too has been in
use for many years. Micro surfacing was originally developed in Germany in the early 1970's by
engineers who were seeking a way to modify a conventional slurry-seal to permit it to be used as
a narrow, wheelpath inlay to correct rutting without destroying the expensive striping on the
autobahns. The German engineers succeeded by developing a special (proprietary) blend of
aggregates, polymers and emulsifiers.
This product was introduced in the U.S. in 1980 as “Ralumac”, a trade-marked product
distributed by Koch Materials. Based on the ability of the material to provide stable layers of
variable thickness, the uses expanded over time from wheelpath inlays [4] to include wedge
courses, scratch courses, and full-width surfacing. Eventually, the treatment became the generic
product micro surfacing.
ODOT began using micro surfacing on an experimental basis in the early 1990's; it was
first included as a standard in the 1997 specifications (Item 406) and continued as Item 421 in
the 2002 CMS [2]. Due in large part to its history as a proprietary product, the ODOT quality
requirements for micro surfacing have not generally evolved in a manner similar to chip seals,
but basically have remained unchanged from the earliest installations.
2.3 Unresolved Issues Affecting the Successful Use of Chip Seal and Micro Surfacing
Treatments
2.3.1 Cost-Effectiveness
Of late, many highway agencies, including the Ohio Department of Transportation
(ODOT), are increasing their investment in chip seals and micro surfacing as a means of
preserving the system and postponing more costly rehabilitation efforts. Underlying this shift in
Page 20
6
focus is the widely-accepted assumption that these efforts are consistently cost-effective.
Nationally, it is estimated that a total of some 950 million square yards of chip seals and about
one million tons of micro surfacing are placed each year [4, 5].
In fact, despite the widespread use of chip seals and micro surfacing nationally, very little
performance monitoring has been performed to quantify their cost-effectiveness on pavements of
different levels of distress. For example, a literature review undertaken by the Wisconsin DOT
noted that only a few studies were found which were specifically designed to track the cost-
effectiveness of preventive maintenance treatments [6]. Further complicating this situation is the
relatively long time often required for the benefits of preventive maintenance to be realized in
terms of improved pavement condition [7]. Consequently, there is a lack of objective information
on such fundamental issues such as the expected improvement in pavement condition resulting
from the use of chip seals and micro surfacing, the extent to which the treatments slow the
deterioration of the pavement, and the optimum timing of the treatments. This lack of
information obviously inhibits making the most informed and effective decisions regarding
alternative maintenance strategies, funding levels, and other important issues of maintenance
administration.
2.3.2 Treatment Timing
As implied in the preventive maintenance mantra “apply the right treatment to the right
pavement at the right time”, many investigators have indicated that the real challenge in the
determination of cost-effectiveness is determining the optimal time to apply the treatment.
Time and money are the basic yardsticks for measuring cost-effectiveness. If a treatment
is placed too late–after structural distress has appeared– the treatment will be ineffective because
a structural distress will render the treatment ineffective due to premature failure created by the
Page 21
7
same underlying distress. Conversely, placing a treatment too early adds little benefit, and thus is
a waste of money. The optimal treatment time defines the window of time when preventive
maintenance treatments perform as intended, thus providing the most efficient use of funding to
extend pavement life (i.e., providing the greatest improvement at the lowest cost).
A recently concluded NCHRP study [8] summarized the problematic nature of the state-
of-the-practice with regard to optimal timing as follows:
There is almost no guidance available on the topic of optimal treatment time, even within
agencies identified as national leaders in preventive maintenance.
There is no indication that agencies are optimizing the timing of their treatment
placement, nor are there any signs that a form of optimization is actually being applied.
2.3.3 Integration of Preventive Maintenance and Pavement Management
A recurring point made in preventive maintenance guidelines is the essential need to
integrate an agency‟s preventive maintenance program with its pavement management system
(PMS). This permits the inclusion of strategies, facilitating planning and budgeting functions, to
promote more optimal treatments on a network scale.
A major remaining challenge to the integration of preventive maintenance treatments into
a PMS is the need to develop performance models for various preventive maintenance
treatments. Simply, to match feasible treatments with pavement conditions, the decision-maker
needs to be able to predict the short- and long-term changes in pavement condition expected to
result from the treatment.
Page 22
8
Unfortunately, due to a lack of data regarding the cost-effectiveness of maintenance
treatments in general, and the optimal treatment time in particular, (a) very few pavement
deterioration models include maintenance as an explanatory variable and (b) none have been
refined to the point of optimization. As a consequence, many agencies use estimates of the
service life of maintenance treatments based on local experience to formulate rules-of-thumb
which estimate the effect on the life of the pavement. For example, ODOT‟s Pavement
Preventive Maintenance (PPM) Training Manual [1] indicates that while no data currently exists
concerning Pavement Condition Rating (PCR) trends of chip sealed or micro surfaced
pavements, the expected service lives are 5-7 and 5-8 years respectively, and in each case, the
rate of PCR drop should be similar to that observed since the last overlay.
3.0 CURRENT RESEARCH TRENDS
3.1 Specifications and Quality Requirements
As with any highway project, the successful application of a preventive maintenance
treatment requires consideration of both project planning and project execution. In the case of
chip sealing and micro surfacing, success in the planning phase basically requires (a) suitably
matching feasible treatments with pavement conditions based on their cost-effectiveness and (b)
determining the appropriate treatment timing.
3.1.1 Chip Seals
A number of national studies of chip seal performance [9, 10], including installations
made as part of the Long-Term Pavement Performance (LTPP) SPS-3 experiment [11, 12],
indicate that these treatments generally perform well. However, despite their widespread use and
Page 23
9
reported successes in preventive maintenance, the performance of chip seals does not always
meet expectations. Slow curing times, unpredictable quality, premature failures, and vehicle
damage from unbound chips continue to be reported. As recently noted by the Foundation for
Pavement Preservation, chip sealing continues to be an art, and when not properly applied, can
result in early failures and costly reactive maintenance [13]. For example, in a recent Utah
survey [14], responses from 18 states that use chip seals indicated that an estimated 27% of
installations fail prior to overlay. In part, these failure rates reflect differing definitions of failure
between agencies and differences in service conditions (i.e., chip seals are obviously used for
corrective as well as preventive maintenance).
A number of initiatives have recently been undertaken by highway agencies to improve
chip seal performance, including:
Use of a design procedure to assess the proper amount of aggregate as well as the
quantity of binder. Some agencies (including ODOT) specify an application rate for the
chip seal binder, but not the aggregate. Based on extensive field research, the Minnesota
DOT (MnDOT) has found that a chip seal design procedure that yields a specific target
rate for applying the aggregate results in more durable treatment, with reduced potential
for excess chips [15]. The MnDOT design procedure is a variation of the McLeod
method used in the SHRP research. Minnesota reports that the aggregate application rate
determined from the design process is almost always the correct rate to apply in the field.
Because the binder rate depends on the texture and porosity of the existing pavement, it
often needs to be adjusted (usually upwards). Based on the MnDOT‟s convincing
research, South Dakota [16] and Iowa [17] have recently opted to use the design
procedure.
Page 24
10
New test methods for predicting field performance of chip seal aggregates. ASTM has
recently adopted a performance-related test procedure which reportedly better
characterizes the breaking, curing and chip retention of chip seal emulsions using project
materials [18].
Use of a more uniform aggregate gradation. This permits the use of a thicker membrane,
which promotes long- term adhesion of the aggregate, higher surface friction, and better
waterproofing characteristics [15].
Use of faster setting emulsions. This permits earlier opening to traffic [19].
3.1.2 Micro surfacing
Unlike chip sealing, few recent studies have been undertaken which are specifically
directed at improving specifications and quality requirements for micro surfacing.
The most significant current work on this topic is a pooled fund study designed to
develop improved mix design procedures for slurry seals and micro surfacing. The overall goal
of the study is to improve the performance of slurry seal and micro surfacing systems through the
development of a rational mix design procedure, guidelines, and specifications. Fourteen states
are currently participating in the study, with Caltrans serving as the lead agency [20].
The pooled fund study was undertaken in recognition of the fact that--despite the
widespread use of slurry seals and micro surfacing-- current tests and design methods for these
treatments are primarily empirical and not related to field performance [21]. The current design
procedure for micro surfacing (A143) by the International Slurry Seal Association and the
corresponding ASTM Standard (D6372) were originated in the 1980's before the widespread use
Page 25
11
of micro surfacing and polymer-modified emulsions. The problems associated with the current
existing methods for micro surfacing were documented in Texas Transportation Institute (TTI)
studies [22]. In a nutshell, to achieve success with micro surfacing, the current practice relies
heavily on the experience of the construction crew; to more consistently provide good results,
what is needed are additional performance-related design inputs. Recognizing this need, the
FHWA enlisted Caltrans to form the pooled fund study.
In addition to developing improved micro surfacing mix design procedures, the Caltrans
study is intended to:
provide guidance on the appropriate use of the treatment (e.g., pavement conditions),
identify characteristics that ensure long-term performance,
provide guidance on project selection, and
provide recommended project specifications.
3.2 Analysis Methodology for Preventive Maintenance Treatments
3.2.1 Optimal Treatment Timing
Currently, the guidance for timely application of preventive maintenance is often very
general. For example, based on practices recommended by the SHRP research, the average
asphalt-surfaced highway should receive an initial preventive maintenance treatment after 7
years, a second treatment after 14 years, and an overlay after 19 years. A study of the economics
of preventive maintenance indicated that current practice is to apply preventive maintenance later
in a pavement‟s life cycle. Such a practice necessitates an earlier overlay [23].
Page 26
12
Several recently completed studies [8, 24] address the treatment timing issue. For the
most part, the cited studies have primarily involved modeling, rather than the collection and
analysis of field data. For example, because of the limited amount of data available to support an
analysis of preventive maintenance performance at various application timings, the focus of the
NCHRP study [8] was changed from developing a guide for optimal timing to developing a
spreadsheet-based analytical tool. This tool (“OPTime”) should be useful in assessing “what if”
treatment timing scenarios.
3.2.2 Quantifying Effectiveness
A recent publication by Purdue researchers [25] quantified the effectiveness of micro
surfacing treatments. Based on a review of 29 completed projects, they reported that micro
surfacing can offer average reduction of 0.442 m/km International Roughness Index, 4 mm rut
depth and 6.2 points increase in pavement condition rating. The report also stated that the
average service life offered by micro surfacing treatment is five years.
3.2.3 Cost-Effectiveness Models
A number of economic models are available for analyzing the cost-effectiveness of
preventive maintenance treatments, each of which has advantages and disadvantages. These
various approaches are distinctly different:
some are very simple, others are relatively complex;
some focus on minimizing costs, others on maximizing benefits, and some address
both (i.e., benefit/cost ratios);
some provide a direct measure of monetary benefits/costs, others rely on a surrogate
(indirect) economic measure;
Page 27
13
some focus on the economic impact on the highway agency, others on the consequences
to the motorist, and
some are based on relatively short-term data (treatment service life), others require long-
term data (extensions of pavement service life).
The cost-effectiveness evaluation technique recommended for use by the Foundation for
Pavement Preservation [26] and others [27] is the Equivalent Annual Cost method. The
computation required for this technique, which was used by Louisiana in a study of chip sealing
and micro surfacing [28, 29], is simply the ratio of treatment construction cost to the expected
service life of the treatment.
While the EAC method is undoubtedly useful as a way of comparing the relative costs of
alternate treatments of known cost-effectiveness, it is ill-suited to determining whether or not
those treatments are in fact cost-effective in the first place. Simply, this approach provides no
insight on the central question of cost-effectiveness: “What are the economic consequences of
applying this preventive maintenance treatment–i.e., the benefit in terms of extended service life
or other quantitative effect on pavement performance– as compared to the do-nothing
alternative?”
Resolving this economic issue requires use of a model which (a) takes the time-value of
money into account and (b) focuses on pavement service life, not treatment life. One such model
was used in cost-effectiveness analyses undertaken in the previously-cited Purdue study [24].
There, for a variety of preventive maintenance strategies, an Incremental Benefit Cost Ratio for
each strategy relative to the zero-maintenance strategy was computed.
Page 28
14
Once the necessary comparative field performance data has been obtained, computation
of the cost term is very straightforward, requiring application of well-established Life-Cycle Cost
Analysis (LCCA) procedures. The results of this computation are a direct measure of the savings
resulting from the deferral of time to overlay, reduced overlay thickness required, and/or reduced
need for corrective maintenance resulting from the preventive treatment.
Computation of the benefits term is less direct. Indeed, because of the difficulty
traditionally encountered in quantifying differential performance benefits between alternate
project strategies, highway engineers often make simplifying assumptions that avoid the benefits
issue in economic analyses. For example, LCCA procedures assume that the benefits of keeping
the roadway above some pre-established terminal serviceability level are the same for all design
alternates [30]. Thus, the procedures do not consider the condition of the pavement in the
analysis and assume that the lowest cost treatment is the best one.
The approach to the computation of benefits adopted by the Purdue researchers was to
use area under the performance curve as a surrogate measure of monetary benefits. This concept
has been in use since the 1980's, particularly in studies designed to assess the notoriously
difficult-to-quantify user benefits associated with highway projects [9]. The concept has great
intuitive appeal: a consistently well-maintained pavement (with a gently sloping performance
curve, yielding a large area under the curve) provides greater benefits to motorists than a poorly
maintained pavement (with a steep performance curve having a small underlying area).
The NCHRP Optimum Timing study also used performance curve area as a surrogate
measure of the benefits of preventive maintenance treatments. While the study did not address
cost-effectiveness directly, the criteria used to select optimum timing were defined as the time at
Page 29
15
which the benefit-cost ratio was a maximum. The numerous refinements in the techniques for
analyzing performance curves developed during the NCHRP work can be accessed through the
use of the study‟s OPTime computer program.
4.0 PRESENT STUDY – SCOPE AND OBJECTIVES
Since the inception of standards 421 (Micro Surfacing) and 422 (Chip Seal), there has
been a steady interest in Ohio in using these treatments. Figure 5 illustrates the extent of chip
and micro surfacing applications.
Figure 5. Chip Seal and Micro Surfacing Projects in Ohio
Assessment of performance and cost-effectiveness of these treatments is currently based
on anecdotal observations and experience, rather than on objective data from a systematic
investigation. Recognizing the importance of these information needs, the present study was
undertaken to systematically evaluate the performance and cost-effectiveness of its current chip
0
5
10
15
20
25
30
35
40
19
90
19
91
19
92
19
93
19
94
19
95
19
96
19
97
19
98
19
99
20
00
20
01
20
02
20
03
20
04
20
05
20
06
Nu
mb
er
of
pro
ject
s
Chip Seal Micro-Surfacing
Page 30
16
seal and micro surfacing program. The primary objective of this study is to comprehensively
evaluate and quantify the cost-effectiveness of ODOT‟s current chip seal and micro surfacing
pavement preventive maintenance treatment practices based on a review of historic performance
data. The research was directed to address the following three basic issues:
Treatment effectiveness: how well do chip seals and micro surfacing correct the existing
distress which they are intended to remedy?
Extension of pavement service life: to what extent does each of the treatments delay the
pavement deterioration process?
Influence of treatment time: what is the optimal time or pavement condition when the
treatment can be most effectively applied?
This study resulted in a critical review and comprehensive understanding of the chip seal and
micro surfacing program in Ohio and provided the basic data needed to determine when and
where such preventive maintenance treatments are appropriate from the standpoint of both
economics and performance. This report describes the details of the study.
5.0 DESIGN OF EXPERIMENT
The evaluation of the performance of a maintenance treatment requires the application of
the particular treatment to an in-service pavement and monitoring its condition over a period of
time. The effectiveness of the treatment can be determined using two approaches:
1. By comparing the relative performance of the treatment with an option of not doing
anything to the pavement, termed as „do-nothing‟ treatment;
Page 31
17
2. By comparing the performance of the treatment with another treatment whose
performance has previously been established.
The first approach will lead to an evaluation of performance effectiveness while the second
approach provides data to determine the cost-effectiveness of the treatment under investigation.
A do-nothing treatment will not have cost associated with the treatment and hence impedes cost
comparisons. As a result, the pavement engineers often use one of the available treatments as a
benchmark. It should be recognized that the performance and cost-effectiveness details of the
benchmark treatment should be available to the agency.
In either case, it is necessary to apply the treatment to a large number of pavements so as
to encompass a variety of variables such as pavement type, composition, traffic and
environmental characteristics. Such a field experiment will provide the necessary data required
to statistically evaluate the effectiveness of treatments under investigation.
Although a field experiment can provide the much needed data for performance and cost-
effectiveness evaluation, it is obvious that setting up an experiment will require an enormous
amount of time and effort to - identify candidate projects, select pavement sections, apply
treatments, and monitor their condition over the full service life of treatments. According to
ODOT‟s preventive maintenance guidelines, average life of chip seal and micro surfacing
treatments vary from 5 to 8 years. To (a) confirm these service life projections and (b) develop
treatment performance curves, data should be collected for up to eight years after the treatment.
Hence, as an alternate, it was decided to explore the possibility of using historic data to study the
behavior of constructed pavements and evaluate the performance of chip seal and micro
surfacing treatments in Ohio.
Page 32
18
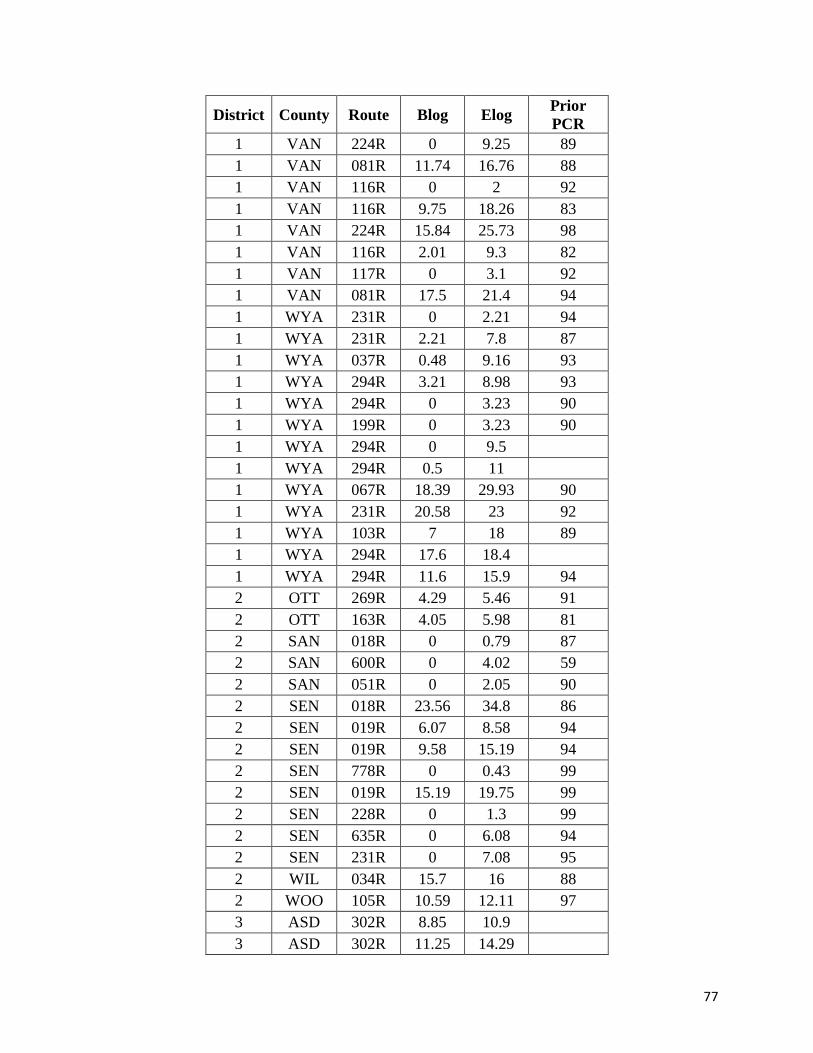
6.0 REVIEW OF ODOT’S PAVEMENT MANAGEMENT DATABASE
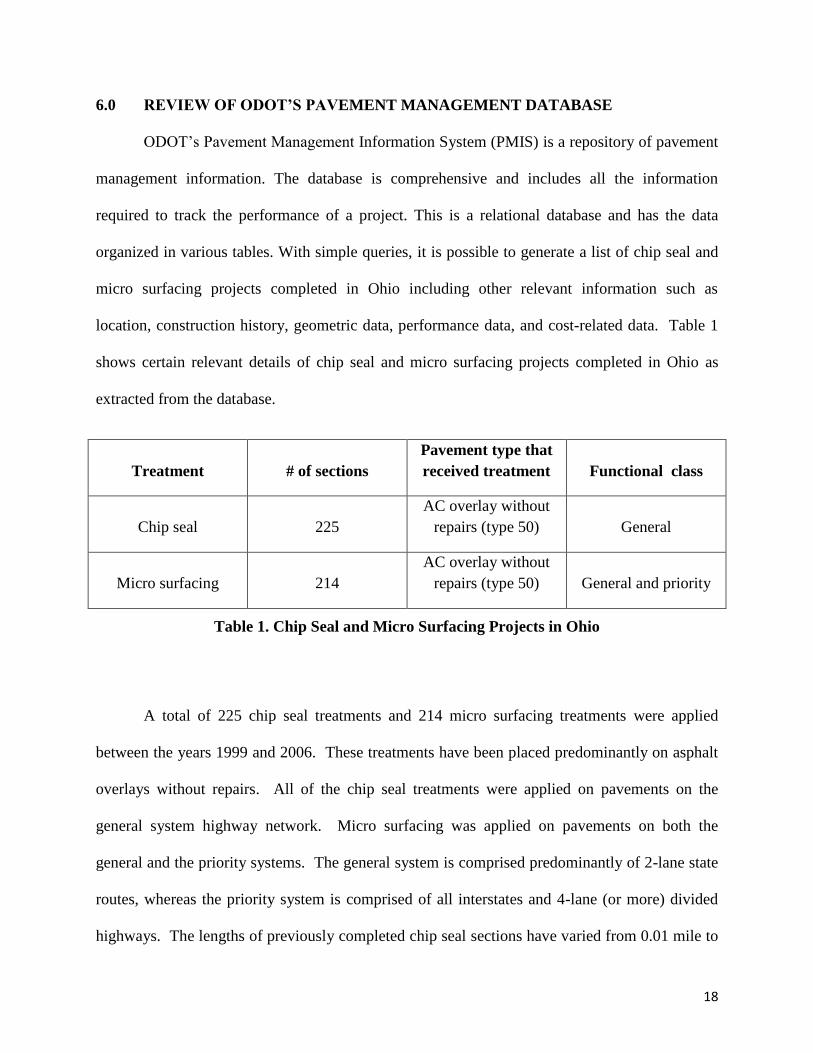
ODOT‟s Pavement Management Information System (PMIS) is a repository of pavement
management information. The database is comprehensive and includes all the information
required to track the performance of a project. This is a relational database and has the data
organized in various tables. With simple queries, it is possible to generate a list of chip seal and
micro surfacing projects completed in Ohio including other relevant information such as
location, construction history, geometric data, performance data, and cost-related data. Table 1
shows certain relevant details of chip seal and micro surfacing projects completed in Ohio as
extracted from the database.
Treatment # of sections
Pavement type that
received treatment Functional class
Chip seal 225
AC overlay without
repairs (type 50) General
Micro surfacing 214
AC overlay without
repairs (type 50) General and priority
Table 1. Chip Seal and Micro Surfacing Projects in Ohio
A total of 225 chip seal treatments and 214 micro surfacing treatments were applied
between the years 1999 and 2006. These treatments have been placed predominantly on asphalt
overlays without repairs. All of the chip seal treatments were applied on pavements on the
general system highway network. Micro surfacing was applied on pavements on both the
general and the priority systems. The general system is comprised predominantly of 2-lane state
routes, whereas the priority system is comprised of all interstates and 4-lane (or more) divided
highways. The lengths of previously completed chip seal sections have varied from 0.01 mile to
Page 33
19
13.47 miles while corresponding lengths of micro surfacing projects varied from 0.01 mile to
9.67 miles. A significant variable in the application of these treatments has been in the pavement
condition prior to the time of treatment. In Ohio, the pavement condition is expressed in terms
of Pavement Condition Rating (PCR). PCR is a composite index of several distresses. Various
forms of distresses depending on the pavement type - flexible, composite, jointed and
continuously reinforced concrete - formulate into this index. They are subjectively rated based
on the severity and extent of each distress type. Predefined weights are assigned for each
distress type, severity and extent and are used to calculate PCR of each pavement section. PCR
ranges from 0-100, with a pavement having no distress assigned a value of 100. ODOT‟s
pavement management database consists of PCR data for all the chip seal and micro surfacing
treated sections, for all the years they have been in service including the condition rating prior to
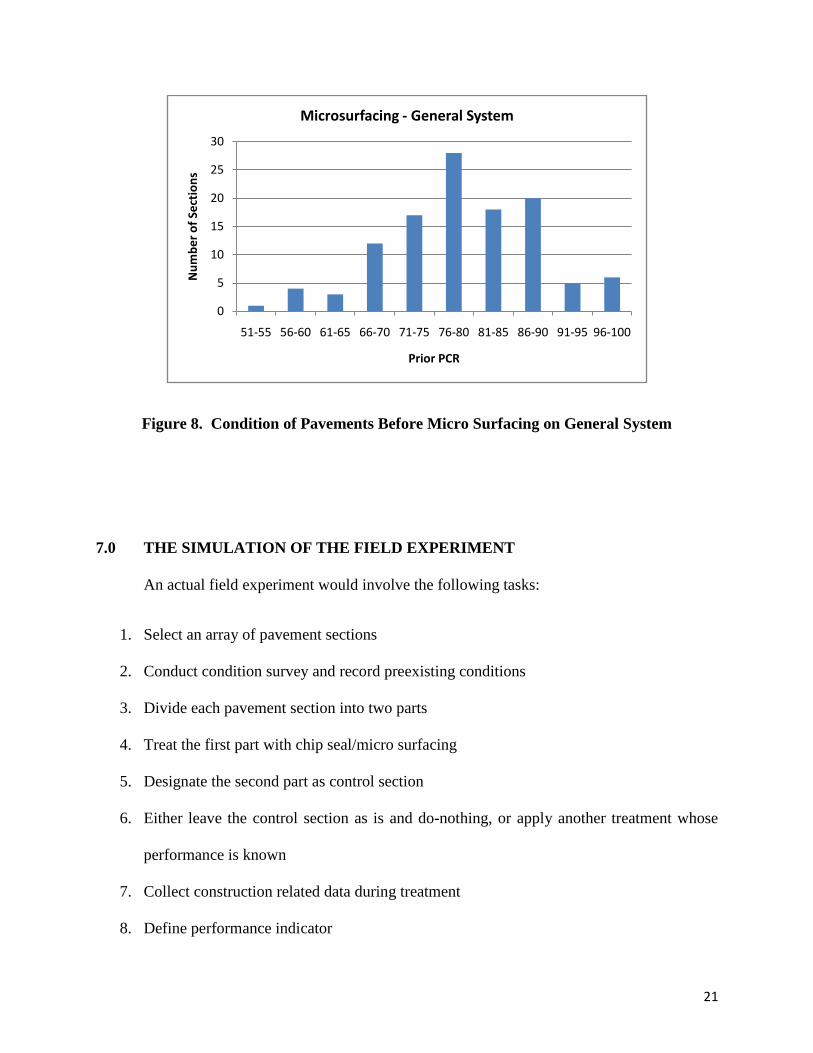
the treatment. Figures 6, 7, and 8 depict a distribution of PCR of pavements prior to the
application of chip seal and micro surfacing. Based on the availability of the PMIS data, the
development of a simulated field experiment to investigate the effectiveness of chip seal and
micro surfacing treatments was possible.
Page 34
20
Figure 6. Condition of Pavements Before Chip Seal Treatment
Figure 7. Condition of Pavements Before Micro Surfacing on Priority System
0
10
20
30
40
50
60
0-4
0
41
-45
46
-50
51
-55
56
-60
61
-65
66
-70
71
-75
76
-80
81
-85
86
-90
91
-95
96
-10
0
Nu
mb
er
of
Sect
ion
s
Prior PCR
Chip Seal Sections
0
5
10
15
20
25
51-55 56-60 61-65 66-70 71-75 76-80 81-85 86-90 91-95 96-100
Nu
mb
er
of
Sect
ion
s
Prior PCR
Micro surfacing - Priority System
Page 35
21
Figure 8. Condition of Pavements Before Micro Surfacing on General System
7.0 THE SIMULATION OF THE FIELD EXPERIMENT
An actual field experiment would involve the following tasks:
1. Select an array of pavement sections
2. Conduct condition survey and record preexisting conditions
3. Divide each pavement section into two parts
4. Treat the first part with chip seal/micro surfacing
5. Designate the second part as control section
6. Either leave the control section as is and do-nothing, or apply another treatment whose
performance is known
7. Collect construction related data during treatment
8. Define performance indicator
0
5
10
15
20
25
30
51-55 56-60 61-65 66-70 71-75 76-80 81-85 86-90 91-95 96-100
Nu
mb
er
of
Sect
ion
s
Prior PCR
Microsurfacing - General System
Page 36
22
9. Monitor performance of treated and control sections over a period of time
10. Develop performance curves
11. Analyze the data for cost-effectiveness of treatments
The simulation of such a field experiment requires inclusion of the above tasks and emulating all
the field conditions that prevail during the field experiment. To begin with, several queries were
written to extract a list of chip seal and micro surfacing treated pavement sections from the
pavement management database. The list included project location, limits, pavement type, date
of treatment, type of treatment, PCR data before the treatment and for every year during the
service life, and functional classification of pavements. Information about the cost of treatments
was obtained from construction records.
The next step was to identify control (do-nothing) sections having similar attributes as the
treated pavements but did not receive any treatment. In a field experiment, the control sections
are generally placed adjacent to the experimental sections and hence satisfy the required
conditions of control sections. However, in a simulated experiment, it was a challenge to
identify control sections from the database. A careful review of the database revealed that the
pavement sections directly adjacent to the treated sections either received different treatments or
had different characteristics. Hence, in order to locate control sections, the pavement
management database was systematically queried to generate a list of possible control sections
corresponding to each treated section. The main principle of this effort was to generate data that
would allow comparing the performance of a treated section with that of a control section from a
point in the service life of control section that is close to the conditions before the application of
Page 37
23
a treatment. This data formed the basis for investigating the performance effectiveness of chip
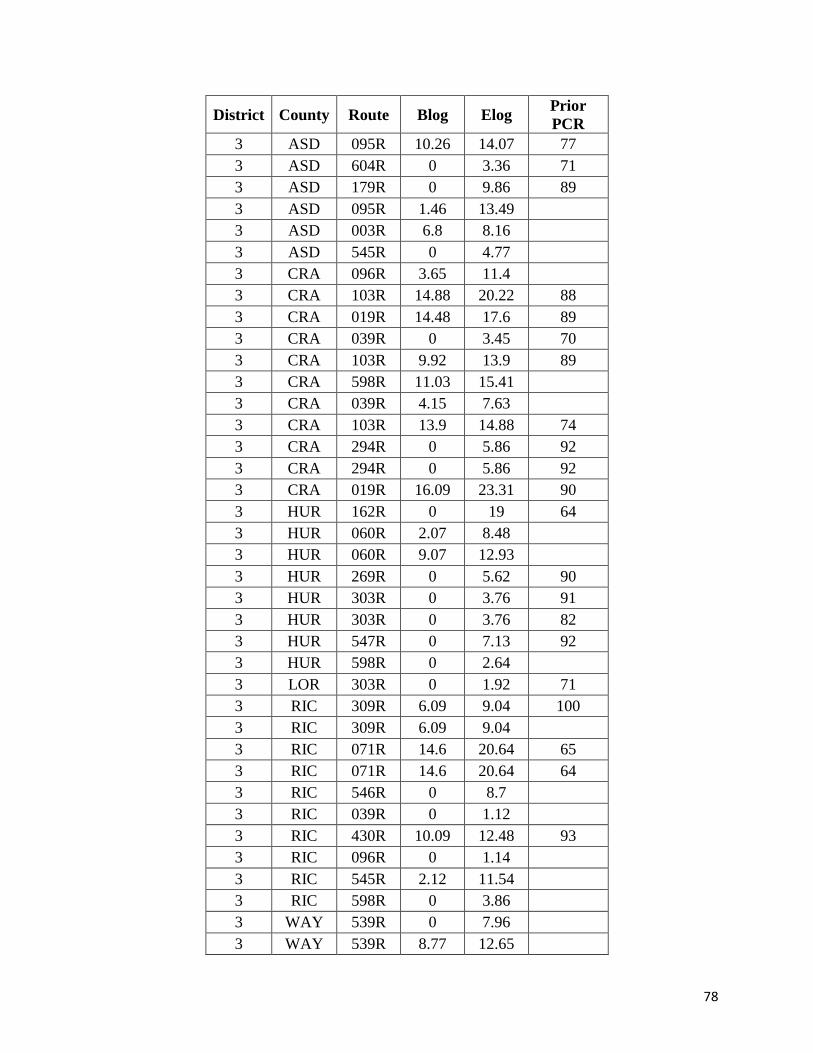
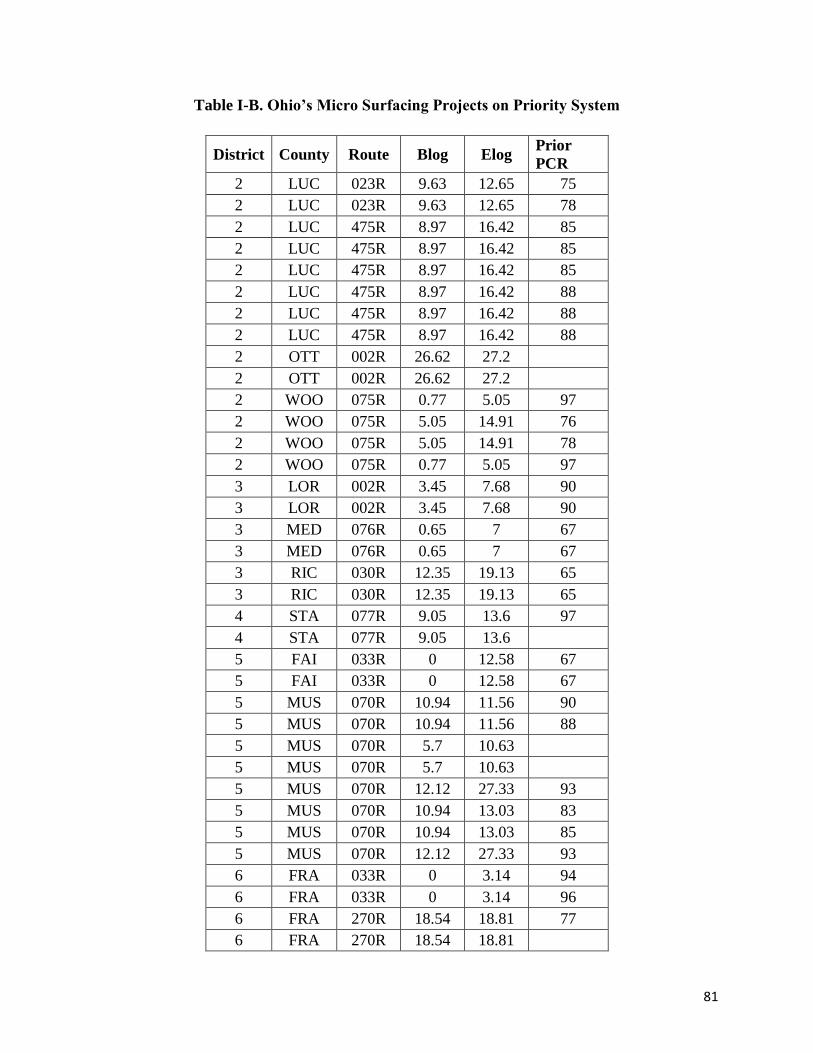
seal and micro surfacing treatments. The database thus generated is listed in Tables I-A, I-B and
I-C in Appendix I.
The layout of each test section simply consisted of a uniform pavement section treated
with chip seal or micro surfacing. Control section with similar attributes through its length -
type, severity and extent of distresses, pavement composition, maintenance and rehabilitation
history, performance history, soil type, and traffic – was identified from the database to match
the attributes of treated section. The control section represented “Do-Nothing” treatment.
The above effort culminated in the development of a database to compare performance of
chip seal and micro surfacing with do-nothing treatment. In addition, it was also intended to
compare the performance of these treatments with another maintenance treatment so as to derive
information about cost-effectiveness. In consultation with ODOT engineers, the thin AC overlay
treatment was chosen for this purpose. The primary reason for this decision was that this
treatment was recently investigated by ODOT and hence the performance and cost-effectiveness
data was available. The benefit cost computation published in the report [31] was used to
compare the cost-effectiveness of chip seal and micro surfacing treatments.
8.0 PERFORMANCE INDICATORS
An important aspect of this experiment was to clearly define the performance indicators
that can adequately describe the performance and cost-effectiveness of chip seal and micro
surfacing treatments. In view of the data assembled, the following performance indicators were
derived:
Page 38
24
1. Service life of treatments based on actual number of years in service
2. Average performance gain
3. Service life of treatments (using performance prediction models)
4. Cost-effectiveness
5. Life cycle costs
8.1 Service life of treatments based on actual number of years in service
The data for this task was obtained directly from ODOT‟s PMIS. A pavement section is
deemed to have completed its service life when a maintenance and/or rehabilitation activity is
reported in the database following the treatment installation. The service life of chip seal and
micro surfacing treatments was calculated as the time from the period of treatment installation
till the time another activity was reported in the database. Construction records available in the
database and project plans were used to obtain the dates of construction required for this task.
Occasionally, there were some treated sections for which no further construction activity was
reported. However, an increase in performance rating was noticed a few years after the
treatment installation. In such events, based on consultation with ODOT engineers, an activity
was assumed to have been performed when a five or more point increase in PCR was noticed in
one year. Figure 9 depicts the procedure adopted to determine the service life of treatments
using the historic data.
Page 39
25
Figure 9. Calculating Service Life of Treatments Using Historic Data
8.2 Average Performance Gain
Figure 10 illustrates the method adopted for deriving average performance gain. The
graph and the PCR values shown are typical of performance history of pavement sections
investigated in the present study.
Page 40
26
Figure 10. Calculating Performance Gain
The figure shows two performance curves – one for a control section and the other for a
treated pavement. The in-service pavement was treated when its PCR was 78. As a result, its
PCR increased to 92. The performance of the treated pavement is shown in the figure. The PCR
value obtained before the treatment was designated as „prior PCR‟. The control section was
identified from the database. The control section has very similar attributes as that of the treated
section and is closest in proximity. The performance of the control section from the point when
its PCR is identical to the prior PCR value of the treated section was compared with the treated
section as illustrated in the figure. Performance gain for each year was calculated as the
difference in PCR between the treated and control sections, Table 2.
Page 41
27
Age, years PCR of treated pavement PCR of control section PCR difference
0 92 78 14
1 89 74 15
2 83 69 14
3 75 66 9
4 70 63 7
Average performance gain: 12
Table 2. Calculating Average Performance Gain
As can be seen, the performance gain varies with time, with maximum gain achieved soon after
the treatment and the difference in PCR becoming narrower with time. Average performance
gain was calculated as the average of PCR difference. Performance data was most often
available for the treated sections for 3 to 5 years. As a result, a minimum of three and up to five
years data was used to calculate the average performance gain.
Another point to be recognized is that, sometimes more than one pavement section was
found to be candidate control section for a given treated pavement. In such cases, the average
performance of all those sections was used to represent a control section.
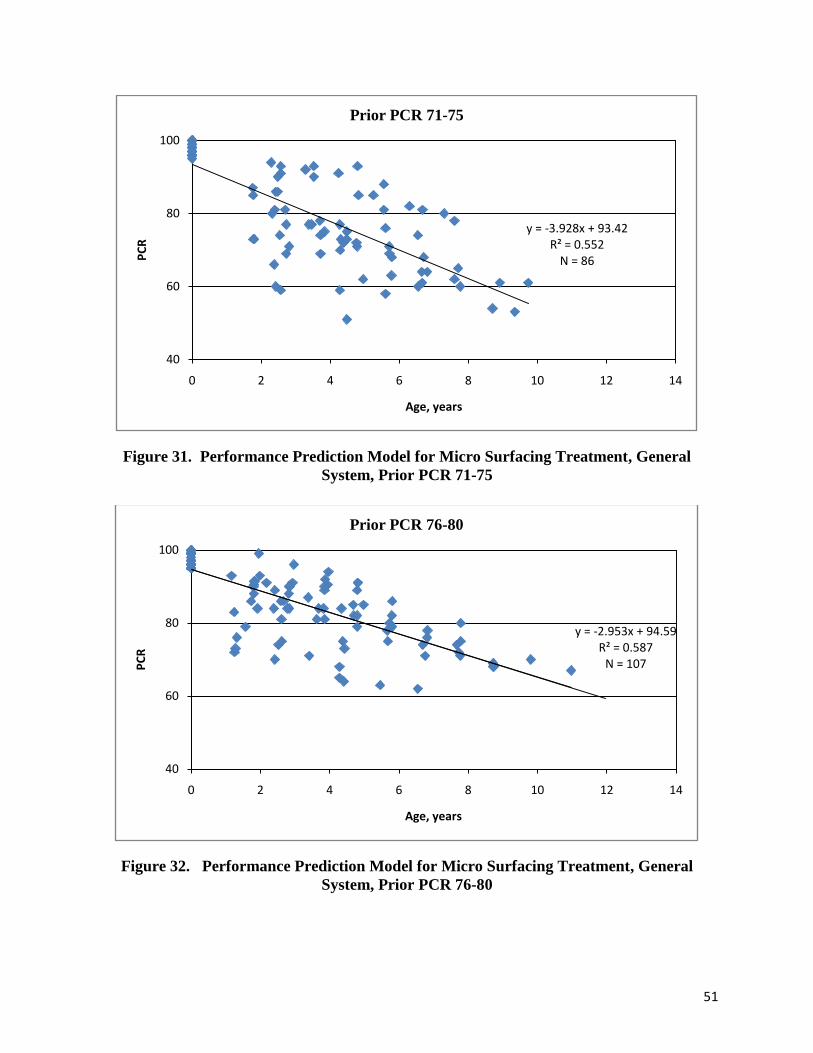
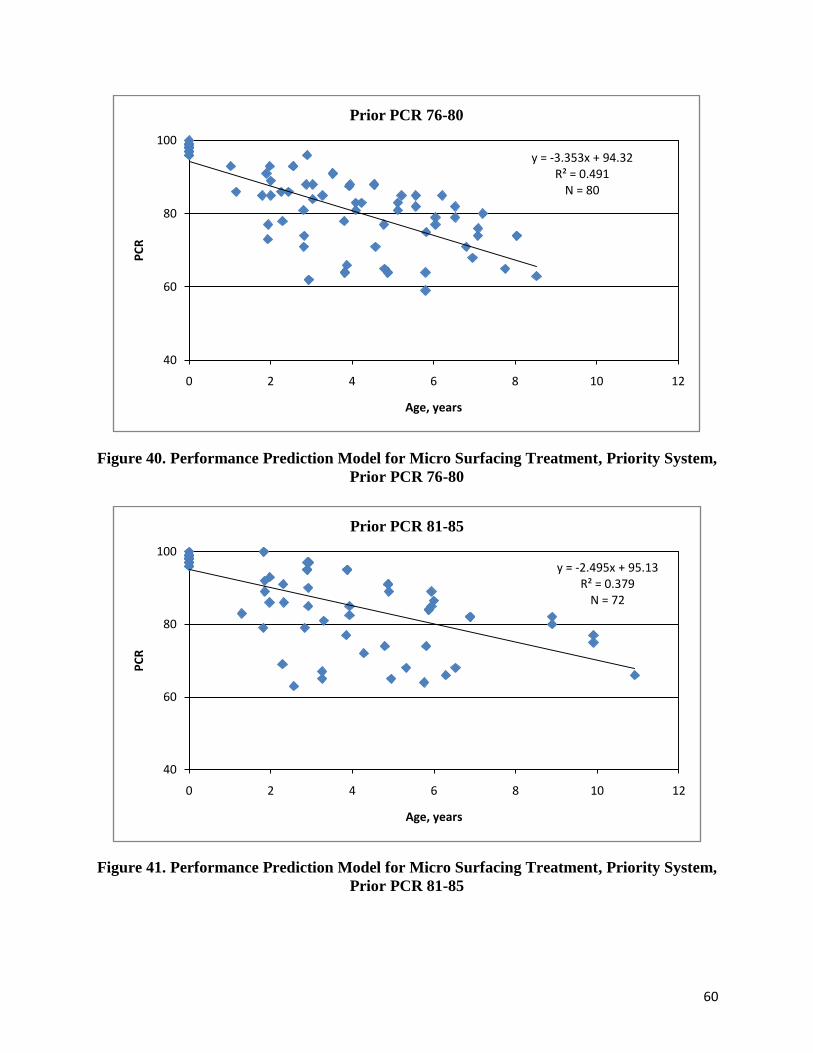
8.3 Service Life of Treatments (using performance prediction models)
As a precursor to the analysis, PCR groups were created on a 5-point scale beginning
from 51, such as 51-55, 56-60 and so on. All the treated pavement sections included in the study
were placed in one of these groups based on their prior PCR values. Performance prediction
models were developed for each group of treated pavements with PCR as a function of age.
Various types of models namely linear and non-linear were attempted. It was determined in
most instances that the linear models either provided the best fit or another shape was marginally
Page 42
28
better. For the sake of uniformity, only the linear models are presented. The number of years
required for any group of pavements to reach a threshold PCR value was read from the graph and
this value was reported as the life of the treated pavements. The threshold PCR values used in
the analysis is 60 for general system and 65 for priority system roads. It should again be
recognized here that, all chip seal installations were made on general system roads while micro
surfacing installations were made on both general and priority system roads.
An example of the illustrated method is shown in Figure 11. Following this, the life of
the treated pavements corresponding to each PCR group was tabulated.
Figure 11. Calculating Life of Treatments Using Performance Prediction Models
Page 43
29
8.4 Cost-effectiveness
Cost-effectiveness analysis is a method of comparing the relative efficiency (in monetary
terms) of two or more alternatives, which allows the decision-maker to consider whether one
preventive maintenance treatment is better than the other. Such comparisons are made between
two competing materials to determine the relative cost-effectiveness.
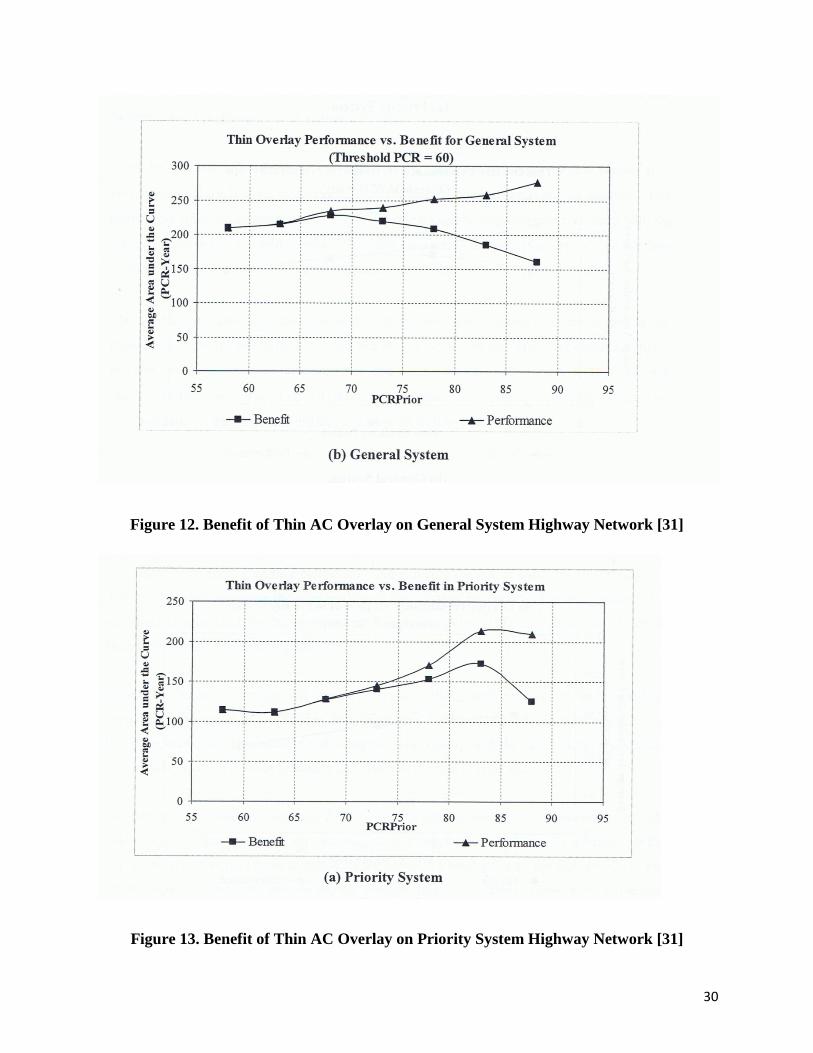
In 2008, ODOT, in association with the University of Toledo, completed a study to
investigate the effectiveness of thin overlays as a cost effective maintenance alternative [31].
Thin overlays of thickness two inches or less are commonly used in Ohio with the intent to
improve pavement performance and extend the service life of in-service pavements. In using the
historic data, the study concluded that thin overlays provide cost effective maintenance solutions.
As a part of the study, the UT researchers developed performance prediction models and
reported area under the performance curve as benefit of thin overlays. Figures 12 and 13 show
the benefit curves developed by the UT researchers for the general and priority systems.
Page 44
30
Figure 12. Benefit of Thin AC Overlay on General System Highway Network [31]
Figure 13. Benefit of Thin AC Overlay on Priority System Highway Network [31]
Page 45
31
Cost-effectiveness of thin overlays was calculated as the ratio of benefit and cost of the
treatment. Benefit values were derived for various pavement condition scenarios as noted in the
figures above. Cost information was assembled from a review of construction records of
previously completed projects.
In order to determine the cost-effectiveness of chip seal and micro surfacing treatments,
the cost-effectiveness of these treatments were compared with that of thin AC overlays. To do
this, it was necessary to generate benefit-cost ratios of chip seal and micro surfacing treatments.
Performance prediction models for each of these treatments were used to obtain the benefit, as
shown in Figure 14.
Figure 14. Computing Benefit of Treatment
Page 46
32
As illustrated in the figure, area of the performance curve was calculated and reported as the
benefit. Cost of chip seal and micro surfacing was obtained from construction records. Benefit
cost was computed for various groups of pavements depending on the prior PCR values. The
cost of the treatments used in the analysis was obtained in 2008 and is presented below:
Chip seal: $10,565 per lane mile
Micro surfacing – general system: $17,450 per lane mile
Micro surfacing – priority system: $26,350 per lane mile
Thin AC overlay: $66,358 per lane mile
In the next step, the ratio of the above two ratios, i.e., benefit-cost ratio of chip seal divided by
the benefit-cost ratio of thin AC overlay was determined. Terming this ratio „Relative Benefit
Ratio, it is expressed as:
If the ratio is greater than 1.0, it can be deduced that chip seal or micro surfacing treatments
provide more cost-effective performance than thin AC overlay, otherwise thin AC overlay would
be a more cost effective treatment.
8.5 Life Cycle Costs
Life cycle cost analysis entails consideration of an analysis period and selection of
various possible maintenance and rehabilitation scenarios during that period. A conceptual
illustration of the procedure used is shown in Figure 15.
Page 47
33
Figure 15. Life Cycle Cost Analysis of Chip Seal Treatment
The analysis presented here utilizes 15 year period. As shown, three different scenarios have
been considered. The scenarios are:
1. Three successive chip seal treatments
2. Chip seal followed by thin overlay
3. Two successive treatments of thin AC overlay
For micro surfacing jobs, similar scenarios were used. However, the service life of the
treatments varied.
Primary data used for this analysis was the life of treatments, cost of treatments and
discount rate. Regardless of prior pavement condition, all the data was combined and one
performance model was developed for each treatment type namely, chip seal, micro surfacing –
Page 48
34
general system and micro surfacing – priority system. Because of wide variation in preexisting
pavement conditions, the resulting models showed poor correlation. However, one use of these
models was to estimate life of treatments on an average for use in life cycle analysis. The values
used in the life cycle cost analysis are presented below:
Life of Treatment, years Cost of Treatment per lane mile
Chip Seal 7 years $10,565
Micro Surfacing – general system 9 years $17,450
Micro Surfacing – priority system 8 years $26,350
Thin AC Overlay 9 years $66,358
Discount Rate: 4 %
Net Present Value is used to determine the cost of the three alternatives using the formula:
NPV=N
t t
r
tC
0
)1(
Where:
t – time at which cash is spent
N – total time under consideration
r –discount rate
Ct – amount spent at time t.
In the first scenario, three successive chip seal treatments were assumed at seven year intervals.
At the end of 15 year analysis period, there was a salvage value of chip seal with a remaining
service life of six years. Straight line depreciation method was used for the determination of
Page 49
35
salvage value. Net present value of each scenario was computed and the scenario that provided
the least cost during the 15-year analysis period was considered most cost effective.
9.0 ANALYSIS OF CHIP SEAL TREATMENTS
9.1 Chip Seal - Service Life from Historic Data
As described in section 8.1, the service life of chip seal treatments was determined using
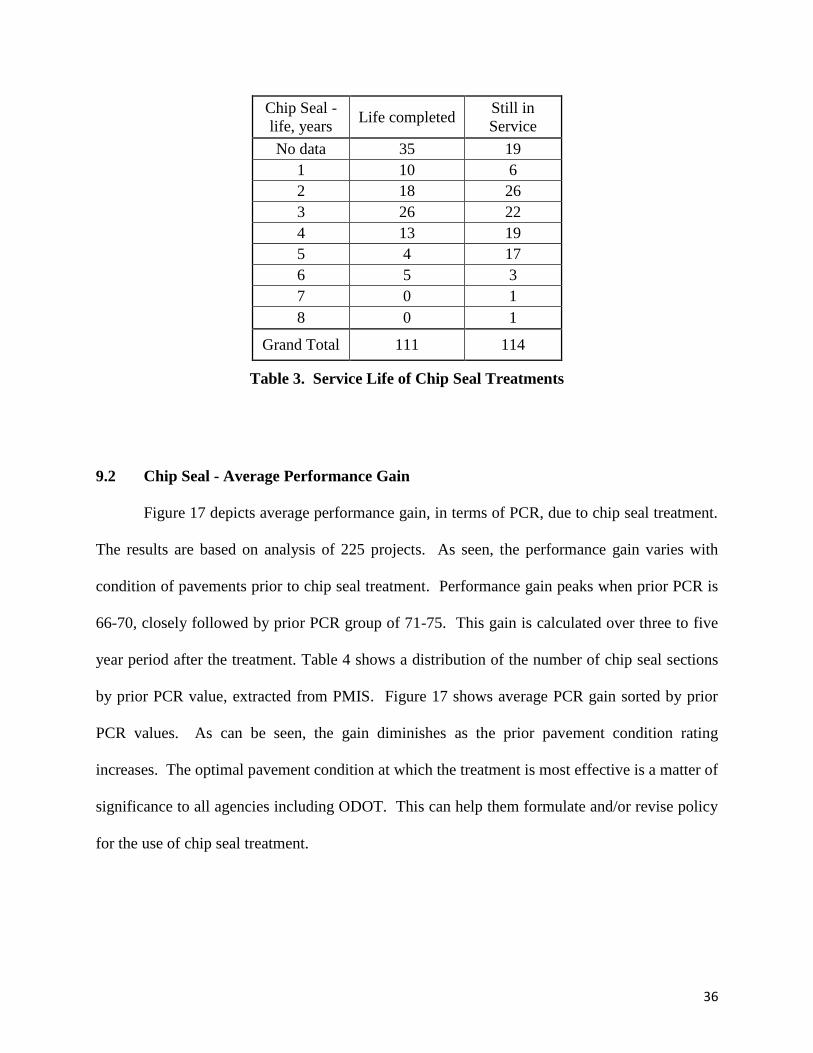
the data from previously completed projects. Figure 16 and Table 3 show chip seal projects that
have completed their service life and those still in service. Here the definition of „life
completed‟ is the pavement sections that have received another treatment after chip seal or the
PCR has increased by 5 or more points. Only the projects that have completed their service life
have been used in the analysis. Weighted average of service life was found to be 4 years. This
indicates, ODOT‟s chip seal projects are being renewed on an average at intervals of four years.
Figure 16. Service Life of Chip Seal Treatments
0
5
10
15
20
25
30
35
40
No Data
1 2 3 4 5 6 7 8
Nu
mb
er
of
Sect
ion
s
Age, years
Chip Seal Sections
Life completed Still in Service
Page 50
36
Chip Seal -
life, years Life completed
Still in
Service
No data 35 19
1 10 6
2 18 26
3 26 22
4 13 19
5 4 17
6 5 3
7 0 1
8 0 1
Grand Total 111 114
Table 3. Service Life of Chip Seal Treatments
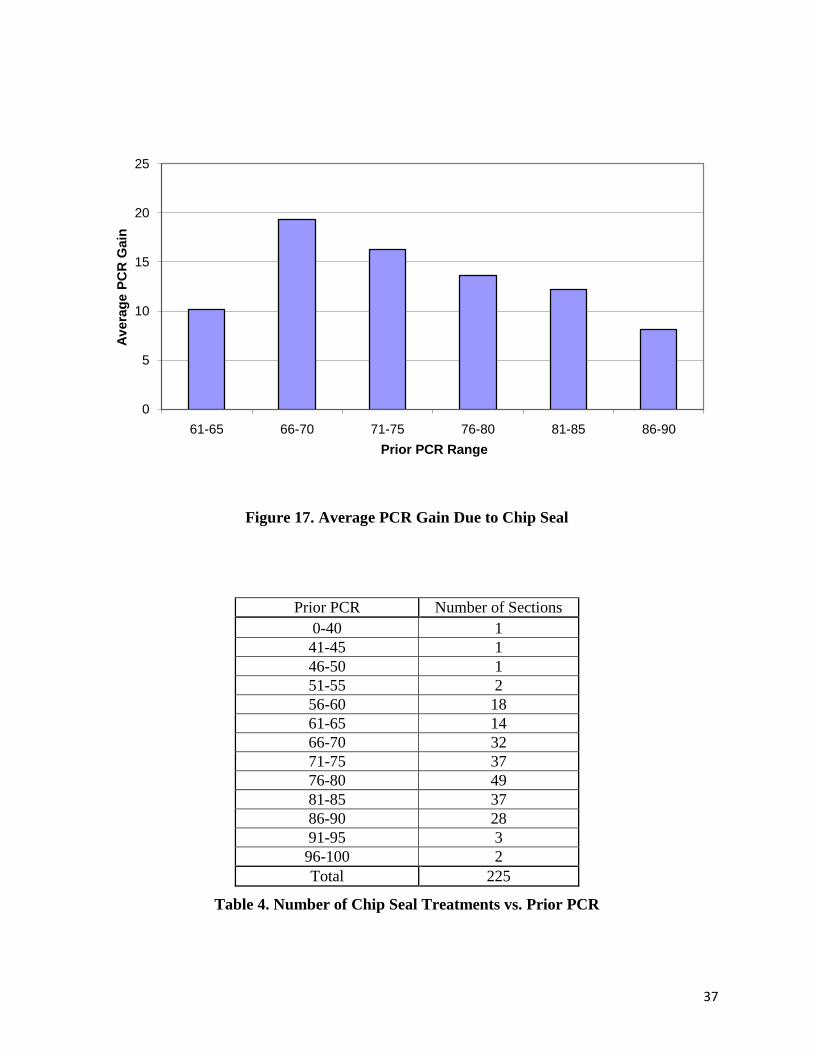
9.2 Chip Seal - Average Performance Gain
Figure 17 depicts average performance gain, in terms of PCR, due to chip seal treatment.
The results are based on analysis of 225 projects. As seen, the performance gain varies with
condition of pavements prior to chip seal treatment. Performance gain peaks when prior PCR is
66-70, closely followed by prior PCR group of 71-75. This gain is calculated over three to five
year period after the treatment. Table 4 shows a distribution of the number of chip seal sections
by prior PCR value, extracted from PMIS. Figure 17 shows average PCR gain sorted by prior
PCR values. As can be seen, the gain diminishes as the prior pavement condition rating
increases. The optimal pavement condition at which the treatment is most effective is a matter of
significance to all agencies including ODOT. This can help them formulate and/or revise policy
for the use of chip seal treatment.
Page 51
37
Figure 17. Average PCR Gain Due to Chip Seal
Prior PCR Number of Sections
0-40 1
41-45 1
46-50 1
51-55 2
56-60 18
61-65 14
66-70 32
71-75 37
76-80 49
81-85 37
86-90 28
91-95 3
96-100 2
Total 225
Table 4. Number of Chip Seal Treatments vs. Prior PCR
0
5
10
15
20
25
61-65 66-70 71-75 76-80 81-85 86-90
Av
era
ge P
CR
Gain
Prior PCR Range
Page 52
38
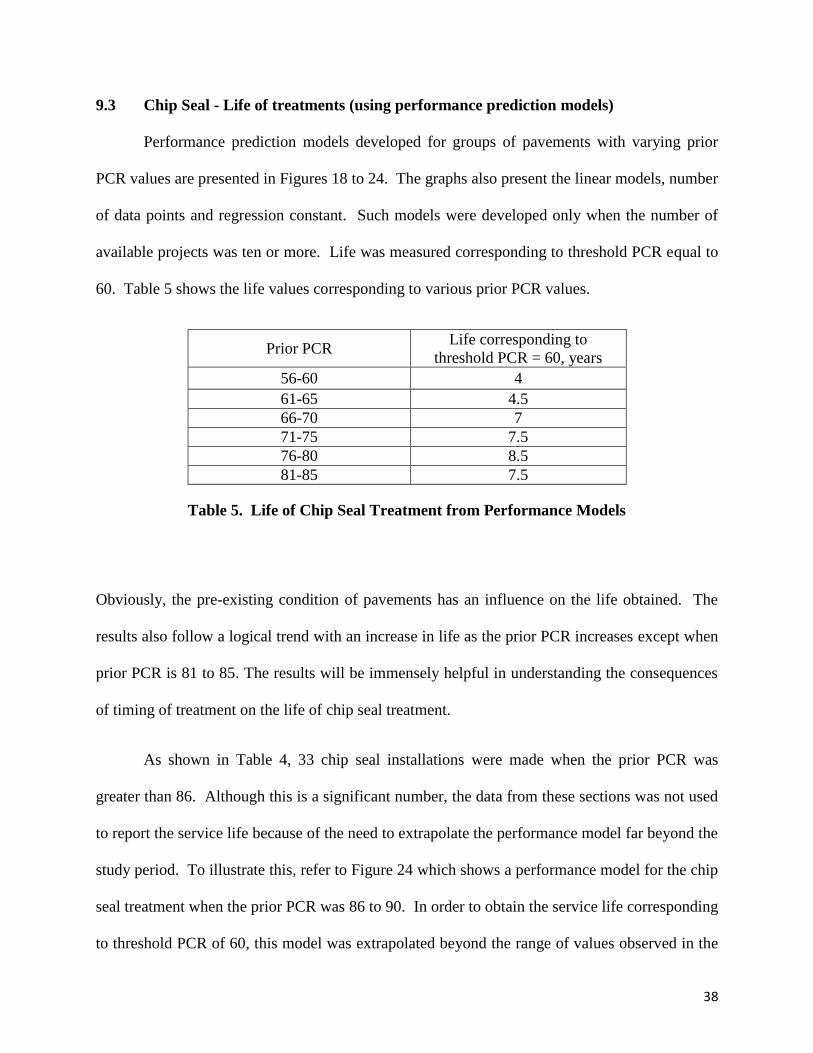
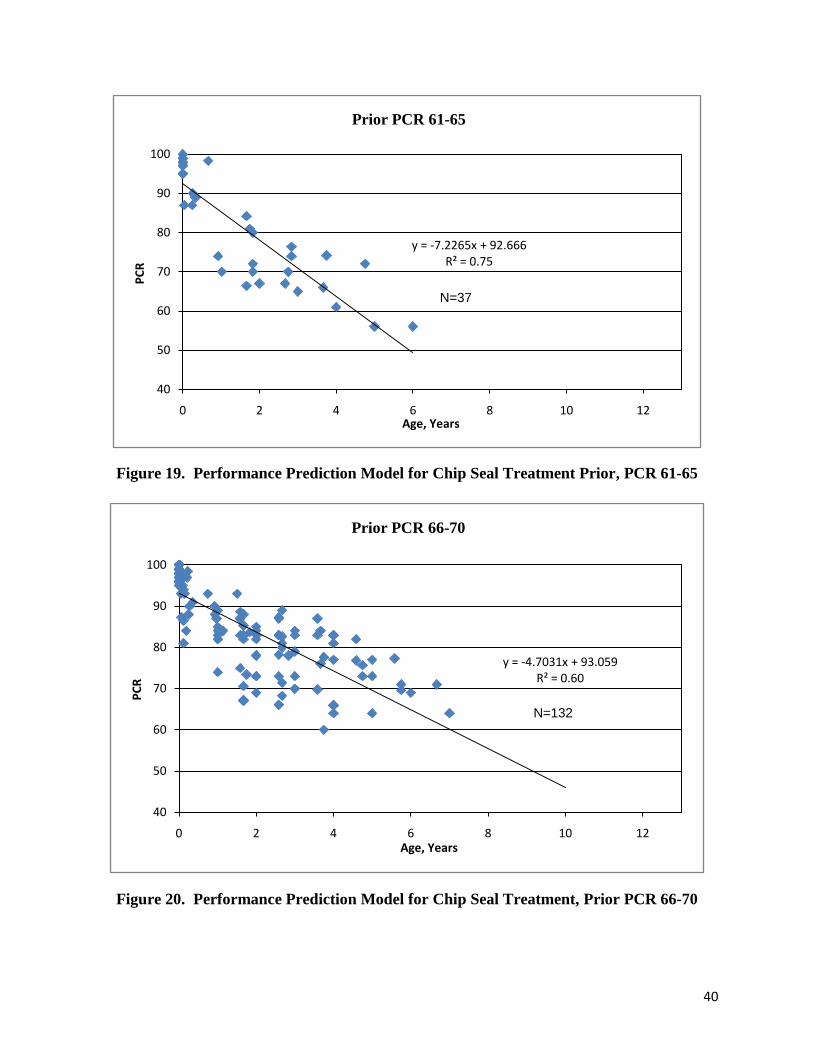
9.3 Chip Seal - Life of treatments (using performance prediction models)
Performance prediction models developed for groups of pavements with varying prior
PCR values are presented in Figures 18 to 24. The graphs also present the linear models, number
of data points and regression constant. Such models were developed only when the number of
available projects was ten or more. Life was measured corresponding to threshold PCR equal to
60. Table 5 shows the life values corresponding to various prior PCR values.
Prior PCR Life corresponding to
threshold PCR = 60, years
56-60 4
61-65 4.5
66-70 7
71-75 7.5
76-80 8.5
81-85 7.5
Table 5. Life of Chip Seal Treatment from Performance Models
Obviously, the pre-existing condition of pavements has an influence on the life obtained. The
results also follow a logical trend with an increase in life as the prior PCR increases except when
prior PCR is 81 to 85. The results will be immensely helpful in understanding the consequences
of timing of treatment on the life of chip seal treatment.
As shown in Table 4, 33 chip seal installations were made when the prior PCR was
greater than 86. Although this is a significant number, the data from these sections was not used
to report the service life because of the need to extrapolate the performance model far beyond the
study period. To illustrate this, refer to Figure 24 which shows a performance model for the chip
seal treatment when the prior PCR was 86 to 90. In order to obtain the service life corresponding
to threshold PCR of 60, this model was extrapolated beyond the range of values observed in the
Page 53
39
study. In doing so, this procedure used unrepresentative samples and resulted in an error
referred to as error of extrapolation. The result of extrapolation in this case is unrealistic values
for service life and benefit cost. A longer monitoring period would be required to utilize the data
from these sections. As a result, it was decided not to consider the treated pavements with prior
PCR greater than 85 for comparison and further discussion. A similar decision was made in the
case of micro surfacing treatments also.
Figure 18. Performance Prediction Model for Chip Seal Treatment, Prior PCR 56-60
y = -7.1999x + 89.665R² = 0.70
N = 59 PCR points
40
50
60
70
80
90
100
0 2 4 6 8 10 12
PC
R
Age, Years
Prior PCR 56-60
Page 54
40
Figure 19. Performance Prediction Model for Chip Seal Treatment Prior, PCR 61-65
Figure 20. Performance Prediction Model for Chip Seal Treatment, Prior PCR 66-70
y = -7.2265x + 92.666R² = 0.75
40
50
60
70
80
90
100
0 2 4 6 8 10 12
PC
R
Age, Years
Prior PCR 61-65
N=37
y = -4.7031x + 93.059R² = 0.60
40
50
60
70
80
90
100
0 2 4 6 8 10 12
PC
R
Age, Years
Prior PCR 66-70
N=132
Page 55
41
Figure 21. Performance Prediction Model for Chip Seal Treatment, Prior PCR 71-75
Figure 22. Performance Prediction Model for Chip Seal Treatment, Prior PCR 76-80
y = -4.6069x + 94.745R² = 0.64
40
50
60
70
80
90
100
0 2 4 6 8 10 12
PC
R
Age, Years
Prior PCR 71-75
N=147
y = -4.0023x + 94.229R² = 0.53
40
50
60
70
80
90
100
0 2 4 6 8 10 12
PC
R
Age, Years
Prior PCR 76 - 80
N=203
Page 56
42
Figure 23. Performance Prediction Model for Chip Seal Treatment, Prior PCR 81-85
Figure 24. Performance Prediction Model for Chip Seal Treatment, Prior PCR 86-90
y = -4.9661x + 95.511R² = 0.60
40
50
60
70
80
90
100
0 2 4 6 8 10 12
PC
R
Age, Years
Prior PCR 81-85
N=140
y = -3.9791x + 95.873R² = 0.71
40
50
60
70
80
90
100
0 2 4 6 8 10 12
PC
R
Age, Years
Prior PCR 86-90
N=107
Page 57
43
9.4 Chip Seal - Cost-effectiveness
Benefit values for chip seal treatments were obtained from the performance prediction
models. The benefit cost ratios of chip seal treatments for various groups of pavements were
compared with that of thin AC overlays. The results are presented in Table 6 and summarized in
Figure 25.
Prior
PCR Chip Seal Thin AC
56-60
Area under the curve 80 210
Cost of treatment per lane mile $10,565.00 $66,358.00
B/C 0.0076 0.0032
Relative Benefit Ratio 2.39
61-65
Area under the curve 100 215
Cost of treatment per lane mile $10,565.00 $66,358.00
B/C 0.0095 0.0032
Relative Benefit Ratio 2.92
66-70
Area under the curve 140 230
Cost of treatment per lane mile $10,565.00 $66,358.00
B/C 0.0133 0.0035
Relative Benefit Ratio 3.82
71-75
Area under the curve 160 235
Cost of treatment per lane mile $10,565.00 $66,358.00
B/C 0.0151 0.0035
Relative Benefit Ratio 4.27
76-80
Area under the curve 160 250
Cost of treatment per lane mile $10,565.00 $66,358.00
B/C 0.0151 0.0038
Relative Benefit Ratio 4.02
81-85
Area under the curve 140 255
Cost of treatment per lane mile $10,565.00 $66,358.00
B/C 0.0133 0.0038
Relative Benefit Ratio 3.45
Table 6. Relative Benefit Ratio of Chip Seal Treatments
Page 58
44
Figure 25. Summary of Relative Benefit of Chip Seal Treatment
Maximum ratio is realized when prior PCR is 71 to 75. Although the Relative Benefit Ratio is
high when prior PCR is 86-90, it should be recognized that, chip seal treatment was performed
by the counties on such pavements solely to improve skid resistance and the treatment was not
intended to be preventive maintenance. The difference in the ratios for prior PCR values 66-70,
71-, 75 and 76-80 is narrow. A question arises here as to what magnitude of difference in such
ratios can be considered as significant difference. However, there is no such data reported in the
literature. As a result it can be inferred that, maximum Relative Benefit Ratio for chip seal is
derived when the prior PCR of pavements on general system highway network is between 66 and
80. In other words, chip seal is most cost-effective, compared to thin AC overlay, when prior
PCR is in the range of 66 and 80.
0
0.5
1
1.5
2
2.5
3
3.5
4
4.5
56-60 61-65 66-70 71-75 76-80 81-85
Ch
ip S
eal R
ela
tive B
en
efi
t R
ati
o
Prior PCR
Page 59
45
9.5 Chip Seal - Life Cycle Costs
Life cycle cost analysis was performed for three scenarios. The solutions for the three
scenarios are provided below.
Scenario 1
In year 1, a chip seal treatment is provided. After seven and fourteen years chip seal
treatment is renewed. At the end of 15 year analysis period, there is a salvage value of chip seal
with a remaining service life of six years. Straight line depreciation method is used in the
determination of salvage value.
Net Present Value1 = 10,565 + 10,565/1.047 +10,565/1.04
14 - (10,565*6/7)/1.04
15
= $19,666
Scenario 2
Here chip seal is provided initially, followed by a thin AC overlay seven years later. At
the end of 15 year analysis period, there is a salvage value of thin AC overlay with a remaining
service life of one year. Straight line depreciation method is used in the determination of salvage
value.
Net Present Value2 = 10,565 + 66,358 /1.047 – (66,358*1/9)/1.04
15
= $56,898
Scenario 3
In scenario 3, initially a thin AC overlay is provided, and another thin AC overlay is
provided nine years later. At the end of 15 year analysis period, there is a salvage value of thin
Page 60
46
AC overlay with a remaining service life of three years. Straight line depreciation method is
used for the determination of salvage value.
Net Present Value3 = 66,358 + 66,358 /1.049 – (66,358*3/9)/1.04
15
= $100,698
The net present values of three scenarios show that successive chip seal treatment results in
significantly smaller cost than the other two alternatives, during the 15 year analysis period.
Thus, periodic chip seal treatment is more economical compared to the use of thin AC overlay.
It should be recognized, however that, chip seals do not provide structural strength, and are
suitable for application within a particular window of opportunity, i.e., chip seals are provided in
response to functional failure of pavement rather than structural failure.
10.0 ANALYSIS OF MICRO SURFACING TREATMENTS ON GENERAL SYSTEM
10.1 Micro Surfacing (General System) - Service Life from Historic Data
Figure 26 and Table 7 show micro surfacing projects on general system network. The
figure shows projects that have completed their service as well as those in service. Weighted
average of projects that completed their service lives was found to be 5 years. This indicates, on
an average, micro surfacing projects are being renewed at five year intervals.
Page 61
47
Figure 26. Service Life of Micro Surfacing Treatments on General System
Micro surfacing
Life, years
Life
completed Still in Service
1 17 15
2 2 6
3 6 6
4 6 3
5 7 2
6 6 11
7 8 2
8 3 1
9 8 0
10 1 0
12 0 4
Grand Total 64 50
Table 7. Service Life of Micro Surfacing Treatments on General System
0
2
4
6
8
10
12
14
16
18
1 2 3 4 5 6 7 8 9 10 11
Nu
mb
er
of
Sect
ion
s
Age, Years
Life completed Still in Service
Page 62
48
10.2 Micro Surfacing (General System) - Average Performance Gain
Figure 27 presents average performance gain due to micro surfacing treatments on
general system. A total of 114 projects were available for this analysis. The gain is calculated
using performance data for three to five years. As seen, the performance gain is maximum when
prior PCR is 61 to 65. Owing to minor difference in the performance gain between other groups,
it can be inferred that maximum performance gain is achieved when prior PCR is between 56
and 70.
Figure 27. Average PCR Gain for Micro Surfacing Treatment on General System
10.3 Micro Surfacing (General System)-Life (using performance prediction models)
Performance prediction models developed for groups of pavements with varying prior
PCR values are presented in Figures 28 to 33. To compute service life extension of micro
0
5
10
15
20
25
56-60 61-65 66-70 71-75 76-80 81-85 86-90 91-95 96-100
Ave
rage
PC
R G
ain
Prior PCR range
Page 63
49
surfacing installations on general system, in conformity with ODOT‟s policy a threshold PCR of
60 was used. Table 8 shows the service life values corresponding to various prior PCR values.
Prior PCR Service life corresponding to threshold PCR = 60 years
56-60 3.5
61-65 Limited data
66-70 7.5
71-75 8.5
76-80 12
81-85 8
Table 8. Life of Micro Surfacing (General System) from Performance Models
The graphs also present the linear model and regression constant. Maximum service life
extension relates to prior PCR range of 76 to 80. The results show that the use of micro
surfacing as a preventive maintenance treatment is meaningful when the prior PCR is greater
than 66.
Figure 28. Performance Prediction Model for Micro Surfacing Treatment, General System,
Prior PCR 56-60
y = -10.72x + 97.06R² = 0.790
N = 11
40
60
80
100
0 2 4 6 8 10 12 14
PC
R
Age, years
Prior PCR 56-60
Page 64
50
Figure 29. Performance Prediction Model for Micro Surfacing Treatment, General System,
Prior PCR 61-65
Figure 30. Performance Prediction Model for Micro Surfacing Treatment, General
System, Prior PCR 66-70
y = -2.466x + 97.41R² = 0.869
N = 9
40
60
80
100
0 2 4 6 8 10 12 14
PC
R
Age, years
Prior PCR 61-65
y = -4.556x + 94.28R² = 0.712
N = 59
40
60
80
100
0 2 4 6 8 10 12 14
PC
R
Age, years
Prior PCR 66-70
Page 65
51
Figure 31. Performance Prediction Model for Micro Surfacing Treatment, General
System, Prior PCR 71-75
Figure 32. Performance Prediction Model for Micro Surfacing Treatment, General
System, Prior PCR 76-80
y = -3.928x + 93.42R² = 0.552
N = 86
40
60
80
100
0 2 4 6 8 10 12 14
PC
R
Age, years
Prior PCR 71-75
y = -2.953x + 94.59R² = 0.587
N = 107
40
60
80
100
0 2 4 6 8 10 12 14
PC
R
Age, years
Prior PCR 76-80
Page 66
52
Figure 33. Performance Prediction Model for Micro Surfacing Treatment, General
System, Prior PCR 81-85
10.4 Micro Surfacing (General System) - Cost-effectiveness
Cost-effectiveness was calculated as a ratio of benefit and cost. Benefit values were
derived from the performance models as area under the performance curve. Similar values were
obtained for the thin AC overlay treatment [31] for general system. The Relative Benefit Ratio
of micro surfacing on general system is presented in Table 9. Figure 34 is a summary of
Relative Benefit Ratios versus prior PCR values. Benefit attains maximum when prior PCR is
76-80. It should be recognized here that the maximum service life extension presented in Table
8 also relates to the same PCR range.
y = -4.185x + 94.33R² = 0.679
N = 67
40
60
80
100
0 2 4 6 8 10 12 14
PC
R
Age, years
Prior PCR 81-85
Page 67
53
Prior
PCR Micro
surfacing Thin AC
56-60
Area under the curve 74 210
Cost of treatment per lane mile $17,450 $66,358.00
B/C 0.0042 0.0032
Relative Benefit Ratio 1.34
66-70
Area under the curve 136 235
Cost of treatment per lane mile $17,450 $66,358.00
B/C 0.0078 0.0035
Relative Benefit Ratio 2.2
71-75
Area under the curve 148.5 240
Cost of treatment per lane mile $17,450 $66,358.00
B/C 0.0085 0.0036
Relative Benefit Ratio 2.35
76-80
Area under the curve 210 250
Cost of treatment per lane mile $17,450 $66,358.00
B/C 0.012 0.0038
Relative Benefit Ratio 3.19
81-85
Area under the curve 136 255
Cost of treatment per lane mile $17,450 $66,358.00
B/C 0.0078 0.0038
Relative Benefit Ratio 2.02
Table 9. Relative Benefit Ratio of Micro Surfacing Treatments on General System
Figure 34. Summary of Relative Benefit of Micro Surfacing on General System
0
0.5
1
1.5
2
2.5
3
3.5
4
4.5
56-60 61-65 66-70 71-75 76-80 81-85
Mic
ro S
urf
acin
g G
en
era
l S
yste
mR
ela
tive B
en
efi
r R
ati
o
Prior PCR
Page 68
54
10.5 Micro Surfacing (General System) - Life Cycle Costs
Life cycle cost analysis was performed for three scenarios as below:
1. Two successive treatments of micro surfacing
2. Micro surfacing followed by thin AC overlay
3. Two successive treatments of thin AC overlay
Scenario 1
In year 1, a micro surfacing treatment is provided followed by another micro surfacing
treatment nine years later. At the end of 15 year analysis period, there is a salvage value of
micro surfacing with a remaining service life of three years. Straight line depreciation method is
used in the determination of salvage value. Net present value is calculated as:
Net Present Value1 = $17,450+ $17,450/1.049 - ($17,450*3/9)/1.04
15
= $26,480
Scenario 2
Here micro surfacing is provided initially, followed by a thin AC overlay nine years later.
At the end of 15 year analysis period, there is a salvage value of thin AC overlay with a
remaining service life of three years. Straight line depreciation method is used in the
determination of salvage value.
Net Present Value2 = $17,450+ 66,358 /1.049 – (66,358*3/9)/1.04
15
= $51,790
Page 69
55
Scenario 3
In scenario 3, a thin AC overlay is provided initially followed by another thin AC overlay
nine years later. At the end of 15 year analysis period, there is a salvage value of thin AC
overlay with a remaining service life of three years. Straight line depreciation method is used for
the determination of salvage value.
Net Present Value3 = 66,358 + 66,358 /1.049 – (66,358*3/9)/1.04
15
= $100,698
The net present values of three scenarios show that successive micro surfacing treatment
results in significantly smaller life cycle cost than the other two alternatives during the 15 year
analysis period. Thus, according to this analysis, periodic micro surfacing treatments are more
economical than providing thin AC overlay. However, this statement may hold well as long as
the pavements are structurally sound and only require preventive maintenance.
11.0 ANALYSIS OF MICRO SURFACING TREATMENTS ON PRIORITY SYSTEM
11.1 Micro Surfacing (Priority System) - Service Life from Historic Data
Figure 35 and Table 10 show micro surfacing projects on priority system network. The
figure shows projects that have completed their service as well as those in service. Weighted
average of projects that completed their service lives was found to be 5 years. This indicates, on
an average, micro surfacing projects are being renewed at five year intervals.
Page 70
56
Figure 35. Service Life of Micro Surfacing Treatments on Priority System
Micro surfacing Life, years Life completed Still in Service
1 4 0
2 11 4
3 13 6
4 10 2
5 13 0
6 10 12
7 5 0
8 1 0
9 5 2
10 2 1
12 1 0
Grand Total 75 27
Table 10. Service Life of Micro Surfacing Treatments on Priority System
0
2
4
6
8
10
12
14
1 2 3 4 5 6 7 8 9 10 11
Nu
mb
er
of
Sect
ion
s
Age, Years
Life completed Still in Service
Page 71
57
11.2 Micro Surfacing (Priority System) - Average Performance Gain
Figure 36 presents average performance gain due to micro surfacing treatments on
priority system. A total of 102 projects were available for this analysis. The gain is calculated
using performance data for three to five years. As seen, the performance gain is maximum when
prior PCR is 61 to 65. Interestingly, this range compares favorably with the treatments
performed on general system (Figure 27).
Figure 36. Average PCR Gain Due to Micro Surfacing on Priority System
11.3 Micro Surfacing (Priority System) - Life of Treatments (using performance
prediction models)
Performance prediction models developed for groups of pavements with varying prior
PCR values are presented in Figures 37 to 41. For computation of service life extension of micro
0
5
10
15
20
25
61-65 66-70 71-75 76-80 81-85 86-90 91-95 96-100
Ave
rage
PC
R G
ain
Prior PCR range
Average PCR Gain
Page 72
58
surfacing installations on priority system, in conformity with ODOT‟s policy a threshold PCR of
65 was used. Table 11 shows the life values corresponding to various prior PCR values.
Prior PCR Service life corresponding to threshold PCR = 65, years
61-65 4.5
66-70 5
71-75 4.5
76-80 8.5
81-85 11
Table 11. Life of Micro Surfacing (Priority System) from Performance Models
The graphs also present the linear models and regression constant. The results (Table 11)
again reveal a logical trend showing increase in service life extension with increasing prior PCR
values. Needless to say that, other factors such as cost of the treatment and associated benefits
will need to be considered before interpreting the significance of these findings.
Figure 37. Performance Prediction Model for Micro Surfacing Treatment, Priority
System, Prior PCR 61-65
y = -5.572x + 91.53R² = 0.723
N = 36
40
60
80
100
0 2 4 6 8 10 12
PC
R
Age, years
Prior PCR 61-65
Page 73
59
Figure 38. Performance Prediction Model for Micro Surfacing Treatment, Priority
System, Prior PCR 66-70
Figure 39. Performance Prediction Model for Micro Surfacing Treatment, Priority System,
Prior PCR 71-75
y = -4.471x + 88.19R² = 0.577
N = 62
40
60
80
100
0 2 4 6 8 10 12
PC
R
Age, years
Prior PCR 66-70
y = -5.270x + 91.65R² = 0.666
N = 113
40
60
80
100
0 2 4 6 8 10 12
PC
R
Age, years
Prior PCR 71-75
Page 74
60
Figure 40. Performance Prediction Model for Micro Surfacing Treatment, Priority System,
Prior PCR 76-80
Figure 41. Performance Prediction Model for Micro Surfacing Treatment, Priority System,
Prior PCR 81-85
y = -3.353x + 94.32R² = 0.491
N = 80
40
60
80
100
0 2 4 6 8 10 12
PC
R
Age, years
Prior PCR 76-80
y = -2.495x + 95.13R² = 0.379
N = 72
40
60
80
100
0 2 4 6 8 10 12
PC
R
Age, years
Prior PCR 81-85
Page 75
61
11.4 Micro Surfacing (Priority System) - Cost-effectiveness
Cost-effectiveness was calculated as the ratio of benefit and cost. Benefit values were
derived from the performance models as area under the performance curve. Similar values were
obtained for the thin AC overlay treatment [31] on priority system. The Relative Benefit Ratio
of micro surfacing on priority system is presented in Table 12.
Prior PCR Micro surfacing Thin AC
61-65
Area under the curve 67.5 115
Cost of treatment per lane mile $26,350 $66,358.00
B/C 0.0026 0.0017
Relative Benefit Ratio 1.48
66-70
Area under the curve 57.5 130
Cost of treatment per lane mile $26,350 $66,358.00
B/C 0.0022 0.002
Relative Benefit Ratio 1.11
71-75
Area under the curve 67.5 145
Cost of treatment per lane mile $26,350 $66,358.00
B/C 0.0026 0.0022
Relative Benefit Ratio 1.17
76-80
Area under the curve 130.5 170
Cost of treatment per lane mile $26,350 $66,358.00
B/C 0.005 0.0026
Relative Benefit Ratio 1.93
81-85
Area under the curve 165 215
Cost of treatment per lane mile $26,350 $66,358.00
B/C 0.0063 0.0032
Relative Benefit Ratio 1.93
Table 12. Relative Benefit of Micro Surfacing Treatments on Priority System
Figure 42 is a summary of Relative Benefit Ratio versus prior PCR values. The ratio is
maximum when prior PCR is 76-85. Micro surfacing treatments on priority system highways
Page 76
62
also showed the same range of prior PCR. From Table 11, the maximum life extension
corresponding to prior PCR range 76 to 80 is 8.5 years.
Figure 42. Summary of Relative Benefit of Micro Surfacing on Priority System
11.5 Micro Surfacing (Priority System) - Life Cycle Costs
Life cycle cost analysis was performed for three scenarios as below:
1. Two successive treatments of micro surfacing
2. Micro surfacing followed by thin AC overlay
3. Two successive treatments of thin AC overlay
Scenario 1
In year 1, a micro surfacing treatment is provided followed by another micro surfacing
treatment eight years later. At the end of 15 year analysis period, there is a salvage value of
micro surfacing with a remaining service life of one year. Straight line depreciation method is
used in the determination of salvage value. Net present value is calculated as:
0.0
0.2
0.4
0.6
0.8
1.0
1.2
1.4
1.6
1.8
2.0
61-65 66-70 71-75 76-80 81-85
Mic
ro S
urf
acin
g o
n P
rio
rity
Syste
mR
ela
tive B
en
efi
t R
ati
o
Prior PCR
Page 77
63
Net Present Value1 = 26,350 + 26,350/1.048 - (26,350*1/8)/1.04
15
= $43,775
Scenario 2
Here micro surfacing is provided initially, followed by a thin AC overlay nine years later.
At the end of 15 year analysis period, there is a salvage value of the thin AC overlay with a
remaining service life of two years. Straight line depreciation method is used in the
determination of salvage value.
Net Present Value2 = 26,350 + 66,358 /1.048 – (66,358*2/9)/1.04
15
= $66,649
Scenario 3
In scenario 3, a thin AC overlay is provided initially followed by another thin AC overlay
nine years later. At the end of 15 year analysis period, there is a salvage value of the thin AC
overlay with a remaining service life of three years. Straight line depreciation method is used for
the determination of salvage value.
Net Present Value1 = 66,358 + 66,358 /1.049 – (66,358*3/9)/1.04
15
= $100,698
The net present values of three scenarios show that successive micro surfacing treatment results
in significantly smaller life cycle cost than the other two alternatives during the 15 year analysis
period. Thus, according to this analysis, periodic micro surfacing treatments are more
economical than providing thin AC overlay. However, this statement may hold well as long as
the pavements are structurally sound and only require preventive maintenance.
Page 78
64
12.0 SUMMARY, CONCLUSIONS AND RECOMMENDATIONS
This report presents the details of an investigation to evaluate the effectiveness of chip
seal and micro surfacing as preventive maintenance treatments. The study utilizes data from
previously completed projects in Ohio and reflects current practices. The study focused
primarily on the following two issues:
1. Optimal timing of treatment placement,
2. Cost-effectiveness of treatments.
The study began with a review of ODOT‟s pavement management database. The database
consisted of related information about chip seal and micro surfacing treatments, including project
location, project limits, date of installation, and annual performance data. In all, data was
available for 225 chip seal and 214 micro surfacing projects. Performance monitoring data was
available for these projects most often for three to five years.
Nearly 50% of the chip seal treatments were made in District 1. Districts 2 and 3
combined accounted for 25% chip seal projects. The three districts lie in similar climatic zone.
All installations were made on general system. As a result, effects of factors such as
environment and traffic on performance of chip sealed pavements were not considered. The 214
micro surfacing projects, on the other hand, were equally distributed among general and priority
systems. Hence, these projects were grouped based on functional class of pavements namely
general and priority systems.
The following five performance indicators were used to describe the effectiveness of chip
seal and micro surfacing treatments:
1. Service life of treatments based on actual number of years in service
Page 79
65
2. Average performance gain
3. Life of treatments (using performance prediction models)
4. Cost-effectiveness
5. Life cycle costs
A summary of the results of data analysis is presented in Tables 13, 14 and 15.
Prior PCR
Performance Indicator
Service life
from historic
data
Average
Performance
Gain
(PCR Points)
Life from
Prediction
Models,
years
B/C Ratio Life Cycle
Costs
56-60
4 years
4.0 2.4 CS+CS+CS
$19,666
CS+TAC
$56,898
TAC+TAC
$100,698
61-65 10 4.5 2.9
66-70 19 7.0 3.8
71-75 17 7.5 4.3
76-80 14 8.5 3.0
81-85 13 7.5 3.4
86-90 8 9.0 4.1
Table 13. Summary of Results for Chip Seal Treatment
Note: CS = Chip Seal, TAC = Thin AC Overlay
Prior PCR
Performance Indicator
Service life
from historic
data
Average
Performance
Gain
(PCR Points)
Life from
Prediction
Models,
years
B/C Ratio Life Cycle
Costs
56-60
5 years
18 3.5 1.3 MS+MS
$26,480
MS+TAC
$51,790
TAC+TAC
$100,698
61-65 22
66-70 21 7.5 2.2
71-75 13 8.5 2.4
76-80 16 12.0 3.2
81-85 10 8.9 2.0
Table 14. Summary of Results for Micro Surfacing Treatment on General System
Note: MS = Micro surfacing
Page 80
66
Prior PCR
Performance Indicator
Service life
from historic
data
Average
Performance
Gain
(PCR Points)
Life from
Prediction
Models,
years
B/C Ratio Life Cycle
Costs
56-60
5 years
MS+MS
$43,775
MS+TAC
$66,649
TAC+TAC
$100,698
61-65 20 4.5 1.5
66-70 15 5.0 1.1
71-75 9 4.5 1.2
76-80 16 8.5 1.9
81-85 16 11.0 1.9
Table 15. Summary of Results for Micro Surfacing Treatment on Priority System
The highlighted values in the tables indicate effective range of prior PCR values at which the
performance indicators show maximum efficiency. Obviously, the pre-existing condition of
pavements selected for treatment has played a significant role in the observed historical
performance of Ohio‟s chip seal and micro surfacing projects.
Ideally, all performance indicators should point to the same prior PCR range. However,
the results show difference. Here, it is important to discuss the significance of each indicator.
Life from historic data for example, is a derivative of the actual practice. In other words,
it does not include analysis of variation in pavement condition that existed among projects prior
to the installation of each treatment. Pavement condition in such cases do not relate to standard
frame of reference, threshold PCR for example. However, it reflects the current practices and
provides data about the nature and extent of modifications needed to the existing program
Average performance gain utilizes annual PCR data for individual projects. Although it
can provide a rational procedure to judge the effectiveness of treatments, it does not include cost
Page 81
67
element. The results can however be used to understand the optimal timing of the treatment at
which effectiveness is maximum.
Life prediction from models is obtained through the development of performance
prediction models. Life is measured for a given threshold and the procedure provides a rational
basis to compare various scenarios. This procedure evaluates the effectiveness with respect to
„do-nothing‟ treatment and as such inhibits cost calculations. The advantage of the method is in
generating service life extension for various preexisting condition of pavements.
Cost-effectiveness is, to some extent, an extension of the life extension method. Here the
performance characteristics of chip seal and micro surfacing treatments are compared with
another treatment whose effectiveness is known beforehand. Only this method allows the
computation of cost-effectiveness of maintenance treatments.
Life cycle cost analysis combines the attributes of methods 3 and 4. However, the
drawback of this method is that the use of multiple treatments during the analysis period is rarely
verified and validated in the field. The method also assumes certain condition of pavements at
the end of each treatment cycle, a fact that is highly uncertain in reality.
The foregoing discussion is to suggest that direct comparison of the results should not be
made among the five performance indicators derived in this study.
In summary, this study resulted in a critical review and comprehensive understanding of
the chip seal and micro surfacing program in Ohio, and provided the basic data needed to
determine when and where such preventive maintenance treatments are appropriate from the
standpoint of both economics and performance. The results of this study, in association with
similar studies to evaluate preventive maintenance activities, will enable ODOT staff to better
Page 82
68
determine what role chip seal and micro surfacing treatments should play in the overall
preventive maintenance program (e.g., which pavements, what funding level).
Using the results from this study, in consultation with the project evaluation team, the
following conclusions are made:
1. Chip seals are cost effective treatments. They provide maximum benefits when applied
on pavements whose PCR is in the range 66 to 80. Under such conditions, chip seals can
extend the service life of pavements up to seven years.
2. Micro surfacing treatments on general system are reasonably effective. The best range of
prior PCR for their installation is 61 to 70. Life of micro surfacing treatments on general
system is nine years.
3. Micro surfacing treatments on priority system are marginally effective. The best range of
prior PCR for their installation is 61 to 70. Micro surfacing on priority system can
extend the service life of treated pavements by eight years.
It is recommended that ODOT continue with its chip sealing program on general system.
Care should be exercised to select appropriate candidate pavements for the treatment to ensure
maximum performance and benefit. This study did not address materials and mix design issues.
It is recommended to research more in these areas that will result in improved product and
placement and thereby performance. ODOT may also conduct in-house research to verify and
validate the performance of successive chip seal treatments.
Micro surfacing is also a viable preventive maintenance option. It can provide the same
general benefits that chip seals offer, but at a relatively higher cost. The added benefits of using
micro surfacing, rut filling for example, may offset the additional cost. Because of the marginal
Page 83
69
benefits observed in the study, it is recommended that ODOT further review the micro surfacing
program to enable the department determine what role such treatments should play in the overall
maintenance program.
REFERENCES
1. Pavement Preventive Maintenance Guidelines, ODOT Office of Pavement Engineering,
May 1, 2001
2. Ohio Department of Transportation, Construction Materials Specification, 2002
3. Ohio Department of Transportation, Item 422 Chip Seal with Polymer Binder
4. International Slurry Seal Association [www.slurry.org/2000/mayjun.pdf]
5. "Hugging the Road", Roads & Bridges, June 2004
6. "Pavement Preventive Maintenance", WisDOT Transportation Synthesis Report, June 19,
2003
7. Davies, R. and Sorenson, J. "Pavement Preservation: Preserving Our Investment in
Highways", Public Roads, Jan/Feb 2000
8. Peshkin, D. et al, "Guide for Optimal Timing of Pavement Preventive Maintenance
Treatment Applications", NCHRP Project 14-14, Draft Final Report, December 2003
9. Geoffroy, D., "Cost-Effective Preventive Maintenance", NCHRP Synthesis 223 (1996)
10. Schuler, S. "Design and Construction of Chip Seals for High Traffic Volume", ASTM
Special Technical Publication, Flexible Pavements Rehabilitation and Maintenance
(1998)
11. Morian, D et al, "Maintaining Flexible Pavements- The Long-Term Pavement
Performance Experiment", FHWA Report RD-97-102 (March 1998)
Page 84
70
12. Hall, K. et al, "LTPP Data Analysis: Effectiveness of Maintenance and Rehabilitation
Options", Final Report for NCHRP Project 20-50[3/4] (June 2002)
13. "Development of Research Problem Statements for Pavement Preservation", Joint
Foundation for Pavement Preservation-AASHTO Workshop , Sacramento, CA (June
2001)
14. Survey of Pavement Preservation Seal Coats, Utah DOT, December 2002
15. Janisch, D. and F. Gaillard, "Minnesota Seal Coat Handbook", MnDOT Report MN/RC-
1999-7 (December 1998)
16. Wade, M. et al "High Volume/High Speed Asphalt Roadway Preventive Maintenance
Surface Treatments", South Dakota DOT (December 2001)
17. Jahren, C. et al, "Thin Maintenance Surfaces: Phase 2 Report", Iowa DOT Report TR-
435 (January 2003)
18. ASTM D7000, "Standard Test Method for Sweep Test of Bituminous Emulsion Surface
Treatment Samples"
19. "Emulsion Chemistry Surface Treatment", Asphalt Contractor, August 2002
20. www.dot.ca.gov/research/maintenance/slurry_micro surface/slurry_micro surface.htm
21. "Slurry Seal/Micro Surface Mix Design Procedure: Phase I Report", Caltrans (March
2004)
22. "The Evaluation of Micro surfacing Design Procedures and Effects of Material Variation
on the Test Responses", TTI Report 1289-1 ( April 1995)
23. Epps, J. et al, " Summary of SHRP Research and Economic Benefits of Pavement
Maintenance", FHWA Report SA-98-014 (December 1997)
Page 85
71
24. Sinha, K. and S. Labi, "The Effectiveness of Maintenance and Its Impact on Capital
Expenditures", Joint Transportation Research Program, Purdue University, Report
FHWA/IN/JTRP-2002/27, June 2003
25. Labi et. al. “Effectiveness of Microsurfacing Treatments”, Journal of Transportation
Engineering, Vol 133, No. 5, ASCE May 2007
26. Hicks, G. et al, "Selecting a Preventive Maintenance Treatment for Flexible Pavements",
Foundation for Pavement Preservation (June 2000)
27. Zimmerman, K. and D. Peshkin, "Preferential Treatment", Roads & Bridges (June 2004)
28. Temple, W. et al, "Performance of Louisiana's Chip Seal and Micro Surfacing Program,
2002", Transportation Research Record 1795 (2002)
29. Joseph, E. et al, "Evaluation of Louisiana's Chip Seal and Micro Surfacing Program",
Louisiana Transportation Research Center (July 2002)
30. Walls, J. et al, “Life-Cycle Cost Analysis in Pavement Design–Interim Technical
Bulletin”, FHWA (September 1998)
31. Chou E.Y., Datta D and Pulugurta H, “Effectiveness of Thin Hot Mix Asphalt Overlay on
Pavement Ride and Condition Performance”, FHWA/OH-2008/4, April 2008
Page 89
75
Table I-A. Ohio’s Chip Seal Projects
District County Route Blog Elog Prior
PCR
1 ALL 190R 0.54 1.41 93
1 ALL 198R 0 1.5 96
1 ALL 501R 0 4.34 96
1 ALL 066R 2.44 10.58 93
1 ALL 117R 0 2.02 94
1 ALL 696R 1.89 7.64 91
1 ALL 066R 0 1.21 96
1 ALL 081R 19.68 29.42
1 ALL 081R 0 3.05 84
1 ALL 081R 0 3
1 ALL 196R 0 3.05 98
1 DEF 018R 28.97 30.11 70
1 DEF 018R 0 2.07
1 DEF 424R 5.77 11.24 100
1 DEF 018R 28.87 33.3
1 DEF 002R 13.23 16.59 99
1 DEF 002R 3.68 11.2 95
1 DEF 018R 29.4 33.3 81
1 DEF 249R 13.06 14.48 99
1 DEF 249R 9.06 13.05 99
1 DEF 002R 13.23 16.59 99
1 DEF 002R 11.22 13.23 99
1 DEF 249R 2.9 7.06 92
1 HAN 012R 5.73 9.57 93
1 HAN 186R 0 3.23
1 HAN 012R 0 4.93 92
1 HAN 012R 0 5 86
1 HAN 018R 0 7 89
1 HAN 037R 6.43 12.25 93
1 HAN 103R 19 23 93
1 HAN 235R 1.01 7.58 88
1 HAN 613R 13.56 18.76 93
1 HAN 235R 17.4 21 85
1 HAN 235R 1.01 6.52
1 HAN 330R 0.96 2.85 92
1 HAN 613R 0 12.5 89
Page 90
76
District County Route Blog Enlog Prior
PCR
1 HAN 698R 4.7 10.4 93
1 HAN 103R 0.81 11.41 90
1 HAN 235R 8.3 11.8 92
1 HAN 698R 0 4.01 96
1 HAN 103R 12.4 16.6 88
1 HAN 103R 0.9 11.5 90
1 HAN 698R 4.78 10.45 96
1 HAR 068R 4 8.77
1 HAR 235R 0 0.41 89
1 HAR 053R 1.34 11.98 94
1 HAR 067R 1.58 15.05 83
1 HAR 385R 0 2.26
1 HAR 081R 4 12.4 96
1 HAR 081R 13 19 96
1 HAR 067R 18.08 24.77 95
1 HAR 309R 17.9 25.92 96
1 HAR 701R 0 9.01 96
1 HAR 067R 17.54 18.08 93
1 PAU 500R 7.21 13.18 97
1 PAU 111R 0 4.6
1 PAU 111R 0 4.66 82
1 PAU 500R 0 4.9
1 PAU 111R 0 4.66 91
1 PAU 114R 12.08 16.8 82
1 PAU 114R 0 11.33 86
1 PAU 500R 0 4.85 83
1 PAU 637R 2 6.8 85
1 PAU 637R 0 1.7 86
1 PUT 012R 10.13 14.44 93
1 PUT 190R 4.3 7.56 87
1 PUT 066R 3.46 7.49 84
1 PUT 634R 0.28 13.59 91
1 PUT 696R 0 1.95 94
1 PUT 694R 5 11 96
1 VAN 224R 0 0.61 93
1 VAN 637R 0 4.02 73
1 VAN 637R 0 4.02 83
1 VAN 116R 13.91 18.26 94
Page 91
77
District County Route Blog Elog Prior
PCR
1 VAN 224R 0 9.25 89
1 VAN 081R 11.74 16.76 88
1 VAN 116R 0 2 92
1 VAN 116R 9.75 18.26 83
1 VAN 224R 15.84 25.73 98
1 VAN 116R 2.01 9.3 82
1 VAN 117R 0 3.1 92
1 VAN 081R 17.5 21.4 94
1 WYA 231R 0 2.21 94
1 WYA 231R 2.21 7.8 87
1 WYA 037R 0.48 9.16 93
1 WYA 294R 3.21 8.98 93
1 WYA 294R 0 3.23 90
1 WYA 199R 0 3.23 90
1 WYA 294R 0 9.5
1 WYA 294R 0.5 11
1 WYA 067R 18.39 29.93 90
1 WYA 231R 20.58 23 92
1 WYA 103R 7 18 89
1 WYA 294R 17.6 18.4
1 WYA 294R 11.6 15.9 94
2 OTT 269R 4.29 5.46 91
2 OTT 163R 4.05 5.98 81
2 SAN 018R 0 0.79 87
2 SAN 600R 0 4.02 59
2 SAN 051R 0 2.05 90
2 SEN 018R 23.56 34.8 86
2 SEN 019R 6.07 8.58 94
2 SEN 019R 9.58 15.19 94
2 SEN 778R 0 0.43 99
2 SEN 019R 15.19 19.75 99
2 SEN 228R 0 1.3 99
2 SEN 635R 0 6.08 94
2 SEN 231R 0 7.08 95
2 WIL 034R 15.7 16 88
2 WOO 105R 10.59 12.11 97
3 ASD 302R 8.85 10.9
3 ASD 302R 11.25 14.29
Page 92
78
District County Route Blog Elog Prior
PCR
3 ASD 095R 10.26 14.07 77
3 ASD 604R 0 3.36 71
3 ASD 179R 0 9.86 89
3 ASD 095R 1.46 13.49
3 ASD 003R 6.8 8.16
3 ASD 545R 0 4.77
3 CRA 096R 3.65 11.4
3 CRA 103R 14.88 20.22 88
3 CRA 019R 14.48 17.6 89
3 CRA 039R 0 3.45 70
3 CRA 103R 9.92 13.9 89
3 CRA 598R 11.03 15.41
3 CRA 039R 4.15 7.63
3 CRA 103R 13.9 14.88 74
3 CRA 294R 0 5.86 92
3 CRA 294R 0 5.86 92
3 CRA 019R 16.09 23.31 90
3 HUR 162R 0 19 64
3 HUR 060R 2.07 8.48
3 HUR 060R 9.07 12.93
3 HUR 269R 0 5.62 90
3 HUR 303R 0 3.76 91
3 HUR 303R 0 3.76 82
3 HUR 547R 0 7.13 92
3 HUR 598R 0 2.64
3 LOR 303R 0 1.92 71
3 RIC 309R 6.09 9.04 100
3 RIC 309R 6.09 9.04
3 RIC 071R 14.6 20.64 65
3 RIC 071R 14.6 20.64 64
3 RIC 546R 0 8.7
3 RIC 039R 0 1.12
3 RIC 430R 10.09 12.48 93
3 RIC 096R 0 1.14
3 RIC 545R 2.12 11.54
3 RIC 598R 0 3.86
3 WAY 539R 0 7.96
3 WAY 539R 8.77 12.65
Page 93
79
District County Route Blog Elog Prior
PCR
3 WAY 604R 0 1.03 74
4 ATB 011R 9 14 44
4 POR 282R 0 2.68 90
5 GUE 313R 0 1.24 100
5 MUS 313R 0 7.1 98
6 DEL 257R 14.2 22.62 87
6 DEL 656R 0 4.69 97
6 MAD 665R 2.47 11.11 98
6 MAR 229R 0 1.05 80
6 MAR 231R 0 4.3 79
6 MAR 423R 11.4 16.4 81
6 MAR 100R 0 2.8 78
6 MAR 100R 0 2.8 80
6 MAR 047R 0.6 2 88
6 MAR 231R 0 4.3 84
6 MAR 203R 3 7 81
6 MAR 095R 0 10 82
6 MAR 746R 0 9.9 79
6 MAR 037R 0 3.4 90
6 MRW 746R 0 3 87
6 MRW 042R 0 4.8 86
6 MRW 656R 0 5 79
6 MRW 019R 0 10.37 88
6 MRW 097R 0 3.79 84
6 MRW 061R 14.75 22.8 87
6 PIC 207R 0 9.57 63
6 UNI 739R 6 11.3 75
6 UNI 037R 1.95 9.1 69
6 UNI 037R 1.95 9.1 69
6 UNI 047R 0 5.5 95
6 UNI 047R 5.5 13.5 76
6 UNI 739R 14.8 25.6 81
6 UNI 037R 10.1 12.3 77
7 AUG 197R 0 7.44 99
7 AUG 274R 0 3.15 84
7 AUG 385R 0 3.91 79
7 AUG 198R 2.67 11.01 84
7 AUG 219R 0 3 81
Page 94
80
District County Route Blog Elog Prior
PCR
7 AUG 363R 0 1.01 99
7 AUG 720R 0 2.81 91
7 AUG 219R 3.12 6.81 89
7 AUG 116R 1.58 7.25 92
7 AUG 364R 6 10.7 88
7 AUG 364R 2.62 5.71 95
7 CHP 245R 10.82 17.09
7 DAR 726R 0 4 83
7 DAR 503R 0 1.36 76
7 LOG 274R 9.7 10.3 77
7 MER 707R 5 11.5 83
8 CLE 052R 0 25.49 79
8 CLE 052R 0 25.49 78
8 CLE 133R 31.16 34.57 90
9 BRO 131R 3.92 7.83 96
9 HIG 131R 0 7.09 87
9 SCI 348R 0 5.97 97
10 ATH 056R 0 5 95
10 ATH 356R 0 4.77 86
10 ATH 329R 14.13 19.74 93
10 ATH 681R 0 6.61 89
10 MOE 379R 0 8.18 90
10 MRG 083R 10.33 15.62 87
10 MRG 555R 11.9 15.4 90
10 MRG 078R 28.46 31.31 97
10 MRG 555R 3.79 15.23 94
10 MRG 329R 0 3.8 97
10 MRG 060R 9.7 10.7
10 NOB 083R 0 6.77 90
10 VIN 356R 0 5.97 91
10 VIN 671R 0 4.6 93
10 VIN 328R 0 10.29 96
10 WAS 026R 22.01 3013 94
11 COL 518R 6.89 11.27 99
Page 95
81
Table I-B. Ohio’s Micro Surfacing Projects on Priority System
District County Route Blog Elog Prior
PCR
2 LUC 023R 9.63 12.65 75
2 LUC 023R 9.63 12.65 78
2 LUC 475R 8.97 16.42 85
2 LUC 475R 8.97 16.42 85
2 LUC 475R 8.97 16.42 85
2 LUC 475R 8.97 16.42 88
2 LUC 475R 8.97 16.42 88
2 LUC 475R 8.97 16.42 88
2 OTT 002R 26.62 27.2
2 OTT 002R 26.62 27.2
2 WOO 075R 0.77 5.05 97
2 WOO 075R 5.05 14.91 76
2 WOO 075R 5.05 14.91 78
2 WOO 075R 0.77 5.05 97
3 LOR 002R 3.45 7.68 90
3 LOR 002R 3.45 7.68 90
3 MED 076R 0.65 7 67
3 MED 076R 0.65 7 67
3 RIC 030R 12.35 19.13 65
3 RIC 030R 12.35 19.13 65
4 STA 077R 9.05 13.6 97
4 STA 077R 9.05 13.6
5 FAI 033R 0 12.58 67
5 FAI 033R 0 12.58 67
5 MUS 070R 10.94 11.56 90
5 MUS 070R 10.94 11.56 88
5 MUS 070R 5.7 10.63
5 MUS 070R 5.7 10.63
5 MUS 070R 12.12 27.33 93
5 MUS 070R 10.94 13.03 83
5 MUS 070R 10.94 13.03 85
5 MUS 070R 12.12 27.33 93
6 FRA 033R 0 3.14 94
6 FRA 033R 0 3.14 96
6 FRA 270R 18.54 18.81 77
6 FRA 270R 18.54 18.81
Page 96
82
District County Route Blog Elog Prior
PCR
6 FRA 270R 9.49 17.47 37
6 FRA 270R 48.47 52.16 91
6 FRA 270R 48.47 52.16 93
6 FRA 270R 0.6 2.6 92
6 FRA 270R 0.6 2.6
6 FRA 270R 9.49 17.47 70
6 FRA 315R 5.19 8.56 89
6 FRA 315R 5.19 8.56 92
6 FRA 315R 8.56 11.37
6 FRA 315R 8.56 11.37
6 FRA 071R 28.92 29.9 97
6 FRA 071R 28.92 29.9 97
6 FRA 270R 29.11 36.94 92
6 FRA 270R 29.11 36.94 97
7 AUG 075R 5.03 12.55 95
7 AUG 075R 5.03 12.55 95
7 LOG 033R 2.01 4.82 96
7 MOT 675R 4 7.42 90
7 MOT 675R 4 7.42
7 SHE 075R 9.43 17.54 62
7 SHE 075R 9.43 17.54 62
8 BUT 075R 6.77 11.25 92
8 BUT 075R 0 6.77 92
8 BUT 027R 3.35 5.66 66
8 BUT 075R 0 6.77
8 BUT 075R 6.77 11.25
8 HAM 027R 9.73 14.19 60
8 HAM 071R 8.39 11.12 60
8 HAM 071R 8.39 11.12 58
8 HAM 075R 16.42 17.47
8 HAM 075R 16.42 17.47
8 HAM 071R 12.12 19.17 75
8 HAM 071R 12.12 19.17 78
8 HAM 126R 1.94 6.04 62
8 WAR 075R 0 3.35
8 WAR 075R 3.35 12.2 76
8 WAR 075R 3.35 12.2 77
8 WAR 075R 0 3.35
Page 97
83
District County Route Blog Elog Prior
PCR
8 WAR 073R 6.77 13.86 81
9 SCI 023R 7.43 11.5 91
9 SCI 023R 7.43 11.5 79
10 ATH 050R 1.75 11.47 97
10 ATH 032R 0 1.42 98
10 ATH 032R 0 1.42 97
10 ATH 050R 1.75 11.47 97
10 ATH 033R 5.34 10.4 97
10 ATH 033R 5.34 10.4 97
10 ATH 033R 5.73 10.4 99
10 ATH 033R 5.73 10.4 99
10 MEG 007R 11.35 14.59 99
10 NOB 077R 1.56 6.22 94
10 NOB 077R 1.56 6.22 89
10 WAS 007R 23 23.74 73
10 WAS 007R 21.47 22.72 64
11 COL 007R 26.81 28.65 71
11 COL 030R 12.71 22.72 75
11 JEF 007R 33.69 34.3 64
11 JEF 007R 33.69 34.3 66
11 TUS 077R 25.04 34.97
11 TUS 077R 25.04 34.97 90
12 CUY 480R 23.52 24.4 100
12 CUY 480R 23.52 24.4
12 CUY 090R 19.76 23.95 55
12 CUY 090R 19.76 23.95 55
12 LAK 271R 0 3.03 99
12 LAK 271R 0 3.03 82
Page 98
84
Table I-C. Ohio’s Micro Surfacing Projects on General System
District County Route Blog Elog Prior
PCR
2 OTT 105R 1.19 2.71
2 OTT 163R 27.15 31.21
2 OTT 163R 4.01 7.98 89
2 OTT 163R 7.98 13.24
2 SAN 300R 0 6.33 73
2 SAN 412R 0 4.19
2 SAN 012R 0 3.78
2 WOO 064R 4.12 9.03 90
2 WOO 006R 5.05 11.99
2 WOO 023R 6.02 12.05
2 WOO 235R 10.07 14.1 100
3 CRA 098R 0 5.69
3 CRA 181R 0 1.21 75
3 ERI 113R 12.81 20.91 55
3 LOR 113R 9.96 12.74 75
3 LOR 113R 9.96 12.74 75
3 LOR 303R 18.76 19.28
3 MED 094R 17.75 18.74
3 MED 303R 9.85 11.95
3 MED 303R 12.97 15.12
3 MED 303R 0 6.08
3 RIC 314R 0 3.77 86
3 RIC 181R 0 2.76 70
3 WAY 604R 1.03 7.61 60
4 MAH 289R 8.29 8.44 84
4 MAH 224R 8.98 11.25 89
4 MAH 224R 0 1.2 92
4 MAH 224R 7.6 8.96 81
4 MAH 534R 8.62 13.8 64
4 MAH 534R 8.62 13.8 74
4 POR 014R 11.33 15.16 93
4 STA 093R 5.84 8.82 73
4 TRU 007R 8.98 12.66 68
4 TRU 087R 13.42 17.65 67
4 TRU 087R 17.66 22.36 92
5 GUE 265R 0 2.65 95
Page 99
85
District County Route Blog Elog Prior
PCR
5 GUE 265R 4.27 6.81 96
5 GUE 285R 4.67 8.04 95
5 GUE 761R 0 2.44 93
5 GUE 265R 11.66 17.88 92
5 PER 757R 0 5.68
6 DEL 023R 0 13.25 91
6 DEL 023R 0 13.25 86
6 DEL 605R 0 6.21 88
6 FAY 041R 13.22 23.22 97
6 MAD 038R 21.59 30.03 64
6 UNI 036R 13.88 18.89 91
7 AUG 067R 0.32 2.16 98
7 AUG 198R 1.7 2.19
7 LOG 047R 0 5.23
7 MIA 055R 13.06 16.1 64
7 MIA 721R 2.75 5.66 69
7 MIA 571R 14.54 15.22 75
7 MOT 048R 16.38 18.38 57
7 MOT 048R 16.38 18.38 68
7 MOT 201R 5.4 7.05 95
8 BUT 127R 10.05 16.56 77
8 CLE 133R 4.67 12.78 76
8 CLE 222R 25.67 29.14 77
8 CLE 132R 10.84 11.79 87
8 CLE 276R 0.51 6.1 80
8 CLE 048R 1.38 5.45 79
8 CLE 125R 15.64 18.16 90
8 CLE 132R 20.6 24.82 85
8 CLE 133R 20.24 21.42 89
8 CLE 774R 0 4 86
8 CLI 022R 0 7.21 83
8 CLI 134R 15.33 22.15 83
8 GRE 068R 0 8.35 60
8 GRE 042R 3.59 7.99 82
8 GRE 380R 0 7 73
8 GRE 042R 3.59 7.99 77
8 GRE 042R 18.28 23.19 78
8 GRE 734R 0 3.23 82
Page 100
86
District County Route Blog Elog Prior
PCR
8 HAM 004R 7.74 8.23
8 PRE 035R 2.38 9.55 74
8 PRE 040R 14.92 17.68 84
8 PRE 040R 9.93 14.16 86
8 WAR 022R 11.03 19.78 61
8 WAR 042R 5.17 9.57 58
8 WAR 048R 18.43 22.97 82
8 WAR 048R 0.45 4.8 87
8 WAR 048R 16.4 18.01 88
8 WAR 123R 0.06 7.72 87
8 WAR 132R 0 5.06 90
9 PIK 220R 9.7 14.19
10 ATH 013R 0.29 6.02 99
10 ATH 550R 0.74 6.75 94
10 ATH 078R 3.38 8.35 98
10 ATH 078R 9.37 10.88 98
10 HOC 180R 0.39 7.52 96
10 MEG 032R 0 3.82 99
10 MEG 032R 0 3.82 99
10 MRG 078R 31.3 37.53 99
10 MRG 266R 4.46 13.96
10 WAS 060R 1.19 1.72 61
11 COL 165R 3.37 4.24 97
11 COL 170R 17.24 20.19 62
11 COL 154R 9.98 16.42 55
11 COL 558R 10.47 12.56 59
11 COL 009R 9.96 13.06 79
11 COL 172R 2.12 3.15 57
11 COL 009R 15.84 16.76 72
11 COL 014R 0 11.74 82
11 COL 062R 14.12 14.53 75
11 COL 344R 2.79 7.71 77
11 HOL 515R 0.09 5.51 79
12 CUY 322R 14.14 16.71 56
12 CUY 322R 14.14 16.71 56
12 CUY 480R 0 1.88 98
12 CUY 480R 0 1.88 97
12 GEA 322R 0 2.75 64
Page 101
87
District County Route Blog Elog Prior
PCR
12 GEA 168R 7.39 8.45 81
12 GEA 322R 5.66 7.5 85