NOTICE The issuance of this Report does not constitute an endorsement of any proposed amendment and in no
way implies Listing, Classification, or other recognition by UL and does not authorize the use of UL Listing
or Classification Marks or any other reference to Underwriters Laboratories Inc. on, or in connection with,
the product.
Underwriters Laboratories Inc., its employees, and its agents shall not be responsible to anyone for the
use or nonuse of the information contained in this Report, and shall not incur any obligation or liability for
damages, including consequential damages, arising out of or in connection with the use of, or inability to
use, the information contained in this Report.
Effectiveness of Circuit Breakers in Mitigating Parallel Arcing Faults in the Home Run
page 3
EXECUTIVE SUMMARY Electrical wiring in the home can get damaged during installation or afterwards, through over-stapling,
crushing, bending, penetration by screws and nails, and through rodent and insect damage. Over time
cabling may degrade further due to exposure to elevated temperatures or humidity, eventually leading to
arcing faults and ignition of combustibles in proximity. The length of electrical wiring between the circuit
breaker panel and the first receptacle is often referred to as the “home-run”. To protect the wiring from
damage and subsequent potential for arcing, the National Electrical Code (NEC®) requires protection of
the home run wiring using conduit or armored cabling1 if a receptacle-mounted AFCI (known as Outlet
Branch Circuit Arc-Fault Circuit-Interrupter, or OBC AFCI, in the NEC) is used in a residential circuit. This
requirement was put in place since such an arc protection device would not be able to provide parallel
arcing fault protection for the home run, i.e., de-energize the circuit, if the fault is upstream of the OBC
AFCI.
In this situation, the circuit breaker is the only means for mitigating the fault, though it is intended for
protecting the wiring from overheating due to an overcurrent condition and is not intended for mitigating
arcing faults. Since parallel arcing faults may deliver relatively high currents, there is the possibility that it
may trip the circuit breaker and de-energize the electrical circuit. However, the ability of a circuit breaker
to mitigate a parallel fault condition has not yet been well characterized in the available literature. Thus,
experimental data was required to determine whether a circuit breaker may mitigate a parallel arc fault,
and more specifically, the conditions under which effective protection is attained.
This research work was conducted using commercially available circuit breakers from four manufacturers
in the North American market. In addition, used circuit breakers that were in service for at least 20 years
were also evaluated in the event that age had a significant effect on performance. In this study, several
test variables were evaluated, including manufacturer, used vs. new circuit breakers, position of the circuit
breaker in the panel, and the available short circuit current. A series of circuit breaker operational tests
were conducted to determine the magnetic trip currents for new and used circuit breakers. The ability of a
circuit breaker to trip with parallel arc faults was then evaluated using prepared carbonized arc fault
samples (per UL 1699) made with NM cable. A total of 575 experiments were performed.
Analysis of the data showed that the carbonized arc data was representative of point contact arcing, and
therefore results from this work are applicable to both carbonized path and point contact arcing. The
circuit breaker age did have a significant effect on magnetic trip level, with “new” 15 A breakers showing a
normal distribution with mean of 212A and 99% of all breakers having a magnetic trip current at or below
300A. 20 A breakers exhibited a mean of 202 A and 99% of all breakers having a magnetic trip current at
or below 349 A. (These values exclude “high mag” breakers.) Used circuit breakers had broader magnetic
1 More specifically, protection must include the use of RMC, IMC, EMT, Type MC, or steel armored Type AC cables meeting the requirement of 2011 NEC § 250.118. (See 2011 National Electrical Code § 210.12(A), Exception 1 for more information.
Effectiveness of Circuit Breakers in Mitigating Parallel Arcing Faults in the Home Run
page 4
trip current distributions. Supported by literature reports, however, this change in magnetic trip level
appears to be a result of an industry-wide design change that occurred circa 1990.
It was found in this work that a conventional circuit breaker can be an effective means of mitigating
parallel arcing faults in the home run if the impedance of the home run wiring is less than a critical value
based on the supply voltage, the available current at the panelboard, and the magnetic trip level of the
circuit breaker, as shown in Equation 1.
.
(1)
where
ρL is the resistivity per unit foot of the NM cable gauge being used;
L is the length of the “home run” in feet;
Vrms is the supply voltage (typically 120 Vrms);
Ipssc is the short-circuit current at the panelboard; and
Imag is the magnetic trip current of the circuit breaker.
A detailed derivation of this equation is provided in this report.
Statistical analysis was conducted to calculate the line impedance from the electrical panel to the first
receptacle to ensure that 99% of all circuit breakers will trip 99% of the time, as shown in Equation 2:
0.4 ∙ 161Ω (2)
A resistance of 161 mΩ from a 14 AWG NM cable is equivalent to 50 feet (assuming a maximum
operating temperature of 90°C; at 25°C this length of cable would measure 128 mΩ for copper conductor
cable).2 For 20 A circuit breakers, a resistance of 110 mΩ at 25°C is calculated. Assuming 12 AWG wire
(ρL = 1.588 mΩ/foot at 25°C), this would suggest a maximum home r un length L of 69 feet using 12 AWG
NM cable. If longer runs are needed for a particular application, the wire gauge can be made larger to
maintain the required cable resistance. An evaluation of the energy released during one half-cycle when
the circuit breaker magnetic trip level and home run resistance are both properly matched shows that
there is a 2% probability of ignition of the NM cable if arcing were to occur.
2 The analysis shows that the maximum impedance to achieve 300A fault current is 161 mΩ. However, the impedance of the cable will change with temperature. To ensure a maximum impedance at the maximum operating temperature (typically 90C in residential installations), a room temperature value of 128 mΩ is calculated, assuming the coefficient or resistance for copper, k, is 234.5°C.
Effectiveness of Circuit Breakers in Mitigating Parallel Arcing Faults in the Home Run
page 5
TABLE OF CONTENTS Notice ............................................................................................................................................................ 2 Executive Summary ...................................................................................................................................... 3 Table of Contents .......................................................................................................................................... 5 Background ................................................................................................................................................... 6
Technical Plan .......................................................................................................................................... 9
Defining Arcing and Shorting Phenomenon ....................................................................................... 12
Test Samples .......................................................................................................................................... 13
Summary of Findings.......................................................................................................................... 55
Appendix A: Analysis of Arcing Behavior ............................................................................................... 57
Analysis of Normalized Peak Current................................................................................................. 57
Analysis of Phase Data ...................................................................................................................... 59
Conclusion of Arcing Analysis ............................................................................................................ 65
Applicability of Results to Point Contact Arcing ................................................................................. 66
Appendix B: Statistical Analysis of Circuit Breaker Performance ........................................................... 68
Effectiveness of Circuit Breakers in Mitigating Parallel Arcing Faults in the Home Run
page 6
BACKGROUND
Electrical fires in homes has been attributed to nearly ten percent of all fires, with more than one-third of
these caused by the fixed household wiring.3,4,5 An arc fault circuit interrupter (AFCI) is a safety device
that provides protection against fire hazards due to arcing. This arcing can result from several sources,
including poor or degraded electrical connections, frayed wiring, degraded or cut wiring insulation, or
penetration of metallic objects through power cords. In many of these scenarios, the magnitude of the
fault current or duration of the arcing event is insufficient for the panel circuit breaker or fuse to react and
remove power from the circuit.
Arcing faults can be classified into two types, series faults and parallel faults. In a series fault, the arc
occurs within only one conductor and is in series with the normal flow of electrical current. Series faults
occur, for example, if one conductor is nicked or cut, or an interconnect is loose or corroded. Current flow
through a series fault is limited by the connected load to the circuit and therefore will not be mitigated by a
circuit breaker. Parallel faults can be caused by cracked wiring insulation, contaminants, rodent damage
to insulation, or metallic objects cutting through line cords (such as chair legs). In this case, the arc occurs
between the supply and return wires, i.e., between the “hot” and “neutral” or between “hot” and “ground”,
and is only limited by the available current from the panel. In this scenario, there is potential for a current
of several hundred amperes. However, these arcing events may have short duration or contain long
pauses between individual arcs. For this reason, parallel arcs may not cause a conventional circuit
breaker to react.
AFCIs can be installed in one of two places: at the electrical panel as a replacement for a conventional
circuit breaker, or at the first outlet in the circuit. In the case of the panel AFCI, all wiring in the circuit is
protected beyond the panel. In the event of a series or parallel fault, the AFCI is able to disconnect power
for the entire circuit. This protection includes both the household wiring as well as electrical appliances
connected to the circuit.
An Outlet Branch Circuit Arc-Fault Circuit-Interrupter (OBC AFCI) is an alternative to the circuit breaker
AFCI. The OBC AFCI is installed as the first outlet in a branch circuit, and is intended to provide
protection to downstream branch circuit wiring, cord sets, and power-supply cords against the unwanted
effects of arcing. This device also provides series fault protection to upstream branch circuit wiring, since
the AFCI is able to disconnect the load and therefore stop the flow of current through the series fault.6 As
illustrated in Figure 1, parallel arc fault protection is not provided for the length of branch wiring between
3 Babrauskas, V., “How Do Electrical Wiring Faults Lead to Structure Ignitions?” pp. 39-51 in Proc. Fire and Materials 2001 Conf., Interscience Communications Ltd., London (2001). 4 L.E. Smith and D. McCoskrie, “What Causes Wiring Fires in Residences?” pp. 19-69 Fire Journal, January/February (1990). 5 “Topical Fire Report Series: Residential Electrical Building Fires,” FEMA, US Department of Homeland Security, vol. 8 iss. 2, (2008). 6 UL Subject 1699A, Outline of Investigation for Outlet Branch Circuit Arc-Fault Circuit Interrupters, issued March 17, 2010.
Effectiveness of Circuit Breakers in Mitigating Parallel Arcing Faults in the Home Run
page 7
the branch circuit overcurrent protection in the electric panel and the first outlet. This length of wiring is
referred to as the “home run”.
A 1993 UL Fact-Finding Investigation sponsored by the Electronic Industries Association (EIA)7
recommended that the magnetic trip level of circuit breakers should be lowered to improve the ability of a
circuit breaker to react to arcing faults (particularly parallel arcing faults). This resulted in an EIA proposal
for the 1996 NEC Section 210-20,8 where breakers in living and sleeping areas would be required to
possess lower magnetic trip characteristics and be labeled as such. This proposal was rejected, in part
citing a potential for increased nuisance tripping due to large current transients common with
incandescent bulbs, compressor motors, etc.
Published literature from the early 1990s demonstrated the issue with high magnetic trip breakers failing
to mitigate arcing faults: for example, as cited by Franklin.9 Franklin’s work showed that 15A breakers
manufactured in North America at the time exhibited widely varying magnetic trip levels, as low as 120A
and potentially exceeding 800A. He contrasted this to European 15A breakers, which magnetically tripped
at 100A, allowing far less arc energy to dissipate. Franklin claims that experimental work with arcing faults
shows that arcing currents are “almost always” in the range of 150A to 400A. He further states that an
arcing current below 100A has “never” been observed. No substantiating information or references were
supplied, or any physical information on test conditions.
The 2008 edition of the National Electrical Code permits the installation of an OBC AFCI at the first outlet
to mitigate the effects of parallel arc faults occurring in the remaining portion of the branch circuit,
provided that the portion of the branch circuit between the branch-circuit overcurrent device and the first
outlet is enclosed in rigid metallic conduit (RMC), intermediate metallic conduit (IMC), electrical metallic
tubing (EMT) or steel armored type AC cable.10
In December 2009 the NFPA National Electrical Code panel meetings were held to discuss comments
received on proposals for revision to the 2011 NEC. Code Making Panel 2 decided to “HOLD” the AFCI
Receptacle Consortium’s proposal/comment to allow Outlet Branch Circuit (OBC) AFCI receptacles to be
used at the first outlet in a branch circuit without requiring the fixed building wiring from the electric panel
to the first receptacle to be enclosed with a steel wiring method. The substantiation provided with the
7 "An Evaluation of Branch-Circuit Circuit-Breaker Instantaneous Trip Levels." Underwriters Laboratories Inc. For the Electronic Industries Association (EIA). 1993. R. Wagner. 92ME51901 / E87837. 8 EIA proposal for the 1996 NEC to require “low magnetic trip” circuit breakers as a means of reducing fires due to arcing faults occurring in damaged cords to entertainment equipment such as TVs. UL conducted a Fact-Finding investigation and released its report (Ref. 7). Proposal was the following: “Section 210-20(b) Circuit breakers in Dwelling Units (New) -- Circuit Breakers for 15 A and 20 A branch circuits supplying receptacles in living and sleeping areas of dwelling units shall be a listed type identified as having specified instantaneous trip characteristics to mitigate the effects of arcing faults.” “Section 240-XX(83) Circuit breakers in Dwelling Units. (New) -- Circuit breakers for 15 A and 20 A branch circuits supplying receptacles in living and sleeping areas, in accordance with Section 210-20(b), shall be listed and shall be marked “LIT” (Low Instantaneous Trip).” 9 F. Franklin, “Circuit Breakers: The Myth of Safety,” Professional Safety, June 1990. 10 NFPA 70™, National Electrical Code, 2008 Edition. Article 210.12 (B), Exception 1.
Effectiveness of Circuit Breakers in Mitigating Parallel Arcing Faults in the Home Run
page 8
public comment suggested that a conventional circuit breaker may provide some degree of parallel arc
fault protection for the “home run” dependent on the available fault current, the length of the home run
and the instantaneous (magnetic) trip calibration of the circuit breaker.
Figure 1. Parallel arcing in the “home run,” which is the length of cable between the electric panel and the first receptacle.
Parallel arcing in a circuit can occur either through development of a carbonized path or by a point
contact, e.g., nail penetration, that connects the hot and ground/neutral conductors. Earlier research11 has
shown that the arcing characteristics between the two only show a statistical difference with respect to the
distribution of the arc strike voltage.
There is a need for data on the performance of conventional circuit breakers with respect to parallel arc
faults to assist the NEC and other stakeholders in developing an informed decision.
11 P.W. Brazis, et al., “Synthetic Arc Generator for UL1699, Phase 2: Statistical Characterization of Arc Fault Behavior,” UL Internal
Report, 2009.
Effectiveness of Circuit Breakers in Mitigating Parallel Arcing Faults in the Home Run
page 9
Objectives
• Develop data on the performance of conventional circuit breakers with respect to parallel arc
faults; and
• Identify conditions under which the circuit breakers may effectively react to parallel arc faults to
prevent ignition of the NM cable.
Technical Plan
A technical plan was developed to meet the objectives as follows:
Task 1 – Characterization of circuit breaker trip performance
Task 2 – Parallel arc fault tests
Task 3 – Analysis of ignition hazard
Task 4 – Summary of findings
Task 5 – Technical report
The technical report is presented herein.
TECHNICAL REPORT
Terminology
The terminology used in the report is presented to facilitate clarity.
• Half-cycle. In this work, it is equivalent to 8.33 ms, or 1/120 seconds. It is defined as the time
between subsequent zero-crossings of the voltage waveform (which has a fundamental frequency of
60 Hz). Each half-cycle is subdivided into 180 degrees of phase angle, corresponding to the arcsine
of the voltage waveform, related to the time-varying voltage:
( ) ( )θθ sin2 ⋅= rmsVv
(3)
For this work, phase angles of 180º < θ < 360º has been reverted to 0º < θ < 180º, since the arcing
behavior has been found by experience to be identical regardless of sign. Therefore, the absolute
value of current and voltage was used for all analysis. In this work, half-cycles are the basic time unit,
and are referenced as integer values corresponding to the number of half-cycles past time zero (the
time when measurement was initialized).
Effectiveness of Circuit Breakers in Mitigating Parallel Arcing Faults in the Home Run
page 10
• Iteration number. This is an integer value corresponding to the order in which the measurement was
made for a given identical set of test parameters. For example, the first sample measured is identified
as test number 1, the second is numbered 2, etc.
• Manufacturer. This identifies the manufacturer of the circuit breakers and panels used for each test.
Four manufacturers were selected, each are identified by a letter: A, B, C, or D.
• Age. This denotes whether the circuit breaker is newly manufactured and not previously placed into
service (“New”), or whether the circuit breaker was recovered from use in the field (“Old”).
• Breaker Number. This is the position where the circuit breaker was located in each panel. For each
test, a different box was used per manufacturer. Identical breakers were used, with locations within
the circuit breaker panel box denoted by the circuit breaker number.
• Short-Circuit Current (A). Also denoted as Imax, this is the maximum available current during a given
test (limited by the resistive load added to the test circuit). The value is specified in UL 1699 with a
standard method for reducing the available current for a given test (either by use of a calibrated
resistive load (“Type 1”) or through the use of long lengths of coiled NM-B cable (“Type 2”)), Figure 2.
For this project, only “Type 2” arrangements were used, simulating a parallel arcing fault. If the hot
conductor were shorted to neutral at the location of the sample, the amount of current flowing through
the circuit would be equal to Imax.
Figure 2. Two configurations of loads used in UL 1699, Section 40 tests. (Left) “Type 1”, used in Sections 40.2 and 40.4 for low-current testing. (Right) “Type 2”, used in Sections 40.3 and 40.5 for high-current testing.
Due to the large amount of data in each measurement (5 million data points in each of two waveforms for
current and voltage), and the large number of iterations (more than 500) a convenient method of
extracting a single numerical value per arcing half-cycle was required to allow for a reasonable analysis.
This was achieved by the definition of several parameters for each arcing half-cycle which could be
Effectiveness of Circuit Breakers in Mitigating Parallel Arcing Faults in the Home Run
page 11
expressed as a single numerical value. For each arcing half-cycle, each of the following parameters were
collected to characterize the arc (Figure 3):
• Peak Current. This is the maximum value (in magnitude) of the current waveform measured through
the entire half-cycle.
• Arc Strike Angle. This is the phase value (in degrees) when the arc begins, typically characterized
by a large change in current with respect to time (large di/dt). Detection was automated by finding the
maximum value in the digitally filtered current waveform (Butterworth three-pole bandpass with f3dB,min
= 10 kHz and f3dB,max = 100 kHz). The search was limited from zero phase angle to the phase angle
corresponding to the peak current value. This technique leverages the large high-frequency
component from the discontinuous change in current at the start of arcing.
• Arc Stop Angle. This is the phase value (in degrees) where the arc ends, characterized by a
discontinuous drop towards zero current. Detection is similar to that used for identifying the arc strike
angle, except search is between the phase angle of the peak current and 180 degrees. As with the
strike angle, the detection software leverages the discontinuous change in current which manifests
itself as a large spike in the digitally filtered current signal.
• Arc Strike Voltage. This is the magnitude of the voltage waveform at the moment of arc strike. This
is found by first finding the arc strike angle, then finding the corresponding voltage at the same
moment in time.
• Arc Stop Voltage. This is the magnitude of the voltage waveform at the moment of arc stop. This is
found by first finding the arc stop angle, then finding the corresponding voltage at the same moment
in time.
Figure 3. Current and voltage arcing waveforms, showing each arcing half-cycle.
Effectiveness of Circuit Breakers in Mitigating Parallel Arcing Faults in the Home Run
page 12
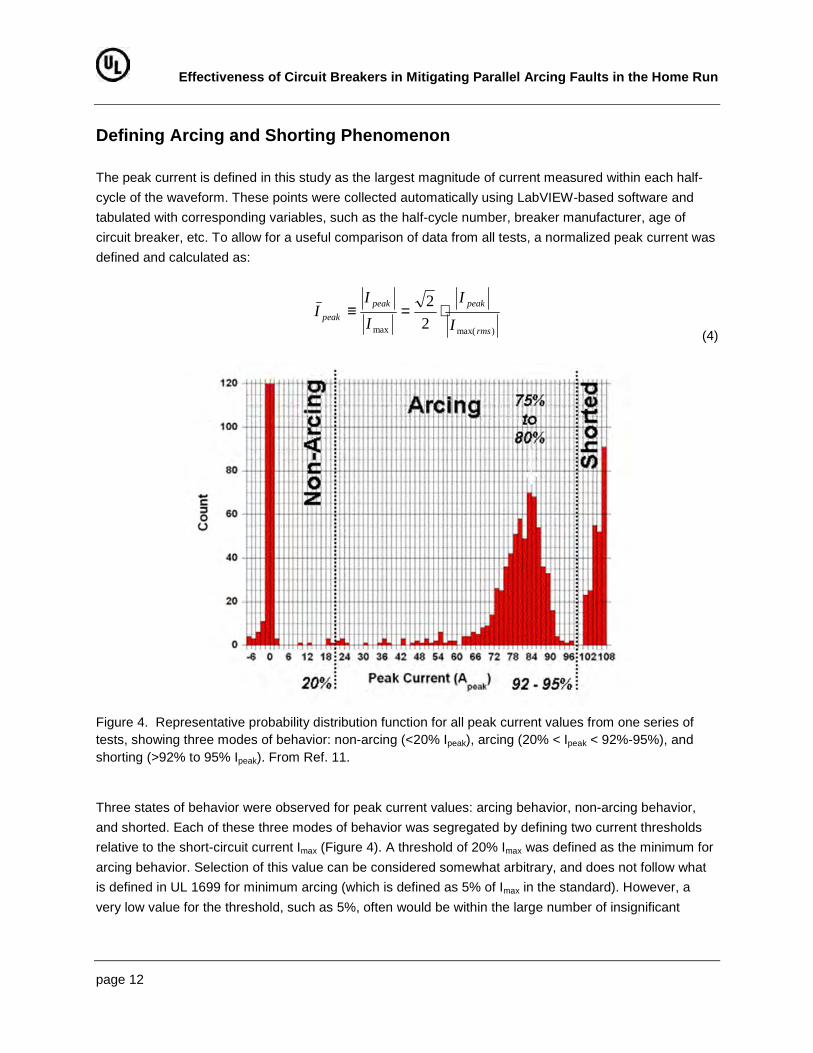
Defining Arcing and Shorting Phenomenon
The peak current is defined in this study as the largest magnitude of current measured within each half-
cycle of the waveform. These points were collected automatically using LabVIEW-based software and
tabulated with corresponding variables, such as the half-cycle number, breaker manufacturer, age of
circuit breaker, etc. To allow for a useful comparison of data from all tests, a normalized peak current was
defined and calculated as:
)max(max 2
2
rms
peakpeak
peakI
I
I
II ⋅=≡
(4)
Figure 4. Representative probability distribution function for all peak current values from one series of tests, showing three modes of behavior: non-arcing (<20% Ipeak), arcing (20% < Ipeak < 92%-95%), and shorting (>92% to 95% Ipeak). From Ref. 11.
Three states of behavior were observed for peak current values: arcing behavior, non-arcing behavior,
and shorted. Each of these three modes of behavior was segregated by defining two current thresholds
relative to the short-circuit current Imax (Figure 4). A threshold of 20% Imax was defined as the minimum for
arcing behavior. Selection of this value can be considered somewhat arbitrary, and does not follow what
is defined in UL 1699 for minimum arcing (which is defined as 5% of Imax in the standard). However, a
very low value for the threshold, such as 5%, often would be within the large number of insignificant
Effectiveness of Circuit Breakers in Mitigating Parallel Arcing Faults in the Home Run
page 13
events (very short-duration arcing, noise, etc.) and were not likely to contribute to the understanding of
the arcing behavior. At 20% Imax a very small percentage of data points were typically found and was a
convenient threshold for defining a threshold for arcing. As this was within a “long tail” of the probability
distribution function, moving this threshold ±10% in either direction would have a negligible effect on the
total number of points included and therefore not affect the analysis.
Test Samples Circuit Breakers
Four models of conventional circuit breakers available commercially in the USA were selected for this
investigation. These are identified in this report as A, B, C, and D. The circuit breakers were all rated for
15A circuit current.
NM Cable
Commercially available NM cable was purchased for use in the parallel arcing tests. The NM had 14
AWG copper conductors (neutral, hot, and ground), and had a temperature rating of 90°C. The neutral
and ground conductors were connected together, allowing parallel faults to occur between either hot and
ground or hot and neutral. In nearly all cases, the arcing fault occurred between the hot and ground
conductors.
Task 1 - Characterization of Circuit Breaker Trip Performance
The circuit breakers were characterized to determine the current levels at which magnetic tripping occurs,
as well as the thermal trip time down to 75A. Each circuit breaker was subjected to symmetric short circuit
fault currents until the circuit breaker cleared the fault in one half-cycle (which is defined as the
instantaneous magnetic trip) to determine the instantaneous trip current. Eight circuit breakers of one
model were assembled in a commercial electric panel for the characterization tests; and the tests were
repeated for each of these eight breakers. New 20A circuit breakers from two manufacturers that use
three different mechanism designs were also evaluated.
Effectiveness of Circuit Breakers in Mitigating Parallel Arcing Faults in the Home Run
page 14
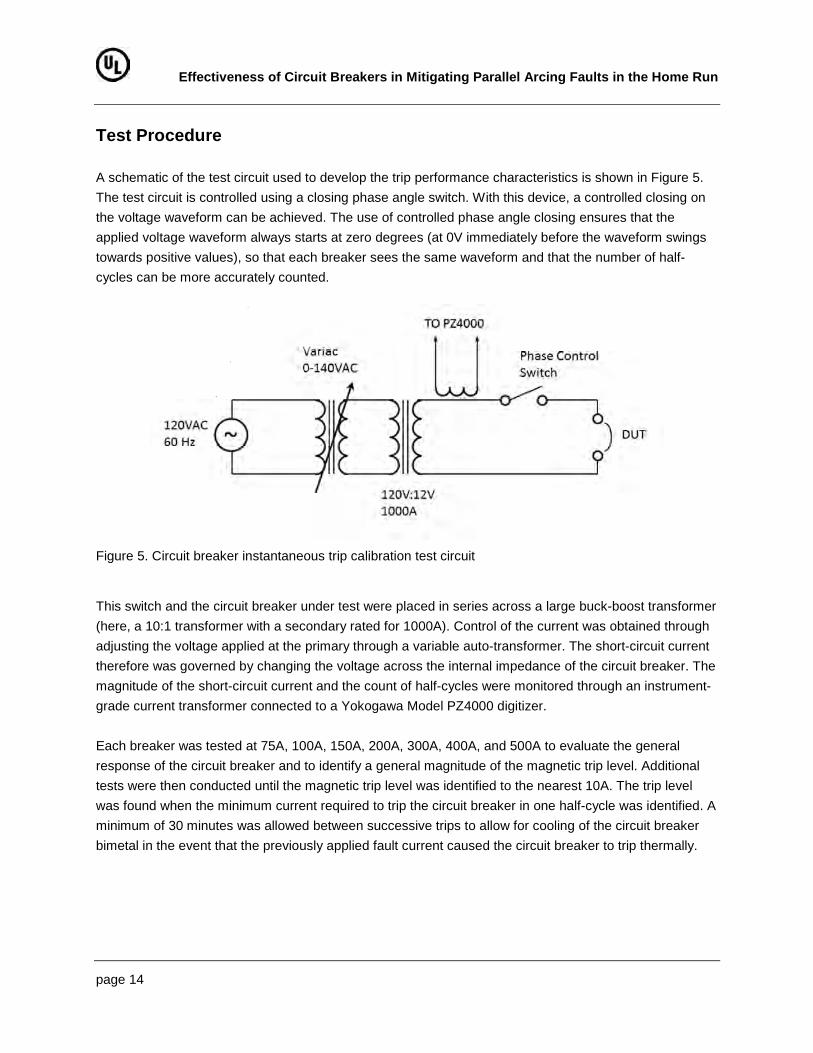
Test Procedure
A schematic of the test circuit used to develop the trip performance characteristics is shown in Figure 5.
The test circuit is controlled using a closing phase angle switch. With this device, a controlled closing on
the voltage waveform can be achieved. The use of controlled phase angle closing ensures that the
applied voltage waveform always starts at zero degrees (at 0V immediately before the waveform swings
towards positive values), so that each breaker sees the same waveform and that the number of half-
cycles can be more accurately counted.
Figure 5. Circuit breaker instantaneous trip calibration test circuit
This switch and the circuit breaker under test were placed in series across a large buck-boost transformer
(here, a 10:1 transformer with a secondary rated for 1000A). Control of the current was obtained through
adjusting the voltage applied at the primary through a variable auto-transformer. The short-circuit current
therefore was governed by changing the voltage across the internal impedance of the circuit breaker. The
magnitude of the short-circuit current and the count of half-cycles were monitored through an instrument-
grade current transformer connected to a Yokogawa Model PZ4000 digitizer.
Each breaker was tested at 75A, 100A, 150A, 200A, 300A, 400A, and 500A to evaluate the general
response of the circuit breaker and to identify a general magnitude of the magnetic trip level. Additional
tests were then conducted until the magnetic trip level was identified to the nearest 10A. The trip level
was found when the minimum current required to trip the circuit breaker in one half-cycle was identified. A
minimum of 30 minutes was allowed between successive trips to allow for cooling of the circuit breaker
bimetal in the event that the previously applied fault current caused the circuit breaker to trip thermally.
Effectiveness of Circuit Breakers in Mitigating Parallel Arcing Faults in the Home Run
page 15
Results
The measured magnetic trip level for each circuit breaker is shown in Table 1. Results are listed
according to panel location. Three types of 20A breakers were tested for two of the manufacturers to
determine whether other circuit breaker designs show a significant change in magnetic trip level. Type 1
denotes a common breaker model which is readily available in nationwide home improvement stores.
Type 2 denotes a GFCI circuit breaker (the ground fault feature was not tested in this work, and the
neutral lead was left open for these tests). Type 3 is a less common, specialty breaker differing in design
Figure 6 shows the relationship of manufacturer, handle rating, and manufacturer to magnetic trip current.
It is observed that there is significant variation in the magnetic trip level for 20A breakers for Manufacturer
A, with trip levels for Type 2 breakers being much larger than any other circuit breaker tested in this study
(though not labeled as such, the magnetic trip values are more consistent with a “high mag” breaker). By
contrast, 15A and 20A circuit breakers from Manufacturer D exhibit similar values. Among manufacturers,
magnetic trip currents are similar for Manufacturers A, B, and C, and somewhat lower for Manufacturer D.
Effectiveness of Circuit Breakers in Mitigating Parallel Arcing Faults in the Home Run
page 16
Figure 6. Boxplot showing relationship of manufacturer to magnetic trip current. The shaded box contains the middle two quartiles of the data set, the horizontal line in the middle of the shaded box is the median value, the crosshair denotes the average value, and the vertical lines show the 95% confidence interval. Asterisks denote statistical outliers.
Analysis of Circuit Breaker Characteristics
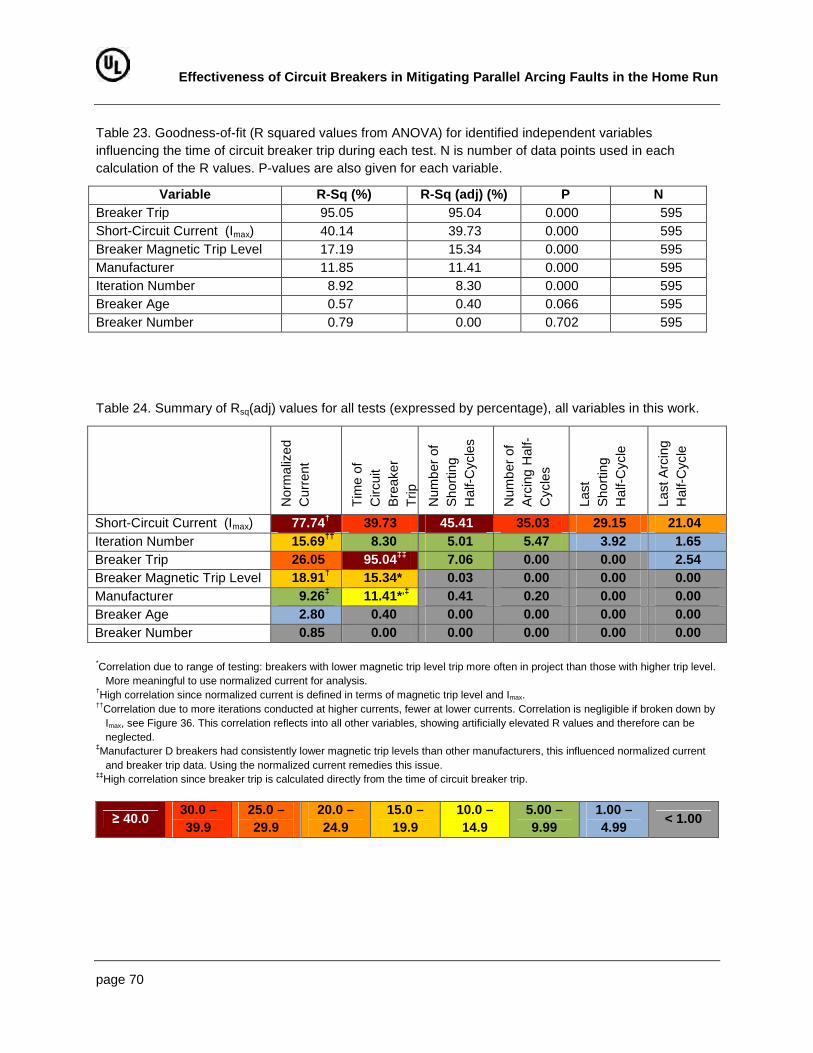
The relative influence of each variable on the normalized current was analyzed using ANOVA, and
evaluated according to the resulting adjusted R squared (Rsq(adj)) values.12 The influence of each test
variable on the magnetic trip level (in terms of the Rsq(adj) values) is shown in Table 2. The Rsq(adj)
values give a quantitative view of how much a particular variable influences the data. For example, the
Rsq(adj) value characterizing the influence of the manufacturer (manufacturer) of each breaker on the
measured magnetic trip level is 47%, meaning that approximately 47% of the variation in the magnetic trip
data can be explained by using different brands of circuit breakers. Looking at the boxplot in Figure 6, it
12 Rsq is the coefficient of determination, which measures the proportion of variation that is explained by the model. For example, if Rsq is equal to 100%, the variable explains 100% of the behavior. Conversely, an Rsq value of zero would indicate that the variable has no influence. Rsq(adj) is a modified measure of Rsq, which takes into account the number of terms in the model and the number of data points. A more complete explanation of R values can be obtained in most works on Six Sigma or other statistical sources. For example, D. Picard (ed.), The Black Belt Memory Jogger, Six Sigma Academy, Salem, NH: GOAL/QPC, 2002, p. 173.
Effectiveness of Circuit Breakers in Mitigating Parallel Arcing Faults in the Home Run
page 17
can be seen that breakers from Manufacturer D exhibit lower magnetic trip levels compared to the other
three manufacturers. The Rsq(adj) value of 47% reflects this change in magnetic trip level. Turning now to
the beaker number, which identifies the position the circuit breaker was located in the panel, the Rsq(adj)
value is 0%, which means that the breaker position had no statistical influence on the magnetic trip level.
This suggests that circuit breaker position in the panel can be ignored during any further analysis of the
magnetic trip level.
Evaluating the effect of handle rating (in other words, comparing the difference in circuit breakers rated
15A to those rated 20A) is a bit complex, since the effect of handle rating can be masked by other factors.
The analysis for Manufacturer A shows that there is an influence of handle rating on the magnetic trip
level, even among the same breaker type. However, Manufacturer D shows zero statistical difference
between 15A and 20A circuit breakers of the same type. Interestingly, no statistical difference is found
among 15A and 20A circuit breakers if all data are analyzed together.
Table 2. Goodness-of-fit (R squared values from ANOVA) for identified independent variables influencing the magnetic trip level for each characterized breaker current level. N is number of data points used in each calculation of the R values. P-values are also given for each variable.
Variable R-Sq (%) R-Sq (adj) (%) P N
Manufacturer 48.82 46.72 0.000 77
Handle Rating (All) 1.26 0.00 0.331 77
Handle Rating (Manufacturer A, Type 1) 28.42 23.31 0.033 16
Handle Rating (Manufacturer D, Type 1) 4.00 0.00 0.458 16
Breaker Number 4.53 0.00 0.855 77
Figure 7 shows the histograms for 15A and 20A magnetic trip data for all manufacturers. The 15A data
was found to be normally distributed (see the following section and Figure 10 for details), but the 20A
data showed a more bi-modal distribution. Figure 8 shows combined 15A and 20A data. Results from a
normal probability distribution fit for 15A, 20A, and combined data are shown in Table 3.
Effectiveness of Circuit Breakers in Mitigating Parallel Arcing Faults in the Home Run
page 18
Figure 7. Histogram of the magnetic trip level for all “new” breakers at 25°C. ( Left)15A data only, (Right) 20A only.
Figure 8. Histogram of the magnetic trip level for all “new” breakers at 25°C. Data include both 15A a nd 20A data.
Table 3. Statistical information from normal curve fit of 15- and 20-Ampere magnetic trip data.
Handle Rating (A) Mean (A) Standard Deviation (A) 95% C.I. (A) 99% C.I. (A)
15 213 33.2 278 299
20 202 56.9 314 349
Both 207 47.9 301 330
In addition to new circuit breakers, eight circuit breakers removed from residences exceeding 30 years
old were characterized as well, two from each of four manufacturers were characterized. The old breaker
magnetic trip levels are much more widely distributed than the data from the new breakers. Since the
specific age, conditions, and other service information were not available for these circuit breakers, these
Effectiveness of Circuit Breakers in Mitigating Parallel Arcing Faults in the Home Run
page 19
“old” circuit breakers are not included here in the analysis. However, the cursory analysis of the “old”
circuit breakers suggest that the magnetic trip level varies widely relative to the “new” circuit breakers and
would not be expected to exhibit a readily definable distribution similar to what is shown in Figure 8. This
wide distribution for circuit breakers manufactured before the year 1990 has been reported in the
literature by Franklin.9
As circuit breaker trip time is known to vary relative to the magnetic trip current, a “normalized” current
magnitude is therefore defined as:
)(
)(
rmsmag
rmstest
testI
II ≡
(5)
Defining this normalized current allows circuit breakers possessing different magnetic trip levels to be
compared together, by referencing each breaker’s performance to its magnetic trip level. The circuit
breaker characterization results using this normalized current is shown in Figure 9. Representative data
from tests using the “old” breakers are included here to show that newer breakers exhibit more uniform
trip time behavior than the old breakers. As was mentioned previously, this old breaker data was not used
for further analysis.
Breaker trip data for new 15A breakers.
Breaker trip data for old 15A breakers removed
from service.
Figure 9. Circuit Breaker trip time shown normalized with respect to the magnetic trip level for each 15A breaker.
Effectiveness of Circuit Breakers in Mitigating Parallel Arcing Faults in the Home Run
page 20
Analysis in the Uncertainty of Results
In this work, the determination of sample size is independent of total manufactured quantity, and
dependent only on the average value and standard deviation. This does assume a normal distribution,
which was found to be true for the breaker data. This is proven by an Anderson-Darling normality test
(Figure 10), shown below for 15A circuit breaker data. In this test, the null hypothesis is that the
distribution is normal. Since the P-value is greater than 0.05, this null hypothesis can be accepted and it
can be concluded that the data are normally distributed.
Figure 10. Anderson-Darling normality test for 15A room-temperature breaker magnetic trip data.
When measuring a random variable N times, the output is usually a distributed result instead of a single
value. An average value can be calculated from this distributed result, but the question is how close this
average value differs from the expectation.
In the case of a normal distribution, the confidence level and confidence interval are related by the
following equation (see “Introduction to Mathematical Statistics”. Robert Hogg et al):
!"#$%&" &'&(&' ) *+ , -√" / *+ 0 , -
√"
where X is the average value, σ is the standard deviation, n is the number of samples tested, θ is the
expectation, and δ is the range parameter. When δ is equal to 2, the confidence level is 95.4%; when δ is
2.576, the confidence level is 99%. Therefore, using the 15A data as an example, the lower limit on the
average value is 197.4A. The upper limit is 226.6A. This result only gives the range for the true average
value, based on the sample size of 32 used in this work for breaker trip level. The upper limit will still be
Effectiveness of Circuit Breakers in Mitigating Parallel Arcing Faults in the Home Run
page 21
determined by the sigma value: for a 99% confidence interval for all breakers (as was used in the report),
this would be 2.576 σ. Considering now the calculated uncertainty of the average value based on the
sample size, the upper trip limit range now will range between: 197.4 + 85.55 = 283A to 226.6 + 85.55 =
312A with 99% confidence level. Therefore, due to the effect of using 32 samples, we may be
underestimating our 99% confidence interval by 12A, or roughly 4%. In the worst case that the average
magnetic trip level was in fact 226.6A and not 212A, we would have a 97% confidence interval instead of
a 99% confidence interval if we continue to assume 300A for breakers in calculating maximum run length.
A single style of breaker was chosen from each manufacturer. It is noted however that once breaker
performance was normalized with respect to the measured magnetic trip level, the distribution of breaker
performance was found to be independent of all test variables, including manufacturer. This result is
shown in the data in Appendix A. Therefore, it was valid to consider all 32 15A breakers as part of a
single sample set.
The analyses on the data therefore show that the addition of more breakers into the test plan would
improve accuracy below a current accuracy of ±12A on the defined 99% confidence interval. The addition
of many more samples would be needed to reduce this by any significance, since this accuracy scales
with the square root of the sample size N. Additional conservatism in the breaker data could simply be
obtained through increasing this upper bound, but only a few percent (at most, 2% to 4%) would likely be
needed. However, it is not likely that such a change in the confidence interval limit would have a
measureable effect on the level of protection for any single breaker. In addition, considerable tolerance is
added in the protection system since maximum run length is calculated based on operation at 90°C for
the entire run length (this is discussed more in the section “Arcing Response”): in reality, it is unlikely that
there would be sustained operation at this temperature, particularly considering the NEC typically
recommends operation at 60°C. Therefore, the calcul ations as presented in the report are expected to
give 99% or better protection in virtually all installations. For example, continuing to assume all
calculations in the example in the report, the short-circuit current at room temperature would be
approximately 375A, which is 4.5 standard deviations from the worst-case average value of 226.6A. This
sigma value equates to a 99.999% confidence interval, or a 1 in 100,000 probability a breaker will not
provide protection based on the calculated maximum run length.
Limitations of Breaker Analysis
As mentioned before, these calculations are only valid for “new” breakers, manufactured after the year
1995 or so. The authors do acknowledge that older breakers have far more variability in the magnetic trip
level, and therefore for old breakers the normal distributions used above are not valid. In such a scenario,
the magnetic trip level of the breaker would need to be characterized to calculate a maximum run length.
Effectiveness of Circuit Breakers in Mitigating Parallel Arcing Faults in the Home Run
page 22
Findings from Task 1
The following findings can be summarized from the breaker magnetic trip data:
• There appears to be significant evidence in the literature that the magnetic trip level changed
significantly around the year 1990. Limited experimental work with old circuit breakers confirmed
this. However, insufficient information on the old circuit breakers was available to allow more in-
depth analyses. Therefore, results in this work will be considered applicable only to breakers
manufactured after the 1990s.
• New circuit breakers show magnetic trip levels that are normally distributed around an average
value of 213 A, and a standard deviation of 33 A. This suggests that 95% of all 15 A residential
breakers will instantaneously trip at or above 278 A, and 99% of all breakers will magnetically trip
at or above 299 A. 20A circuit breakers showed a mean value of 202 A, with 95% of all 20 A
residential breakers instantaneously tripping at or above 314 A, and 99% of all breakers
magnetically tripping at or above 349 A.
• In the case of Manufacturer D, no statistically significant change in magnetic trip level was
observed between 15A and 20A circuit breakers. In contrast, 20A circuit breakers from
Manufacturer A exhibited magnetic trip levels 20A to 30A above 15A circuit breakers from the
same manufacturer.
Task 2 - Parallel Arc Fault Tests
In this Task, circuit breakers that have been characterized in the previous Task are placed into a
simulated “home run” environment that has an arcing fault present. In this Task, the resulting arcing
events are analyzed statistically to determine whether characteristics of the particular circuit breaker used
in the tests influence the arcing behavior. This is to explore whether any arcing characteristics (such as
strike angle, peak current, etc.) are affected by design, i.e., breaker manufacturer, position in the panel,
etc. An ability to demonstrate statistical independence from these breaker-specific variables will allow for
a simplified analysis of circuit breaker performance under more generalized arcing conditions. The
following variables were identified for the parallel arcing tests:
• Available short circuit current
• Circuit breaker manufacturer
• Breaker magnetic trip level
• Position in the electric panel
• Iteration number
For each variable, at least three test iterations (replicates) were performed. A total of 575 tests were
conducted in this task.
Effectiveness of Circuit Breakers in Mitigating Parallel Arcing Faults in the Home Run
page 23
Test Procedures Developing a Carbonized Path in NM Cable
To facilitate arcing in a consistent manner, lengths of NM cable were prepared to have a carbonized path
across the conductors using the method that follows the procedure in UL 1699 - Standard for Arc-Fault
Circuit-Interrupters,13 Section 40.4 and briefly described herein. A transverse cut is made across the
midpoint of the NM test specimen to penetrate the outer sheath and the insulations on both conductors,
without damaging the copper conductor. This cut is then wrapped with two layers of electrical grade PVC
tape and wrapped with two layers of fiberglass tape. A high voltage is then applied from a transformer
capable of providing 30 mA short circuit current and an open circuit voltage at least 7 kV. After
approximately 10 seconds, the cable specimen is disconnected and then connected to a second
transformer capable of providing 300 mA short circuit current at a voltage of at least 2 kV. After one
minute of energization, the cable specimen is removed and placed in the test circuit as shown in Figure
11. The carbonized path is considered complete if a 100 W incandescent lamp in series with the path
draws 0.3 A, or can start to glow at 120 V. This method is intended for SPT-2 appliance cable but has
been found to provide consistent carbonized path for NM cables also.11
Test Arrangement
The test arrangement included a residential circuit breaker (with a known magnetic trip level) mounted in
a commercially available panel manufactured by the same manufacturer as the circuit breaker (Figure
12), with the hot connection of each breaker tied to the neutral ground bar inside the circuit breaker panel
(the neutral connection for the test circuit was connected directly to the arcing test sample and not
through the panel). This enabled each series of circuit breakers to be tested without reconfiguring the
panel, by switching the circuit breaker under test to the “on” position and leaving the other breakers in the
“off” position. The available current was adjusted through the appropriate lengths of NM cable between
the circuit breaker and the arcing sample to provide the necessary impedance to control the short-circuit
current to the desired level, similar to that as a normal “home run”. Available current at the test bench for
all tests was in excess of 1000 A. The NM cable samples were contained within a grounded metallic
enclosure to reduce electrical noise from the environment and contain smoke from the test.
13 “UL Standard for Safety for Arc-Fault Circuit-Interrupters,” UL 1699, April 2006, Section 40.4, p. 40.
Effectiveness of Circuit Breakers in Mitigating Parallel Arcing Faults in the Home Run
page 24
Figure 11. Electrical layout of the Arc Clearing Time Test, which was the basis of arcing tests conducted in this work. Specifically, the cord specimen was NM cable, the variable load was replaced with lengths of NM cable, and a conventional breaker was used in place of an AFCI.13
Figure 12. Representative photos of the circuit breakers under test mounted into commercially available
electric panels.
Parallel Fault Arc Test Procedure
The circuit breaker under test was placed in the “on” position, and power was applied by switching the
test bench circuit breaker ‘on’. The bench circuit breaker had a higher handle rating than the breakers
under test (20A versus 15A for the test breakers), and was of the “high-mag” type, where the magnetic
trip level of the breaker exceeds 500A. In the rare occurrence when the bench breaker tripped, the results
from that iteration were not used and the test was repeated. The data acquisition was preset to acquire
data when 1A current was achieved in the circuit (indicating current flow across the carbonized path). The
data were then collected for 20 seconds after this trigger event. The sample rate was 250 kS/s with a
Effectiveness of Circuit Breakers in Mitigating Parallel Arcing Faults in the Home Run
page 25
sample resolution of 24 bits. An additional 200 ms of data prior to the pre-set value was also acquired.
The timeframe was set to ensure that all expected arcing events were captured in their entirety during the
test. In all cases, all arcing either stopped, or the circuit breaker tripped, within 10 s of the start of the test.
The test data were saved in the National Instruments TDMS format for analysis.
Analysis of the Parallel Arc Fault Data
The parallel arc fault data were statistically analyzed to determine the influence of the selected variables.
The test data were analyzed using automated LabVIEW software which automatically extracted
parameters for each arcing and shorting half-cycle and for each test. Each NM cable sample was also
visually inspected to determine whether ignition had occurred during the test. Tripping of the circuit
breaker was detected though automated inspection of the voltage signal, with breaker trip detection noted
when the supply voltage drops below 6 Vrms (5% of normal line voltage).
Details of the statistical analysis can be found in Appendix A. The results of the analysis show that arcing
parameters are independent of all breaker-related test variables, and only dependent on time. Therefore,
specific arcing parameters can be neglected during analysis of circuit breaker performance. Of significant
importance was the demonstration that strike voltage is statistically independent of circuit breaker
parameters, indicating that the results from this study are applicable to both carbonized path arcing and
point contact arcing. This is because these two types of arcing were shown to be statistically different only
with respect to the distribution of strike voltages. In the case of a carbonized path, the distribution of the
strike voltages tends to be high (since the arc strikes only once a threshold strike voltage is exceeded),
while the strike voltage of a point contact tends to be more evenly distributed between high and low
voltages (since the arc strike is not dependent on a threshold voltage, with the arc striking once a point
contact is made). This proof of applicability to point contact arcing is critical to this study, since attempts to
reliably generate sustained and repeatable point contact arcing was not successful.
Analysis of Experimental Data on Circuit Breaker Performance
To evaluate the reaction of circuit breakers to arcing and shorting, a statistical approach was applied,
investigating the likeliness of arcing to occur at a given point in time. Comparing arcing probability when a
breaker is present to when it is not can be used to quantify a breaker’s effectiveness in mitigating arcing
faults. The probability of arcing is defined as the ratio of tests that exhibited arcing for a given point in time
(characterized by the half-cycle number) to the total number of tests for the series:
Parc1t2≡ 1N3An1t2N
n=1
(6)
Effectiveness of Circuit Breakers in Mitigating Parallel Arcing Faults in the Home Run
page 26
where
An(t) = 1 if arcing is present in test n at half-cycle t
An(t) = 0 if arcing is not present
t is an integer corresponding to the half-cycle number
Whether arcing was present was determined by evaluating whether the peak current values were within
20% and 92% (or 95%) of Imax, as defined in the section “Defining Arcing and Shorting Phenomenon —
Analysis of Normalized Peak Current”.
Figure 13 (left) shows the probability of arcing versus half-cycle time and short-circuit current (Imax).
Initially (during the first 100 or 150 half-cycles), the probability of arcing decreases as the half-cycle
number increases. This drop in probability can be characterized by an exponential relationship:
( ) BtAetP = (7)
Figure 13. (Left) Probability of arcing versus time and short-circuit current, which shows shorter expected arcing event lengths with increasing available current. (Right) Parameter B from exponential curve fits of data in (left). Dashed line is fit of series of B values from NM-B tests conducted in previous study (Ref. 19). Note that the slope of the fit matches that for the circuit breaker work at lower short-circuit currents.
Effectiveness of Circuit Breakers in Mitigating Parallel Arcing Faults in the Home Run
page 27
The plot shown in Figure 13 (left) is not convenient for a comparative evaluation of the rate of decay of
the probability of arcing (in order to derive information such as the expected length of the arcing event,
the probability of observing more than eight half-cycles to comply with UL 1699, etc.). A more convenient
comparison is to use the coefficient B, which characterizes the rate of change of the probability of arcing
in time. (The parameter A is always approximately 1, since all tests were triggered once arcing was
initiated, meaning that at time zero the probability of an arc is equal to 1.) The trend of parameter B with
respect to short-circuit current is shown in Figure 13 (right). A more negative value for B means that the
probability decreases more rapidly with increasing time. A zero or positive value for B would denote that
the probability is constant or increasing with time, respectively.
Parameter B becomes more negative as short-circuit current increases, suggesting a shorter arcing event
as the current increases. In a previous study evaluating arcing behavior during UL 1699 tests (Ref. 11),
the probability of arcing was similarly analyzed and the series of parameter B values were fit to a linear
curve to derive an empirical equation relating parameter B to the short-circuit current Imax, resulting in the
following (in units of Half-Cycle−1):
4156782 0.000282 ∙ 5678 0.00614 (8)
This line is shown in Figure 13 (right) for comparison to the B values obtained in this work. As the
parameter B denotes a rate of change in the probability of arcing over time, it can be considered a
measure of the expected duration of an arcing event, with more negative B values denoting shorter
expected arcing events. The results from the UL 1699 work were for characterizing the expected duration
of the arcing event without any mitigation of that event. In other words, the line in Figure 13 (right) reflects
that expected length of time an arcing event will occur on its own. Comparatively lower values for B for an
arcing mitigation method would therefore denote that the mitigation method is shortening the expected
arcing duration at a particular Imax. As can be seen, the B values are more negative for the circuit breaker
work than for the unimpeded events, deviating from one another as short-circuit current increases. This
reflects the increased reaction of the circuit breaker as the current increases. It is noted that this
increased breaker response as current increases deviates the trend of B(Imax) away from a linear
relationship. However, B(Imax) for the circuit breaker data is nearly linear at Imax at and below 150 A.
Interestingly, the slope of B(Imax) between 75 A and 100 A is identical to that from the UL 1699 study
(−0.000282 A−1·Half-Cycle−1).
With these values for B, a relationship may be developed to compare mitigation techniques to unimpeded
arcing duration. This relationship can then be used to calculate a timeframe when the probability of arcing
falls to a particular level, i.e., falls to 50% or 10% of the magnitude of the short-circuit current:
)1;, 56782 &=>1?2 (9)
Effectiveness of Circuit Breakers in Mitigating Parallel Arcing Faults in the Home Run
page 28
Using the value of B calculated from the parallel arcing results, the probability of unimpeded arcing is
The data after 100 half-cycles shows a reverse, exhibiting an increase in the probability of arcing with
time. This increase peaks at approximately 300 to 400 half-cycles, then falls off again. The increase is
most significant for the 75 A tests, and decreases rapidly as the short-circuit current increases. The trend
does not seem to be an artifact of circuit breaker operation, and may suggest a long-timeframe oscillation
in arcing behavior. The pause in arcing for 1 to 2 seconds may suggest thermal contraction during this
time, leading to a re-strike of the event. These comments are purely speculative and have not been
studied further here. However, since the second series of arcing occurs only after a large number of
arcing half-cycles have already occurred, a probability of fire is expected to be very high and therefore
any mitigation method would need to react before this second event begins.
Figure 14. (Left) Probability of shorting versus time and short-circuit current, which shows marked shorting at 75A and 150A, and minimal shorting above 150A. Shorting also tends to occur earlier as the short-circuit current rises. (Right).
Circuit Breaker Reaction to Shorting
Figure 14 (left) shows the probability of shorting with time, which was collected in a similar manner as was
done for arcing. As the data show, shorting is much more prevalent at or below 150 A. Shorting tends to
Effectiveness of Circuit Breakers in Mitigating Parallel Arcing Faults in the Home Run
page 29
occur earlier as the current rises: at 75 A, peak shorting occurs after 100 half-cycles, peaking around 300
half-cycles; shorting at 150 A tends to be present only in the first 10 to 12 half-cycles of the event.
Interestingly, arcing at 100 A is less prevalent and occurs with relatively equal probability during the first
100 half-cycles. These results do not show any clear trend, but do show that short-circuit current plays a
significant role in influencing shorting behavior (this matches the statistical results discussed in the
following section, “Analysis of Circuit Breaker Performance ”).
Circuit Breaker Reaction to Arcing and Shorting
Figure 14 (right) shows the fraction of circuit breakers providing power over time. This therefore shows
the fraction of circuit breakers which have not tripped at a function of time. The figure shows that, if an
eight half-cycle reaction time is required of a breaker to effectively replace an AFCI in mitigating a parallel
fault, significant protection is not achieved until the short-circuit current exceeds 300 A (which exceeds
the magnetic trip level of most breakers in this work). At 300 A, roughly 90% of all breakers were tripping
within eight half-cycles. However, at or below 100 A, virtually zero of the circuit breakers reacted within
this timeframe, and continued to not react to the fault for several hundred half-cycles.
A more clear analysis can be done by overlaying the arcing and shorting data on top of the voltage data.
This is shown for 75 A through 200 A in Figure 15. The data at 300 A are not shown since most circuit
breakers tripped very quickly, since the magnetic trip level had been exceeded. Therefore, this analysis
gives a view of circuit breaker reaction to arcing and shorting faults while operating largely in the thermal
trip regime. From the data, it can be seen that breakers tend to be rather insensitive to arcing faults at or
below 150 A. At these short-circuit currents, breakers tended to trip once shorting has occurred (this can
be empirically viewed by comparing the change in the number of circuit breakers providing voltage to the
arcing and shorting peaks). In particular, virtually all breakers continue to provide power through to peak
time of arcing at 75 A and at 100 A, showing more reaction to shorting events. The exception is at 200 A,
but virtually no shorting occurred at this current level.
These results are expected due to the nature of the operation of a circuit breaker, as they are by design
intended to delay tripping at intermediate fault currents to prevent nuisance tripping during transient surge
events, such as during startup of large motors and when lighting is turned on. Shorting tends to exhibit
higher peak currents relative to arcing (roughly 20% higher), so shorting events are expected to
magnetically trip a breaker at lower fault currents relative to an arc. Additionally, since a shorting fault
sinks more power within a half-cycle relative to an arc fault (since shorts deliver the full fault current over
the entire half cycle, where an arc fault delivers no power before a threshold strike voltage is attained),
wiring temperature is expected to rise at a faster rate during a shorting event, triggering the circuit breaker
bimetal more quickly.
Effectiveness of Circuit Breakers in Mitigating Parallel Arcing Faults in the Home Run
page 30
Figure 15. Voltage trip data shown with arcing and shorting probabilities for 75 A through 200 A.
Probability of Arcing for Eight or More Half-Cycles
Using the empirical results discussed in this section, a probability of achieving eight or more half-cycles
within 0.5 seconds can be calculated to assess the ability of circuit breakers to mitigate a parallel fault
based on the criteria in UL 1699. This probability then may be compared to the results obtained through
unmitigated arcing conditions under the same test conditions. The difference in probabilities then
characterizes the effectiveness of a breaker in providing protection when compared to the AFCI criteria in
UL 1699.
Effectiveness of Circuit Breakers in Mitigating Parallel Arcing Faults in the Home Run
page 31
The general method used here is to leverage the exponential curve fitting of the incidence of arcing with
time. Here only this initial decay will be considered: this is justifiable since according to UL 1699 the AFCI
must react within 0.5 s, or 60 half-cycles. As before, the values for A and B were found experimentally
through least-squares curve fitting of the arcing probability data. Using this formula, numerical
probabilities of eight or more half-cycles occurring within 0.5 seconds can be calculated. The derivation of
such a formula resembles that for a Bernoulli distribution, since the presence of an arcing event in a given
point of time can be characterized by a probability, p(t), and a lack of arcing by its inverse, 1 – p(t).
However, Bernoulli distributions assume that the probability through time is constant. In the case here,
the probability of arcing with respect to time is not constant, but follows an exponential function.
The probability of exactly zero arcing events occurring in one half-second can be expressed as the
following:
( )∏
=
−=60
10 1
ttpP
(11)
where pt is the probability of an arc at half-cycle number t. This expression is simply the product of the
probability of not obtaining an arc in any of the 60 half-cycles during the 0.5 second test. The probability
of obtaining exactly one arc during the test requires the summation of all combinations of one arc (the arc
can appear in any one of the sixty half-cycles). This therefore can be expressed as:
( ) ( ) ( ) ( )∑∑ ∏∑ ∏== == = −
=
−
−=
−=60
10
60
1
60
1
60
1
59
11 1
11
1n n
n
n tt
n
n
n ttn p
pPp
p
pppP
(12)
where pn is the probability of an arc at time n. Expanding to exactly two arcs is calculated similarly,
including all combinations of the two arcs:
( )( ) ( )∑∑∑
== = −−
−−=
60
12
2
0
60
1
60
102
1112
1
n n
n
m n nm
nm
p
pP
pp
ppPP
(13)
The one-half term is added since each combination of m and n are summed twice (for example, m = 2,
n = 3 and m = 3, n = 2 are the same combination and therefore should be counted only once). For two or
more arcs, each must occur at different half-cycles; therefore, combinations where m = n above need to
be removed since they cannot occur. For y arcs, this formula can be generalized as:
( )( ) ( )∑∑∑
= == −−−=
60
1
60
1
60
10 111!
1
m n znm
znm
zy ppp
pppP
yP
L
KK , where m ≠ n ≠ …≠ z. (14)
Effectiveness of Circuit Breakers in Mitigating Parallel Arcing Faults in the Home Run
page 32
A more efficient version of this equation can be obtained if the ranges of the summations are bounded in
the following manner, which eliminates the redundant terms:
( )( ) ( )∑ ∑ ∑∑−+= −+= −+=
−
= −−−=
58
3
59
2
60
1
60
10 111kyl lym myn znm
znmy
zy ppp
pppPP
L
KK
(15)
This version is critical for solving for y values above 5, since the number of computations required to solve
the original equation quickly become impractical. For example, y = 7 would require 607 or 2.8 trillion
factors to be summed, each factor requiring a minimum of 59 multiplications to generate. With available
computing abilities, this would take roughly 7 months to solve for a single value of P7. In contrast, the
more efficient version requires only 50 million terms and can be solved in approximately one hour
(reduction in complexity is by a factor of y!. For P7, 7! = 5040.).
To calculate the probability of seven or fewer arcs in 0.5 seconds, eight probabilities for zero to seven
arcs are calculated, then summed as presented in Equation 16:
∑
=
+=7
107,0
yyPPP
(16)
where Py is as was expressed previously. Therefore, calculation of P0,7 above (Table 4) gives the
probability that a particular circuit breaker will be successful in mitigating the parallel arcing fault at a
particular fault current, or in the unmitigated case, the probability that seven or fewer arcs will naturally
occur before self-extinguishing at that short-circuit current level. As is seen, the probability of eight or
more half-cycles is virtually unchanged when the short-circuit current is below 300A, showing that circuit
breakers are ineffective in mitigating arcing at these current levels. At 300A, the probability of eight or
more arcs changes dramatically, showing that a circuit breaker is very effective at mitigating arcing at this
level. Since 99% of all breakers magnetically trip at or above 300A (as discussed previously and shown
graphically in Figure 8), it is concluded that effective mitigation of arcing is only achieved when the
magnetic trip level is exceeded.
The fault current can be directly translated to the distance between the circuit breaker and location of the
parallel fault. Ultimately, this table of probabilities could be used to quantify the risk of failing to mitigate a
parallel fault based on maximum length of home run wiring. Potential code changes resulting from this
investigation may include an upper bound on home run wiring impedance, i.e., maximum allowable length
for a given wire gauge, or minimum required magnetic trip times for circuit breakers. These parameters
would be dependent on the maximum acceptable probability of a circuit breaker failing to react to an
arcing fault within eight half-cycles.
Effectiveness of Circuit Breakers in Mitigating Parallel Arcing Faults in the Home Run
page 33
Table 4. Evaluation of the effect of circuit breaker mitigation of arcing faults, based on exponential fitting of time-based arcing data. A and B are the exponential fitting parameters used for calculating probabilities. P7 is probability of exactly seven arcs in 0.5 seconds, P8,60 is probability of eight or more half-cycles occurring, or the probability that the test will fail UL 1699 criteria.
Through the design-of-experiment for this work, a goal was to include circuit breakers from most major
manufacturer, as well as a wide range of magnetic trip levels that may be encountered (at least within
15 A residential circuits). The selection of circuit breakers was successful in obtaining a wide range of
magnetic trip levels, from 150 A to 570 A. Both newly manufactured, as well as old breakers removed
from service were also obtained to determine whether aging effects and/or changes in breaker design
had a significant influence. However, though it is of the opinion of the authors that the circuit breakers
used in this work are representative of what is in service in the field, it is not known whether the specific
distribution of the circuit breaker performance closely matches all installations in the field. This survey was
not conducted here, nor is it likely to result in beneficial data: breakers encountered in a given installation
are likely to vary widely based on age, manufacturer, aging conditions, and numerous other factors.
Therefore, though it is strongly believed that the empirical results from this work will give an accurate view
of circuit breaker performance, it is to be remembered that specific installations may vary from this case.
Therefore, these results should be considered “representative” of what is to be expected in real-world
installations. These limitations, as well as a method to deal with a variable magnetic trip level, will be
explored in more detail later in the following sections.
Effectiveness of Circuit Breakers in Mitigating Parallel Arcing Faults in the Home Run
page 34
Analysis of Circuit Breaker Performance Normalized to Magnetic Trip Level
As is known from the circuit breaker calibration discussed in Task 1, the circuit breaker response time is
dependent on the magnetic trip level of that particular circuit breaker. Furthermore, it was observed that
two breakers despite being of the same model from the same manufacturer may exhibit different
magnetic trip levels. This variability in performance was a key limitation in the prior analysis of circuit
breaker performance with respect to short-circuit current. As was seen in Figure 9, when breaker
performance is expressed relative to the magnetic trip level, performance for “new” breakers is very
uniform, even among manufacturers. Therefore further analysis would benefit using a “normalized”
current magnitude, defined as:
)(
)(
rmsmag
rmstest
testI
II ≡
(17)
Defining this normalized current allows breakers possessing different magnetic trip levels to be compared
together. Using this normalized current and key test parameters, the correlation of each key variable can
be analyzed, again using ANOVA. Appendix B contains the results of this analysis. Through a final
analysis of these results, only short-circuit current shows a significant influence on the test variables, and
therefore all other variables can be neglected for further study. Breaker age and breaker number showed
very low R value (<5%) for all variables, and therefore are not significant parameters in this work. Though
manufacturer showed moderate influence on normalized current and time of circuit breaker trip, this was
an artifact of the Manufacturer D breakers having consistently lower magnetic trip levels relative to the
other three manufacturers. This would result in Manufacturer D breakers having an overall higher
normalized current. Since the magnetic trip level is lower than other manufacturers, it would be expected
that Manufacturer D breakers trip more often throughout all testing. If the current level is normalized to the
magnetic trip level of each breaker, the influence of manufacturer becomes insignificant, and breaker trip
time becomes decoupled from the magnetic trip level. The iteration number showed moderate correlation
to all test variables; however, further investigation by short-circuit current (Figure 36) reveals that the
correlation is an artifact of increased number of iterations at higher short-circuit currents. Once this is
taken into consideration, the iteration number shows negligible effect on the test variables. Circuit Breaker Performance Relative to Magnetic Trip Level
From the statistical analysis of the arcing behavior, most test variables can be eliminated from
consideration, including circuit breaker position, manufacturer, age, iteration number, and absolute
magnetic trip level. As the analysis shows, the short-circuit current is the dominant variable controlling
circuit breaker magnetic trip level. Therefore, to be able to compare performance between circuit breakers
with different magnetic trip levels, the normalized current (Equation 17) will be used as defined earlier. A
Effectiveness of Circuit Breakers in Mitigating Parallel Arcing Faults in the Home Run
page 35
normalized current of 1.0 denotes operation at the circuit breaker magnetic trip level; values less than 1
denote operation below the magnetic trip level (operating in the thermal trip regime); and values greater
than 1.0 denote operation above the magnetic trip level. As it has already been discussed that specific
arcing behavior is independent of the test variables (except for time), and thus only the number of arcing
events and their occurrence in time are considered for the remainder of this work.
Figure 16. (Left) Number and (right) time of last arcing and shorting half-cycle.
As can be seen in each plot in Figure 16, though arcing and shorting greatly diminishes when the
magnetic trip level is reached, significant arcing may occur at or below a normalized current of 1.2. Figure
16 also shows the number and time of last arcing and shorting half-cycle as a function of normalized
current. As can be seen, below the magnetic trip level, both arcing and shorting can be significant and of
a very long duration. It was observed that though the number of shorting half-cycles passing through the
circuit breaker is greatly reduced when half the magnetic trip level is reached, significant amounts of
arcing may occur above the magnetic trip level, with one test even showing 12 arc half-cycles at 1.15
times the magnetic trip level. The time of last arcing or shorting event shows greatly diminished duration
of event when the magnetic trip level is reached, but nonzero events were recorded, including one
occurring over a period of 171 half-cycles, again at 1.15 times magnetic trip level.
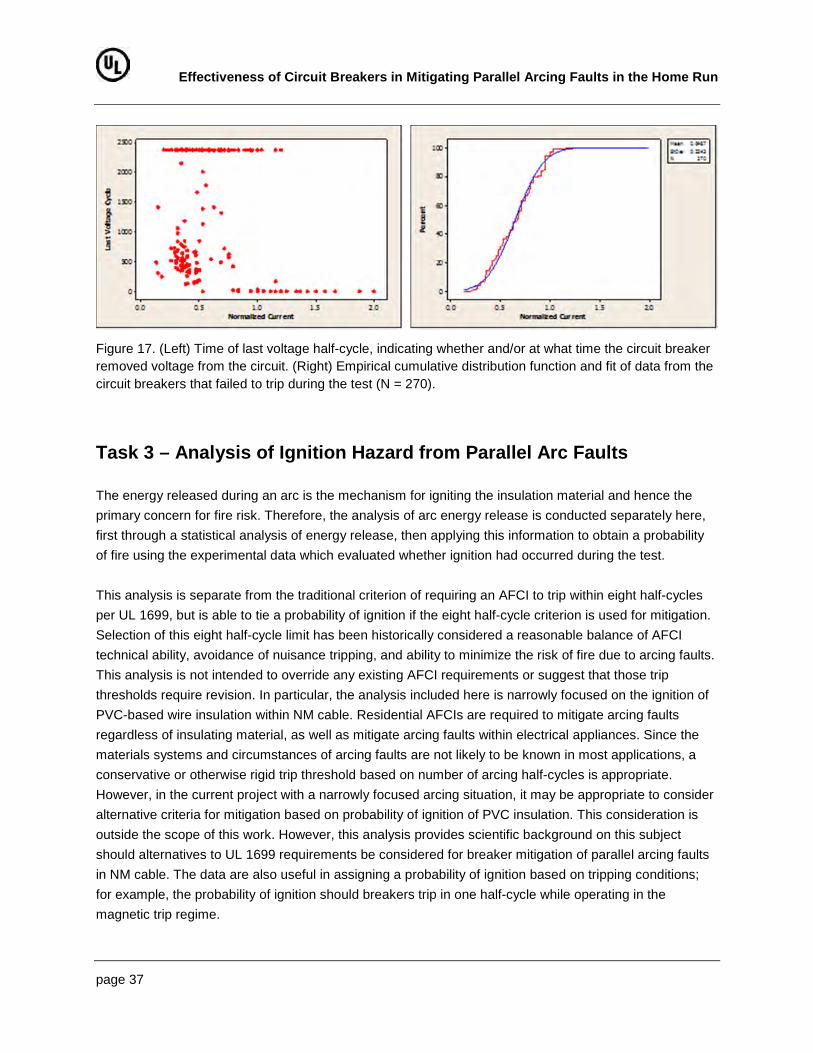
Consideration only of number of arcing and shorting half-cycles does not include whether the circuit
breaker reacted to the arcing, since some arcing events may have extinguished themselves without any
breaker action. Figure 17 (left) shows the time at when the circuit breaker tripped thus removing power
from the circuit. Values at 2375 half-cycles (which is the time when data gathering during the test was
stopped) denote a breaker that failed to trip during the 20-second test. Values less than 2375 denote
breakers that succeeded in tripping. As was expected, breakers tended to trip more quickly as the current
approached the magnetic trip level. However, many instances of circuit breakers failing to trip were
observed up to 1.2 times the magnetic trip level. In Figure 17 (right) and Table 5, the circuit breaker data
which failed to trip (where last voltage cycle was 2375) is used to calculate a cumulative distribution
function to determine the probability that a breaker would trip for a given normalized short-circuit current.
Effectiveness of Circuit Breakers in Mitigating Parallel Arcing Faults in the Home Run
page 36
As can be seen in Table 5, breakers are expected to trip during an arcing event only 95% of the time
when the short-circuit current is equal to the magnetic trip level (normalized current equal to 1.0). A
breaker will trip 99% of the time during an arcing event only once the short-circuit current exceeds
approximately 1.2 times the magnetic trip level.
Table 5. Results from normally-distributed cumulative distribution fit from failed breaker tripping data (as shown in Figure 17, right).
To understand the reason why a short-circuit current needs to exceed the magnetic trip level to ensure
tripping during arcing, the probability distribution function of the peak arcing current needs to be re-
examined (Figure 4). As can be seen, peak arc current is not expected to exceed 92% of short-circuit
current (Imax), and will have a median value of approximately 80% of Imax. Taking the inverse of these
values, this shows that, at minimum, the short circuit current needs to be 1.08 times the magnetic trip
level (since 92% of 1.08 will equal the magnetic trip level of 1.0), and will not achieve the median value
until 1.25 times the magnetic trip level (80% of 1.25 equals 1.0).
Effectiveness of Circuit Breakers in Mitigating Parallel Arcing Faults in the Home Run
page 37
Figure 17. (Left) Time of last voltage half-cycle, indicating whether and/or at what time the circuit breaker removed voltage from the circuit. (Right) Empirical cumulative distribution function and fit of data from the circuit breakers that failed to trip during the test (N = 270).
Task 3 – Analysis of Ignition Hazard from Parallel Arc Faults
The energy released during an arc is the mechanism for igniting the insulation material and hence the
primary concern for fire risk. Therefore, the analysis of arc energy release is conducted separately here,
first through a statistical analysis of energy release, then applying this information to obtain a probability
of fire using the experimental data which evaluated whether ignition had occurred during the test.
This analysis is separate from the traditional criterion of requiring an AFCI to trip within eight half-cycles
per UL 1699, but is able to tie a probability of ignition if the eight half-cycle criterion is used for mitigation.
Selection of this eight half-cycle limit has been historically considered a reasonable balance of AFCI
technical ability, avoidance of nuisance tripping, and ability to minimize the risk of fire due to arcing faults.
This analysis is not intended to override any existing AFCI requirements or suggest that those trip
thresholds require revision. In particular, the analysis included here is narrowly focused on the ignition of
PVC-based wire insulation within NM cable. Residential AFCIs are required to mitigate arcing faults
regardless of insulating material, as well as mitigate arcing faults within electrical appliances. Since the
materials systems and circumstances of arcing faults are not likely to be known in most applications, a
conservative or otherwise rigid trip threshold based on number of arcing half-cycles is appropriate.
However, in the current project with a narrowly focused arcing situation, it may be appropriate to consider
alternative criteria for mitigation based on probability of ignition of PVC insulation. This consideration is
outside the scope of this work. However, this analysis provides scientific background on this subject
should alternatives to UL 1699 requirements be considered for breaker mitigation of parallel arcing faults
in NM cable. The data are also useful in assigning a probability of ignition based on tripping conditions;
for example, the probability of ignition should breakers trip in one half-cycle while operating in the
magnetic trip regime.
Effectiveness of Circuit Breakers in Mitigating Parallel Arcing Faults in the Home Run
page 38
Table 6. Goodness-of-fit (R squared values from ANOVA) for identified independent variables influencing the energy released in each arcing half-cycle.
Variable R-Sq (%) R-Sq (adj) (%) P N Short-Circuit Current (Imax) 35.64 35.63 0.000 22728 Iteration Number 9.92 9.90 0.000 22728 Half-Cycle Number 16.87 9.42 0.000 22728 Breaker Magnetic Trip Level 2.07 2.02 0.000 22728 Breaker Number 1.03 1.00 0.000 22728 Manufacturer 0.74 0.73 0.000 22728 Breaker Age 0.00 0.00 0.661 22728
Arc Energy Behavior
The energy released in each arcing half-cycle was calculated by measuring the voltage and current
waveforms between the strike and stop angles, and integrating with respect to time.
C D E1;2 ∙ 51;2FGHIFGHJKL %; (18)
In practice, this was done automatically by multiplying first the voltage and current sample at each instant
in time, then multiplied by the duration of each sample (in this study, a sample rate of 250 kS/s was used,
so the duration of each sample was 4 µs). Each of these samples was then summed to give the total
energy in Joules for each arcing event:
C ∑ E1"2 ∙ 51"2 ∙ ∆;FGHIOPFGHJKL (19)
where ∆t is time interval between samples, in seconds.
The energy released for each arcing half-cycle was then recorded and indexed to each test variable. As
previously, the correlation of the arc energy can be analyzed using ANOVA to determine the relationship
of the key test variables to the arc energy. Table 6 shows this analysis. In the table, N is the number of
data points used in the statistical analysis. It is seen that the short-circuit current is the dominant variable
influencing arc energy per half cycle (Figure 18, left). This relationship is understandable since the arc
current is dominated by the short-circuit current (showing a median peak current of 0.8 times the short-
circuit current, as seen in Figure 4). The independence of all other variables supports the initial
Effectiveness of Circuit Breakers in Mitigating Parallel Arcing Faults in the Home Run
page 39
conclusion that arcing generated by either a carbonized path or by a point contact will give statistically
identical results. As can be seen in Figure 18 (right), the R value for iteration number is artificially inflated
due to an increased number of iterations at higher short-circuit currents. The half-cycle number (Figure
19) showed a higher R value since at the start of the arcing event, arc energy in each half-cycles is
increased, then drops to a minimum around the 50th half-cycle. As the arcing event exceeds
approximately 100 half-cycles, the distribution of the arc energy reaches a steady-state.
Figure 18. (Left) Boxplot of arc energy released each arcing half-cycle as a function of short-circuit current. (Right) Boxplot showing the relationship of arc energy versus iteration number, indexed to current.
Figure 19. Boxplot showing the arc energy released in each arcing half-cycle as a function of time.
Effectiveness of Circuit Breakers in Mitigating Parallel Arcing Faults in the Home Run
page 40
Model for Arcing Energy
In order to use the arc energy data for estimating the probability of ignition, a generalized model of the
statistical distribution of arc energy per half-cycle was developed. The ANOVA analysis identified the
magnitude of arc energy is the short-circuit current (Figure 18, left) as a dominant variable. Therefore, an
initial analysis was explored using the statistical distribution of arc energy for individual short-circuit
currents. Figure 20 shows two histograms of the arc energy, at 100A and 200A. It may be observed that
the shape of the probability distribution functions are the similar for each, and the magnitudes for each
scale with the short-circuit current. Previous work11 has shown that the probability distribution governing
most arcing behavior is a 3-parameter log-normal distribution. The scaling of values also suggests that
the energy values can be normalized relative to the short-circuit current and allow for a more generalized
description of arc energy. Thus, a normalized arc energy is therefore defined as:
C+ ≡ R
? (20)
where E is the arc energy per half-cycle, and Imax is the short-circuit current. This normalized energy has
units of J/A. This normalized energy is then modified by subtracting it from 1 to match a log-normal
distribution. The resulting histogram and fit is shown in Figure 21 (left).
In order to calculate mean and standard deviation data for the normalized energy, the data were
transformed into a normal distribution. This can be done by using the transformation function as shown in
Equation (21):
S#!T ≡ '"U11 C+2 VWT&XWY (21)
Figure 20. Histograms for arc energy per half-cycle for (left) 100A and (right) 200A short-circuit current.
Effectiveness of Circuit Breakers in Mitigating Parallel Arcing Faults in the Home Run
page 41
Figure 21. (Left) Log-normal fit of modified normalized energy at all short-circuit currents.
where Thresh is the threshold value from the 3-parameter log-normal fit. Figure 21 (right) shows a
representative fit using the transformed data. From this normal distribution, the mean and standard
deviation values, respectively, can be calculated by reversing the transform:
CZ+++ VWT&XW 0 &8[\]6^ (22)
C_`+++++ VWT&XW 0 &a8[\]6^_8[\]6bc (23)
Table 7. Fitting data and statistical information on the normalized energy released per half-cycle.
Short-Circuit Current
(A)
Lognormal Fit Parameters Normal Fit Parameters
Normalized Energy Distribution (J/A)
Loc Scale Thresh Mean Std Dev –Std Dev Mean +St Dev 75† –2.209 0.6559 0.4645 –2.209 0.6556 0.3240 0.4257 0.4785 100 –1.735 0.5288 0.4419 –1.735 0.5289 0.2587 0.3817 0.4542 150 –1.531 0.4257 0.3993 –1.531 0.4260 0.2695 0.3844 0.4594 200 –1.638 0.3956 0.4521 –1.638 0.3962 0.2590 0.3535 0.4171 300* 6.240 1.3·10-4 –512.3 6.240 1.3·10-4 0.3748 0.4415 0.5082 ALL –1.692 0.5057 0.4352 –1.692 0.5056 0.2595 0.3806 0.4537 †The distribution at 75A exhibited two peaks rather than one. This resulted in a less-optimal fit.
*N = 13 at Imax = 300A, so fitting was not well correlated. Fitting was likely not accurate.
Effectiveness of Circuit Breakers in Mitigating Parallel Arcing Faults in the Home Run
page 42
where xformµ and xformσ are the mean and standard deviation values from the normal fit of the
transformed data, respectively.
Table 7 shows the resulting fitting data and statistical information from fits as a function of Imax. Note that
the 75A data exhibited two peaks rather than one, and therefore resulted in a less-optimal curve fit. The
300A data contained only 13 points, and also exhibited poor fitting. The data for 100A, 150A, 200A, and
all data together show similar statistical values for the normalized energy, and suggest that a generalized
model based on the normalized energy is sufficient for generalized modeling arc energy. This generalize
model is expressed in the “ALL” row in the table.
Analysis of Total Arc Energy Released
Expanding now to total arc energy released per test, a similar analysis as before can be carried out
evaluating the influence of test variables on total energy released. Table 8 shows the results of the
ANOVA analysis. As can be seen, only the short-circuit current Imax has a significant influence on the total
energy released (Figure 22, left), and will be the focus of analysis for this attribute. The iteration number
can be neglected for similar reasons as has been shown previously (Figure 22, right).
Table 8. Goodness-of-fit (R squared values from ANOVA) for identified independent variables influencing the energy released in each test. N is number of data points used in each calculation of the R values. P-values are also given for each variable.
Variable R-Sq (%) R-Sq (adj) (%) P N Short-Circuit Current (Imax) 29.46 28.98 0.000 595 Iteration Number 5.32 4.68 0.000 595 Breaker Trip 0.83 0.66 0.026 595 Manufacturer 0.92 0.42 0.141 595 Breaker Age 0.19 0.02 0.286 595 Breaker Magnetic Trip Level 1.86 0.00 0.609 595 Breaker Number 0.37 0.00 0.948 595
Effectiveness of Circuit Breakers in Mitigating Parallel Arcing Faults in the Home Run
page 43
Figure 22. (Left) Boxplot showing total arc energy released for each test as a function of short-circuit current. (Right) Boxplot showing the relationship of arc energy to iteration number and short-circuit current.
Figure 23. (Left) Total arcing energy as a function of short-circuit current, showing points which did not result in a breaker trip. Solid black line shows linear fit of upper bound of data. (Right) Total arcing energy as a function of normalized current, showing points which resulted in a breaker trip.
Comparing the results in Figure 18 (left) and Figure 22 (left), it is observed that though the arc energy per
half-cycle increases with Imax, the total energy release follows the inverse relationship, with more total
energy released at lower currents. This is because the circuit breaker delays tripping at lower currents
longer, allowing more half-cycles to occur, while very few cycles are able to occur when the short-circuit
current exceeds the magnetic trip level of the circuit breaker. As has been demonstrated previously,
magnetic tripping on arcing faults is not expected to occur until the short-circuit current exceeds the
magnetic trip level by a factor of 1.25. Considering this, a more meaningful relationship between total arc
energy released and breaker performance would be to compare data in terms of the normalized current
as before (Figure 23, left). This results in a scatterplot that shows a linear relationship for the upper bound
300250200150100
16000
14000
12000
10000
8000
6000
4000
2000
0
Short-Circuit Current (A)
Tota
l A
rc E
nerg
y R
ele
ase (
J)
2.01.51.00.50.0
25000
20000
15000
10000
5000
0
Normalized Current
Tota
l A
rc E
nerg
y R
ele
ase (
J)
Effectiveness of Circuit Breakers in Mitigating Parallel Arcing Faults in the Home Run
page 44
of total arc energy released, which decreases towards zero energy at approximately 1.25 times the
magnetic trip level, then showing energy at or near zero above this threshold.
Observing the plots in Figure 23 suggest a linear relationship of the upper bound of total arc energy and
current. Figure 23 shows two linear fits to this upper bound, one using the data where the circuit breaker
tripped during the test, and one where the circuit breaker did not. The linear fit for these two data sets
result in the following equations for the upper limit of the data:
C678156782 23271 71.681 ∙ 5678 (Not Tripped) (24)
C6f815=hi=2 30563 28035 ∙ 5=hi= (Tripped) (25)
These two limits suggest that total arc energy can be limited by one of two mechanisms when operating
below the magnetic trip level. One is thermal tripping of the circuit breaker, which may include shorting
half-cycles (which tend to hasten tripping of the circuit breaker). Since this mechanism is governed by the
trip level of the circuit breaker, normalized current is the governing variable in this case. A second is
failure of the NM cable itself, where the circuit is opened due to the arc destroying the electrical
connection of the cable or the arcing path. In this case, it is not expected that the magnetic trip level of the
circuit breaker will be a factor in total energy release when the circuit breaker does not trip; therefore, the
short-circuit current is used.
These two proposed linear relationships do not enable prediction of total arc energy release based on
whether the circuit breaker trips, but it does place an upper bound on the total possible release of arcing
energy for a given magnetic trip level and/or short-circuit current. It may be observed, that for the tripping
data, the x-intercept is located at 1.1 times the magnetic trip level, which is reasonably consistent with the
1.25 value previously associated with breaker tripping and arcing behavior. The upper bound for the data
where the circuit breaker failed to trip suggests that arc energy release will not increase without bound,
and is expected to approach zero as the short-circuit current approaches 325 A. This suggests that
14 AWG conductor used in NM cable will limit arc faults above 325 A similar to the action of a fuse,
though most modern breakers will trip magnetically at or above this level (this is not the case with older
breakers, which may have a magnetic trip level exceeding 325 A).
Analysis of Ignition versus Energy Release
To understand the relationship of energy release and ignition, it was recorded from each test whether
ignition of the wiring insulation had occurred. The observations from each test showed clearly that there is
no definitive boundary that can be easily discerned between insulation which has ignited and that which
had not. Cables exhibited extreme cases of ignition, as shown in Figure 24 (the test sample above had an
Imax of 75A), to no visible external damage at all. Therefore, “ignition” was defined for a given test if visible
Effectiveness of Circuit Breakers in Mitigating Parallel Arcing Faults in the Home Run
page 45
charring was observed on the surface of the insulation of the NM cable. The assumption was that if the
outer insulation jacket showed signs of combustion, there was a significant probability of ignition of
materials surrounding the cable. This is a conservative approach to identifying a lower threshold for
ignition.
Figure 24. Photograph of a test sample exhibiting extensive damage from cable ignition. Samples exhibited a continuum of damage, from heavily damaged (as above) to visibly undamaged.
Table 9. Goodness-of-fit (R squared values from ANOVA) for identified independent variables which show correlation to the observed ignition in each test.
Variable R-Sq (%) R-Sq (adj) (%) P N Total Arc Energy Release 27.61 27.34 0.000 274 Last Arcing Half-Cycle 24.77 24.50 0.000 274 Number Arcing Half-Cycles 23.61 23.33 0.000 274 Last Shorting Half-Cycle 20.77 20.48 0.000 274 Iteration Number 4.51 4.16 0.000 274 Breaker Number 0.82 0.45 0.136 274 Normalized Current 0.57 0.21 0.211 274 Short-Circuit Current (Imax) 0.17 0.00 0.500 274 Last Voltage Half-Cycle 0.10 0.00 0.611 274 Test Number 0.01 0.00 0.875 274 Breaker Magnetic Trip Level 0.01 0.00 0.852 274 Number of Shorting Half-Cycles 0.00 0.00 0.964 274
In Table 9, N is number of data points used in each calculation of the R values. P-values are also given
for each variable.
An ANOVA analysis of the ignition data is shown in Table 9. The analysis suggests that the total arc
energy is the dominant factor influencing ignition. It is noted that other factors have a similar level of
Effectiveness of Circuit Breakers in Mitigating Parallel Arcing Faults in the Home Run
page 46
influence, however, variables such as the number of arcing half-cycles and the time of the last arc half-
cycle are closely related to energy release, and therefore reflect the relationship of energy release and
ignition. The correlation to the last shorting half-cycle is not clear, but may be somehow tied to the total
duration of the event, where a shorting half-cycle occurs after a time of arcing. It appears that shorting in
itself was not a factor in ignition, which is reflected by the lack of correlation of the number of shorting
half-cycles to ignition. It is noted that energy, and not current magnitude, is the factor most influencing
ignition.
If heat loss with time was a significant factor influencing total energy required for ignition, it would be
expected that lower power levels would tend to show a lower propensity for ignition for a given amount of
energy. Since this was not observed, it can be assumed that heat loss with time is insignificant and can
be neglected.
Since ignition is primarily governed by total energy release, it is important to characterize this to
determine a lower bound on the amount of energy that is expected to lead to a high probability of ignition.
Figure 25 (right) shows energy release per half-cycle, which can be treated as an indicator of power. This
power plot shows no relationship to ignition, suggesting that the power magnitude is less important than
the time it is applied. If energy alone is the dominant factor, it implies that the time to ignition is small
compared to the rate of heat loss to the air and through the copper conductors. An ability to neglect heat
loss reduces a potentially complex dynamic model to a simplified model of total energy applied and
ignition potential. This dependence solely on total energy applied without a significant dependence on
time (for very short ignition times, as is observed here) was also observed during development of
UL 1699B, which cites a maximum threshold of 750 J before there is a 5% probability of ignition.14
If the timeframe of energy application can be neglected, a predictor of ignition can be based on an
absolute threshold of energy released. Figure 26 (left) shows two empirical cumulative distribution
functions (CDFs) of energy release data, divided by whether ignition was observed. A three-parameter
lognormal distribution appears to show the best agreement to the distribution data. To compare the
distributions of the two data sets, the CDF for non-ignition is inverted and plotted with the ignition CDF, as
shown in Figure 26 (right). The CDFs cross at 2200 J, which suggests a potential threshold for ignition. A
more conservative alternative would be at 5% probability of ignition, with a total energy release of 490 J.
This result now can be compared to the statistical information from energy release to evaluate the
probability of ignition when a breaker is utilized for mitigating a parallel arc event. Determining a specific
number of “half cycles” that will directly result in ignition is not possible, since the amount of energy
released in a half cycle is governed by a random process (characterized in Figure 21 and Table 7).
However, a range of the probability of ignition can be calculated based on a mean energy and standard
deviation values for a given number of half-cycles. This calculation is shown in Table 10: color coding in
14 UL Subject 1699B, “Outline of Investigation for Photovoltaic (PV) DC Arc-Fault Circuit Protection,” Section 23.3.1e. April 29, 2011.
Effectiveness of Circuit Breakers in Mitigating Parallel Arcing Faults in the Home Run
page 47
Table 10 is the same as used previously for tabulation of R values, e.g., see Table 24. Probabilities
assume that all arcing half-cycles contain the total energy as shown. Energy loss through conduction and
convection mechanisms is neglected, but has been shown to be negligible for the time durations shown.
Figure 25. (Left) Boxplot of total arc energy released versus whether ignition occurred, which suggests an energy threshold above which ignition becomes likely. (Right) Boxplot of arc power (in units of Joules per half cycle) versus ignition.
Figure 26. (Left) Empirical cumulative distribution functions (CDFs) of total energy released and ignition. (Right) Cumulative CDF fits from (left), comparing data from samples showing ignition to those that did not. Numbers show coordinates for 5% probability of ignition and point where the CDFs cross.
For each calculation, the total energy is assumed to be equivalent to the mean or one standard deviation
above or below the mean for all half-cycles. The probability of ignition is then interpolated from the CDF
shown in Figure 26. The results show that a very low probability of ignition (less than 3%) exists if the
circuit breaker trips magnetically. It is also shown that very good protection is obtained if the number of
arcing half-cycles is maintained at or below eight. However, reliance on breaker protection in the thermal
trip regime (where the number of arcing half-cycles grows large) is shown not to be effective at preventing
Effectiveness of Circuit Breakers in Mitigating Parallel Arcing Faults in the Home Run
page 48
ignition of the cable, since probability of ignition rises quickly with the number of arcing half-cycles.
Table 10. Calculation of the probability of ignition, using the statistical model for normalized energy (Figure 21) and the empirical CDF for ignition data (Figure 26).
No. Arcing Half-
Cycles
Assumed Magnitude Distribution
Estimated Total Energy Release (J) Probability of Ignition, %
Effectiveness of Circuit Breakers in Mitigating Parallel Arcing Faults in the Home Run
page 49
Task 4 – Summary of Findings Circuit Breaker Characterization
Despite rejection of the EIA proposal for the 1996 NEC, circuit breakers evaluated in this work
demonstrated magnetic trip levels consistent with the 1996 recommendations, showing a mean magnetic
trip level of 213A (Figure 8), which correlates well with Franklin’s observation that average arcing
magnitudes are expected to be “around 200 to 250 Amperes”.9
Considering the literature and the experimental results here, it appears that the “new” breaker data cited
in this work is representative of circuit breakers currently manufactured, perhaps as well as breakers in
service for the past 10 or 20 years, presumably during or after the 1996 EIA proposal, or at least after the
Franklin publications. Therefore, results from this work based on “new” breaker data is expected to match
most real-world installations. However, the “old” breaker data may or may not be representative of a
specific older installation. Since breaker magnetic trip levels ranged over such a wide range prior to the
1990s, it is not realistic to state a “representative” data set of old breakers and report “expected” results.
However, a small sampling of older breakers was used in this work (but not analyzed) to attempt to build
a wider picture of overall breaker behavior. As the ANOVA results typically show, the age of the circuit
breaker does not influence behavior, even if the “old” breakers are included in the analysis. (See Table 16
and Table 24, where Rsq(adj) is always below 3% for all test variables, which can be considered
statistically unimportant.) Normalizing breaker performance to magnetic trip level therefore statistically
eliminates any difference in breaker performance, allowing both old and new breakers to be validly
combined together for analysis.
These reported findings and actions, however, are not in line with 2009 research work conducted at UL11
that showed that arc current tends to have current magnitudes approximately 80% of short-circuit current,
regardless of short-circuit current level. This was experimentally demonstrated to be true throughout the
full range of test currents used in that study (5A to 400A). Therefore, it is reasonable to speculate that
Franklin is referring to parallel arcing faults in some sampling of real-world systems, implying that short-
circuit currents are not expected to fall below 120A. However, UL Standard 1699 requires AFCI testing at
75A short-circuit current, which is typically achieved by the addition of lengths of NM cable (typically 200-
300 feet of 14 AWG cable). As the run length of branch service is not limited by Code, it is therefore
possible to experience parallel arcing faults at or below 100A. In very large residences, a home run of
200-300 feet or more is possible, especially if a circuit is located at a site very remote to the service
panel. At least, no part of the Code, nor any known trade practices exist which is intended to maintain a
minimum short-circuit current. Therefore, a blanket assumption that arcing faults are “never” below 200A
may result in safety concerns. While possibly a rare condition, insufficient data exists to determine a
reasonable lower limit to available fault current that applies to any circuit in any residence, business, or
other structure.
Effectiveness of Circuit Breakers in Mitigating Parallel Arcing Faults in the Home Run
page 50
Arcing Response
The concerns of nuisance tripping from “low magnetic trip breakers” resulted in further research15 and
eventual industry development of the arc fault circuit interrupter (AFCI), which introduced more intelligent
discrimination of arcing faults from other “normal” transients and loads. By the 1999 NEC AFCI
technology began to be required for bedrooms (with an effective date of 2002),16 expanding requirements
to most residential locations by the 2008 NEC. Performance of AFCIs is evaluated by UL Standard 1699,
evaluating reaction to arcing faults, as well as nuisance events such as transients and normal loads with
waveforms reminiscent of arcing. For arcing faults, one key criterion for AFCI performance is reacting
within eight half-cycles. This criterion appears to be a reasonable balance of AFCI ability to detect arcs,
minimizing nuisance tripping, and maximizing protection against fire. However, this criterion does not
appear to be directly tied to energy release and ignition modeling, at least not at its inception. However,
the ignition modeling conducted in this work (Table 10) shows that eight half-cycles gives reasonably
good protection from ignition, roughly 10% probability for up to 300A, and lower short-circuit currents at or
below 5% probability of ignition.
The empirical analysis of circuit breaker performance, which evaluates half-cycle count against the eight
half-cycle UL 1699 criterion, shows that a breaker will fail to mitigate the arc in eight half-cycles when the
fault current is below the magnetic trip level of the circuit breaker. However, once the fault current
exceeds the magnetic trip level of the circuit breaker, it is a near certainty that the circuit breaker will
mitigate the fault in less than eight half-cycles. Table 4 shows this statistically, where at 200A there is an
88% probability that a breaker will fail to trip in eight half-cycles, where at 300A, the probability drops to
0.01%. Considering that the average breaker magnetic trip level is 213A, this shows the difference in
performance below and above the magnetic trip level. Therefore, provided an available fault current can
be guaranteed to exceed the magnetic trip level, breakers can be effective at mitigating arcing faults.
The discussion now turns to the statistical analysis based on data normalized so that breaker
performance can be more accurately assessed between individual breakers that possess different
magnetic trip levels. As it has been shown that breaker reaction to arcing faults is critically dependent on
the magnetic trip level, normalization allows all breakers in this work to be compared operating in the
same regime. Figure 9 shows how this normalization makes breaker performance uniform among
manufacturers and age. This is also justified statistically, since only the short-circuit current was found to
be a test variable of significance governing breaker performance to arcing faults (Table 24). As the
empirical analysis had suggested, the statistical analysis concludes that the magnetic trip level needs to
be exceeded by a factor of 1.25 to mitigate the arc within eight half-cycles (Figure 16, left). Furthermore, a
breaker only has a 95% probability of tripping at all during an arcing event if the short-circuit current
equals the magnetic trip level of the circuit breaker. Probability of a breaker trip exceeds 99% only once
15 P. Boden et al., “Technology for Detecting and Monitoring Conditions that Could Cause Electrical Wiring System Fires” UL research report to the CPSC (Contract Number CPSC-C-94-1112), 1995. 16 NFPA 70, 1999 National Electrical Code, Section 210-12, Arc-Fault Circuit-Interrupter Protection.
Effectiveness of Circuit Breakers in Mitigating Parallel Arcing Faults in the Home Run
page 51
the short-circuit current exceeds the magnetic trip level by a factor of 1.25 (since the magnitude of an arc
typically is 80% of the short-circuit current). Therefore, the previous statement about breaker
effectiveness is further qualified by stating that breakers can be effective at mitigating arcing faults,
provided the available fault current can be guaranteed to exceed the magnetic trip level of the circuit
breaker by a factor of 1.25.
At this point in the analysis the circuit breaker performance is stated in general terms relative to the
magnetic trip level and available short-circuit currents of the circuit. The question of exactly what short-
circuit current can be expected has not yet been addressed. Assuming the available current at the panel
is large (with residential service short-circuit current typically limited to 5 kA by the public utility), available
current to the first receptacle in a circuit is primarily limited by the resistance of the cabling (assumed to
be 14 AWG NM cable in this work). Further assuming uniform resistivity of the cable, available current
therefore is governed by the length of the cable from the panel to the first receptacle (the “home run”).
Studies to evaluate the range of available fault current therefore attempt to investigate the statistical
distribution of home run length, or at minimum attempt to find the longest run to identify a lower bound on
short-circuit current. A study by Parks Associates17 sought to measure run lengths in homes during
construction. This study however underestimated the length of home runs by assuming that all run
lengths exceeding 50 feet were 50 feet. This had the effect of lowering the average run length and
artificially inflating the available short-circuit current. Therefore, these results are not useful in evaluating
the prevalence of extremely long run lengths, particularly those that may result in short circuit currents
below 266A (the mean magnetic trip value of new breakers times the 1.25 factor for arcing faults: 213A x
1.25). Assuming a typical value of 2.53 mΩ/ft for 14 AWG wire (at 25°C), approximately 179 fe et of
14 AWG cable would result in a 266A short-circuit current. This would translate to a fault located 90 feet
from the panel board. The maximum length of 50 feet artificially puts a lower bound of 475A on the short-
circuit current (again assuming 100 feet total circuit length, 120 Vrms voltage supply, and 14 AWG cable
for both hot and neutral conductors).
These results suggest therefore that provided a breaker’s magnetic trip level is matched to the impedance
of the home run, a breaker is expected to trip within the eight half-cycles required by UL 1699. This
suggests a relationship where wire run length, gauge, and magnetic trip level are combined into a
governing equation. A similar approach was reported by Packard,18 citing a maximum allowable home run
impedance (this was exhibited by a specific example assuming 12 AWG cable, and a 20 A breaker with a
magnetic trip level of 240 A). First, it is known from the experimental work that to exceed a 99%
probability that a breaker will trip on an arcing fault, the short-circuit current must exceed the magnetic trip
level of the circuit breaker by a factor of 1.25:
17 B. Ablondi, “AFCI Code Change Analysis Electrician’s Survey,” Presentation to AFCI Consortium, September 2009. 18 T. Packard, “Analysis of Circuit Breaker Protection of the Branch Circuit ‘Home Run’,” Code Panel submission by Hubbell Incorporated (Delaware), Cooper Wiring Devices, Leviton Manufacturing Company, and Pass & Seymour/Legrand.
Effectiveness of Circuit Breakers in Mitigating Parallel Arcing Faults in the Home Run
page 52
? k 1.25 (26)
Solving for Imag,
567l ?
.m (27)
The short-circuit current is related to the wire impedance and supply voltage by Ohm’s Law:
E]6i 5678 ∙ n (28)
The resistance R is governed by the resistivity of the cable:
n 2 (29)
where L is the length of the home run in feet and ρL is the resistivity of the cable in ohms/foot. The factor
of 2 is added to incorporate the resistance of the supply and return cables (this assumes the return path
is of the same wire gauge as the supply gauge, generally true for NM cable). Combining these equations
results in the inequality:
567l 0.4 ∙
op (30)
Since the magnetic trip of the circuit breaker may be an uncontrollable variable, a more convenient
relationship may be in terms of run length and wire gauge:
0.4 ∙
(31)
Therefore, to ensure protection from parallel faults in the NM cable from the circuit breaker, the wire
gauge and/or the run length is adjusted so that sufficient fault current is available anywhere in the run.
Note that the value for R in this inequality neglects any output impedance from the panel, which generally
is a reasonable approximation. However, if it is undesirable to make this assumption, Equation 31 can be
derived using a value for R that includes an additional term to incorporate the available current of the
panel:
n 2 0
(32)
where Ipssc is the available short circuit current at the panel. In this scenario, Equation 31 becomes:
Effectiveness of Circuit Breakers in Mitigating Parallel Arcing Faults in the Home Run
page 53
.
(33)
A verification of the formula shows that the allowable run length reduces to zero when Ipssc equals
1.25 · Imag, and the formula converges to Equation 31 when Ipssc becomes large relative to Imag.
Unless the magnetic trip level of the individual breaker is characterized, it is not typically a known value.
Therefore, though a more conservative approach, the statistical information as shown in Figure 8 can be
leveraged to determine the highest expected magnetic trip level for most newer breakers (manufactured
after the year 1995 or so). This approach is not recommended for older breakers, since it is known that
the magnetic trip level can vary considerably. In older installations, it would likely be necessary to
characterize the circuit breaker’s magnetic trip level, or replace the old breaker with a newer model. In the
case of a new breaker, it was found that the average magnetic trip level was 213 A with a standard
deviation of 33.2 A. To ensure that the available current exceeds the magnetic trip level of 99% of all
breakers in the field, a magnetic trip level of 299 A is used. (This is calculated using 2.576 standard
deviations, which corresponds to a 99% probability, added to the mean of 213 A.) In this instance, the
value for the home run impedance is the following:
0.4 ∙ 161Ω (34)
As the resistance of a cable will change with temperature, a worst-case scenario would be to assume this
maximum allowable impedance (161 mΩ) at the maximum operating temperature allowed for most
residential wiring (typically 90°C), since the leng th of cable will have its largest resistance at this
temperature. It is noted that cable resistance per unit length is usually listed in the literature at 25°C (room
temperature). Conversion between resistances can be accomplished using the following expression:
V rs
rt 1u 0 V2 u (35)
where R2 is the resistance at temperature T2, R1 is the resistance at temperature T1, and k is the
coefficient of resistance (for copper, k is equal to 234.5°C). Using this formula to solve for R2, the
equivalent resistance at 25°C can be determined to ensure the cable resistance will be equal to 161 mΩ
at 90°C:
25 rs
.A 1234.5 0 902 234.5 (36)
Solving for R2 gives a resistance of 128 mΩ at 25°C. Assuming 14 AWG wire ( ρL = 2.575 mΩ/foot at
25°C), this would suggest a maximum home run length L of 50 feet. This maximum value would be further
reduced if the output impedance of the panel is not much greater than the impedance of the run length.
Effectiveness of Circuit Breakers in Mitigating Parallel Arcing Faults in the Home Run
page 54
This inequality now sets conditions so that 99% of all breakers (assuming they are of the “new” type) will
have a 99% probability of magnetically tripping on a parallel arcing fault. Though this suggests a high
level of protection, significant energy is still being released as an arcing fault. Assuming that the home run
impedance was set so that the arcing fault was 300A, Table 10 shows that the probability of ignition for a
single half-cycle is estimated at 1.9 to 2.2 percent. Therefore, it is expected that in 98% of all parallel
arcing conditions mitigated in this way will not result in ignition of the insulation material. In the event that
additional half-cycles are allowed to pass before the circuit breaker trips, each additional half-cycle adds
roughly one additional percent to the probability of ignition. Therefore, provided the necessary conditions
described here apply, a home run and breaker can be matched so that it will trip on 99% of all parallel
arcing faults within a single half-cycle, resulting in a 2% probability of ignition.
Performing the same calculation for 20A breakers, and 99% trip at 349A (from Table 3):
0.4 ∙ wB 138Ω (37)
Assuming this as the maximum allowable resistance at 90C, the wire resistance at 25C is found using the
following equation:
25 rs
.w 1234.5 0 902 234.5 (38)
Solving for R2 gives a resistance of 110 mΩ at 25°C. Assuming 12 AWG wire ( ρL = 1.588 mΩ/foot at
25°C), this would suggest a maximum home run length L of 69 feet using 12 AWG NM cable.
A Note on the Probability of Protection The results in this work are based on multiple probability distributions of several key variables. To
maximize conservatism in results, a 99% confidence interval was used instead of the customary 95%
confidence interval. It is important to state that 100% protection is impossible from a statistical standpoint,
as 100% can only be approached asymptotically as the number of standard deviations above the mean
increases to infinity.
In the development of the formulae in this work, the worst-case operating conditions were assumed, using
90°C as the basis of calculating maximum run length . (As an example, though 300A is the 99%
confidence interval for the magnetic trip level of the breakers evaluated in this work, the calculated
maximum run length of 50 feet using this limit at 90°C results in approximately 375A of fault current at
25°C.) In typical practice, electrical wiring is s ized and de-rated typically for a maximum operating
temperature of 60°C. Therefore, maintaining the 90° C calculation basis adds a considerable margin of
safety over the calculated 99% confidence interval. In addition, maximum run length assumes the worst-
case scenario of a parallel arc fault at the furthest end of the home run. Therefore, 99% protection is
Effectiveness of Circuit Breakers in Mitigating Parallel Arcing Faults in the Home Run
page 55
calculated based on arcing at the worst-case location (at the end of the run), and operating at the worst-
case temperature (90°C for the entire run). It is h ighly likely that one or both of these situations will be
less severe, resulting in far greater than 99% protection.
As mentioned previously, due to the wide variation of older breakers (manufactured before 1990), the
statistical results based on the breaker magnetic trip data in this report are not applicable. However, if the
magnetic trip level (or statistical representation of a set of breakers) was known, the equations in the
report would still apply, and could be used to re-calculate a maximum run length.
Summary of Findings
The following observations are now made concerning an ability of a circuit breaker to mitigate a parallel
arcing fault in lieu of a panel-mounted AFCI:
• New 15 A circuit breakers show magnetic trip levels that are normally distributed around an
average value of 213 A, and a standard deviation of 33 A. This suggests that 95% of all 15 A
residential breakers will instantaneously trip at or above 278 A, and 99% of all breakers will
magnetically trip at or above 299 A. New 20 A circuit breakers showed a mean value of 202 A,
with 95% of all 20 A residential breakers instantaneously tripping at or above 314 A, and 99% of
all breakers magnetically tripping at or above 349 A.
• Arcing behavior (with respect to strike angle, peak current, etc.) is not influenced by the circuit
breaker itself. Therefore, the results in this work apply to all types of arcing, including carbonized
path and point contact arcing.
• A circuit breaker will give adequate protection from parallel arcing (as defined by UL 1699)
provided that the short-circuit current exceeds the magnetic trip level of the circuit breaker by a
factor of 1.25.
• A circuit breaker is expected to provide protection from a parallel arcing fault when the following
inequality is satisfied:
E]6i2 x 0.8567l 1
5yiiz
where L is the NM cable run length in feet, ρL is resistance of the conductor in ohms per foot, Vrms
is the circuit voltage, Ipssc is the available current at the panelboard, and Imag is the magnetic trip
level of the circuit breaker.
• Assuming a 15A, 120 Vrms circuit using 14AWG NM cable for the home run, and assuming that
the magnetic trip performance of the breaker in the circuit matches that found in this work, a new
circuit breaker will provide protection from a parallel arcing fault if the run length does not exceed
Effectiveness of Circuit Breakers in Mitigating Parallel Arcing Faults in the Home Run
page 56
50 feet. This assumes a maximum allowable operating temperature of 90°C. Assuming a 20A,
120 Vrms circuit using 12AWG NM cable for the home run, and assuming that the magnetic trip
performance of the breaker in the circuit matches that found in this work, a new circuit breaker will
provide protection from a parallel arcing fault if the run length does not exceed 69 feet. This again
assumes a maximum allowable operating temperature of 90°C.
• Assuming a 300 A fault current and satisfying the inequality above, the probability of ignition of
the cable during an arcing event is 2% if a circuit breaker trips in one half-cycle, this probability of
ignition increasing by 1% for each additional half-cycle of arcing.
Effectiveness of Circuit Breakers in Mitigating Parallel Arcing Faults in the Home Run
page 57
Appendix A: Analysis of Arcing Behavior
Prior to analyzing the behavior of circuit breakers in response to parallel arcing faults, it is desirable to
understand the influence of test variables on the generated arcing behavior. The goal in this section is to
determine whether arcing can be considered as an event independent of circuit breaker-related test
variables, or whether changes in arcing behavior need to be linked to both breaker test parameters and
breaker performance. An ability to prove statistical independence of arcing behavior from test parameters
will simplify the final analysis of circuit breaker performance during arcing events. This analysis is
conducted using the ANOVA method of analysis. Five key arcing attributes are analyzed here with
respect to several test variables. This information will determine whether all generated arcing is uniform
for all tests, or whether specific test variables alter arcing behavior.
Analysis of Normalized Peak Current
The peak current is defined in this study as the largest magnitude of current measured within each half-
cycle of the waveform. These points were collected automatically using LabVIEW-based software and
tabulated with corresponding variables, such as the half-cycle number, circuit breaker manufacturer, age
of the circuit breaker, etc. To allow for a useful comparison of data from all tests, a normalized peak
current was defined and calculated as:
)max(max 2
2
rms
peakpeak
peakI
I
I
II ⋅=≡
(39)
Three states of behavior were observed for peak current values: arcing behavior, non-arcing behavior,
and shorted. Each of these three modes of behavior was segregated by defining two current thresholds
relative to the short-circuit current Imax (Figure 27). A threshold of 20% Imax was defined as the minimum
for arcing behavior. Selection of this value can be considered somewhat arbitrary, and does not follow
what is defined in UL 1699 for minimum arcing (which is defined as 5% of Imax in the standard). However,
a very low value for the threshold, such as 5%, often would be within the large number of insignificant
events (very short-duration arcing, noise, etc.) and were not likely to contribute to the understanding of
the arcing behavior. At 20% Imax a very small percentage of data points were typically found and was a
convenient threshold for defining a threshold for arcing. As this was within a “long tail” of the probability
distribution function, moving this threshold ±10% in either direction would have a negligible effect on the
total number of points included and therefore not affect the analysis.
The relative influence of each variable on the normalized current was analyzed using ANOVA, and
evaluated according to the resulting adjusted R squared (Rsq(adj)) values. Table 11 summarizes the
degree of influence each independent variable has on the normalized peak current. Larger Rsq(adj) values
Effectiveness of Circuit Breakers in Mitigating Parallel Arcing Faults in the Home Run
page 58
mean that the variable has a larger influence on the peak current, with 100 meaning complete influence,
and 0 denoting no influence. Defining “significance” is difficult, but Rsq(adj) values exceeding 5 or 10
percent can be considered to have influence that needs to be evaluated further. As is seen in Table 11,
Imax and cycle number have Rsq(adj) values greater than 10%, and therefore require a more in-depth
assessment of their influence on the peak current (Figure 28). The average normalized current falls with
increased short-circuit current, a result that was also found in an earlier study.19 In this study it was also
found that the average normalized current is lower during the first few half-cycles, increasing to
approximately 0.9 of short-circuit current. The magnitude of normalized current gradually falls with time,
due to the heating of the wiring and therefore increase in the resistance of the circuit.
Figure 27. Representative probability distribution function for all peak current values from one series of tests, showing three modes of behavior: non-arcing (<20% Ipeak), arcing (20% < Ipeak < 92%-95%), and shorting (>92% to 95% Ipeak). From Ref. 19.
19 P.W. Brazis et al., “Synthetic Arc Generator for UL1699, Phase 2: Statistical Characterization of Arc Fault Behavior,” UL Internal Report, 2009.
Effectiveness of Circuit Breakers in Mitigating Parallel Arcing Faults in the Home Run
page 59
Table 11. Goodness-of-fit (R squared values from ANOVA) for identified independent variables influencing the value of normalized peak current during arcing events. N is number of data points used in each calculation of the R values. P-values are also given for each variable.20
Variable R-Sq (%) R-Sq (adj) (%) P N
Short-Circuit Current (Imax) 18.55 18.54 0.000 40212
Cycle Number 15.84 11.85 0.000 40212
Iteration Number 4.10 4.09 0.000 40212
Breaker Number 1.06 1.04 0.000 40212
Manufacturer 0.91 0.90 0.000 40212
Breaker Age 0.04 0.04 0.000 40212
Figure 28. Boxplots for (left) normalized current as a function of available current and (right) as a function of half-cycle number.
Analysis of Phase Data
This section analyzes the point in time within each half-cycle (measured in phase angle, as defined
previously in the section “Terminology”) arcing begins and ends, as well as the corresponding voltage
measured as these points in time. Strike and stop angle are detected automatically using LabVIEW
software that analyzes each arcing half-cycle of the current waveform, digitally filtered to include
components between 10 kHz and 100 kHz. (This is intended to be a high-pass signal, but in practice a
bandpass signal is used to minimize aliasing effects.) The point where this signal is at its highest
magnitude is recorded (in terms of phase angle, relative to the zero crossings of the voltage waveform).
Two maxima are recorded, one before the peak current value and one after, each assumed to be the
20 A P-value less than 0.05 indicates a statistically significant relationship. The P-value can be considered a measure of the signal-to-noise ratio for a given variable, with a low P-value suggesting that there is sufficient “resolution” to view the influence of one variable on another.
30020015010075
1.1
1.0
0.9
0.8
0.7
0.6
0.5
0.4
0.3
0.2
Current, A
Norm
aliz
ed C
urr
ent
2190
1850
1680
1560
1450
1310
1210
1110
101091
0810
710
610
510
410
310
210
11010
1.1
1.0
0.9
0.8
0.7
0.6
0.5
0.4
0.3
Half-Cycle Number
Norm
aliz
ed C
urr
ent
Boxplot of Normalized_Current
Effectiveness of Circuit Breakers in Mitigating Parallel Arcing Faults in the Home Run
page 60
strike and stop angles, respectively (Figure 29). Detection relies on the assumption that the discontinuity
in the current waveform caused by the strike and stop of the arcing event generates a large wideband
signal.
Figure 29. Schematic showing extraction of phase data. Strike and stop regions are assumed to be before and after Imax, respectively. In each region the maximum value is found in the high-pass filtered current waveform data (shown in red). Arrows mark the locations of the extracted strike and stop data. Note that often the voltage waveform (shown in blue) often drops at these points.
The strike and stop voltage are collected by recording the measured voltage magnitude at the same
instant in time as the strike and stop phase angle. Though in theory the strike voltage should be related to
the sine of the phase angle, in reality it varies depending on the impedance of the circuit and the arcing
event. Therefore, the recorded voltage will often be lower than the unloaded supply voltage:
Therefore, these two inequalities can be utilized for error checking of the phase data values, which may
be incorrect due to errors in detecting the strike and stop phase angle, or misalignment of the voltage and
current waveforms. Therefore, for analysis data are used only if both inequalities above are true (since a
voltage outside these ranges suggests an error is highly probable). Figure 30 shows the phase angle
Effectiveness of Circuit Breakers in Mitigating Parallel Arcing Faults in the Home Run
page 61
versus voltage relationship of the collected data and the effect of filtering. Eliminating only data with
impossible voltage values, i.e., voltages exceeding that of the open-circuit supply, also minimizes other
issues, including unexpectedly low voltages, improbably early stop phase angle, etc.
Figure 30. Effect of filtering on the phase data. (Left) Unfiltered data, showing various issues such as unexpectedly high and low voltage relative to phase angle and very early stop angles. (Right) Filtered data, keeping data only where both the strike and stop values fulfill the two inequalities in this section (Vpeak = 169.7V). It is noted that most abnormally low and early values are eliminated though setting only an upper bound on allowable voltage.
Table 12 through Table 15 show the correlation of strike/stop phase/voltage to the key test parameters. In
the case that the Rsq(adj) value was greater than 10%, a further analysis was conducted to determine the
relationship and whether the elevated R value requires further consideration. P values in nearly all cases
are equal to zero, suggesting that sufficient data were available to quantify the R value accurately.
Table 12. Goodness-of-fit (R squared values from ANOVA) for identified independent variables influencing the value of strike angle during arcing events. N is number of data points used in each calculation of the R values. P-values are also given for each variable.
Variable R-Sq (%) R-Sq (adj) (%) P N Cycle Number 19.88 12.70 0.000 22728 Short-Circuit Current (Imax) 0.77 0.75 0.000 22728 Breaker Magnetic Trip Level 0.74 0.69 0.000 22728 Iteration Number 0.43 0.42 0.000 22728 Breaker Number 0.36 0.33 0.000 22728 Manufacturer 0.18 0.17 0.000 22728 Breaker Age 0.01 0.00 0.199 22728
Effectiveness of Circuit Breakers in Mitigating Parallel Arcing Faults in the Home Run
page 62
Figure 31. Mean (crosshairs) and median (solid line) values of strike angle as a function of time. Despite an Rsq(adj) value of 12.86%, strike angle does not show a strong correlation with time, outside lower strike angle at the start of the arcing event (half-cycle < 50).
Table 13. Goodness-of-fit (R squared values from ANOVA) for identified independent variables influencing the value of stop angle during arcing events. N is number of data points used in each calculation of the R values. P-values are also given for each variable.
Variable R-Sq (%) R-Sq (adj) (%) P N Cycle Number 36.78 31.11 0.000 22728 Breaker Magnetic Trip Level 9.88 9.83 0.000 22728 Short-Circuit Current (Imax) 8.78 8.77 0.000 22728 Manufacturer 4.88 4.86 0.000 22728 Breaker Age 2.83 2.82 0.000 22728 Iteration Number 1.95 1.93 0.000 22728 Breaker Number 1.88 1.85 0.000 22728
2310
1770
1640
1530
1410
1310
1210
1110
101091
0810
710
610
510
410
310
210
11010
110
100
90
80
70
60
50
40
30
20
Half-Cycle Number
Str
ike A
ngle
(Deg)
Effectiveness of Circuit Breakers in Mitigating Parallel Arcing Faults in the Home Run
page 63
Figure 32. Mean (crosshairs) and median (solid line) values of stop angle as a function of time. The stop angle appears to decrease with time and settles on a stop angle of 110 to 120 degrees. Noisy data above 700 half-cycles is indicative of the reduced number of arcing data points.
Table 14. Goodness-of-fit (R squared values from ANOVA) for identified independent variables influencing the value of strike voltage during arcing events. N is number of data points used in each calculation of the R values. P-values are also given for each variable.
Variable R-Sq (%) R-Sq (adj) (%) P N Short-Circuit Current (Imax) 13.58 13.57 0.000 22728 Cycle Number 20.64 13.53 0.000 22728 Breaker Magnetic Trip Level 4.04 3.99 0.000 22728 Breaker Age 1.83 1.82 0.000 22728 Iteration Number 1.58 1.56 0.000 22728 Manufacturer 1.51 1.50 0.000 22728 Breaker Number 1.26 1.23 0.000 22728
2310
1770
1640
1530
1410
1310
1210
1110
101091
0810
710
610
510
410
310
210
11010
180
160
140
120
100
80
60
Half-Cycle Number
Sto
p A
ngle
(Deg)
Effectiveness of Circuit Breakers in Mitigating Parallel Arcing Faults in the Home Run
page 64
Figure 33. (Left) Mean (crosshairs) and median (solid line) values of strike voltage as a function of time. Strike voltage tends to be higher at the start of the arcing event, leveling off to approximately 75V. Noisy data above 700 half-cycles is indicative of the reduced number of arcing data points. (Right) Boxplot of strike voltage as a function of the short-circuit current. The boxplot suggests no strong correlation.
Table 15. Goodness-of-fit (R squared values from ANOVA) for identified independent variables influencing the value of stop voltage during arcing events. N is number of data points used in each calculation of the R values. P-values are also given for each variable.
Variable R-Sq (%) R-Sq (adj) (%) P N Cycle Number 27.31 20.80 0.000 22728 Short-Circuit Current (Imax) 3.04 3.03 0.000 22728 Breaker Magnetic Trip Level 1.39 1.34 0.000 22728 Breaker Number 0.57 0.54 0.000 22728 Manufacturer 0.52 0.51 0.000 22728 Iteration Number 0.41 0.39 0.000 22728 Breaker Age 0.01 0.01 0.135 22728
2310
1770
1640
1530
1410
1310
1210
1110
101091
0810
710
610
510
410
310
210
11010
175
150
125
100
75
50
Half-Cycle Number
Str
ike V
oltage
30020015010075
200
150
100
50
0
Short-Circuit Current (A)
Str
ike V
oltage
Effectiveness of Circuit Breakers in Mitigating Parallel Arcing Faults in the Home Run
page 65
Figure 34. Mean (crosshairs) and median (solid line) values of stop voltage as a function of time. Stop voltage tends to be lower at the start of the arcing event, leveling off to approximately 80V. Noisy data above 700 half-cycles is indicative of the reduced number of arcing data points.
Conclusion of Arcing Analysis
The adjusted Rsq values are summarized in Table 16. The analysis shows that arcing behavior is only
affected to some degree by changes in impedance of the circuit, with the most significant effect from
changes in wire impedance due to heating during the test. This change is embodied in the elevated R
values for cycle number, and reflected as well in Imax. A further investigation of this change shows that
much of the changes occur within the first 100 half-cycles of the arcing event, reaching steady-state
behavior as the event continues. This behavior was also observed in the prior UL study.19 No other test
variable, and more importantly no breaker-related test variable, had significant influence on the arcing
behavior, and therefore arcing events can be treated as independent of these variables. Therefore,
effects of manufacturer, breaker age, breaker position on breaker performance can be analyzed
independently of arcing key parameters. In this regard, it is justifiable to consider arcing only with respect
to the number and timeframe of arcing cycles, and will not require consideration of peak current, strike,
and stop data when analyzing breaker performance.
2310
1770
1640
1530
1410
1310
1210
1110
101091
0810
710
610
510
410
310
210
11010
120
110
100
90
80
70
60
50
40
30
Half-Cycle Number
Sto
p V
oltage
Effectiveness of Circuit Breakers in Mitigating Parallel Arcing Faults in the Home Run
page 66
Table 16. Summary of Rsq(adj) values for all tests (expressed by percentage), all variables in this work. S
top
Ang
le
Str
ike
Vol
tage
Nor
mal
ized
P
eak
Cur
rent
Sto
p V
olta
ge
Str
ike
Ang
le
Cycle Number 31.11 13.53 11.85 20.80 12.70 Short-Circuit Current (Imax) 8.77 13.57 18.54 3.03 0.75 Breaker Magnetic Trip Level
9.83 3.99 1.34 0.69
Breaker Number 1.85 1.23 1.04 0.54 0.33 Iteration Number 1.93 1.56 4.09 0.39 0.42 Manufacturer 4.86 1.50 0.90 0.51 0.17 Breaker Age 2.82 1.82 0.04 0.01 0.00
Applicability of Results to Point Contact Arcing
The testing used in this work focused on carbonized path arcing, using methods as described in UL 1699,
Section 40.4.14 This was shown in an earlier work19 to be statistically identical to the carbonized arc tests
described in UL 1699, Sections 40.2 and 40.3. However, that work showed a statistical difference in strike
voltage for point contact arcing tests (as described in UL 1699, Section 40.5). This difference was
characterized in a change in the probability distribution function describing the strike voltage, which
exhibited a lognormal distribution based on 180 degrees minus the strike voltage for Sections 40.2, 40.3,
and 40.4, while for Section 40.5 the lognormal distribution was based on the untransformed strike voltage (Figure 35).21 Table 17 shows an excerpt of the statistical distributions from that study, showing that the
strike voltage for the point contact arc is expected to be lower than that from the carbonized arc. No other
significant difference was identified in that study, with the resulting R values less than 5% for all other test
variables.
21 P.W. Brazis et al., “Synthetic Arc Generator for UL1699, Phase 2: Statistical Characterization of Arc Fault Behavior,” UL Internal Report, 2009, page 44.
≥ 40.0 30.0 –
39.9
25.0 –
29.9
20.0 –
24.9
15.0 –
19.9
10.0 –
14.9
5.00 –
9.99
1.00 –
4.99 < 1.00
Effectiveness of Circuit Breakers in Mitigating Parallel Arcing Faults in the Home Run
page 67
Figure 35. Example lognormal distribution fits to strike voltage data. (Left) Section 40.2 (carbonized path arcing), all data. (Right) Section 40.5 (point contact arcing), all data. Note change in y-axis definition, showing fit to a lognormal distribution using the untransformed strike voltage data (all data shown are filtered). From Figure 21, Ref. 21.
Table 17. Mean and standard deviations for strike voltage data by UL 1699 Section and Imax, derived from a normalized distribution xform. As can be seen, the expected strike voltage for the point contact arc is significantly less than that for the carbonized path arc. From Table 22, Ref. 21.
Effectiveness of Circuit Breakers in Mitigating Parallel Arcing Faults in the Home Run
page 68
Appendix B: Statistical Analysis of Circuit Breaker Performance
The following data were the results of the ANOVA analysis of circuit breaker performance to determine
the influence of key variables on different test parameters.
Table 18. Goodness-of-fit (R squared values from ANOVA) for identified independent variables influencing the normalized current during each test. N is number of data points used in each calculation of the R values. P-values are also given for each variable.
Variable R-Sq (%) R-Sq (adj) (%) P N Short-Circuit Current (Imax) 77.89 77.74 0.000 595 Breaker Trip 26.18 26.05 0.000 595 Breaker Magnetic Trip Level 20.68 18.91 0.000 595 Iteration Number 16.26 15.69 0.000 595 Manufacturer 9.71 9.26 0.000 595 Breaker Age 2.97 2.80 0.000 595 Breaker Number 2.02 0.85 0.100 595
Table 19. Goodness-of-fit (R squared values from ANOVA) for identified independent variables influencing the number of arc half-cycles during each test. N is number of data points used in each calculation of the R values. P-values are also given for each variable.
Variable R-Sq (%) R-Sq (adj) (%) P N Short-Circuit Current (Imax) 35.47 35.03 0.000 595 Iteration Number 6.11 5.47 0.000 595 Manufacturer 0.70 0.20 0.242 595 Breaker Magnetic Trip Level 1.61 0.00 0.731 595 Breaker Number 0.51 0.00 0.886 595 Breaker Age 0.16 0.00 0.329 595 Breaker Trip 0.08 0.00 0.500 595
Effectiveness of Circuit Breakers in Mitigating Parallel Arcing Faults in the Home Run
page 69
Table 20. Goodness-of-fit (R squared values from ANOVA) for identified independent variables influencing the number of shorting half-cycles during each test. N is number of data points used in each calculation of the R values. P-values are also given for each variable.
Variable R-Sq (%) R-Sq (adj) (%) P N Short-Circuit Current (Imax) 45.78 45.41 0.000 595 Breaker Trip 7.21 7.06 0.000 595 Iteration Number 5.65 5.01 0.000 595 Manufacturer 0.92 0.41 0.142 595 Breaker Magnetic Trip Level 2.22 0.03 0.437 595 Breaker Number 0.59 0.00 0.838 595 Breaker Age 0.07 0.00 0.520 595
Table 21. Goodness-of-fit (R squared values from ANOVA) for identified independent variables influencing the time of the last arcing half-cycle during each test. N is number of data points used in each calculation of the R values. P-values are also given for each variable.
Variable R-Sq (%) R-Sq (adj) (%) P N Short-Circuit Current (Imax) 21.58 21.04 0.000 595 Breaker Trip 2.70 2.54 0.000 595 Iteration Number 2.31 1.65 0.008 595 Breaker Magnetic Trip Level 1.02 0.00 0.945 595 Breaker Number 0.53 0.00 0.872 595 Manufacturer 0.28 0.00 0.643 595 Breaker Age 0.00 0.00 0.944 595
Table 22. Goodness-of-fit (R squared values from ANOVA) for identified independent variables influencing the time of the last shorting half-cycle during each test. N is number of data points used in each calculation of the R values. P-values are also given for each variable.
Variable R-Sq (%) R-Sq (adj) (%) P N Short-Circuit Current (Imax) 29.63 29.15 0.000 595 Iteration Number 4.57 3.92 0.000 595 Breaker Magnetic Trip Level 1.09 0.00 0.930 595 Breaker Number 0.67 0.00 0.784 595 Manufacturer 0.06 0.00 0.949 595 Breaker Trip 0.05 0.00 0.584 595 Breaker Age 0.00 0.00 0.984 595
Effectiveness of Circuit Breakers in Mitigating Parallel Arcing Faults in the Home Run
page 70
Table 23. Goodness-of-fit (R squared values from ANOVA) for identified independent variables influencing the time of circuit breaker trip during each test. N is number of data points used in each calculation of the R values. P-values are also given for each variable.
Variable R-Sq (%) R-Sq (adj) (%) P N Breaker Trip 95.05 95.04 0.000 595 Short-Circuit Current (Imax) 40.14 39.73 0.000 595 Breaker Magnetic Trip Level 17.19 15.34 0.000 595 Manufacturer 11.85 11.41 0.000 595 Iteration Number 8.92 8.30 0.000 595 Breaker Age 0.57 0.40 0.066 595 Breaker Number 0.79 0.00 0.702 595
Table 24. Summary of Rsq(adj) values for all tests (expressed by percentage), all variables in this work.
*Correlation due to range of testing: breakers with lower magnetic trip level trip more often in project than those with higher trip level. More meaningful to use normalized current for analysis.
†High correlation since normalized current is defined in terms of magnetic trip level and Imax. ††Correlation due to more iterations conducted at higher currents, fewer at lower currents. Correlation is negligible if broken down by
Imax, see Figure 36. This correlation reflects into all other variables, showing artificially elevated R values and therefore can be neglected.
‡Manufacturer D breakers had consistently lower magnetic trip levels than other manufacturers, this influenced normalized current and breaker trip data. Using the normalized current remedies this issue.
‡‡High correlation since breaker trip is calculated directly from the time of circuit breaker trip.
≥ 40.0 30.0 – 39.9
25.0 – 29.9
20.0 – 24.9
15.0 – 19.9
10.0 – 14.9
5.00 – 9.99
1.00 – 4.99
< 1.00
Effectiveness of Circuit Breakers in Mitigating Parallel Arcing Faults in the Home Run
page 71
Figure 36. Boxplot of normalized current as a function of iteration number and short-circuit current (Imax). This figure shows that the R value correlating iteration number to normalized current is an artifact of nonuniform testing (more iterations at higher current), and that the iteration itself does not influence the data.