Page 1
Effectiveness of loyalty programs across
Europe: an empirical analysis
Master Thesis (Research Master in Business: Marketing)
Nick Bombay – S475460
Version: 17 August 2016
Supervisor: prof. dr. M.G. Dekimpe
Second reader: prof. dr. E. Gijsbrechts
Page 2
2
Contents
Abstract ...................................................................................................................................... 3
1. Introduction ........................................................................................................................ 4
2. Loyalty programs ............................................................................................................... 5
2.1 Value of loyalty programs ........................................................................................... 5
2.2 Types of loyalty rewards ............................................................................................. 7
2.3 Effectiveness of loyalty programs ............................................................................... 9
2.3.1 Effects of loyalty programs .................................................................................. 9
2.3.2 Reward type and sector ...................................................................................... 12
2.3.3 Reward value and Profitability ........................................................................... 14
2.4 Differences in design ................................................................................................. 17
3. Empirical research ............................................................................................................ 20
3.1 Conceptual framework .............................................................................................. 22
3.2 Retail performance .................................................................................................... 23
3.3 Program characteristics .............................................................................................. 23
3.4 Retailer characteristics ............................................................................................... 24
3.5 Retail environment .................................................................................................... 25
3.6 Country characteristics .............................................................................................. 27
4. Data .................................................................................................................................. 28
4.1 Sample description .................................................................................................... 28
4.2 Variable description ................................................................................................... 30
5. Model ............................................................................................................................... 35
6. Results .............................................................................................................................. 36
6.1 Main effects ............................................................................................................... 36
6.2 Interaction effects ...................................................................................................... 38
6.3 Robustness checks ..................................................................................................... 39
7. Conclusion ........................................................................................................................ 40
7.1 Discussion .................................................................................................................. 40
7.2 Limitations ................................................................................................................. 42
References ................................................................................................................................ 44
Appendix .................................................................................................................................. 50
Page 3
3
Abstract
One of the vital issues of retailers is whether they should implement a loyalty program. Loyalty
programs might attract extra customers or make current customers spend more, but also come
with implementation and maintenance costs. We analyze the effectiveness of loyalty programs
by looking at more than 350 retail banners over 27 countries, while accounting for program
design, retail characteristics, retail environment, and the cultural environment. We find that
immediate rewards are preferred over delayed rewards, while cashback rewards are more
effective than product or service rewards. The success is also dependent on the competitive
environment: loyalty programs perform better in a lower concentrated market, with a high
private label share, where there are little to no competing loyalty programs. As for cultural
effects, operating a loyalty program is preferred in individualistic countries that have a long-
term orientation.
Keywords: Loyalty programs, retail performance, program design, FMCG, Europe.
Page 4
4
1. Introduction
A key factor of a firm’s success is its ability to establish and maintain a strong and loyal
consumer base. Loyal consumers are valuable for many reasons. They might buy products more
often (Jacoby & Chestnut 1978), could enable cross-over effects to other products or services,
increase favorable word-of-mouth (Webster 1994), and might be willing to pay a price premium
(Aaker 1996, Reichheld & Teal 2001). In addition, the cost of attracting switching consumers
is avoided, which is a lot higher than the cost of retaining existing ones (Rosenberg & Czepiel
1984). Finally, loyal consumers increase the brand’s competitive position (Dick & Basu 1994),
as a loyal consumer base gives more time to respond to competitors’ innovation, and presents
an entry barrier for new entrants (Aaker 1996).
Many companies have therefore decided to introduce loyalty programs, where members
receive special benefits, such as cash discounts or personalized rewards. There are more than
3.3 billion memberships in customer loyalty programs by U.S consumers, whereas there were
less than a billion memberships in 2000 (Colloquy 2015). These days, loyalty programs cover
various sectors (e.g., retailers, airlines and financial industries), although the retail industry
remains the largest, covering almost 40% of the market, with around 1.4 billion members. While
each household belongs to an average of 29 different loyalty programs, they are, on average,
only active in 12 (Colloquy 2015). By implementing a loyalty program, companies can increase
the value of existing customers (Dowling & Uncles 1997), while those customers enjoy
additional benefits (O’Brien & Jones 1995).
Empirical research has shown mixed evidence for the effectiveness of loyalty programs.
Various studies have found positive effects (Drèze & Hoch 1998, Lal & Bell 2003, Lewis 2004,
Taylor & Neslin 2005, Meyer-Waarden 2007), while others have found no or mixed effects
(Sharp & Sharp 1997, Mägi 2003, Dorotic, Fok, Verhoef & Bijmolt 2011). These studies differ
in loyalty program design, sector, and investigated countries, making it difficult to draw a
general conclusion about the effectiveness of loyalty programs. In addition, positive effects of
loyalty program membership might diminish after a while when direct competitors implement
similar loyalty programs (Dowling & Uncles 1997). Given the growth of loyalty memberships
in the last decade, this may become increasingly problematic.
The purpose of this study is to investigate the effect of loyalty programs on retail
performance. To test this, we apply our model to data of 358 retail banners over 27 European
countries. This study contributes to the current literature in several ways. First, we investigate
the programs of many different retailers, allowing us to identify differences in program design
Page 5
5
and retail characteristics. Second, we review the environment of the retailer within a country,
where we account for important competitive elements, such as the number of retailers managing
loyalty programs, market concentration, and hard discounter share. Finally, since various
countries are being analyzed, cultural characteristics, such as individualism and long-term
orientation are taken into consideration, enabling us to determine cultural factors that might
influence loyalty program success.
2. Loyalty programs
In order to increase brand loyalty, firms can design and adopt loyalty programs. Yi & Jeon
(2003, p230) define a loyalty program as “a marketing program that is designed to build
customer loyalty by providing incentives to profitable customers”. We will first discuss the
value of loyalty programs, for both firms and consumers. It is important to also look at the
perspective of the consumer, as it will determine whether a loyalty program is going to be
adopted or not, and how intensively it will be used. Then, the different types of loyalty rewards
will be summarized. After that, we will look at empirical findings that analyzed the
effectiveness of loyalty programs. Finally, empirical findings of differences in design will be
discussed.
2.1 Value of loyalty programs
There are a variety of objectives that firms announce as reasons to adopt a loyalty program
(Dowling & Uncles 1997). The most common reasons for implementing loyalty programs are
that they can be used to maintain sales, to increase the loyalty and value of existing customers,
or to gain cross-product benefits. However, it is likely that other reasons exist that firms
typically do not announce, such as differentiation from competition, creating an entry barrier,
or pre-empting a competitor from introducing a similar program. These loyalty programs are
often established keeping the 20/80 law in mind (Dowling & Uncles 1997, Yi & Jeon 2003).
Typically, 20% of the consumers take care of 80% of the revenues. It is therefore important to
maintain these 20% of heavy buyers, who are often the main target group of loyalty programs.
Here, loyalty programs are tightly linked to improving customer satisfaction. Customer
satisfaction can be divided in two segments, namely transaction-specific customer satisfaction
and cumulative customer satisfaction (Boulding et al. 1993). With transaction-specific
customer satisfaction, consumers evaluate the product or service right after the purchase and
Page 6
6
only for the specific product. Cumulative customer satisfaction however, is an overall
evaluation based on all the purchase and contact experience of a consumer with the company.
Cumulative customer satisfaction has been found to lead to profitability (Anderson, Fornell &
Lehmann 1994).
From a consumer’s perspective, O’Brien & Jones (1995) argue that there are five
important elements of loyalty programs that play a role in the adoption of a program. These five
elements are (1) cash value, (2) choice of redemption options, (3) aspirational value, (4)
relevance, and (5) convenience. First, cash value is the value of the reward that consumers
receive. There are various ways to measure this, such as the cash discount as a proportion of
the bought goods (e.g., 1% of spending). Depending on the reward, other measures might be
the cost to acquire the reward product, or the expected value of the product or service when
redeemed. Basically, for consumers, it is the value that they get back in return as a discount, or
the price of the product that they receive if they had to pay for it otherwise. The second element
is redemption choice, which is the degree of different reward choices for consumers. Of course,
in the case of a discount, there is no choice in reward. More choices are in general better, as
consumers might pick a reward that is tailored to their preferences (O’Brien & Jones 1995).
However, companies might prefer to mainly include products or services that they otherwise
need to dispose of, such as perishable products, or an airline ticket of a specific flight to make
sure the plane is full. Third, aspirational value is important for consumers. In contrast to
monetary value, aspirational value is not only limited to economic aspects, but also includes
psychological aspects. Consumers are likely to value a free holiday to a sunny destination over
a monthly discount of their electricity bill. Naturally, consumers differ in their preferences, so
adding different kinds of prestigious rewards is key here. The fourth element is relevance,
which refers to the relevance of the loyalty program. A program that requires bulk purchasing
and long accumulation to receive rewards, lacks relevance for a consumer that is just an
occasional buyer (Lewis 2004). Especially if each vendor has its own program, it might take
ages to earn a large reward for a specific program. The fifth and final element is the convenience
of the loyalty program. There are several ways to save for a loyalty program, such as loyalty
cards, stamps or coupons. Loyalty cards are in general very convenient (O’Malley 1998), since
both the consumer and the vendor barely have to spend any additional effort. Furthermore,
stamps or coupons might be more easily lost or damaged. On the other hand, stamps can give a
direct overview of your current accumulated points, whereas cards might only be checked
online or at a specific store. Selection and redemption of accumulated points also fall within
convenience of the program. High convenience means a lower threshold for consumers to start
Page 7
7
participating as well as a lower chance for them to defect (O’Brien & Jones 1995). Note that
sometimes a trade-off between these elements has to be made. Rewards with high aspirational
value are often also expensive rewards, which means a longer accumulation of points, and thus
less relevance for consumers. In addition, improving each element usually also increases the
costs of a program. While loyalty cards might be very convenient, and more redemption choices
are appreciated, maintenance costs of such elements will also be higher. There are very few
programs that score high on all five elements, although it heavily depends on the type of loyalty
program (e.g., loyalty card discounts do not have much choice redemption or aspirational
value). For companies, it is therefore important to compare the five elements of their program
to the targeted consumers’ alternative programs (O’Brien & Jones 1995).
2.2 Types of loyalty rewards
Both Dowling & Uncles (1997) and Yi & Jeon (2003) make a distinction between four main
types of loyalty rewards, based on the type and timing of the reward, which are summarized in
Table 1. First, there can be a direct or indirect type of reward. A direct reward means that there
is a direct link between the reward and the purchased product. An indirect reward however, can
be a completely different reward, unrelated to the purchased good or service. Second, the timing
of the reward can be immediate or delayed. With immediate timing, the consumer gets the
reward instantly at the end of purchase. On the other hand, a delayed reward typically rewards
consumers credits or points, with which they can redeem rewards at a later point in time.
An example of a direct immediate reward is an additional discount at the cash register
of a supermarket. The discount is on the purchased products, and is obtained right at the point
of purchase. In addition, this type of reward structure is usually open to all customers, and each
member receives the same discount, regardless of their purchase history. A direct delayed type
Table 1
Types of loyalty reward schemes
Timing of reward
Immediate Delayed
Type of
reward
Direct Retailer or brand promotions Frequent flyer clubs, coupons
& tokens
Indirect Other products & lotteries Multi-product frequent buyer
clubs (e.g., fly clubs)
Page 8
8
of reward could be the frequent-flyer clubs of airlines. While the type of reward is still tied to
the purchased product itself (e.g., discounts or free flights), consumers do not obtain enough
credits or points at a single purchase to already enjoy a reward. Rather, they have to save and
accumulate points over multiple purchases, after which they can typically select a larger reward.
Although these programs are often still open to all customers (Berman 2006), only frequent
users will actually benefit, as an occasional purchaser might never reach the required amount
of points for a reward. Next, an indirect immediate type of reward could, for example, be lottery
or scratch tickets. While the rewards are immediate after the point of purchase, the obtained
reward is unrelated to the purchased goods or services of the firm. As with a direct type, it is
open to all consumers, and all consumers receive equal rewards. Finally, there are rewards that
are both indirect and delayed, such as multi-product frequent buyer programs (e.g., fly clubs).
Here, the accumulated points can be used to receive products unrelated to the purchased product
or service. In addition to accumulated points, frequent purchasers might receive additional
benefits, such as for example access to a club lounge in the case of airlines. Furthermore,
frequent purchasers might get more points than occasional buyers, solely based on purchase
history. Since rewards are both delayed and unrelated to the bought product or service, there is
a possibility for vendors to team up and create a loyalty program together (multi-vendor loyalty
program). Consumers then only need one account for several vendors, and can still benefit from
an occasional purchase from one vendor when also buying regularly at others.
Each of the four described types has its own advantages, which might differ between a
consumer and company point of view (Dowling & Uncles 1997). Consumers would typically
prefer an immediate reward, as delayed rewards might never be collected or take more effort to
collect. Companies however, might prefer a delayed type of reward in order to stimulate
consumers’ loyalty and promote future purchases of their products or services. In addition,
firms might prefer a direct type of reward, since this will establish a direct link between their
product and the loyalty program. The five consumer loyalty program elements of O’Brien &
Jones (1995) also differ per type of loyalty reward. Immediate rewards are both relevant and
have high convenience, but typically score low on choice options or aspirational value. Indirect
type of rewards on the other hand, give a lot of potential for choice of redemption options, but
might not be relevant or convenient.
Berman (2006) differentiates between four types of loyalty programs, although slightly
different from the earlier discussed typology of Dowling & Uncles (1997) and Yi & Jeon
(2003), as it is based on information gathered by the firm. It is important to take the possibility
of information gathering into consideration, since this enables the analysis of consumer
Page 9
9
behavior and the targeting of specific consumer segments. The type 1 of Bernan (2006) is
typically a direct discount at the register, while consumers of a type 2 program receive a free
product or service after a certain number of purchases (e.g., a free car wash after 10 purchased
car washes). Both types are a direct type of reward (Dowling & Uncles 1997), which are open
to all customers, but where usually no or little information is gathered. It would be possible to
gather some demographic information for a type 1 loyalty program, but firms in this type
typically do not do so. In addition, clerks will swipe their own discount card if a member forgets
or does not have a card, since the discount is available for everyone. Type 3 programs are similar
to the earlier discussed delayed rewards. Consumers generally gather points, and firms have
information about consumer demographics as well as past purchases. Finally, with type 4
programs, consumers receive targeted offers and mailings based on the gathered info. These
firms can range from all previous discussed types, such as supermarkets and airlines. The most
important aspect of this type is that the gathered data of the loyalty program is being used to
target consumers. These targeted advertisements are based on purchase history and consumer
demographics, so not all consumers receive the same offers.
2.3 Effectiveness of loyalty programs
There has been mixed empirical evidence of loyalty program effectiveness. Because of these
opposing views, we will discuss several studies and their characteristics in order to determine
underlying differences. First, we will look at some studies that found positive effects of loyalty
programs, followed by several studies that did not find any effects, or found mixed results.
Next, the reward type and sectors of the different studies will be compared. Finally, we will
assess the profitability of loyalty programs where a positive effect has been found, as increased
firm revenue does not automatically indicate more profit.
2.3.1 Effects of loyalty programs
Various studies have been conducted on the success of loyalty programs. A summary of the
type of program, program span and found effects of these studies can be found in Table 2. First,
there is a clear distinction between temporary and permanent programs. Temporary programs
are promotions that run for a limited number of weeks (Drèze & Hoch 1998, Lal & Bell 2003)
or even months (Taylor & Neslin 2005). During this period, consumers typically collect points
or stamps based on the value of their purchases. Once they have accumulated enough,
consumers can redeem their rewards. The redemption can usually be done until a couple of
Page 10
10
weeks after the promotional period, to make sure consumers can still collect their reward. Both
Drèze & Hoch (1998) and Lal & Bell (2003) found a boost in sales due to the loyalty program
during this period. Taylor & Neslin (2005) add to these two studies by also investigating the
period after the loyalty program. Here, a positive effect was found on both short-term and long-
term sales, although the short-term effect was several times higher. The short-term effect can
be classified as point pressure (Taylor & Neslin 2005), where consumers feel the need to collect
points. The reason for this is that consumers want to take advantage of the opportunity they
receive, and take possible future rewards into account, influencing their current behavior.
Therefore, they might either purchase more products or are reluctant to switch to another
retailer. The long-term effect can be classified as the reward-behavior effect (Taylor & Neslin
2005), and consist of behavioral learning and a cognitive aspect. With behavioral learning,
rewarded loyal behavior continues to persist even after the end of the program. There is no
rational mental process for this, such as an increased liking of the product or the firm.
Consumers are basically conditioned for loyal behavior. From a cognitive point of view, long-
term sales can increase due to remembering the positive experience or due to higher satisfaction
of services that firms offer. All investigated temporary programs of Table 2 found an effect on
firm performance.
Table 2
Loyalty program effects, program type, span and data span
Study Effect found Program type Program span Data span
Drèze & Hoch (1998) Yes (temporary) Temporary 6 months 12 months
Lal & Bell (2003) Yes (temporary) Temporary 1.5-2 months 3-4 months
Lewis (2004) Yes (permanent) Permanent - 12 months
Taylor & Neslin (2005) Yes (permanent) Temporary 2 months 24 months
Leenheer et al. (2007) Yes (permanent) Permanent - 24 months
Meyer-Waarden (2007) Yes (permanent) Permanent - 36 months
Dorotic et al. (2014) Yes (permanent) Permanent - 42 months
Sharp & Sharp (1997) No Permanent - 5 months
Mägi (2003) No Permanent - 1 month
Dorotic et al. (2011) No Permanent - 33 months
Page 11
11
In addition to temporary programs, there are also permanent programs, on which the
literature is more divided. Permanent programs typically have a card with which the consumer
either saves points or which the consumer uses at the checkout to receive direct discounts. The
pressure of a limited time window for collecting points, and taking advantage of the current
situation, disappears in these type of programs. Both Sharp & Sharp (1997) and Mägi (2003)
find little support for permanent programs. Sharp & Sharp (1997) investigate the effect of a Fly
Buys loyalty program, where they compare the observed share of requirement with predictions
of a Dirichlet model. Only two out of six program participants showed excess loyalty. However,
in both cases, there was also an increase for non-members of the program, indicating that the
excess loyalty might have been obtained due to another factor. Despite the Fly Buy program
being a huge success in terms of users, barely any loyalty effects for the participating firms was
found. Mägi (2003) did not find a direct effect of a loyalty card on firm performance either.
However, having a loyalty card of the competing chain did show a negative effect on the metrics
of the primary store. These findings are interesting considering that in their sample, 18% had
no loyalty card, 33% had one card and 49% had at least two cards. Although Leenheer et al.
(2007) and Meyer-Waarden (2007) found a positive permanent effect of loyalty programs, the
strength of the effect decreased when consumers had more loyalty cards, or when the firms
were further away from the consumer. These effects might explain why the study of Mägi
(2003) did not find any impact, since many consumers in the dataset had several loyalty cards.
In a competitive market, copy-cat response of loyalty programs is expected. This will likely
result in only a short-term effect, which diminishes after competitors implement something
similar (Dowling & Uncles 1997). The study of Dorotic et al. (2011) investigated the impact of
both individual and joint promotions of several industries on issued loyalty points. With the
exception of individual promotions of department stores, none of the other industries had any
significant effect of promotions (neither individual nor joint promotions). Although the authors
did not investigate the direct effect of the loyalty card itself, having no effect of loyalty program
promotions is not a good sign. In a later study however, Dorotic, Fok, Verhoef & Bijmolt (2014)
did find an effect of a lasting multi-vendor loyalty program, although only around the time of
redeeming the reward.
Finally, some studies make a distinction between the types of consumers in loyalty
programs. Naturally, there are consumers who already spend more and might thus have a
stronger additional benefit due to the loyalty program. Lal & Bell (2003) analyze several
degrees of program rewards (e.g., full ham for spending $475, half ham for spending $325 or
Page 12
12
no reward when spending less). The authors also divide customers into three groups, based on
spending levels prior to the program (worst, better, and best). Compared to the non-redeeming
consumers of the same group, redeeming consumers spent more money at the retailer. Still,
consumers in the lower spending groups typically spent more compared to non-redeemers in
absolute value. The impact of the loyalty program was thus the greatest for the low spenders of
the supermarket, since they had to make far more extra effort to achieve the threshold in time.
In contrast, Lewis (2004) made a distinction between two types of consumer groups, namely a
less frequent heavy buyer group, and a group of more frequent purchasers with small orders.
Here, the group with large order sizes, which spends the most annually, reacted the strongest to
the loyalty program. The second segment, that spent less on average, did not show a significant
effect. A possible reason for this is that only 1% of the second segment reached the high
minimum threshold of the reward ($1,000). Therefore, consumers of this segment might not
react since the reward seems unlikely to get, which is in line with the relevance condition of
O’Brien & Jones (1995). Still, Leenheer et al. (2007) state that consumers that spend more are
likely to be the ones that make use of loyalty cards in the long run, since they expect to benefit
more from it. They indeed found that the effect of loyalty cards is up to seven times smaller
when correcting for this self-selection bias, although a positive effect is still present.
2.3.2 Reward type and sector
The types of rewards and sectors, which are summarized in Table 3, might also be factors that
can explain the different findings of loyalty program studies. First of all, many studies use data
from supermarkets to investigate the impact of loyalty programs. Note that these programs are
typically direct and delayed in these studies, although both do not necessarily have to be the
case. In Drèze & Hoch (1998) for example, spending $100 on baby products in one trip could
lead to an immediate redemption of the discount. Furthermore, they are direct in the sense that
the rewards of the program are linked with the supermarket itself. The reward is usually either
a product (e.g., a turkey in Taylor & Neslin 2005) or a direct discount (e.g., 15% off a purchase
in Lal & Bell 2003). Some of the studies reviewing permanent loyalty programs (e.g., Leenheer
et al. 2007) also have an immediate reward, where loyalty card holders receive a discount at the
cashier. Except for Mägi (2003), all the studies involving supermarkets show an impact of
loyalty programs on firm performance. As mentioned before, the contrasting findings of Mägi
(2003) might be due to the possession of several loyalty cards, diminishing the positive effect,
which might be typical for their investigated market (Sweden).
Page 13
13
Next, we discuss three studies that explore multi-vendor loyalty programs (Sharp &
Sharp 1997, Dorotic et al. 2011, and Dorotic et al. 2014), where several vendors team up and
have a program together. These are different from other programs since the redemption does
not necessarily take place at the firm where the products were bought. Dorotic et al. (2011)
analyzed individual and joint promotions of five different types of vendors (grocery,
electronics, DIY, fuel and department stores) with the same program. Only for department
stores, individual promotions had an effect on the amount of points issued, while none of the
joint promotions had an effect. One suggested reason for little or no effect of multi-vendor
loyalty programs might be that the delayed indirect type of rewards might be unattractive for
both consumers and firms (Dowling & Uncles 1997). Consumers prefer an immediate reward,
while firms prefer a direct link of the reward with their products, so that consumers make a
connection between the firm and the reward. Furthermore, since points in multi-vendor
programs can be accumulated in many stores, there might be little incentive for consumers to
stay loyal (Sharp & Sharp 1997). If acquisition of points is perceived easy, and consumers have
the feeling that they will eventually gather them anyway, chances of changing consumers’ loyal
Table 3
Loyalty program reward type, sector and country
Study Reward type Sector Country
Drèze & Hoch (1998) Direct, delayed Supermarket (baby
products)
US (Arizona)
Lal & Bell (2003) Direct, delayed Supermarket US (Mid-west)
Lewis (2004) Indirect, delayed Online retailer -
Taylor & Neslin
(2005)
Direct, delayed Supermarket US
Leenheer et al. (2007) Direct,
immediate/delayed
Supermarket The Netherlands
Meyer-Waarden
(2007)
Direct,
immediate/delayed
Supermarket France
Dorotic et al. (2014) Indirect, delayed Many (e.g., retail, petrol) The Netherlands
Sharp & Sharp (1997) Indirect, delayed Many (e.g., retail, petrol) Australia
Mägi (2003) Direct,
immediate/delayed
Supermarket Sweden
Dorotic et al. (2011) Indirect, delayed Many (e.g., retail, petrol) The Netherlands
Page 14
14
behavior decreases. It is possible that due to these effects, studies investigating multi-vendor
loyalty programs did not find strong positive effects of loyalty programs on firm performance.
Still, Dorotic et al. (2014) did find a significant effect for lasting multi-vendor programs, albeit
only around the period of reward redemption, when the benefits of saving points are top of mind
again. As soon as the consumer makes the decision to redeem the reward, the salience of the
loyalty program increases and encourages both pre-reward and post-reward behavior (i.e., more
issued loyalty points before and after reward redemption).
2.3.3 Reward value and Profitability
In order for a loyalty program to be a success, many consumers need to participate. As discussed
before, an important aspect of program adoption by consumers is the cash value of the reward
(O’Brien & Jones 1995). At the same time, for firms, the benefits should exceed the cost of the
program. In other words, the profitability of the program is critical. The reward value for
consumers, the performance metric and profitability for the investigated firms are all
summarized in Table 4. The reward value is not fixed for all studies. Most saving programs
have several types of rewards, which might differ in cash value. In addition, multi-vendor
programs consist of different chains which employ different policies (e.g., some might award 1
point per dollar, while others award 5 points per dollar). Finally, some studies do not report
how rewards are gathered, or consist of many chains which have different programs, which are
thus unknown. The presented values in Table 4 are therefore an overall indication of the loyalty
program reward value.
There are a lot of differences in terms of reward values. The cash value from the study
of Drèze & Hoch (1998) of 10% is quite high, especially when taking into account that the
demand for this category tends to be fixed (consumers do not feed babies more or need more
diapers). In contrast, the reward value of Sharp & Sharp (1997) is only around 1% and might
even be considerably lower for some chains. Overall, there seems to be a clear distinction
between direct, short-term loyalty programs with higher rewards, and longer term permanent
(multi-vendor) programs with lower rewards. However, cardholders of multi-vendor loyalty
program are often not familiar with the exact value. An additional survey of the program
investigated in Dorotic et al (2011) indicated that over 40% of the consumers were unaware or
wrong about the points-ratio value, which might be an additional explanation for the scarcely
found success in these type of programs.
Page 15
15
All studies that mentioned a positive effect of loyalty programs on firm performance
and investigated profitability as well, found that the loyalty program was worth the effort. The
program of Drèze & Hoch (1998) yielded a total increase of 25% in the baby category sales,
which resulted in a large profit. Note that if all customers had redeemed their gifts, an increase
of 67% was needed to reach break-even. However, less than 30% of the coupons were actually
turned in. Consumers either forgot to hand them in, or did not reach the required $100 of
purchases. Therefore, these type of programs can actually cost a lot less than initially expected.
In addition to the increase in category sales, store traffic during the program period increased
by 5%, and total grocery sales increased by 4%, indicating additional visits and cross-selling
effects of the program. Similarly, the loyalty program of Taylor & Neslin (2005) was mainly
found profitable (ROI of 400%) due to the low redemption rate of around 20%. The redemption
rates of the three studies of Lal and Bell (2003) on the other hand, were typically around 70-
80% for the higher spending consumer group, while only around 10-20% for the lower spending
group. Furthermore, both number of trips and basket size were higher for all redeemers,
although a stronger increase was present for lower spenders. This means that a chain might lose
some money on their best customers, since they redeem their reward most of the times while
just spending marginally more than non-redeemers. However, the low redemption rate of low
Table 4
Loyalty program reward value, performance metric and profitability
Study Reward value Performance metric Profitability
Drèze & Hoch (1998) 10% Category sales (+25%) Yes ($209k)
Lal & Bell (2003) 5% Sales (+$60-$150) Yes ($150k)
Lewis (2004) 1-2% Retention -
Taylor & Neslin
(2005)
- ($5 turkey) Sales (+$20) Yes ($5 per
consumer)
Leenheer et al. (2007) - (many retailers) Share of wallet (+2-6%) Yes (€90-€240 per
consumer per year)
Meyer-Waarden
(2007)
- (many retailers) Share of wallet (+8%),
defection (–20-30%)
-
Dorotic et al. (2014) - (many retailers) Loyalty points issued -
Sharp & Sharp (1997) 0.5-2% Retention -
Mägi (2003) - (many retailers) Share of wallet & visit -
Dorotic et al. (2011) - (many retailers) Loyalty points issued -
Page 16
16
spending consumers together with the high sales increase, makes this group very profitable. In
total, the program was estimated to be profitable. Finally, permanent loyalty programs, studied
in Leenheer et al. (2007), were also found profitable. All seven explored chains were estimated
to have a profit of between €90 and €240 per consumer per year.
Most of the profitability calculations of the investigated studies are approximations and
do not cover all costs (e.g., calculations of Lal & Bell 2003 did not account for overhead).
However, not all benefits might be included either. Some benefits cannot directly be expressed
in monetary values, such as the value of consumer information or other competitive advantages.
Consumer purchase data can be used to target specific groups that are expected to react (Berman
2006). As for competitive advantages, Bolton, Kannan & Bramlett (2000) argue that consumers
who are part of loyalty programs experience the full spectrum of services, which might also
include less favorable experiences. However, consumers of the loyalty program often overlook
the negative parts of the services (e.g., less quality compared to the competitors). Since a loyalty
program gives consumers a feeling of advantage, it makes poor evaluations less important for
the focal firm compared to the competition. Consumers thus still feel like having a good price-
to-quality ratio due to the loyalty program, which prevents them from switching to an
objectively better firm.
Finally, note that we have to be cautious in interpreting the general effectiveness of
programs for two reasons. First, only a small number of studies are discussed here. Considering
the examined studies vary on many points (such as design, measurement, sector and reward
type), it becomes increasingly difficult to draw valid general conclusions. Second, there is a
danger of publication bias, where negative or non-significant results are less likely to be
published, creating a problem for meta-analysis. Thornton & Lee (2000) name five possible
causes for publication bias. First, bias might arise due to design of studies. For example, larger
studies with more data have a higher probability of finding at least some significant results.
Second, bias is created by researchers, when deciding not to submit results, which is found to
be 10 times more likely when not having positive significant results (Begg & Berlin 1988).
Third, bias might arise due to the fact that negative studies are rejected more often by journals
(Smart 1964). Fourth, sponsorship or funding of a study might prevent publication of certain
undesirable results. Finally, bias can be created from design of reviews and meta-analysis, as
published research can systematically differ from unpublished research (Mosteller & Colditz
1996). Considering only published studies are compared in this section, many of these causes
form a threat for fair comparison. We should therefore interpret these studies cautiously.
Page 17
17
2.4 Differences in design
Besides studies investigating the effectiveness of the program, there is also a stream of literature
that explores differences in loyalty program structure and rewards. Kivetz & Simonson (2002)
conducted various studies with regard to differences between luxury and necessity rewards.
Luxury rewards are defined as pleasurable products or services, which are not really necessary
(e.g., spa or massage). Necessary products should be something practical, that a consumer buys
for a specific function or task in their life (e.g., groceries). Luxury rewards are closely related
to aspirational value mentioned in O’Brien & Jones (1995), where nicer rewards give
consumers an additional incentive to join a loyalty program. First, Kivetz & Simonson (2002)
found that the program requirement (i.e. the threshold for getting a reward) had an effect on
choice between rewards. When the program requirement increased, the likelihood of choosing
the necessary product significantly decreased, while there was no effect for the luxury reward.
Second, guilt was found to play a moderating role on the effect of preferred rewards. Consumers
with higher feeling of guilt had a greater preference for luxury rewards when the program
requirements increased. The reasoning behind this is that the increased effort that consumers
have to make in the high requirement condition removes some of the guilt that consumers might
have towards luxury rewards. Finally, the shift towards luxury rewards in the high requirement
programs was stronger for work-related consumption. For pleasure-related consumption, no
changes in proportion of luxury rewards were found. Note that all studies were experiments
where consumers indicated their preferences for rewards, which might not reflect actual
behavior. Melnyk & Bijmolt (2015) make a different distinction between types of rewards,
namely between monetary and non-monetary elements. Monetary elements consist of savings
and discounts. Non-monetary elements consist of discrimination, which is the differentiation
between members and non-members (e.g., member-only events), and customization, which is
the degree to which a firm treats individuals different. With non-monetary elements, only
discrimination had a significant positive effect on customer loyalty, while none of the monetary
elements had any impact at all. Loyalty in this study was also measured attitudinally (i.e.,
consumers were asked if they were more likely to stay and spend money at the focal company).
Successful design of loyalty programs might also depend on consumer characteristics.
Kivetz & Simonson (2003) further investigated program requirements when looking at
idiosyncratic fit. The authors argue that consumers know some kind of reference effort of the
average consumer. When their individual effort is perceived lower than that of the average
individual, there is an idiosyncratic fit and the loyalty program becomes more attractive to
Page 18
18
adopt. This is tightly linked to the relevance element found in O’Brien & Jones (1995). Kivetz
& Simonson (2003) indeed find that consumers with idiosyncratic fit (e.g., living close to a
store) are more likely to adopt the program. In addition, the difference becomes larger with a
higher program requirement, since consumers then have an extra strong feeling of advantage
over the average consumer. Changing program requirements can be quite important for firms.
For consumers, increasing the requirement might reduce the relevance of the program (O’Brien
& Jones 1995). However, increasing the requirements will decrease the number of consumers
redeeming the rewards, as not everyone gets to the required threshold, and thus saves cost. Since
it is mainly due to low redemption that loyalty programs are profitable (Drèze & Hoch 1998,
Taylor & Neslin 2005), increasing the program requirements might be a viable strategy for
firms to enjoy some increased sales while keeping costs low. In addition to perceived effort and
closeness of the consumer, gender also plays a role. Melnyk & Osselaer (2012) found that men
respond better to loyalty programs that emphasize status (e.g., gold membership), when it is
visible to others, since status is a more desirable characteristic for men. Women, on the other
hand, respond better to loyalty programs that emphasize personalization (e.g., specialized gift
cards), but only when less visible to others. Melnyk & Bijmolt (2015) also included consumer
characteristics in their analysis and found that consumers with higher incomes, education, and
price sensitivity appreciated loyalty programs more. As for age, the middle age group (between
34 and 55) was least responsive to loyalty programs, which the authors explain due to the busy
nature of this period in their lives (e.g., establishing career, taking care of children).
Additionally, the endowed progress effect can play a role in the success of loyalty
programs. With the endowed progress effect, consumers exhibit greater persistence when
getting close to achieving their goal. An experiment of Nunes & Drèze (2006) compared loyalty
cards with some initial progress (2 out of 10 stamps) to empty cards (8 stamps needed) and
found that the commitment of consumers to finish the program and redeem the reward was
higher for consumers with progressed cards. In addition, time between purchases became
significantly less as soon as the cards were closer to completion. It can thus be interesting for
firms to issue some initial points or stamps to encourage the endowed progress effect of
consumers. Moreover, the program requirements should be relatively low, as all consumers
seem to increase purchases when they are getting close to the reward. This would be in contrast
with Kivetz & Simonson (2003), who argue that program requirements should be higher for
consumers who have an idiosyncratic fit over the average consumer, and with Melnyk &
Bijmolt (2015), who state that discrimination between loyalty program members and non-
members has a positive effect on loyalty.
Page 19
19
Four different types of loyalty programs for a soft drink are compared by Roehm, Pullins
& Roehm (2002). These loyalty programs differed in cue-compatibility (related to the brand or
not) and in tangibility (product or website). They found that cue-compatible intangible
programs had the strongest effect on associations with the brand after the program. The cue-
compatibility is similar to the direct and indirect reward types of Dowling & Uncles (1997),
and seems to confirm that a reward with a direct link to the brand is more favorable.
Interestingly, an intangible incentive in the program performed better for positive associations
of the brand after the program. Although consumers might like a tangible incentive, they will
have the positive association linked to the product reward rather than the brand, which thus
disappears after the program ends (Roehm, Pullins & Roehm 2002). Finally, the effects were
mainly present for consumers that had a limited amount of associations before the program.
Consumers who already had a lot of positive associations with the brand did not improve much
with any program, which might be due to a ceiling effect. Even though loyalty programs are
often aimed at improving the relationship with the existing customers, it does not necessarily
mean that these existing customers already have a strong positive association with the brand
that cannot be improved. Yi & Jeon (2003) build on the four different reward types of Dowling
& Uncles (1997), and test the four types of rewards on the value perception of the program. In
addition, they estimate the effect of involvement as moderator on these types of rewards. In the
high-involvement situation, value perception was significantly higher for direct rewards than
for indirect rewards. Consumers tend to pay attention to the value of the product when they are
highly involved, which makes direct rewards favorable. However, no difference was found
between immediate and delayed rewards. Hence, it does not seem to matter for consumers when
they are getting the reward, as long as they receive it. The low involvement situation showed
exactly the opposite results. There was no significant difference between direct and indirect
rewards, but consumers preferred to have an immediate reward over a delayed one. Since
consumers are not involved with the product, it seems that they do not care as much what kind
of reward they receive, but do prefer to have it as soon as possible. Hence, firms with low
involvement products should mainly focus on direct discounts, while firms with high
involvement products should issue rewards that are related to the products that they are selling.
The difference between price discounts and reward point promotions is also related to
the distinction between immediate and delayed rewards. Price discounts are usually used as
immediate rewards, while delayed rewards are typically gathered by using a reward point
system. Zhang & Breugelmans (2012) conducted an empirical investigation on a retailer, where
the type of program changed from one with price discounts towards one with reward point
Page 20
20
promotions. The reaction on the structure change was different for loyalty program members
than for non-members. For current members, the spending slightly decreased, but the change
also attracted consumers who were not a member before. The sales of these new program
members increased considerably, resulting in a total positive effect. In addition, the loyalty
program members reacted more strongly to promotions that issued extra points than to
promotions of a discount rate. There might be multiple reasons for this effect. The reward point
promotion might remind consumers of the loyalty program benefits they receive, and thus
stimulates the sales of the given promotion (Zhang & Breugelmans 2012). Another argument
could be that consumers often have trouble translating the reward points into monetary value,
and might therefore overestimate the benefits they receive from the promotion (Dorotic et al.
2011). All in all, the use of a reward point promotion system seems to be good, as long as it is
complemented with regular promotions to fully utilize the benefits of this system. This is in line
with Leenheer et al. (2007), who found that both an increase in saving and discount rates
significantly stimulated households to participate in the loyalty program, wherein the value
increase of saving rates were significantly higher than those of discount rates.
3. Empirical research
Previous literature is divided on the effect of loyalty programs. Where some studies find a
positive effect (Taylor & Neslin 2005, Leenheer et al. 2007), others did not find any effect
(Sharp & Sharp 1997, Mägi 2003). However, many of the studies focused on one lasting
program, or several temporary programs, within a single firm. While this gives some in-depth
information about that individual firm, it becomes more difficult to generalize the settings of
that firm, for a variety of reasons. First, there might some impact of the competitive
environment of a firm that influences the effectiveness of a loyalty program. The few studies
that did investigate several firms within a country, did indeed find that the competitive setting
matters, such as the negative effect of the number of competitive loyalty program memberships
(Meyer-Waarden 2007, Leenheer et al 2007). Second, previous studies (e.g., Lal & Bell 2003,
Taylor & Neslin 2005) were limited to a specific country, or even the region of a country.
Similar to the limitations of an individual firm, there might be several cultural characteristics
driving the success of loyalty programs. Finally, the analysis of differences in loyalty program
design is limited in previous literature. When only looking at a specific or just a few retailers,
no differences in program design can be identified. An exception is the study of Zhang &
Breugelmans (2012), who analyzed a retailer that switched from an immediate price discount
Page 21
21
design to a point system design. However, this was again limited to one retailer, and the
effectiveness might be determined by other external influences. In addition, some external
changes might be present at the same time as the change of the loyalty program, making it
difficult to fully attribute causation to the change in loyalty program design.
All in all, the current literature lacks a broader scope, where loyalty programs over
several firms, over several countries are investigated. The central question still remains whether
loyalty programs are effective and improve retail performance. In this study however, many
external determinants, which can play a role in loyalty program success, will be included and
controlled for. To assess the loyalty program effectiveness empirically, we focus on the
supermarket sector. Supermarkets follow the so called always-a-share model, where all
consumers make repeating purchases and can easily switch their purchasing to another firm
(Jackson 1995). Consumers often share their purchases across multiple suppliers, although they
often have one dominating focal store (East, Hammond, Harris & Lomax 2000). Since
consumers tend to be familiar with several retailers and have low switching costs, it is appealing
for retailers to attract customers with, for example, a loyalty program, making this an interesting
market for our study.
In addition, loyalty programs are popular with the supermarket industry, as most
consumers have enrolled in at least one program. In the UK, for example, a survey revealed that
only 15% of consumers do not have a supermarket loyalty card (Statista 2015). Most consumers
have multiple cards, as 66% of the respondents have a Tesco club card and 52% of the
respondents have a Sainsbury card. Furthermore, some supermarket chains are operating in
various countries, differing in loyalty program strategies between them, which can lead to
interesting insights. Finally, the data availability of the supermarket industry is high, also across
countries, allowing us to investigate many different retailers.
Page 22
22
3.1 Conceptual framework
We want to investigate whether having a loyalty program or card improves retail performance.
However, the success of a loyalty program might be dependent on different elements, such as
program characteristics, retail characteristics, characteristics of the retail environment, and
country characteristics. First, program characteristics can play a role in loyalty program
success, as consumers might prefer some types of programs over others. Second, retail
characteristics can play a role. Loyalty programs can fit better with some types of retailers.
Third, retail environment might influence loyalty program effectiveness. In a more competitive
or mature environment, introducing a loyalty program could show different results than in a
less competitive or newer market. Finally, loyalty program effectiveness might depend on
cultural characteristics. Cultural components of a country can affect whether consumers accept
and take part in loyalty programs. Figure 1 shows our conceptual framework. In the following
sections, we will discuss and develop hypotheses for retail performance, and each of the factors
within the broader sets of program characteristics, retail characteristics, retail environment, and
cultural characteristics in more detail.
Figure 1
Conceptual framework
Page 23
23
3.2 Retail performance
Naturally, there are many reasons why companies like to introduce a loyalty program, such as
enhancing existing customer value, increasing cross-over effects and achieving a better
competitive position (Dowling & Uncles 1997). However, all these factors have a main end
goal in common for retailers, namely, they are meant to increase retail performance.
Retail performance. As discussed before, not all studies point in the same direction,
although many of them find a positive effect of loyalty programs (Drèze & Hoch 1998, Lal &
Bell 2003, Lewis 2004, Taylor & Neslin 2005). More specifically, when investigating long-
term loyalty programs, several studies found an effect in the supermarket sector (Leenheer et al
2007, Meyer-Waarden 2007). The only study that did not find a convincing effect of loyalty
programs in supermarkets is the study of Mägi (2003). However, this study had a relatively
short data span (one month), and was set in a different market (Sweden), where the average
consumer had several loyalty cards. Considering we will control for such elements, and focus
on the supermarket industry, we hypothesize:
H1: Having a loyalty program will improve retail performance.
3.3 Program characteristics
Whether a loyalty program is effective in increasing retail performance can depend on the
program design or characteristics. Here, we further look into (1) program timing, and (2)
program reward.
Program timing. There are two main types of reward timing, namely immediate rewards
and delayed rewards (Dowling & Uncles 1997, Yi & Jeon 2003). From a consumer point of
view, an immediate reward type is preferred, as consumers might not reach the desired saving
threshold for delayed rewards, or might forget to redeem delayed rewards. In addition,
immediate rewards are often linked to products of the retailer itself (e.g., discounts of the
product), through which a positive link will be established between the reward and the retailer
(Dowling & Uncles 1997). This positive link can lead to reward-behavior effects, where
consumers persist in their behavior (Taylor & Neslin 2005). Finally, immediate rewards are
both relevant and of high convenience, which further increases consumer adoption of the
program (O’Brien & Jones 1995). We thus hypothesize:
Page 24
24
H2: The effectiveness of having a loyalty program will be higher with an immediate reward
type than with a delayed reward type.
Program reward. Next, there are several type of rewards possible. Some loyalty
programs reward consumers with a proportion of their spending values. With this kind of
program, consumers typically receive their accumulated value as a monthly deposit on their
bank account (i.e., cashbacks). Other programs however, implement some kind of point system,
with which free products or services can be obtained. Similar as with programs with immediate
timing, cash rewards are both relevant and convenient for the consumer (O’Brien & Jones
1995). Free products or services however, might prevent adoption if the program lacks
interesting reward choices. We therefore hypothesize:
H3: The effectiveness of having a loyalty program will be higher for programs that reward
cashbacks than for programs that reward products or services.
3.4 Retailer characteristics
Besides the program characteristics, the retailer’s own characteristics can have an effect on
loyalty program success. In this section, we consider two of these characteristics: (1) price
format and (2) retail format.
Price format. There are two main types of price formats, namely a high-low (Hi-Lo)
format, or an everyday low price (EDLP) format (Hoch, Dreze & Purk 1994). In the case of a
Hi-Lo format, retailers typically charge higher prices on a regular basis, but frequently discount
products for extra low prices. With EDLP, on the other hand, the retailers charge a lower overall
price, with little or no temporary discounts. While both formats can use a loyalty program to
save a certain amount of points based on spending levels, Hi-Lo formats can make more easily
use of additional promotional options, such as cash discounts or increased issued points for
advertised products. In addition, we can look at the fit and cue consistency of price formats and
loyalty programs. Cue consistency theory suggests that various sources of information are
perceived more useful when they present corroborating information than when they present
contrasting information (Miyazaki, Grewal & Goodstein 2005). An example is the cause-related
marketing strategy (e.g., charity support), which has a better effect on consumers’ evaluation
when they perceive a high fit between the firm and the charity cause (Barone, Norman &
Miyazaki 2007). Retailers with a Hi-Lo strategy tend to focus more on image and offer a higher
service level (Lal & Rao 1997, Gauri, Trivedi & Grewal 2008). A loyalty program can be seen
Page 25
25
as an extra service effort of the retailer towards the consumer, and is therefore consistent with
the strategy of a Hi-Lo format. Given the higher fit and more diverse options for a Hi-Lo format,
we hypothesize the following:
H4: The effectiveness of having a loyalty program will be higher for a Hi-Lo format than for
an EDLP format.
Retail format. The retail format refers to the type of format a retailer has, where we
distinguish between a supermarket, hypermarket, and hard-discount store. A supermarket’s
main focus is on food products, although it often has some additional household products.
Hypermarkets have a far higher diversity of brands of food products, and often include products
that normally are found in department stores. Hard discounters offer similar products as
supermarkets, but focus more on price rather than service, display or assortment width. Since
hard discounters mainly focus on price (Van Heerde, Gijsbrechts & Pauwels 2008), they have
lower service levels than supermarkets or hypermarkets. Similar to the price format,
supermarkets and hypermarkets will have a higher fit with a loyalty program as additional
service. We therefore hypothesize:
H5: The effectiveness of having a loyalty program will be higher for supermarkets and
hypermarkets than for hard-discounters.
3.5 Retail environment
The retail environment consists of influences from within the market of a retailer that can affect
the success of loyalty programs. Here, we further look at (1) loyalty program share, (2) hard
discounter share, (3) private label share, and (4) retail concentration.
Loyalty program share. Introducing a loyalty program can improve a retailer’s
performance. In addition, it enables a retailer to increase its competitive position by
differentiating themselves, by offering something unique that complements existing services
(Thomson, Strickland & Gamble 2009). The essence of a differentiation strategy is to be unique
in a way that is most valuable for consumers, preferably in such a degree that it is hard to copy
by competitors, so that the advantage can be maintained. However, when many competitors
deploy similar programs, the initial advantage of a loyalty program may disappear (Dowling &
Uncles 1997). Both Leenheer et al (2007) and Meyer-Waarden (2007) found that the positive
effect of loyalty programs is lower when consumers have multiple loyalty cards. Mägi (2003)
Page 26
26
did not find any effect of a loyalty card in a market where the majority of the consumers had at
least two cards. As previous literature clearly shows a relationship between the number of
loyalty programs and their success, we hypothesize the following:
H6: The effectiveness of having a loyalty program will be lower when a higher proportion
of competitors operates a program than when a lower proportion of competitors operates
a program.
Hard discounter share. Hard discounters are retail formats with a high operational
efficiency and lower prices, which often put pressure on traditional retailers (Van Heerde,
Gijsbrechts & Pauwels 2008). However, Cleeren, Verboven, Dekimpe & Gielens (2010) found
that the first two introduced discounters have no significant impact on supermarkets’
performance, since they are still distinct enough from these traditional retailers. Nevertheless,
when more hard discounters enter the market, traditional supermarkets will start to feel
competitive pressure. Zhu, Singh & Dukes (2006) argue that mainstream retailers can avoid the
negative effect of hard discounters by focusing on the more price-insensitive segments. Along
the same line, traditional retailers can target other factors that draw consumers away from the
strong price focus that hard discounters introduce, such as the launch of a loyalty program with
additional benefits. In case of more discounters, the distinguishing feature of the loyalty
program may become more pronounced. This leads to the following hypothesis:
H7: The effectiveness of having a loyalty program will be higher with a higher hard
discounter share than with a lower hard discounter share.
Private label share. Private labels are products that are unique to a specific retailer.
There are several advantages for retailers to introduce a private label, such as a higher profit
margin and the ability to distinguish themselves from competitors (Collins-Dodd & Lindley
2003, Steiner 2004). However, it was found that consumers are more loyal to the price savings
and private labels in general rather than to the retailer that is offering them (Ailawadi, Pauwels
& Steenkamp 2008, Dawes & Nenycz-Thiel 2013). Therefore, the positive effect of private
labels diminishes when other retailers introduce them as well. Introducing a loyalty program
can increase the differentiation of retailers again. In the case of a low private label share, a few
retailers are already differentiated and additional differentiation by the use of loyalty programs
may be less needed and potentially has less effect. We therefore hypothesize:
H8: The effectiveness of having a loyalty program will be higher with a higher private label
share than with a lower private label share.
Page 27
27
Retail concentration. Retail concentration refers to the market-share captured by the top
firms of a market, which therefore reflects the degree of competition within that market
(Dobson, Waterson & Davies 2003). A higher concentration indicates a less competitive
environment, as a high retail concentration means a low number of large retailers (Keller,
Dekimpe & Geyskens 2016). With a low retail concentration on the other hand, there are a large
number of small competitors that a retailer wants to stand out from. One way to differentiate
oneself from the competition is by offering a loyalty program (Dowling & Uncles 1997),
especially since these smaller retailers may not have the resources to implement a full-scale
loyalty program. We therefore hypothesize:
H9: The effectiveness of having a loyalty program will be lower with a higher retail
concentration than with a lower retail concentration.
3.6 Country characteristics
Next, we discuss two country characteristics that can affect the effectiveness of introduced
loyalty programs. In this section, we consider (1) individualism, and (2) long-term orientation.
Individualism. Individualism can be defined as the degree to which individuals are
taking care of themselves and immediate families, as opposed to all members in a group
(Hofstede, Hofstede & Minkov 2010). It was found that in collectivistic countries, the food
share of consumption expenditure was higher, and more time was spent on preparing food (De
Mooij & Hofstede 2002). Possibly, food might have a social function, as when guests drop by,
providing food will have more social value. However, it could also be that individualistic
countries want to take more advantage of discounts and extra benefits, as they strongly aim for
achievement and are highly competitive (Triandis 2001). Furthermore, individualistic societies
value innovativeness more than their collectivistic counterparts (Steenkamp, Hofstede & Wedel
1999). As loyalty programs can be seen as an innovative service element of shopping,
individualistic countries may appreciate loyalty programs more.
H10: The effectiveness of having a loyalty program will be higher for societies that score
higher on individualism than for societies that score lower on individualism.
Long-term orientation. With long-term orientation, societies highly value future
rewards, indicating traits such as persistence, and the ability to adapt (Hofstede, Hofstede &
Minkov 2010). In addition, long-term oriented societies are more pragmatic and modern. Many
Page 28
28
loyalty programs issue points, after which rewards can be redeemed at a later point in time.
Depending on the type of reward and program, this can take a long period of time. O’Brien &
Jones (1995) argue that a too long accumulation might lack relevance to consumers, which
might therefore not adopt the program. The point at which this occurs, however, might be
different depending on the long-term orientation of the society. We therefore hypothesize the
following:
H11: The effectiveness of having a loyalty program will be higher for societies with a higher
long-term orientation than for societies with a lower long-term orientation.
As discussed in H2, consumers are expected to prefer loyalty programs with immediate rewards
over loyalty programs with delayed rewards, since they can immediately obtain the benefits,
which are both relevant and convenient (O’Brien & Jones 1995, Dowling & Uncles 1997).
However, societies with a long-term orientation are found to appreciate future rewards
(Hofstede, Hofstede & Minkov 2010). Consumers in long-term oriented societies might
therefore not dislike the delayed types of rewards as much as consumers in short-term oriented
societies, who might be unsure whether they can collect their rewards in the future. We
hypothesize the following:
H12: The effect of immediate rewards on loyalty program effectiveness will be attenuated for
societies with a higher long-term orientation.
4. Data
4.1 Sample description
The European retail market is used to test our conceptual framework. This market is appropriate
since retailers in European countries are quite diverse. Most countries have at least a couple of
retailers that only operate in one country, as well as retailers operating in various countries. We
consider the leading grocery retailers in 27 European countries, similar to Keller, Dekimpe &
Geyskens (2016). Namely 17 western European (Austria, Belgium, Denmark, Finland, France,
Germany, Greece, Ireland, Italy, Luxembourg, the Netherlands, Norway, Portugal, Spain,
Sweden, Switzerland, and the United Kingdom) and 10 central European (Bulgaria, Czech
Republic, Estonia, Hungary, Latvia, Lithuania, Poland, Romania, Slovakia, and Slovenia)
countries. Of these countries, we take the top 15 banners in terms of their 2015 revenue, based
on available banners within the Planet Retail database (where all banners have a market share
Page 29
29
of at least 0.05%). A distinction is made on banner level rather than on the chain level (e.g.,
Tesco Express as a convenience store is separated from the normal Tesco superstores) since the
loyalty program strategy of a specific retailer might not be implemented across all banners.
However, not all countries have 15 different banners in the dataset, in which case all the
available banners were taken (e.g., Finland and Latvia have 8 distinct banners documented by
Planet Retail). In addition, some banners have been taken over recently (6 cases), or were
missing data of either revenue or the store size in square footage (6 cases), which therefore got
removed. This leaves a total of 358 retail banners in our dataset.
We collect loyalty program data through extensive field research by using the retailers’
websites, press releases and industry reports1. Of the 358 retail banners, 254 had a loyalty
program present in the beginning of 2016. Descriptive statistics of three retail formats are
summarized in Table 5. The smaller groups of convenience stores and neighborhood stores are
merged with supermarkets. Furthermore, superstores and hypermarkets were merged together
since the majority was classified as both.
By considering the top 15 retailers of each country, more than 90% of the total grocery
revenue are accounted for (based on all available banners in the Planet Retail database). For
each individual country, at least 80% was accounted for by taking the top retailers. As shown
in Table 5, there is a large distinction between types of stores. Hard discount stores operate far
fewer loyalty programs than supermarkets and hypermarkets, only at 28% of the stores, which
can be explained by the fact that they mainly focus on price (Van Heerde, Gijsbrechts &
Pauwels 2008). For supermarkets and hypermarkets, on the other hand, at least 80% of the
different banners have a loyalty program or card. There are quite some differences between
countries as well. There are a couple of countries where all banners have some form of loyalty
program (e.g., Estonia, Latvia and Lithuania), but there are also countries where less than half
of the banners have a loyalty program (e.g., Austria, Poland and Bulgaria). A more detailed
summary per country can be found in Table 1 in the Appendix.
1 Websites of retailers explaining their program, are, for example http://www.tesco.ie/clubcard/Clubcardperks/
and http://www.carrefour.fr/services/carte-carrefour. Press releases with more information about the program
type can, for example, be found at https://www.theguardian.com/money/2015/apr/10/sainsburys-cuts-to-nectar-
points-anger-its-customers. In addition, we consulted industry reports from Planet Retail, GfK, IRI and Nielsen.
Page 30
30
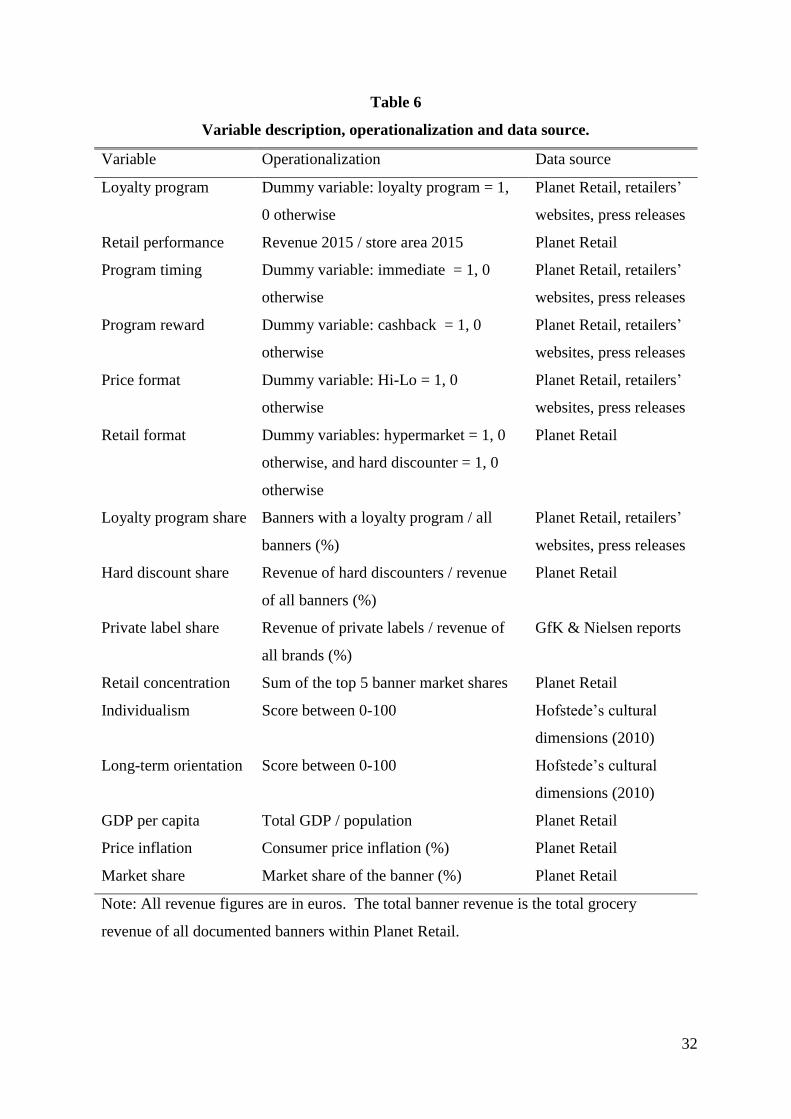
4.2 Variable description
In this section, we give a description of all the variables. Table 6 shows a summary with the
variable name, operationalization, and data source of each variable. In addition, several
descriptive statistics, such as the mean, standard deviation, minimum, and maximum, can be
found in Table 7. When using banner revenues in the operationalization of variables, the grocery
revenue of all documented banners within Planet Retail is meant.
Loyalty program. The loyalty program variable captures whether a retailer makes use
of a loyalty program and is coded as a dummy variable (1 if it uses a program, 0 otherwise).
Temporary loyalty programs (e.g., collecting football cards) are not considered, since they are
only temporary advertisements of the retailer. In addition, there are some permanent actions
where each nth product is free (e.g., 7-eleven gives every 7th cup of coffee for free). However,
these are more permanent promotions for a single product rather than an extensive loyalty
program for the whole retailer, and are therefore not counted as a loyalty program. Following
these rules, around 71% of the investigated retailers makes use of a loyalty program.
Retail performance. Retail performance is measured in terms of sales productivity,
similar to Reinartz & Kumar (1999). To control for retailer size, performance is operationalized
by dividing the retailer sales of 2015 by the total sales area in square meters in 2015. Since
loyalty programs might be running for several years, it is more useful to look at the sales
productivity of the last year rather than the productivity growth of last year, since some retailers
might already have reached their maximum potential of their loyalty program introduction. The
revenue of the average banner is €5,681 per square meter per year.
Table 5
Number of banners, banners of operating a program, and revenue in millions (€)
Type of store Number of
banners
Banners operating
a program (%)
Top 15
revenue
Total revenue
Supermarkets 183 146 (80%) 286,737 340,186
Discounters 72 20 (28%) 177,636 184,260
Hypermarkets 103 88 (85%) 254,042 265,593
Total 358 254 (71%) 718,415 790,038
Note: the top 15 revenue is the captured revenue by the top 15 banners within Planet Retail.
The total revenue is the total revenue of all documented banners within Planet Retail.
Page 31
31
Program timing. As there are two main types of reward timings, namely immediate
rewards and delayed rewards (Dowling & Uncles 1997, Yi & Jeon 2003), we use a dummy
variable to code the timing (immediate reward = 1, 0 otherwise). Immediate rewards include all
direct discounts on products that are rewarded at the checkout of the shopping trip. Some
retailers employ both a direct discount and a saving point system with their loyalty card. Here,
the predominant program type was selected, and coded accordingly. For example, the largest
Dutch retailer, Albert Heijn, uses its bonus card mainly for immediate discounts, but also
rewards Air Miles. Since there are many products that are discounted with the card every week,
and given that the value of rewarded Air Miles is relative low (1 cent for every 2 euros), it is
coded as an immediate reward. Of the banners that operate a loyalty program, around 35% use
immediate rewards.
Program reward. Here, a distinction is made between cashback rewards, and other
rewards (products or services), which are based on accumulated points. Retailers that reward
cashbacks often collaborate with banks, creating customized debit or credit cards, through
which consumers are refunded at the end of a month. The type of reward is documented by a
dummy variable (cashback reward = 1, 0 otherwise). Of the banners that operate loyalty
program, around 15% run cashback rewards.
Price format. Following Gielens, van de Gucht, Steenkamp & Dekimpe (2008) &
Ailawadi, Zhang, Krishna & Kruger (2010), we operationalize price format with the use of a
dummy variable (1 if it is Hi-Lo, 0 otherwise). It can be hard to distinguish Hi-Lo retailers from
EDLP retailers, as most EDLP retailers also run promotions. However, when retailers had
weekly flyers with more than five pages full of promoted products, it was classified as retailer
with a Hi-Lo strategy. Of all considered banners, approximately 65% use a Hi-Lo format.
Retail format. As three types of retail formats are considered, two dummy variables are
used to identify the retail format. There is a dummy variable for a hypermarket format
(Hypermarket = 1, 0 otherwise), and a dummy variable for hard discounter format (Hard
discounter = 1, 0 otherwise). Supermarkets are thus considered as the base-case scenario.
Around 51% of the banners are classified as supermarkets, 20% are classified as hard
discounters, and 29% are classified as hypermarkets.
Page 32
32
Table 6
Variable description, operationalization and data source.
Variable Operationalization Data source
Loyalty program Dummy variable: loyalty program = 1,
0 otherwise
Planet Retail, retailers’
websites, press releases
Retail performance Revenue 2015 / store area 2015 Planet Retail
Program timing Dummy variable: immediate = 1, 0
otherwise
Planet Retail, retailers’
websites, press releases
Program reward Dummy variable: cashback = 1, 0
otherwise
Planet Retail, retailers’
websites, press releases
Price format Dummy variable: Hi-Lo = 1, 0
otherwise
Planet Retail, retailers’
websites, press releases
Retail format Dummy variables: hypermarket = 1, 0
otherwise, and hard discounter = 1, 0
otherwise
Planet Retail
Loyalty program share Banners with a loyalty program / all
banners (%)
Planet Retail, retailers’
websites, press releases
Hard discount share Revenue of hard discounters / revenue
of all banners (%)
Planet Retail
Private label share Revenue of private labels / revenue of
all brands (%)
GfK & Nielsen reports
Retail concentration Sum of the top 5 banner market shares Planet Retail
Individualism Score between 0-100 Hofstede’s cultural
dimensions (2010)
Long-term orientation Score between 0-100 Hofstede’s cultural
dimensions (2010)
GDP per capita Total GDP / population Planet Retail
Price inflation Consumer price inflation (%) Planet Retail
Market share Market share of the banner (%) Planet Retail
Note: All revenue figures are in euros. The total banner revenue is the total grocery
revenue of all documented banners within Planet Retail.
Page 33
33
Loyalty program share. The loyalty program share of a country is calculated by taking
the number of banners that utilizes a loyalty program, and dividing it by the total number of
banners in that country. A higher loyalty program share thus means that relatively more retailers
in that country operate a loyalty scheme. On average, 71% of the banners run a loyalty program,
although in the country with the lowest number of programs (Austria), only 33% run such a
program, while in some countries (e.g., Lithuania), all banners run a loyalty program.
Hard discounter share. We measure the hard discounter share of a country by taking the
revenue of all hard discount retailers, and dividing it by the total banner revenue of the sample,
similar to Keller, Dekimpe & Geyskens (2016). We chose to go for share based on value rather
than the share based on number of hard discounters, in order to account for the size and success
of the hard discounters in each country. The average hard discount share is 23%, but ranges
between 9% (United Kingdom) and 53% (Norway).
Private label share. Private label share is measured by the amount of private label sales
in euros, divided by the total sales in euros. As there was no centralized source that reported all
private label shares of the investigated countries, we used multiple sources. The private label
share data of most of the countries, namely twenty, come from a public Nielsen (2014) report.
The private label shares of Estonia, Latvia and Lithuania come from a report of ICA Gruppen
(2014). Shares of Bulgaria and Romania come from press releases, based on GfK data2. The
private label share of the last two countries, Luxembourg and Slovenia, were estimated using
shares of nearby countries and information from press releases3. The average private label share
is around 25%, but differs from 7% (Estonia) to 45% (Switzerland).
Retail concentration. Retail concentration is operationalized as the combined market
share of the top 5 banners within a country, as in Dobson, Waterson & Davies (2003). A higher
level of concentration indicates a lower level of competition, as there are only a few key players.
The average retail concentration of the top 5 retailers is 45%, though it ranges from 21%
(Greece) to 70% (Austria).
2 Bulgaria: http://gain.fas.usda.gov/Recent%20GAIN%20Publications/Retail%20Market%20Update_Sofia_
Bulgaria_5-18-2015.pdf
Romania: http://www.romania-insider.com/private-label-brands-make-14-of-total-sales-in-romania/ 3 For the private label share of Luxembourg, we took the same private label share as Belgium (30%), since most
of the large retailers in Luxembourg are either Belgian or also present in Belgium. For Slovenia, we took the same
share as neighboring country Hungary (24%). Slovenia is furthermore expected to have a higher share than
neighboring country Croatia (22%) according to Seenews (2014).
Page 34
34
Individualism. We use the values of individualism of Hofstede, Hofstede, & Minkov
(2010). The scores range from 0 to 100, where a higher score means a more individualistic
society. A score of 50 is considered the midlevel. Thus, societies scoring over 50 are considered
to be relatively individualistic. Although the dimension scores are from 2010, they are still
considered up to date, as the culture of a country only changes very slowly over time. The
average score of individualism of the countries in our dataset is 60, and ranges from 27
(Portugal) to 89 (United Kingdom).
Table 7
Descriptive statistics. Mean, standard deviation, minimum and maximum (N = 358).
Variable Mean SD Min Max
Retail performance (€ per m2) 5,681 3,639 524 28,933
Loyalty program (1 = yes) .709 .454 0 1
Program Timing (1 = immediate) .249 .433 0 1
Program Reward (1 = cashback) .106 .308 0 1
Price format (1 = Hi-Lo) .648 .478 0 1
Hypermarket format (1 = yes) .288 .453 0 1
Hard discount format (1 = yes) .201 .401 0 1
Loyalty program share .709 .170 .333 1
Hard discount share .234 .133 .093 .544
Private label share .246 .098 .070 .450
Retail concentration .456 .128 .210 .700
Individualism 60.385 17.104 27 89
Long-term orientation 57.804 16.892 24 83
GDP per capita (€) 31,243 20,582 6,174 91,918
Price inflation -.03 .69 -1.14 2.17
Market share .048 .048 .000 .351
Note: all continuous variables are reported before taking the logarithm, and before the mean
centering. All dummy variables are reported as the percentage of observations having a value
of 1.
Page 35
35
Long-term orientation. Similarly, the values of long-term orientation are taken from
Hofstede, Hofstede, & Minkov (2010). Here, a higher score means that societies are more long-
term oriented. Long-term oriented societies value future rewards and easily adapt to changes.
Similar to individualism, a score of 50 is considered the midlevel. The average long-term
orientation of our considered countries is around 58, and ranges from 24 (Ireland) to 83
(Germany).
Control variables. For a stronger test of our hypotheses, we furthermore include three
control variables that account for the economic situation of the country and for the banner size,
similar to Keller, Dekimpe & Geyskens (2016). First, we include GDP per capita, which
controls for consumers’ average income in a country. Second, we incorporate price inflation,
taking the price increase of goods into account. Finally, we control for the size by including the
market share of each banner in the country.
5. Model
We use a regression to estimate the effect of loyalty programs on retail performance. To
accommodate for decreasing marginal returns, we take the logarithm of all continuous
variables, similar to Steenkamp & Geyskens (2013), except for variables that can include zero
or negative values. Furthermore, we mean center the variables for ease of interpretation. The
following model is being used:
log(𝑃𝐸𝑅𝐹𝑟𝑐) = 𝛽0 + 𝛽1𝐿𝑃𝑟𝑐 + 𝛽2𝑃𝑅𝐼𝐶𝐸𝐹𝑟𝑐 + 𝛽3𝐻𝑌𝑃𝐸𝑅𝑟𝑐 + 𝛽4𝐷𝐼𝑆𝐶𝑂𝑈𝑁𝑇𝑟𝑐 +
𝛽5log(𝐿𝑃𝑆𝐻𝐴𝑅𝐸𝑐) + 𝛽6log(𝐻𝐷𝑆𝐻𝐴𝑅𝐸𝑐) + 𝛽7log(𝑃𝐿𝑆𝐻𝐴𝑅𝐸𝑐) + 𝛽8log(𝐶𝑂𝑁𝐶𝑐) +
𝛽9log(𝐼𝐷𝑉𝑐) + 𝛽10log(𝐿𝑇𝑂𝑐) + 𝐿𝑃𝑟𝑐 ∗ [𝛽11𝑇𝐼𝑀𝐸𝑟𝑐 + 𝛽12𝑅𝐸𝑊𝐴𝑅𝐷𝑟𝑐 + 𝛽13𝑃𝑅𝐼𝐶𝐸𝐹𝑟𝑐 +
𝛽14𝐻𝑌𝑃𝐸𝑅𝑟𝑐 + 𝛽15𝐷𝐼𝑆𝐶𝑂𝑈𝑁𝑇𝑟𝑐 + 𝛽16log(𝐿𝑃𝑆𝐻𝐴𝑅𝐸𝑐) + 𝛽17log(𝐻𝐷𝑆𝐻𝐴𝑅𝐸𝑐) +
𝛽18log(𝑃𝐿𝑆𝐻𝐴𝑅𝐸𝑐) + 𝛽19log(𝐶𝑂𝑁𝐶𝑐) + 𝛽20log(𝐼𝐷𝑉𝑐) + 𝛽21log(𝐿𝑇𝑂𝑐) + 𝛽22𝑇𝐼𝑀𝐸𝑟𝑐 ∗
log(𝐿𝑇𝑂𝑐)] +𝛽23log(𝐺𝐷𝑃𝑐) + 𝛽24𝑃𝑅𝐼𝐶𝐸𝐼𝑁𝐹𝑐 + 𝛽25log(𝑀𝑆𝐻𝐴𝑅𝐸𝑟𝑐) + 𝜀𝑟𝑐
𝑟 = 1, … , 𝑅; 𝑐 = 1, … , 𝐶
Where 𝑃𝐸𝑅𝐹𝑟𝑐 is the retail performance for retailer r in country c. 𝐿𝑃𝑟𝑐 reflects the loyalty
program, 𝑃𝑅𝐼𝐶𝐸𝐹𝑟𝑐 the price format of the retailer, 𝐻𝑌𝑃𝐸𝑅𝑟𝑐 the retailer being a hypermarket,
𝐷𝐼𝑆𝐶𝑂𝑈𝑁𝑇𝑟𝑐 the retailer being a hard discounter, 𝑇𝐼𝑀𝐸𝑟𝑐 the timing of the reward,
𝑅𝐸𝑊𝐴𝑅𝐷𝑟𝑐 the type of reward, 𝐿𝑃𝑆𝐻𝐴𝑅𝐸𝑐 the share of retailers that operate a loyalty program,
𝐻𝐷𝑆𝐻𝐴𝑅𝐸𝑐 the share of hard discount revenue, 𝑃𝐿𝑆𝐻𝐴𝑅𝐸𝑐 the share of private label revenue,
Page 36
36
𝐶𝑂𝑁𝐶𝑐 the retail concentration of a country, 𝐼𝐷𝑉𝑐 the individualism, and 𝐿𝑇𝑂𝑐 the long-term
orientation. Finally, the three control variables𝐺𝐷𝑃𝑐, 𝑃𝑅𝐼𝐶𝐸𝐼𝑁𝐹𝑐, and 𝑀𝑆𝐻𝐴𝑅𝐸𝑟𝑐 reflect the
GDP per capita, price inflation, and market share respectively. We use clusters to control for
correlation. Clustering has to be used when it is reasonable to assume that observations within
a cluster are correlated with each other, while observations from different clusters are not
(Baum, Schaffer & Stillman 2003). Therefore, we use two-way clustered-error terms, to allow
for correlation between (1) retailers, who can use banners in different formats (e.g.,
supermarkets and hypermarkets), or can be present in several countries, and (2) between
countries. A similar methodology has been used in Keller, Dekimpe & Geyskens (2016).
6. Results
6.1 Main effects
We first run a model with main effects only (M1), of which the results can be found in Table 8.
One-sided tests are used for directional hypotheses, while two-sided tests are used for non-
directional hypotheses. There are 92 different clusters for retailers, while there are 27 clusters
for the distinct countries. The explained variation of the model, given by the R2, is .436. The
maximum variance inflation factor (VIF) of around 3, remains below the commonly used
threshold of 10 (Hair et al. 2010). Therefore, multicollinearity does not seem to be a problem.
See Table 2 in the Appendix for the VIF values of all variables.
There is no significant positive effect of loyalty programs on retail performance when
evaluated at the mean (p > .10), indicating that there is no direct effect. We thus do not find
support for H1. However, there are some other significant main effects. First, the retail format
hypermarket has a significant negative effect (𝛽3 = -.292, p < .01). Compared to supermarkets,
hypermarkets thus have a lower retail performance, which we operationalized as revenue per
square meter. Since hypermarkets cover a wider store area, they need to sell far more products
in total in order to perform equally to supermarkets. There was no difference between
supermarkets and hard discounters in terms of retail performance (p > .10). Secondly, we also
find a significant negative effect of retail concentration (𝛽8 = -.232, p < .05). Banners in
countries with a high retail concentration perform less than banners in countries with a low
retail concentration. Finally, we find a positive significant effect of the control variables GDP
per capita (𝛽23 = .448, p < .01) and market share (𝛽25 = .115, p <.01). Banners perform better
in countries with a higher GDP per capita, and when having a higher market share.
Page 37
37
Table 8
The effectiveness of loyalty programs on retail performance (N = 358)
Variable Hypothesis M1 M2
Intercept .121 .182
Loyalty program (LP) H1: + -.016 -.203
Price format -.041 -.045
Hypermarket -.292††† -.272†
Hard discounter .005 -.032
Loyalty program share -.060 .267
Hard discount share -.082 -.047
Private label share .182 .082
Retail concentration -.232†† -.155
Individualism .089 -.041
Long-term orientation -.134 -.285†††
LP * program timing H2: + .240***
LP * program reward H3: + .093*
LP * price format H4: + .054
LP * hypermarket -.012
LP * hard discounter H5: − -.013
LP * loyalty program share H6: − -.450**
LP * hard discount share H7: + -.038
LP * private label share H8: + .133*
LP * retail concentration H9: − -.196***
LP * individualism H10: + .201**
LP * long-term orientation H11: + .236**
GDP per capita .448††† .491†††
Price inflation -.042 -.043
Market share .115††† .116†††
R2 .436 .471
R2 adjusted .414 .433
Highest VIF 3.087 11.111
* p < .10. ** p < .05. *** p < .01 (one-sided), † p < .10. †† p < .05. ††† p < .01 (two-sided).
Significant hypotheses are in bold.
Page 38
38
6.2 Interaction effects
Next, we run a model with both the direct effects, and the interaction effects, of which the
results can be found under M2 in Table 8. The R2 of the model is .471, and the maximum VIF
slightly exceeds the threshold of 10 (Hair et al. 2010), which is common with the use of
interactions, but does not pose a problem for estimating and testing the interaction terms
(Disatnik & Sivan 2016). In this model, H1 is still not supported, as we find no direct effect of
loyalty programs on retail performance. When looking at program characteristics however, we
do find a positive significant interaction effect of program timing and loyalty programs on retail
performance (𝛽11 = .240, p < .01), supporting H2. Immediate rewards are thus preferred, and
enhance the effectiveness of loyalty programs. The reward type also has a positive impact on
the effectiveness of loyalty programs (𝛽12 = .093, p < .10), finding support for H3. In other
words, cashback rewards are preferred to products or services obtained with accumulated
points. For retail characteristics, on the other hand, we do not find that the price format plays a
role (p > .10). The effectiveness of loyalty programs is not different for banners with a Hi-Lo
strategy than for banners with an EDLP strategy. H4 is thus not supported. Next, H5 is also not
supported, as the retail format does not play a role in the effectiveness of loyalty programs (p >
.10). Interestingly enough, loyalty programs seem to be as effective for hard discounters as for
hypermarkets and supermarkets.
As for retail environment, we find confirming evidence for H6, as loyalty programs are
less effective when there is a high loyalty program share (𝛽16 = -.450, p < .05). These findings
are similar to Leenheer et al. (2007) and Meyer-Waarden (2007), who found that program
effectiveness diminishes when consumers use multiple loyalty cards. We could not find
supporting evidence for H7 however. Hard discount share did not influence the effect of loyalty
programs on retail performance (p > .10). Similar to the retail format, hard discounters seem to
have no distinct influence on loyalty program effectiveness at all. Next, private label share does
have an impact on loyalty program effectiveness (𝛽18 = .132, p < .10), supporting H8. Loyalty
programs are more effective in markets with high private label share. Finally, we find a negative
significant effect of retail concentration (𝛽19 = -.196, p < .01), supporting H9. A lower retail
concentration would thus lead to a higher loyalty program effect on retail performance, as there
are more small firms that a retailer wants to stand out from.
We also find evidence when looking at the cultural characteristics of a country. The
interaction of individualism and loyalty programs shows a significant positive effect on retail
performance (𝛽20 = .201, p < .05), giving support for H10. Loyalty programs are thus more
Page 39
39
beneficial for countries that score high on individualism. Similarly, for long-term orientation,
there is a positive interaction of long-term orientation and loyalty programs on retail
performance (𝛽21 = .236, p < .05), supporting H11. This indicates that loyalty programs perform
better in countries that are long-term oriented. Finally, for our last hypothesis, we run an
additional model (M3), where the three-way interaction term between loyalty program, program
timing and long-term orientation is included. The results of this separate analysis can be found
in Table 3 in the Appendix. Here, we find no support for H12, as the three-way interaction term
is not significant (p > .10). The preference of immediate rewards in loyalty programs does not
get attenuated in societies with a long-term orientation.
Finally, as for the control variables in M2, we find a positive significant effect of GDP
per capita on retail performance (𝛽23 = .491, p < .01). So in countries where consumers have a
higher income, the retail performance is higher. This could be either explained by the fact that
these consumers have more income to spend on groceries, or by the fact that countries with
higher incomes are less elastic for food expenditures (Regmi 2001). The second control
variable, price inflation, does not have an impact on retail performance (p > .10). Finally, market
share does have a positive impact on retail performance (𝛽25 = .116, p < .01). Banners with a
higher market share tend to perform better in terms of retail performance than those with a
lower market share.
6.3 Robustness checks
In order to assess the stability to our results, we run several robustness checks. First, we remove
the countries Luxembourg and Slovenia, of which we were not able to find the exact private
label share. Results of this analysis can be found in Table 4 in the Appendix. The only difference
regarding our hypotheses is that program reward is no longer marginally significant (p > .10).
More importantly however, the interaction effect between private label share and loyalty
program remains significant, indicating that the estimation of private label shares for these
countries did not alter the result for H9.
Next, we want to check whether the number of banners included in the sample affects
our results. It is not feasible to look at more than 15 banners per country, as many countries do
not have that many banners present in the data, which could lead to underrepresenting some
countries. However, it is possible to reduce the number of banners. As an alternative analysis,
we only look at the top 12 banners, similar to Keller, Dekimpe & Geyskens (2016), of which
Page 40
40
the results are summarized in Table 5 in the Appendix. Our results remain substantively the
same, as all the hypotheses of our main analysis stay significant in this alternative sample.
As a final robustness check, we test whether the results remain similar when looking at
Western European countries only. The results of the analysis of these 17 countries can be found
in Table 6 in the Appendix, which do slightly differ from earlier findings. The most meaningful
change is the significant negative interaction effect of hard discounters and loyalty programs
on retail performance, supporting H5 in this analysis. Here, loyalty programs appear to be less
effective when operated by a hard discounter. On the other hand, both private label share and
individualism lose their significance. A possible explanation is that both these variables are
relatively similar across the Western European countries, which can make it difficult to identify
significant effects for these variables without including Eastern European countries. Private
label share is quite different, with 29% on average in Western Europe, but only 17% on average
in Eastern Europe. Similar differences are present for individualism, which scores 64 on
average in Western Europe, while only 52 on average in Eastern Europe. Note that it is
impossible to run the same analysis for Eastern European countries only. Due to the many
clusters for both retailers and countries in the smaller sample (N=125), it is not possible to
calculate standard errors for all variables.
7. Conclusion
7.1 Discussion
One of the vital decisions retailers have to make these days is whether to implement a loyalty
program or not. In this study, we analyzed 358 retailers over 27 countries in order to measure
the effect of loyalty programs on retail performance, which we operationalized as revenue per
square meter. Here, we focused on the influence of (1) program characteristics, (2) retail
characteristics, (3) retail environment, and (4) cultural characteristics. By doing this, we
addressed several key issues in current literature, which found divided evidence of loyalty
program effectiveness (Leenheer et al. 2007). Many of these studies only address a specific
program of a retailer or focus on several retailers within a specific country or region. To the
best of our knowledge, ours is the first study to address loyalty program effectiveness spanning
several retailers and countries.
Page 41
41
Our results show that the effect of loyalty programs on retail performance does not
depend solely on operating a loyalty program, but is influenced by other factors. When looking
at program characteristics, we found that the program design played a role. More specifically,
programs with immediate rewards performed better than programs with delayed rewards. This
corresponds with literature stating that consumers prefer immediate rewards, since they tend to
be both relevant and convenient (O’Brien & Jones 1995, Dowling & Uncles 1997). On the other
hand, it contradicts the findings of Zhang & Breugelmans (2012), who found that the change
of a retailer from an immediate price discount to a delayed reward point system was favorable.
The authors state however, that the success of the change was dependent on the number of
regular promotions, which were needed to fully utilize the new reward point system. Next, we
found that cashback rewards were preferred over product or service rewards, which could also
be explained by cashback rewards being more relevant (O’Brien & Jones 1995). As for retail
environment, loyalty program share, private label share, and retail concentration are important
factors to consider. A low retail concentration means many small competitors, where retailers
want to stand out from by using a differentiation strategy (Thomson, Strickland & Gamble
2009). Operating a loyalty program can be a way to do so (Dowling & Uncles 1997). A similar
line of thought could be used for private label share, where differentiation is needed when many
banners have a similar private label focus. The effects of loyalty program share are in line with
earlier research, which showed that the effectiveness of programs is smaller when consumers
hold more loyalty cards (Leenheer et al. 2007, Meyer-Waarden 2007). When most other
competitors already have loyalty programs, it might be of little use to introduce one yourself.
Finally, the cultural characteristics show that loyalty programs are more successful in increasing
retail performance in individualistic countries with a long-term orientation. The competitive
mindset of individualistic countries makes consumers want to gain the most advantage and
enjoy all benefits possible. Consumers that have a long-term orientation will account for future
benefits that a loyalty program may hold, and are therefore more likely to adopt and make use
of the program.
The findings of this study can guide retailers into making their loyalty program decision
in several ways. First, it helps retailers make decisions about their loyalty program design.
Immediate rewards are preferred over delayed rewards, while cashback rewards are preferred
over product or service rewards. Second, the results can help retailers with the decision to
introduce a loyalty program, keeping both the retail environment and cultural characteristics in
mind. While this is out of the retailer’s direct control, it is important to be aware of these
Page 42
42
elements in order to adapt the loyalty program decision making. For example, introducing a
loyalty program in market where all competitors already have one, has no real benefit. Finally,
findings can help retailers make strategic decisions in foreign markets. On the one hand, if their
loyalty program strategy works well in a current operating country, they might want to expand
the same program strategy to similar countries, where both the retail setting and cultural aspects
are comparable. On the other hand, if the next expanding country has been found to be vastly
different, retailers might choose to run a decentralizing strategy, and not implement the same
loyalty program in their new market.
7.2 Limitations
This study has several limitations, which could be potential areas of future research. First of all,
while we did look at some loyalty program design characteristics (e.g., reward timing), there
are still other design characteristics that could be explored. For example, no distinction was
made between single-vendor and multi-vendor loyalty programs. It can be that multi-vendor
loyalty programs are less effective. The study of Sharp & Sharp (1997), which investigated a
multi-vendor loyalty program, found no clear positive effect of loyalty programs. These kind
of loyalty programs often issue indirect types of rewards, which can be undesirable for retailers,
as there is no direct link for the consumer between the reward and the retailer itself (Dowling
& Uncles 1997). Another aspect of loyalty program design that was not taken into account is
the value of the discount, similar to the cash value element described in O’Brien & Jones (1995).
Naturally, a higher reward would be more attractive for consumers to adopt and participate in
loyalty programs, but also raises costs. Leenheer et al. (2007) found that a higher reward value
increased share of wallet for both direct discounts and point saving systems, indicating that the
rewarded cash value indeed plays a role in design.
A second limitation is that we used a cross-sectional dataset and did not account for the
time dimension. Given the data availability and time restriction, we could not gather
information about the introduction time of the loyalty program. This gets increasingly difficult
as loyalty programs might be changing over time, adding more features based on recent trends.
Alternatively, we looked whether a loyalty program was present and looked at the retail
performance of the last year. However, it might be the case that the effect of loyalty programs
takes longer to build up. There might be retailers that recently released a loyalty program, and
are thus still in their build-up stage, not yet being able to gain the complete benefits.
Page 43
43
Third, we did not control for a possible endogeneity problem, since we treat having a
loyalty program as completely exogenous. There could be variables or factors that both
influence a retailer’s tendency to operate a loyalty program and the retail performance.
Although we already include variables regarding retail characteristics, such as retail format and
pricing strategy, and regarding retail environment, such as retail concentration and loyalty
program share, there might still be some important effects missing.
Finally, our data is limited to revenue figures only. The dependent variable, retail
performance, is based on a retailer’s grocery sales per square meter. The costs however, are not
taken into account. Since loyalty programs also have implementation and maintenance costs, it
is important to keep this in mind. Furthermore, it might play a role in the effectiveness of loyalty
program design. As discussed before, immediate rewards are preferred over delayed rewards.
For retailers however, the costs of immediate rewards might be higher. In addition, we did not
find any effect of the retail format, nor any effect of the hard discounter share. A potential
reason for this might be that hard discounters have far lower costs, but not automatically higher
revenue. Future research could address this issue by including both revenue and costs of loyalty
programs.
Page 44
44
References
Aaker, D. A. (1996). Measuring brand equity across products and markets. California
management review, 38(3), 102-120.
Ailawadi, K. L., Pauwels, K., & Steenkamp, J. B. E. (2008). Private-label use and store
loyalty. Journal of Marketing, 72(6), 19-30.
Ailawadi, K. L., Zhang, J., Krishna, A., & Kruger, M. W. (2010). When Wal-Mart enters: How
incumbent retailers react and how this affects their sales outcomes. Journal of Marketing
Research, 47(4), 577-593.
Anderson, E. W., Fornell, C., & Lehmann, D. R. (1994). Customer satisfaction, market share,
and profitability: Findings from Sweden. The Journal of Marketing, 53-66.
Barone, M. J., Norman, A. T., & Miyazaki, A. D. (2007). Consumer response to retailer use of
cause-related marketing: Is more fit better? Journal of Retailing, 83(4), 437-445.
Baum, C. F., Schaffer, M. E., & Stillman, S. (2003). Instrumental variables and GMM:
Estimation and testing. Stata journal, 3(1), 1-31.
Begg, C. B., & Berlin, J. A. (1988). Publication bias: a problem in interpreting medical
data. Journal of the Royal Statistical Society. Series A (Statistics in Society), 419-463.
Berman, B. (2006). Developing an effective customer loyalty program. California management
review, 49(1), 123-148.
Bolton, R. N., Kannan, P. K., & Bramlett, M. D. (2000). Implications of loyalty program
membership and service experiences for customer retention and value. Journal of the academy
of marketing science, 28(1), 95-108.
Cleeren, K., Verboven, F., Dekimpe, M. G., & Gielens, K. (2010). Intra-and interformat
competition among discounters and supermarkets. Marketing science, 29(3), 456-473.
Collins-Dodd, C., & Lindley, T. (2003). Store brands and retail differentiation: the influence of
store image and store brand attitude on store own brand perceptions. Journal of Retailing and
Consumer Services, 10(6), 345-352.
Colloquy (2015). U.S. Customer loyalty program membership top 3 billion for the first time,
2015 Colloquy census shows. Retrieved July 2, 2016 from https://www.colloquy.com/latest-
news/2015-colloquy-loyalty-census/
Page 45
45
Cunningham, R. M. (1956). Brand loyalty-what, where, how much. Harvard Business
Review, 34(1), 116-128.
Dawes, J., & Nenycz-Thiel, M. (2013). Analyzing the intensity of private label competition
across retailers. Journal of Business Research, 66(1), 60-66.
De Mooij, M., & Hofstede, G. (2002). Convergence and divergence in consumer behavior:
implications for international retailing. Journal of retailing, 78(1), 61-69.
Dick, A. S., & Basu, K. (1994). Customer loyalty: toward an integrated conceptual
framework. Journal of the academy of marketing science, 22(2), 99-113.
Disatnik, D., & Sivan, L. (2016). The multicollinearity illusion in moderated regression
analysis. Marketing Letters, 27(2), 403-408.
Dobson, P. W., Waterson, M., & Davies, S. W. (2003). The patterns and implications of
increasing concentration in European food retailing. Journal of Agricultural Economics, 54(1),
111-125.
Dorotic, M., Fok, D., Verhoef, P. C., & Bijmolt, T. H. (2011). Do vendors benefit from
promotions in a multi-vendor loyalty program? Marketing Letters, 22(4), 341-356.
Dorotic, M., Verhoef, P. C., Fok, D., & Bijmolt, T. H. (2014). Reward redemption effects in a
loyalty program when customers choose how much and when to redeem. International Journal
of Research in Marketing, 31(4), 339-355.
Dowling, G. R., & Uncles, M. (1997). Do customer loyalty programs really work? MIT Sloan
Management Review, 38(4), 71.
Drèze, X., & Hoch, S. J. (1998). Exploiting the installed base using cross-merchandising and
category destination programs. International Journal of Research in Marketing, 15(5), 459-
471.
East, R., Hammond, K., Harris, P., & Lomax, W. (2000). First-store loyalty and
retention. Journal of Marketing Management, 16(4), 307-325.
Gielens, K., Van de Gucht, L. M., Steenkamp, J. B. E., & Dekimpe, M. G. (2008). Dancing
with a giant: The effect of Wal-Mart's entry into the United Kingdom on the performance of
European retailers. Journal of Marketing Research, 45(5), 519-534.
Page 46
46
Hair, J. F., Black, W. C., Babin, B. J., & Anderson, R. E. (2010). Multivariate data analysis: A
global perspective. Upper Saddle River, NJ: Pearson.
Hoch, S. J., Dreze, X., & Purk, M. E. (1994). EDLP, Hi-Lo, and margin arithmetic. The Journal
of Marketing, 16-27.
Hofstede, G. (2010). Geert Hofstede. National cultural dimensions.
Hofstede G., Hofstede, G. J., Minkov, M. (2010). Cultures and Organizations: Software of the
Mind. Revised and Expanded 3rd Edition. New York: McGraw-Hill USA.
ICA Gruppen (2014). Growing a strong stable operation in the Baltics. Retrieved July 28,
2016 from http://www.icagruppen.se/globalassets/3.-investerare/5.-rapporter/arkiv---
finansiellt/svenska/arkiv/2014/09.-kapitalmarknadsdag/cmd_rimi_baltic.pdf
Jacoby, J., & Chestnut, R. W. (1978). Brand loyalty: Measurement and management.
Keller, Kristopher O., Marnik G. Dekimpe, and Inge Geyskens (2016). Let Your Banner Wave?
Antecedents and Performance Implications of Retailers Private-Label Branding Strategies.
Forthcoming at Journal of Marketing.
Kivetz, R., & Simonson, I. (2002). Earning the right to indulge: Effort as a determinant of
customer preferences toward frequency program rewards. Journal of Marketing
Research, 39(2), 155-170.
Kivetz, R., & Simonson, I. (2003). The idiosyncratic fit heuristic: Effort advantage as a
determinant of consumer response to loyalty programs.Journal of marketing research, 40(4),
454-467.
Lal, R., & Rao, R. (1997). Supermarket competition: The case of every day low
pricing. Marketing science, 16(1), 60-80.
Lal, R., & Bell, D. E. (2003). The impact of frequent shopper programs in grocery
retailing. Quantitative Marketing and Economics, 1(2), 179-202.
Leenheer, J., Van Heerde, H. J., Bijmolt, T. H., & Smidts, A. (2007). Do loyalty programs really
enhance behavioral loyalty? An empirical analysis accounting for self-selecting
members. International Journal of Research in Marketing, 24(1), 31-47.
Lewis, M. (2004). The influence of loyalty programs and short-term promotions on customer
retention. Journal of marketing research, 41(3), 281-292.
Page 47
47
Mägi, A. W. (2003). Share of wallet in retailing: the effects of customer satisfaction, loyalty
cards and shopper characteristics. Journal of Retailing, 79(2), 97-106.
Melnyk, V., & van Osselaer, S. M. (2012). Make me special: Gender differences in consumers’
responses to loyalty programs. Marketing Letters,23(3), 545-559.
Melnyk, V., & Bijmolt, T. (2015). The effects of introducing and terminating loyalty
programs. European Journal of Marketing, 49(3/4), 398-419.
Meyer-Waarden, L. (2007). The effects of loyalty programs on customer lifetime duration and
share of wallet. Journal of Retailing, 83(2), 223-236.
Miyazaki, A. D., Grewal, D., & Goodstein, R. C. (2005). The effect of multiple extrinsic cues
on quality perceptions: A matter of consistency.Journal of consumer research, 32(1), 146-153.
Mosteller, F., & Colditz, G. A. (1996). Understanding research synthesis (meta-
analysis). Annual review of public health, 17(1), 1-23.
Nielsen. (2014). The state of Private Label around the world. Retrieved February 16, 2016
from http://www.nielsen.com/content/dam/nielsenglobal/kr/docs/global-
report/2014/Nielsen%20Global%20Private%20Label%20Report%20November%202014.pdf
O'Brien, L., & Jones, C. (1995). Do rewards really create loyalty? Long range planning, 28(4),
130-130.
O'Malley, L. (1998). Can loyalty schemes really build loyalty? Marketing Intelligence &
Planning, 16(1), 47-55.
Regmi, A. (2001). Changing structure of global food consumption and trade: An
introduction. Changing Structure of Global Food Consumption and Trade. Anita Regmi, 1.
Reichheld, F. F., & Teal, T. (2001). The loyalty effect: The hidden force behind growth, profits,
and lasting value. Harvard Business Press.
Reinartz, W. J., & Kumar, V. (1999). Store-, market-, and consumer-characteristics: The drivers
of store performance. Marketing Letters, 10(1), 5-23.
Roehm, M. L., Pullins, E. B., & Roehm Jr, H. A. (2002). Designing loyalty-building programs
for packaged goods brands. Journal of Marketing Research, 39(2), 202-213.
Rosenberg, L. J., & Czepiel, J. A. (1984). A marketing approach for customer retention. Journal
of Consumer Marketing, 1(2), 45-51.
Page 48
48
Seenews (2014). Consolidation, rise of discounters shaping outlook for grocery market in SEE.
Retrieved July 28, 2016 from http://top100.seenews.com/2014/09/consolidation-rise-of-
discounters-shaping-outlook-for-grocery-market-in-see/
Smart, R. G. (1964). The importance of negative results in psychological research. Canadian
Psychologist/Psychologie Canadienne, 5(4), 225.
Statista (2015). Share of consumers holding supermarket loyalty cards and credit cards in the
United Kindom (UK), in 2015, by type. Retrieved August 1, 2016, from
http://www.statista.com/statistics/533140/uk-supermarket-loyalty-and-credit-cards-holders/
Steenkamp, J. B. E., Hofstede, F. T., & Wedel, M. (1999). A cross-national investigation into
the individual and national cultural antecedents of consumer innovativeness. The Journal of
Marketing, 55-69.
Steenkamp, J. B. E., & Geyskens, I. (2013). Manufacturer and retailer strategies to impact store
brand share: Global integration, local adaptation, and worldwide learning. Marketing
Science, 33(1), 6-26.
Steiner, R. L. (2004). The nature and benefits of national brand/private label
competition. Review of Industrial Organization, 24(2), 105-127.
Sharp, B., & Sharp, A. (1997). Loyalty programs and their impact on repeat-purchase loyalty
patterns. International journal of Research in Marketing,14(5), 473-486.
Taylor, G. A., & Neslin, S. A. (2005). The current and future sales impact of a retail frequency
reward program. Journal of Retailing, 81(4), 293-305.
Thornton, A., & Lee, P. (2000). Publication bias in meta-analysis: its causes and
consequences. Journal of clinical epidemiology, 53(2), 207-216.
Thomson, A., Strickland, A. J., & Gamble, J. E. (2009). Crafting and executing strategy. Tata
McGraw Hill.
Triandis, H. C. (2001). Individualism‐collectivism and personality. Journal of
personality, 69(6), 907-924.
Van Heerde, H. J., & Bijmolt, T. H. (2005). Decomposing the promotional revenue bump for
loyalty program members versus nonmembers. Journal of Marketing Research, 42(4), 443-
457.
Page 49
49
Van Heerde, H. J., Gijsbrechts, E., & Pauwels, K. (2008). Winners and losers in a major price
war. Journal of Marketing Research, 45(5), 499-518.
Webster Jr, F. E. (1994). Defining the new marketing concept (Part 1). Marketing
management, 2(4), 22.
Yi, Y., & Jeon, H. (2003). Effects of loyalty programs on value perception, program loyalty,
and brand loyalty. Journal of the academy of marketing science, 31(3), 229-240.
Zhang, J., & Breugelmans, E. (2012). The impact of an item-based loyalty program on
consumer purchase behavior. Journal of Marketing research,49(1), 50-65.
Zhu, T., Singh, V., & Dukes, A. (2006). Local competition and impact of entry by a discount
retailer. Working Paper, University of Toronto.
Page 50
50
Appendix
Table 1
Revenue in millions (€), number of stores and percentage of loyalty card retailers
Type of store Number of
banners
Banners operating
a program (%)
Top 15
revenue
Total
revenue
Austria 15 5 (33%) 17,109 17,109
Belgium 15 12 (8%) 22,947 23,453
Denmark 13 5 (38%) 13,081 14,119
Finland 8 7 (88%) 9,388 9,388
France 15 12 (8%) 130,566 144,805
Germany 15 9 (6%) 130,072 141,631
Greece 15 14 (93%) 7,830 7,900
Ireland 11 6 (55%) 9,719 11,200
Italy 15 12 (8%) 46,511 53,282
Luxembourg 12 10 (83%) 1,448 1,450
Netherlands 12 8 (67%) 26,118 26,481
Norway 12 8 (67%) 16,239 16,672
Portugal 15 11 (73%) 11,665 11,700
Spain 15 10 (67%) 45,640 54,653
Sweden 15 12 (8%) 17,734 18,124
Switzerland 15 8 (53%) 23,174 23,174
United Kingdom 15 11 (73%) 126,255 151,536
Bulgaria 11 7 (64%) 2,274 2,366
Czech Republic 15 7 (47%) 9,623 9,652
Estonia 12 12 (1%) 1,727 1,727
Hungary 14 11 (79%) 7,862 7,862
Latvia 8 8 (1%) 1,485 1,485
Lithuania 13 13 (1%) 2,558 2,558
Poland 15 9 (6%) 23,682 24,714
Romania 15 10 (67%) 7,174 7,202
Slovakia 11 9 (82%) 3,704 3,704
Slovenia 11 8 (73%) 2,832 2,832
Total 358 254 (71%) 718,415 790,776
Page 51
51
Table 2
Variance inflation factors (VIF)
Variable M1 M2
Loyalty program (LP) 3.087 7.536
Price format 2.707 8.048
Hypermarket 1.533 8.474
Hard discounter 1.096 1.690
Loyalty program share 2.134 5.578
Hard discount share 1.812 5.696
Private label share 1.778 11.048
Retail concentration 1.902 7.531
Individualism 1.691 4.933
Long-term orientation 1.272 3.831
LP * program timing 2.022
LP * program reward 1.352
LP * price format 11.111
LP * hypermarket 8.814
LP * hard discounter 1.838
LP * loyalty program share 5.581
LP * hard discount share 5.682
LP * private label share 10.265
LP * retail concentration 6.080
LP * individualism 4.558
LP * long-term orientation 3.954
GDP per capita 2.729 2.842
Price inflation 1.772 1.886
Market share 1.112 1.179
Mean VIF 1.894 5.480
Page 52
52
Table 3
The effectiveness of loyalty programs on retail performance (N = 358)
Variable Hypothesis M3
Intercept .182
Loyalty program (LP) H1: + -.200
Price format -.045
Hypermarket -.272†
Hard discounter -.033
Loyalty program share .267
Hard discount share -.047
Private label share .083
Retail concentration -.159
Individualism -.044
Long-term orientation -.285†††
LP * program timing H2: + .228***
LP * program reward H3: + .080
LP * price format H4: + .050
LP * hypermarket -.007
LP * hard discounter H5: − -.001
LP * loyalty program share H6: − -.442**
LP * hard discount share H7: + -.033
LP * private label share H8: + .148*
LP * retail concentration H9: − -.200***
LP * individualism H10: + .185**
LP * long-term orientation H11: + .193**
LP * program timing * long-term orientation H12: − .206
GDP per capita .206†††
Price inflation .493
Market share -.041†††
R2 .472
R2 adjusted .432
Highest VIF 11.130
* p < .10, ** p < .05, *** p < .01 (one-sided), † p < .10, †† p < .05, ††† p < .01 (two-sided).
Significant hypotheses are in bold.
Page 53
53
Table 4
The effectiveness of loyalty programs on retail performance (N = 335)
Variable Hypothesis M1 M2
Intercept .178 .220
Loyalty program (LP) H1: + -.034 -.192
Price format -.069 -.068
Hypermarket -.323††† -.258†
Hard discounter -.049 -.018
Loyalty program share -.061 .352††
Hard discount share -.118 -.072
Private label share .161 .024
Retail concentration -.234†† -.050
Individualism .087 -.118
Long-term orientation -.121 -.251†††
LP * program timing H2: + .216***
LP * program reward H3: + .101
LP * price format H4: + .055
LP * hypermarket -.062
LP * hard discounter H5: − -.120
LP * loyalty program share H6: − -.558***
LP * hard discount share H7: + -.039
LP * private label share H8: + .162*
LP * retail concentration H9: − -.295***
LP * individualism H10: + .261**
LP * long-term orientation H11: + .220**
GDP per capita .505††† .550†††
Price inflation -.052 -.058
Market share .112††† .113†††
R2 .462 .498
R2 adjusted .441 .459
Highest VIF 3,042 11,170
* p < .10, ** p < .05, *** p < .01 (one-sided), † p < .10, †† p < .05, ††† p < .01 (two-sided).
Note: model results when removing Luxembourg and Slovenia due to missing PL-share.
Page 54
54
Table 5
The effectiveness of loyalty programs on retail performance (N = 306)
Variable Hypothesis M1 M2
Intercept .098 .128
Loyalty program (LP) H1: + -.030 -.166
Price format -.033 -.013
Hypermarket -.273††† -.156
Hard discounter .038 .037
Loyalty program share -.006 .302†
Hard discount share -.105 -.101††
Private label share .180 .048
Retail concentration -.293††† -.206
Individualism .005 -.098
Long-term orientation -.174 -.296†††
LP * program timing H2: + .234***
LP * program reward H3: + .102*
LP * price format H4: + .019
LP * hypermarket -.120
LP * hard discounter H5: − -.043
LP * loyalty program share H6: − -.410**
LP * hard discount share H7: + .010
LP * private label share H8: + .150**
LP * retail concentration H9: − -.192**
LP * individualism H10: + .193*
LP * long-term orientation H11: + .167**
GDP per capita .459††† .504†††
Price inflation -.031 -.038
Market share .143††† .134†††
R2 .457 .490
R2 adjusted .433 .446
Highest VIF 3,374 12,512
* p < .10, ** p < .05, *** p < .01 (one-sided), † p < .10, †† p < .05, ††† p < .01 (two-sided).
Note: model results when considering the top 12 banners only.
Page 55
55
Table 6
The effectiveness of loyalty programs on retail performance (N = 233)
Variable Hypothesis M1 M2
Intercept .305††† .045
Loyalty program (LP) H1: + -.100 .067
Price format -.175†† .019
Hypermarket -.266††† -.142
Hard discounter -.254††† .014
Loyalty program share .066 .469††
Hard discount share .011 .053
Private label share .351 .342††
Retail concentration -.208 -.012
Individualism .413†† .329†
Long-term orientation -.263† -.431
LP * program timing H2: + .254***
LP * program reward H3: + .087*
LP * price format H4: + -.172
LP * hypermarket -.136
LP * hard discounter H5: − -.605**
LP * loyalty program share H6: − -.673***
LP * hard discount share H7: + -.036
LP * private label share H8: + .090
LP * retail concentration H9: − -.427**
LP * individualism H10: + .016
LP * long-term orientation H11: + .219*
GDP per capita .322†† .396†††
Price inflation -.066 -.049
Market share .099†† .100††
R2 .287 .352
R2 adjusted .244 .278
Highest VIF 3,954 12,312
* p < .10, ** p < .05, *** p < .01 (one-sided), † p < .10, †† p < .05, ††† p < .01 (two-sided).
Note: model results when considering Western European countries only.