International Journal of Management, Technology, and Social
Sciences (IJMTS), ISSN: 2581-6012, Vol. 5, No. 2, October
2020 Year.
SRINIVAS
PUBLICATION
Rangaraju K, et al, (2020); www.srinivaspublication.com
PAGE 216
Effectiveness of Quality of Service towards
Commitment of Suppliers with Reference to
SME’s in Automobile Industry
Rangaraju K1, V. R. Nedunchezhian2, & P. K. Suresh Kumar3 1Research Scholar, College of Management & Commerce, Srinivas University, Mangalore –
575 001, India.
E-mail: [email protected] 2 Professor and Head, Center Head Finance, KCT Business School, Coimbatore-641049,
India.
E-mail: [email protected] 3Research Professor, College of Management and Commerce, Srinivas University, Mangalore
– 575 001, India.
E-mail: [email protected]
Area/Section: Business Management.
Type of the Paper: Empirical Research.
Type of Review: Peer Reviewed as per |C|O|P|E| guidance.
Indexed in: OpenAIRE.
DOI: http://doi.org/10.5281/zenodo.4112314
Google Scholar Citation: IJMTS.
International Journal of Management, Technology, and Social Sciences (IJMTS)
A Refereed International Journal of Srinivas University, India.
© With Author.
This work is licensed under a Creative Commons Attribution-Non-Commercial 4.0
International License subject to proper citation to the publication source of the work.
Disclaimer: The scholarly papers as reviewed and published by the Srinivas Publications (S.P.),
India are the views and opinions of their respective authors and are not the views or opinions
of the SP. The SP disclaims of any harm or loss caused due to the published content to any
party.
How to Cite this Paper:
Rangaraju K, Nedunchezhian, V. R. & Suresh Kumar, P. K. (2020). Effectiveness of Quality
of Service towards Commitment of Suppliers with Reference to SME’s in Automobile Industry.
International Journal of Management, Technology, and Social Sciences (IJMTS), 5(2), 216-
232. DOI: http://doi.org/10.5281/zenodo.4112314
International Journal of Management, Technology, and Social
Sciences (IJMTS), ISSN: 2581-6012, Vol. 5, No. 2, October
2020 Year.
SRINIVAS
PUBLICATION
Rangaraju K, et al, (2020); www.srinivaspublication.com
PAGE 217
Effectiveness of Quality of Service towards Commitment
of Suppliers with Reference to SME’s in Automobile
Industry
Rangaraju K1, V. R. Nedunchezhian2, & P. K. Suresh Kumar3 1Research Scholar, College of Management & Commerce, Srinivas University, Mangalore –
575 001, India.
E-mail: [email protected] 2 Professor and Head, Center Head Finance, KCT Business School, Coimbatore-641049,
India.
E-mail: [email protected] 3Research Professor, College of Management and Commerce, Srinivas University, Mangalore
– 575 001, India.
E-mail: [email protected]
ABSTACT
Service quality is a focused evaluation that reflects the vendor's perception of specific
dimensions of service. Though there is a problem with the automobile industry Covid-19
pandemic the sector may grow further in near future. The main objective is to examine the
essential dimensions of service quality i.e. RATER- Reliability, assurance, tangibles, empathy
and responsiveness of SME’s in the automobile industry and its effect on vendor’s satisfaction
and to find out the perception of suppliers towards supply chain with the companies. For this,
a sample of 50 was collected from the respondents were percentage analysis, Descriptive
statistics, Multiple regression, Kruskal Wallis test, and one-way ANOVA were used as tools to
analyse the data. The conclusion is that dimensional factors level of acceptance towards
sourcing products from a limited number of suppliers, level of acceptance towards establishing
clear criteria, and level of acceptance towards Suppliers collaborating with suppliers in
materials are taken for decision making process of the study. It also reveals that while taking a
decision on these dimensions the factor frequency of making supply should be taken for
decision making process of the study.
Keywords: Service quality, Automobile industry, Supplier commitment.
1. INTRODUCTION TO THE CONCEPT OF STUDY:
In today’s finicky market, customers will settle for nothing less. The client is at a recognized relatively
belatedly he will be the ruler. Typically, the customer’s range of one particular enterprise above an
additional since his or her main loan provider is dependent upon concerns associated with program top
quality instead of some other matter. High quality regarding assistance is really an extensive expression
which is used in the customer support assessments as well as in scientific assessments. In the apps, the
standard of the provider must choose computing the particular occurrence involving problems in just a
method of which lead to typically the design associated with problems for the user. The purpose of
virtually any high quality associated with company assessment is to reduce the particular relative
incidence regarding transmitting concerns plus the mistake costs which could end result. Thus, the study
is to find the impact of the quality of service provided by the SME’s in the automobile industry towards
preference and contact maintained by large scale companies in the automobile industry with their current
suppliers.
International Journal of Management, Technology, and Social
Sciences (IJMTS), ISSN: 2581-6012, Vol. 5, No. 2, October
2020 Year.
SRINIVAS
PUBLICATION
Rangaraju K, et al, (2020); www.srinivaspublication.com
PAGE 218
Chart 1: Conceptual framework
Reliability:
This dimension can be proven to contain the best effect relating to consumer knowledge regarding high
quality. It's the capacity to execute the particular offers program dependably together with precisely.
Typically, the consistency sizing, which will assure well-timed shipping and delivery, again and again,
assists the service agency to satisfy the consumer expected values completely on the least expensive
amount of service plan expectancy.
Responsiveness:
It does not take readiness for the support firm’s staff members to assist consumers and supply them with
a quick product. The shoppers might have worries, unique tickets, issues, and so forth Actually every
single client could have troubles associated with her or his individual. As the front-end worker might
have been taught or even outfitted to supply standard solutions, the purchasers wish these to rise above
this kind of limitation. Is it doesn't motivation to assist the client or perhaps motivation to be that will
additional yardage which is responsiveness. The 2nd facet of responsiveness is going to be a quick
reaction to a client to make certain. Whenever reaction is going to be postponed buyers normally
manages to lose fascination.
Assurance:
This thought as the power from the firms to be able to motivate put your confidence in addition to self-
confidence within the company shipping. That identifies information and even due to the particular
system firm’s workers and the capability to really encourage put their trust in plus self-assurance inside
the consumer in the direction of the firms. This particular dimension is recognized as important just for
products that will require risky since the buyer is probably not in a position to examine the many
questions mixed up in the method simply by all of them. Whenever potential customers listen to these
people regarding the organizations and your reasonable shipping and delivery, they will experience
given the assurance together to create a better outlook for the corporations.
Empathy:
This appertains to the consumer personalized consideration the particular system company offers every
client. Whenever a provider places themselves within the shoes and boots of the clients, he might view
the customer’s perspective much better. The moment consumers believe that the particular service
provider is definitely producing the greatest work to determine their own standpoint, it might be good
enough for some.
Tangibles:
This describes bodily services, accessories, and look of the system firm’s workers. The responsibility
belonging to the concrete and even actual physical proof of something is without a doubt multipurpose.
Tangibles give you the client evidence of the standard of assistance.
International Journal of Management, Technology, and Social
Sciences (IJMTS), ISSN: 2581-6012, Vol. 5, No. 2, October
2020 Year.
SRINIVAS
PUBLICATION
Rangaraju K, et al, (2020); www.srinivaspublication.com
PAGE 219
2. STATEMENT OF THE PROBLEM:
SME’s in the automobile industry plays a key role in the development of automobile companies across
the country. Though the companies have limited employees they try to satisfy the need of automobile
companies in a faster and effective way. Sometimes there may be a lag towards satisfying the vendor
needs and all those activities are governed by employees working in large scale companies as they do
have good connectivity with their vendors. Hence the study is conducted based on the following
problems,
• Whether the companies who outsource their job orders to SME’s are satisfied based on the service
quality provided by SME’s?
• What is the perception of employees who work in large scale automobile companies towards the
quality of service provided by suppliers?
• Do service quality provided by the suppliers have an impact on the affective commitment of
suppliers?
3. OBJECTIVES OF THE STUDY:
• To examine the essential dimensions of service quality and its impact towards i.e. RATER-
Reliability, assurance, tangibles, empathy and responsiveness of SME’s in the automobile industry
and its effect on customer satisfaction.
• To analyse the level of perception of the employees towards the quality of suppliers.
• To find out the impact of the quality of service towards the affective commitment of suppliers.
4. SCOPE OF STUDY:
The scope of this research is to identify the service quality of SME’s in the automobile industry. The
study will help the SME’s in the automobile industry to know about the quality of service provided to
their vendor companies to rectify their errors in the future period of time.
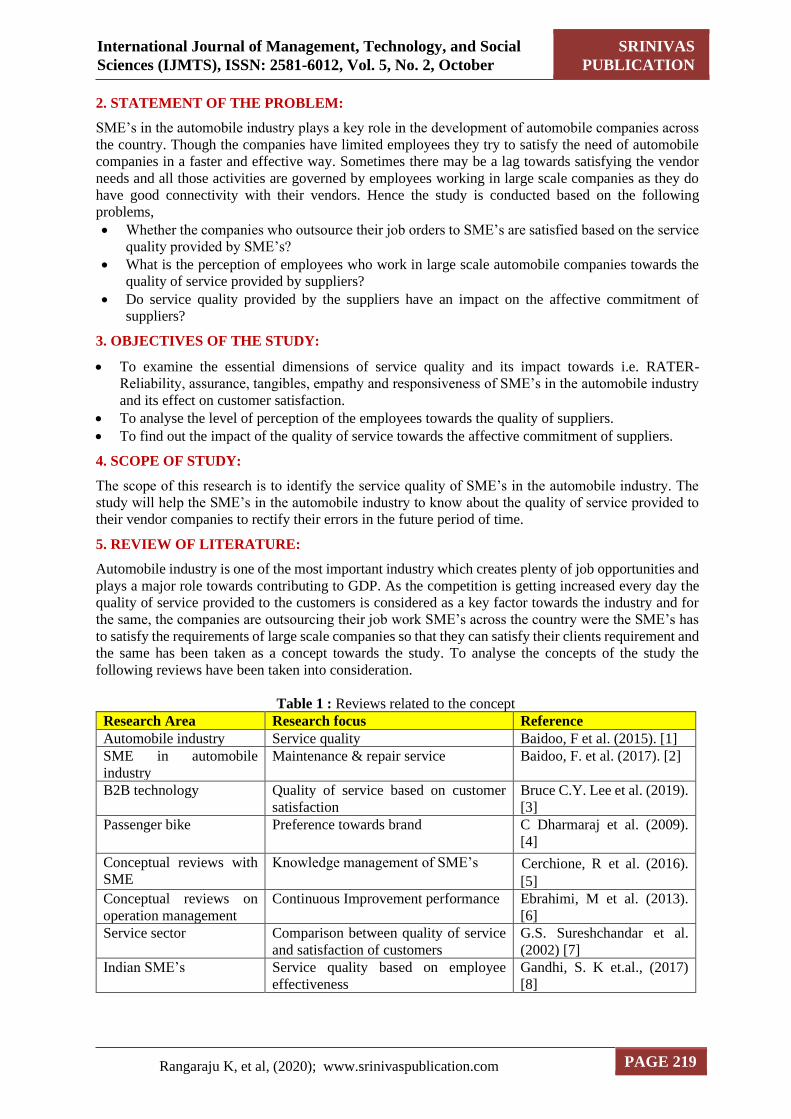
5. REVIEW OF LITERATURE:
Automobile industry is one of the most important industry which creates plenty of job opportunities and
plays a major role towards contributing to GDP. As the competition is getting increased every day the
quality of service provided to the customers is considered as a key factor towards the industry and for
the same, the companies are outsourcing their job work SME’s across the country were the SME’s has
to satisfy the requirements of large scale companies so that they can satisfy their clients requirement and
the same has been taken as a concept towards the study. To analyse the concepts of the study the
following reviews have been taken into consideration.
Table 1 : Reviews related to the concept
Research Area Research focus Reference
Automobile industry Service quality Baidoo, F et al. (2015). [1]
SME in automobile
industry
Maintenance & repair service Baidoo, F. et al. (2017). [2]
B2B technology Quality of service based on customer
satisfaction
Bruce C.Y. Lee et al. (2019).
[3]
Passenger bike Preference towards brand C Dharmaraj et al. (2009).
[4]
Conceptual reviews with
SME
Knowledge management of SME’s Cerchione, R et al. (2016).
[5]
Conceptual reviews on
operation management
Continuous Improvement performance Ebrahimi, M et al. (2013).
[6]
Service sector Comparison between quality of service
and satisfaction of customers
G.S. Sureshchandar et al.
(2002) [7]
Indian SME’s Service quality based on employee
effectiveness
Gandhi, S. K et.al., (2017)
[8]
International Journal of Management, Technology, and Social
Sciences (IJMTS), ISSN: 2581-6012, Vol. 5, No. 2, October
2020 Year.
SRINIVAS
PUBLICATION
Rangaraju K, et al, (2020); www.srinivaspublication.com
PAGE 220
Indian Small-Scale
industry
Employee service quality Gandhi, S et.al., (2018) [9]
Global market
segmentation
Perceived service quality James Agarwal et.al., (2010)
[10]
Automobile industry Effectiveness of TQM Kalra, N et.al., (2013) [11]
Thai retail stores Vision effects Kantabutra Sooksan (2008)
[12]
SME Service fusion Kowalkowski, C et.al.,
(2013) [13]
Auto component with
SME in Bangalore
Influence of Technology innovation on
growth
Krishnaswamy, K. N et.al.,
(2014) [14]
Retail stores Efficiency based on benchmarking
schemes
Mishra Kumar Rohit (2014)
[15]
SME Role of satisfaction, quality of service
and trust
Rajic, T C et.al., (2016) [16]
SME in Iran Determinants of TQM and quality of
service
Ramezani, H et.al., (2013)
[17]
Quality of service Service quality in B2B Spiros Gounaris (2005) [18]
SME Retail mix and quality of service
influence towards satisfaction
Subroto Budiarto et.al.,
(2008) [19]
SME automobile industry SMEs and Entrepreneurship Tangkitvanich, S. (2004)
[20]
Indian SME’s Implementation of lean green practices Thanki, S (2006) [21]
Business process
Management
Alternates for satisfaction and quality of
service
V. Kumar et.al., (2008) [22]
SME’s in Srilanka Business performance and quality of
service
Wijetunge, W. A. D. S.
(2016) [23]
6. RESEARCH METHODOLOGY:
Type of research: The study which is carried out in the research is descriptive research whereby a lot
of research is conducted on the service management of the automobile industry.
Data collection:
Primary data: The primary data was collected using the survey method and the respondents are those
who are SME’s doing business in the automobile industry and employees who are working with large
scale companies in the automobile industry.
Secondary data: It was collected from journals and websites to know the concepts related to the study
and to frame the conceptual framework of the study.
Sampling size:
A total of 50 companies who do get service from SME’s were targeted and 110 employees who are
working with those companies were taken as samples towards analyzing the commitment of suppliers.
Sampling design:
The samples were collected across Tamilnadu and they are as follows,
Table 2: Sampling design of the study
District No of companies No of employees
Coimbatore 10 23
Madurai 6 17
Chennai 24 48
Hosur 10 22
Total 50 110
International Journal of Management, Technology, and Social
Sciences (IJMTS), ISSN: 2581-6012, Vol. 5, No. 2, October
2020 Year.
SRINIVAS
PUBLICATION
Rangaraju K, et al, (2020); www.srinivaspublication.com
PAGE 221
Reliability Statistics:
Table 3: Reliability of the study
Dimension N of Items Cronbach's Alpha
Tangibility 4 .784
Reliability 5 .845
Responsiveness 6 .804
Assurance 5 .728
Empathy 3 .784
A total of 10 samples were across all the districts taken for the study to check the reliability of the
dimensions used for the study where the reliability for all the dimensions was greater than 0.7 which
shows that the factors are reliable and can be proceeded further.
Tools used for the study: Frequency analysis, Descriptive statistic, Kruskal Wallis test, One-way
Anova, and Multiple regression.
7. LIMITATIONS OF THE STUDY:
• Conclusions and recommendations are based on such limited data.
• Respondent’s biases may be one of the factors which limit the study.
8. ANALYSIS AND INTERPRETATION PERCEPTION OF COMPANIES TOWARDS
THEIR VENDORS:
Table 4: Type of Suppliers
Frequency Percent
New vendors 35 70.0
Existing vendors 15 30.0
Total 50 100.0
Out of 50 respondents 70.0% are new vendors, 30.0% are existing vendors.
Chart 2: Type of Suppliers
0
20
40
60
80
New vendors Existing vendors
Pe
rce
nt
Type of Suppliers
International Journal of Management, Technology, and Social
Sciences (IJMTS), ISSN: 2581-6012, Vol. 5, No. 2, October
2020 Year.
SRINIVAS
PUBLICATION
Rangaraju K, et al, (2020); www.srinivaspublication.com
PAGE 222
Table 5: No of years of having a relationship with Suppliers
Particulars Frequency Percent
1-3 years 1 2.7
4-6 years 18 36.7
7-9 years 16 31.3
More than 9 years 15 29.3
Total 50 100.0
2.7% are having between 1-3 years of relationship, 36.7% are having 4-6 years of relationship, 31.3%
are having 7-9 years of relationship, 29.3% are having more than 9 years of relationship.
Chart no 3: No of years having a relationship with Suppliers
Table 6: Suppliers sales and service network better than competitor
Frequency Percent
Yes 8 15.3
No 18 36.0
Can be improved 24 48.7
Total 50 100.0
15.3% said Yes, 36.0% said No, and 48.7% said can be improved.
Chart no 4: Suppliers sales and service network better than competitor
05
10152025303540
1-3 years 4-6 years 7-9 years More than 9years
2.7
36.7
31.3 29.3
Pe
rce
nt
No of years having relationship with Suppliers
15.3
36
48.7
Suppliers sales and service network better than competitor
Yes
No
Can be improved
International Journal of Management, Technology, and Social
Sciences (IJMTS), ISSN: 2581-6012, Vol. 5, No. 2, October
2020 Year.
SRINIVAS
PUBLICATION
Rangaraju K, et al, (2020); www.srinivaspublication.com
PAGE 223
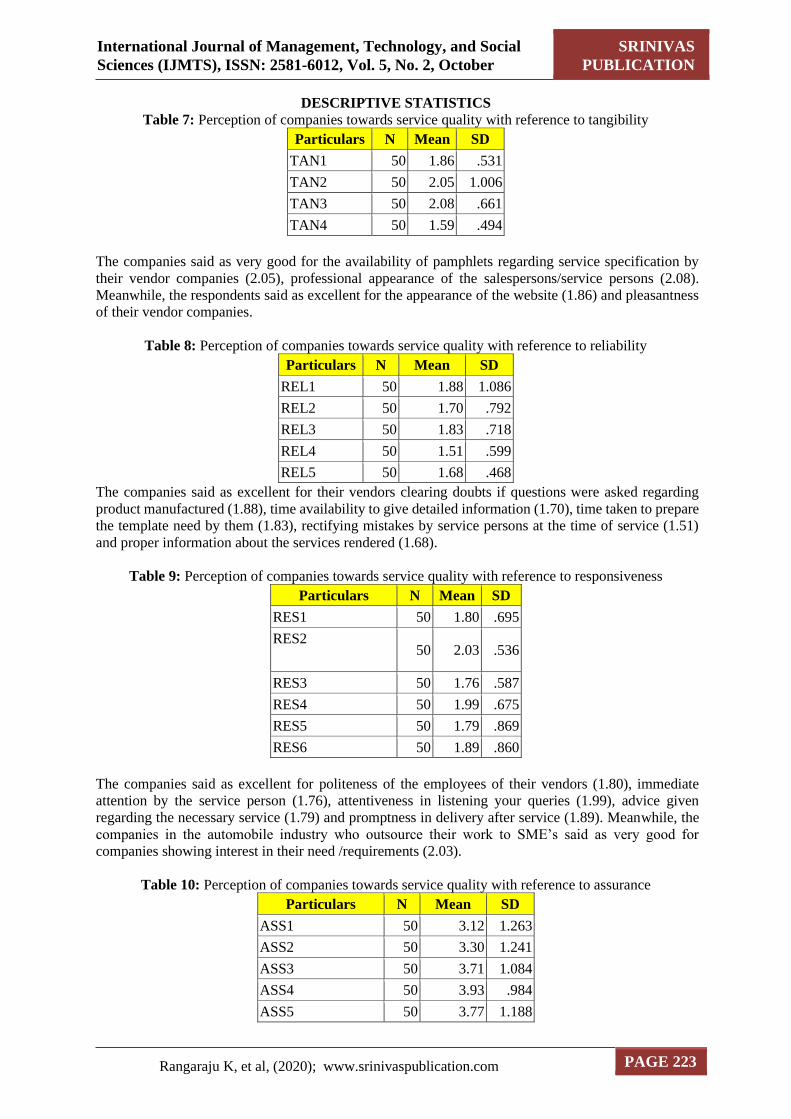
DESCRIPTIVE STATISTICS
Table 7: Perception of companies towards service quality with reference to tangibility
Particulars N Mean SD
TAN1 50 1.86 .531
TAN2 50 2.05 1.006
TAN3 50 2.08 .661
TAN4 50 1.59 .494
The companies said as very good for the availability of pamphlets regarding service specification by
their vendor companies (2.05), professional appearance of the salespersons/service persons (2.08).
Meanwhile, the respondents said as excellent for the appearance of the website (1.86) and pleasantness
of their vendor companies.
Table 8: Perception of companies towards service quality with reference to reliability
Particulars N Mean SD
REL1 50 1.88 1.086
REL2 50 1.70 .792
REL3 50 1.83 .718
REL4 50 1.51 .599
REL5 50 1.68 .468
The companies said as excellent for their vendors clearing doubts if questions were asked regarding
product manufactured (1.88), time availability to give detailed information (1.70), time taken to prepare
the template need by them (1.83), rectifying mistakes by service persons at the time of service (1.51)
and proper information about the services rendered (1.68).
Table 9: Perception of companies towards service quality with reference to responsiveness
Particulars N Mean SD
RES1 50 1.80 .695
RES2 50 2.03 .536
RES3 50 1.76 .587
RES4 50 1.99 .675
RES5 50 1.79 .869
RES6 50 1.89 .860
The companies said as excellent for politeness of the employees of their vendors (1.80), immediate
attention by the service person (1.76), attentiveness in listening your queries (1.99), advice given
regarding the necessary service (1.79) and promptness in delivery after service (1.89). Meanwhile, the
companies in the automobile industry who outsource their work to SME’s said as very good for
companies showing interest in their need /requirements (2.03).
Table 10: Perception of companies towards service quality with reference to assurance
Particulars N Mean SD
ASS1 50 3.12 1.263
ASS2 50 3.30 1.241
ASS3 50 3.71 1.084
ASS4 50 3.93 .984
ASS5 50 3.77 1.188
International Journal of Management, Technology, and Social
Sciences (IJMTS), ISSN: 2581-6012, Vol. 5, No. 2, October
2020 Year.
SRINIVAS
PUBLICATION
Rangaraju K, et al, (2020); www.srinivaspublication.com
PAGE 224
The customers of the companies said as good for courtesy in servicing by the companies (3.12),
inspecting the products (3.30), technical knowledge of service persons (3.71), usage of modern
technology in servicing (3.93) and hospitality provided by the companies (3.93).
Table 11: Perception of companies towards service quality with reference to empathy
Particulars N Mean SD
EMP1 50 1.59 .803
EMP2 50 1.90 .775
EMP3 50 1.54 .609
The companies said as excellent for companies providing prior information about the service changes
(1.59), explanation of the service provided (1.90) and reminder for renewal of service (1.54).
Ho1: Type of vendor has no relation with suppliers and degree of satisfaction towards services of the
companies
Table 12: Comparison between type of vendor with suppliers and degree of satisfaction towards
services of the companies
companies
Dimension Type of vendor N Mean Rank Chi-Square Asymp. Sig.
Tangibility
New vendor 35 75.16 0.023 0.880
Existing vendor 15 76.29
Total 50
Reliability
New vendor 35 74.57 0.168 0.682
Existing vendor 15 77.68
Total 50
Responsiveness
New vendor 35 76.00 0.047 0.828
Existing vendor 15 74.34
Total 50
Assurance
New vendor 35 73.48 0.776 0.378
Existing vendor 15 80.22
Total 50
Empathy
New vendor 35 73.10 1.112 0.292
Existing vendor 15 81.09
Total 50
Social Responsibility
New vendor 35 70.97 4.381 0.036
Existing vendor 15 86.07
Total 50
There is no relationship between Tangibility (0.880), Reliability (0.682), Responsiveness (0.828),
Assurance (0.378) and Empathy (0.292) and degree of satisfaction towards services of the companies.
There is a relationship between Social Responsibility (0.036) and degree of satisfaction towards services
of the companies.
ONEWAY ANOVA
H02: There is a significant difference between no of years having a relationship with Suppliers and
degree of satisfaction towards services of the companies.
International Journal of Management, Technology, and Social
Sciences (IJMTS), ISSN: 2581-6012, Vol. 5, No. 2, October
2020 Year.
SRINIVAS
PUBLICATION
Rangaraju K, et al, (2020); www.srinivaspublication.com
PAGE 225
Table 13: Comparison between no of years having a relationship with suppliers and the degree of
satisfaction towards services of the companies
Dimension No of years N Mean SD F Sig
Tangibility
1-3 years 4 2.75 0.000
4.204 0.007
4-6 years 55 1.82 0.593
7-9 years 47 1.96 0.401
More than 9 years 44 1.84 0.586
Total 50 1.89 0.548
Reliability
1-3 years 4 2.80 0.000
5.680 0.001
4-6 years 55 1.75 0.640
7-9 years 47 1.58 0.436
More than 9 years 44 1.75 0.642
Total 50 1.72 0.603
Responsiveness
1-3 years 4 2.67 0.000
4.994 0.003
4-6 years 55 1.75 0.568
7-9 years 47 1.88 0.396
More than 9 years 44 1.96 0.511
Total 50 1.88 0.515
Assurance
1-3 years 4 2.80 0.000
1.764 0.157
4-6 years 55 3.56 0.738
7-9 years 47 3.51 0.815
More than 9 years 44 3.70 0.841
Total 50 3.57 0.803
Empathy
1-3 years 4 2.33 0.000
2.501 0.062
4-6 years 55 1.72 0.564
7-9 years 47 1.58 0.567
More than 9 years 44 1.67 0.516
Total 50 1.68 0.554
Social Responsibility
1-3 years 4 1.50 0.000
0.184 0.907
4-6 years 55 1.75 0.775
7-9 years 47 1.72 0.666
More than 9 years 44 1.74 0.544
Total 50 1.73 0.665
There is no significant difference between Tangibility (0.007), Reliability (0.001), and Responsiveness
(0.003) and degree of satisfaction towards the services of the companies. There is a significant difference
between Assurance (0.157), Empathy (0.062), and Social Responsibility (0.907) and degree of
satisfaction towards services of the companies.
Tangibility:
The respondents who are having 1-3 years of relationship (2.75) said very good, and who are having 4-
6 years (1.82), having 7-9 years (1.96), having More than 9 years (1.84) of relationship said Excellent
on the degree of satisfaction towards services of the companies.
Reliability:
International Journal of Management, Technology, and Social
Sciences (IJMTS), ISSN: 2581-6012, Vol. 5, No. 2, October
2020 Year.
SRINIVAS
PUBLICATION
Rangaraju K, et al, (2020); www.srinivaspublication.com
PAGE 226
The respondents who are having 1-3 years of relationship (2.80) said very good, and who are having 4-
6 years (1.75), having 7-9 years (1.58), having More than 9 years (1.75) of relationship said Excellent
on the degree of satisfaction towards services of the companies.
Responsiveness:
The respondents who are having 1-3 years of relationship (2.67) said very good, and who are having 4-
6 years (1.75), having 7-9 years (1.88), having More than 9 years (1.96) of relationship said Excellent
on the degree of satisfaction towards services of the companies.
PERCEPTION OF EMPLOYEE TOWARDS SERVICE PROVIDED BY SUPPLIERS
Table 14: Age of the respondents
Particulars Frequency Percent
Male 65 59.1
Female 15 40.9
Total 110 100.0
59.1% are male, and 40.9% are female. It shows that most of the respondents are male gender.
Chart no 5: Gender of the respondents
Table 15: Age of the employees
Particulars Frequency Percent
20-30 years 12 10.9
31-40 years 24 21.8
41-50 years 34 30.9
Above 50 years 40 36.4
Total 110 100.0
10.9% are between 20 to 30 years, 21.8% are between 31-40 years, 30.9% are between 41-50 years, and
36.4% are above 50 years. It shows that most of the respondents are from the age are above 50 years.
International Journal of Management, Technology, and Social
Sciences (IJMTS), ISSN: 2581-6012, Vol. 5, No. 2, October
2020 Year.
SRINIVAS
PUBLICATION
Rangaraju K, et al, (2020); www.srinivaspublication.com
PAGE 227
Chart no 6: Age of the respondents
Table 16: Prefer current suppliers
Particulars N Mean SD
SUP1 110 2.15 1.35
SUP2 110 1.54 .501
SUP3 110 2.46 .738
SUP4 110 3.11 1.061
SUP5 110 2.83 1.374
SUP6 110 3.17 1.233
SUP7 110 3.21 1.212
The respondents agree that current suppliers produces good looking products (2.15), suppliers produce
clean products (2.46), and also current suppliers produce a wide variety of products (2.83), employees
strongly agree that suppliers produce fresh products (1.54), respondents disagree towards the constant
supply of produces throughout the year (3.11), suppliers produce are safe (3.17), and also towards the
delivery of produces to their current outlet (3.21).
Table 17: Contact with current suppliers
Particulars N Mean SD
CON1 110 3.35 1.359
CON2 110 3.39 1.257
CON3 110 3.43 1.207
CON4 110 3.17 1.132
CON5 110 3.66 1.350
CON6 110 3.22 1.120
The respondents disagree towards current suppliers known source of their produces (3.35), taking
responsibility if produces has any problem (3.39), grading and packing of their produce (3.43),
washing/peeling/cutting of their produces (3.17), having a long-term contract with current suppliers
(3.66), and also towards the need of more qualified suppliers (3.22).
Ho3: There is a significant difference between the age of the respondents and the Preference for current
suppliers and Contact with current suppliers by employees
International Journal of Management, Technology, and Social
Sciences (IJMTS), ISSN: 2581-6012, Vol. 5, No. 2, October
2020 Year.
SRINIVAS
PUBLICATION
Rangaraju K, et al, (2020); www.srinivaspublication.com
PAGE 228
Table 18: Comparison between age and level of acceptance towards the preference on current
suppliers and contact with current suppliers by employees
Particulars Age N Mean SD F Sig
Prefer current suppliers
20-30 years 12 2.50 0.358
2.729 0.048
31-40 years 24 2.61 0.424
41-50 years 34 2.65 0.437
Above 50 years 40 2.81 0.308
Total 110 2.68 0.392
Contact with current
suppliers
20-30 years 12 3.13 0.742
6.395 0.001
31-40 years 24 3.13 0.567
41-50 years 34 3.33 0.414
Above 50 years 40 3.63 0.436
Total 110 3.37 0.536
There is no significant difference between Preference on current suppliers (0.048), and Contact with
current suppliers (0.001) by employees.
Ho4: There is no relationship between gender and level of acceptance towards the Preference on current
suppliers and Contact with current suppliers by employees.
Table 19: Comparison between gender and level of acceptance towards the Preference on current
suppliers and Contact with current suppliers by employees
Particulars Gender N Mean Rank Chi-Square Asymp. Sig
Prefer current suppliers Male 65 54.89 0.058 0.809
Female 15 56.38
Total 110
Contact with current
suppliers
Male 65 57.56 0.674 0.412
Female 15 52.52
Total 110
There is no relationship between Preference on current suppliers (0.809), and Contact with current
suppliers (0.412) by employees.
The chart 7 describes that when analysing the service quality of the companies and preference towards
current suppliers were the factors reliability (.220), responsiveness (.422), assurance (.018) are directly
having relationship and impact on preference towards current suppliers. Meanwhile, the dimensions
tangibility (.057) and reliability (.609) are directly having a relationship and impact on contact with
current suppliers.
9. FINDINGS:
PERCEPTION OF VENDOR TOWARDS SERVICE QUALITY PROVIDED BY SUPPLIERS
• Most of the respondents are new vendors.
• Maximum of the respondents are having 4-6 years of relationship with Suppliers.
• Most of the respondents got the reference to Suppliers through friends.
• Maximum of the respondents said that Suppliers sales and service networks can be improved
better than their competitors in Coimbatore.
• Maximum of the respondents said as no to continue their service with Suppliers.
International Journal of Management, Technology, and Social
Sciences (IJMTS), ISSN: 2581-6012, Vol. 5, No. 2, October
2020 Year.
SRINIVAS
PUBLICATION
Rangaraju K, et al, (2020); www.srinivaspublication.com
PAGE 229
• Most of the respondents said yes they will recommend Suppliers to friends & relatives.
• Maximum of the respondents are Neutral on their Satisfaction towards getting orders from the
global market.
• Most of the respondents are dissatisfied with the satisfaction level in helping the vendors for
promoting the product based on their scheme.
The vendors of the companies said as very good for the availability of pamphlets regarding service
specification, professional appearance of the salespersons/service persons. Meanwhile, the respondents
said as excellent for the appearance of the website and pleasantness
The vendors of the companies said as excellent for companies clearing doubts, time availability to give
detailed information, Time taken to prepare the template, rectifying mistakes by service persons and
proper information about the services rendered.
MULTIPLE REGRESSION
Chart 7: Comparison between service quality of the companies and perception of employees towards
suppliers
The vendors of the companies said as excellent for the politeness of the employees, immediate attention
by the service person, attentiveness in listening to your queries, Advice given regarding the necessary
service and promptness in delivery after service. Meanwhile, the vendors of Suppliers said as very good
for companies showing interest in vendors’ needs/requirements.
The vendors of the companies said as good for courtesy in servicing by the companies, inspecting the
products, technical knowledge of service persons, usage of modern technology in servicing and
hospitality provided by the companies.
The vendors of the companies said as excellent for companies providing prior information about the
service changes, Explanation of the service provided and reminder for renewal of service.
The vendors of the companies said as excellent for the cost of service of the companies and after service
performance of the products of the companies.
International Journal of Management, Technology, and Social
Sciences (IJMTS), ISSN: 2581-6012, Vol. 5, No. 2, October
2020 Year.
SRINIVAS
PUBLICATION
Rangaraju K, et al, (2020); www.srinivaspublication.com
PAGE 230
The respondents who are Existing vendors have a higher level of acceptance towards the degree of
satisfaction towards the services of the companies.
Tangibility:
The respondents who are having 1-3 years of relationship said very good, and who are having 4-6 years,
having 7-9 years, having More than 9 years of relationship said Excellent on the degree of satisfaction
towards services of the companies.
Reliability:
The respondents who are having 1-3 years of relationship said very good, and who are having 4-6 years,
having 7-9 years, having More than 9 years of relationship said Excellent on the degree of satisfaction
towards services of the companies.
Responsiveness:
The respondents who are having 1-3 years of relationship said very good, and who are having 4-6 years,
having 7-9 years, having More than 9 years of relationship said Excellent on the degree of satisfaction
towards services of the companies.
10. PERCEPTION OF EMPLOYEE TOWARDS SERVICE PROVIDED BY SUPPLIERS :
• Most of the respondents are male gender.
• Most of the respondents are married.
• Most of the respondents are from the age are above 50 years.
The respondents agree that current suppliers produce good looking products, suppliers produce clean
products, and also current suppliers produces wide variety of products, employees strongly agree that
suppliers produce fresh products, respondents disagree towards constant supply of produces throughout
the year, suppliers produce are safe, and also towards delivery of produces to their current outlet.
The respondents disagree towards current suppliers known source of their produces, taking
responsibility if produces has any problem, grading and packing of their produces,
washing/peeling/cutting of their produces, having a long-term contract with current suppliers, and also
towards need of more qualified suppliers.
Prefer current suppliers:
The respondents who are in the age group between 20-30 years, age group between 31-40 years, age
group between 41-50 years, and above 50 years agree towards Preference on current suppliers by
employees.
Contact with current suppliers:
The respondents who are in the age group between 20-30 years, age group between 31-40 years, age
group between 41-50 years, and above 50 years disagree towards Contact with current suppliers by
employees.
Contact with current suppliers:
The respondents who are male (57.56) have a higher level of acceptance towards the Preference on
current suppliers and Contact with current suppliers by employees.
The factors reliability, responsiveness, assurance are directly having a relationship and impact on
preference towards current suppliers. Meanwhile, the dimensions tangibility and reliability are directly
having a relationship and impact on contact with current suppliers.
11. SUGGESTIONS:
• Sales and operations planning must span the entire chain to detect early warning signals of changing
demand in ordering patterns, vendor promotions, and so forth. This demand-intensive approach
leads to more consistent forecasts and optimal resource allocation.
International Journal of Management, Technology, and Social
Sciences (IJMTS), ISSN: 2581-6012, Vol. 5, No. 2, October
2020 Year.
SRINIVAS
PUBLICATION
Rangaraju K, et al, (2020); www.srinivaspublication.com
PAGE 231
• By working closely with their key suppliers to reduce the overall costs of owning materials and
services, supply-chain management leaders enhance margins both for themselves and their
suppliers.
• Vendors Feedback has to be collected in order to know the strong and weak areas in their service
which will help them to correct and function well in the future.
• The dimensional factors level of acceptance towards sourcing product from a limited number of
suppliers, level of acceptance towards establishing clear criteria and level of acceptance towards
Suppliers collaborating with suppliers in materials are taken for decision making process of the
study.
12. CONCLUSION:
The conclusion is that dimensional factors level of acceptance towards sourcing products from a limited
number of suppliers, level of acceptance towards establishing clear criteria, and level of acceptance
towards Suppliers collaborating with suppliers in materials are taken for decision making process of the
study. It also reveals that while taking decisions on these dimensions the factor frequency of making
supply should be taken for decision making process of the study.
REFERENCES:
[1] Baidoo, F., & Odum-Awuakye, G. A. (2015). Influence of Service Quality Delivery in the SMEs of
The Motor Vehicle Repair Service Industry in Ghana. African Journal of Applied Research (AJAR),
1(1), 440-452.
[2] Baidoo, F., & Odum-Awuakye, G. A. (2017). Assessing customer satisfaction levels in the SMEs
automobile vehicle maintenance and repairs service delivery system in Cape Coast–Ghana. African
Journal of Applied Research (AJAR), 3(1), 82-94.
[3] Bruce C.Y. Lee & Ching-Chin Chen et. al., (2019). The influence of service quality on customer
satisfaction and loyalty in B2B technology service industry. Total Quality Management & Business
Excellence, 30, 13-14.
[4] Dharmaraj, C. and J Clement Sudhahar (2009). Brand preference Factors of Passenger bike an
empirical assessment. The IUP Journal Management, 7(3), 19 – 33.
[5] Cerchione, R., Esposito, E., & Spadaro, M. R. (2016). A literature review on knowledge management
in SMEs. Knowledge Management Research & Practice, 14(2), 169-177.
[6] Ebrahimi, M., & Sadeghi, M. (2013). Quality management and performance: An annotated review.
International Journal of Production Research, 51(18), 5625-5643.
[7] Sureshchandar, G. S. Chandrasekharan Rajendran, Anantharaman, R. N. (2002). The relationship
between service quality and customer satisfaction – a factor specific approach. Journal of Services
Marketing, 16(4), 363 – 379.
[8] Gandhi, S. K., Sachdeva, A., & Gupta, A. (2017). Treat employees like customers for an achievement
culture: an intrinsic service quality perspective from Indian SMEs. Journal of Industrial
Engineering and Advances, 2(3), 1-10.
[9] Gandhi, S., Sachdeva, A., & Gupta, A. (2018). Developing a scale to measure employee service
quality in Indian SMEs. Management Science Letters, 8(5), 455-474.
[10] Agarwal, J., Malhotra, N. K., & Bolton, R. N. (2010). A cross-national and cross-cultural approach
to global market segmentation: An application using consumers’ perceived service quality. Journal
of International Marketing, 18(3), 18-40.
[11] Jayawardhena, C. (2018). Effects of retail employees’ behaviors on customers ‘service evaluation.
International Journal of Retail & Distribution Management, 39 (3), 203-217.
International Journal of Management, Technology, and Social
Sciences (IJMTS), ISSN: 2581-6012, Vol. 5, No. 2, October
2020 Year.
SRINIVAS
PUBLICATION
Rangaraju K, et al, (2020); www.srinivaspublication.com
PAGE 232
[12] Kalra, N., & Pant, A. (2013). TQM-A Management Philosophy in Indian Automobile Industry
(NCR). International Journal of Management (IJM), 4(6), 12-20.
[13] Kantabutra Sooksan. (2008), Vision Effects in Thai Retail Stores: Practical Implications.
International Journal of Retail & Distribution Management, 36(4), 323-342.
[14] Kowalkowski, C., Witell, L., & Gustafsson, A. (2013). Any way goes: Identifying value
constellations for service infusion in SMEs. Industrial Marketing Management, 42(1), 18-30.
[15] Krishnaswamy, K. N., Mathirajan, M., & Subrahmanya, M. B. (2014). Technological innovations
and its influence on the growth of auto component SMEs of Bangalore: A case study approach.
Technology in Society, 38, 18-31.
[16] Mishra Kumar Rohit (2014). Benchmarking Scheme for Retail Stores Efficiency. International
Journal of marketing Studies, 1(2), 131-150.
[17] Rajić, T., Nikolić, I., & Milošević, I. (2016). The antecedents of SMEs’ customer loyalty:
Examining the role of service quality, satisfaction and trust. Industrija, 44(3), 97-116.
[18] Ramezani, H., & Gharleghi, B. (2013). Determinants of the Total Quality Management
Implementation in SMEs in Iran (Case of Metal Industry). International Journal of Business and
Social Science, 4(16).
[19] Spiros Gounaris (2005). Measuring service quality in b2b services: an evaluation of the
SERVQUAL scale vis-a`-vis the INDSERV scale. Journal of Services Marketing, 19 (6),421–435.
[20] Subroto Budiarto and Putra Seven Freddy. (2008). The Influence of Retailing Mix and Service
Quality towards Customer Satisfaction and Their Impact to Behavioral Intentions. Journal of
Service Research, 8, 232-240.
[21] Tangkitvanich, S. (2004). SME development in Thailand’s automotive industry. Entrepreneurship
and SMEs in Southeast Asia, 206-220.
[22] Thanki, S., Govindan, K., & Thakkar, J. (2016). An investigation on lean-green implementation
practices in Indian SMEs using analytical hierarchy process (AHP) approach. Journal of Cleaner
Production, 135, 284-298.
[23] V. Kumar, P.A. Smart, H. Maddern, R.S. Maull, (2008). Alternative perspectives on service quality
and customer satisfaction: the role of BPM. International Journal of Service Industry Management,
19 (2), 176 – 187.
[24] Wijetunge, W. A. D. S. (2016). Service quality, competitive advantage and business performance
in service providing SMEs in Sri Lanka. International Journal of Scientific and Research
Publications, 6(7), 720-728.
********