Page 1
Regis UniversityePublications at Regis University
All Regis University Theses
Fall 2015
Effectiveness of User Centered Design forOptimizing an Electronic Documentation FormKaren L. Albrecht
Follow this and additional works at: https://epublications.regis.edu/theses
Part of the Nursing Commons
This Thesis - Open Access is brought to you for free and open access by ePublications at Regis University. It has been accepted for inclusion in All RegisUniversity Theses by an authorized administrator of ePublications at Regis University. For more information, please contact [email protected] .
Recommended CitationAlbrecht, Karen L., "Effectiveness of User Centered Design for Optimizing an Electronic Documentation Form" (2015). All RegisUniversity Theses. 802.https://epublications.regis.edu/theses/802
Page 2
Regis University Rueckert-Hartman College for Health Professions
Capstone/Thesis
Use of the materials available in the Regis University Capstone/Thesis Collection (“Collection”) is limited and restricted to those users who agree to comply with the following terms of use. Regis University reserves the right to deny access to the Collection to any person who violates these terms of use or who seeks to or does alter, avoid or supersede the functional conditions, restrictions and limitations of the Collection. The site may be used only for lawful purposes. The user is solely responsible for knowing and adhering to any and all applicable laws, rules, and regulations relating or pertaining to use of the Collection. All content in this Collection is owned by and subject to the exclusive control of Regis University and the authors of the materials. It is available only for research purposes and may not be used in violation of copyright laws or for unlawful purposes. The materials may not be downloaded in whole or in part without permission of the copyright holder or as otherwise authorized in the “fair use” standards of the U.S. copyright laws and regulations.
Disclaimer
Page 3
Effectiveness of User Centered Design for Optimizing an Electronic Documentation Form
Karen L. Albrecht
Submitted as Partial Fulfillment for the Doctor of Nursing Practice Degree
Regis University
August 8, 2015
`
Page 4
EFFECTIVENSS OF UCD FOR OPTIMIZING FORM
ii
Copyright © 2015 Karen Albrecht. All rights reserved. No part of this work may be reproduced,
stored in a retrieval system, or transmitted, in any form or by any means, electronic, mechanical,
photocopying, recording or otherwise, without the author’s prior written permission.
Page 5
EFFECTIVENSS OF UCD FOR OPTIMIZING FORM
iii
Effectiveness of User Centered Design for Optimizing an Electronic Documentation Form
Problem. The electronic form used by lactation consultants to document assessment findings,
interventions, plans and recommendations, did not meet user’s requirements.
Purpose: The purpose of this project was to evaluate the effect of optimization through a User
Centered Design (UCD) process on information quality, use and user satisfaction.
Goals. The goals were to provide information technology (IT) support for the organization’s
Baby Friendly initiative and to support collaborative, consistent messaging for breastfeeding
families which could, in turn, support exclusive breast milk feeding. Exclusive breast milk
feeding is a population health initiative that could positively impact the triple aim of better care,
lower costs and better health.
Objectives. Information quality, use and user satisfaction affect user adoption and acceptance of
IT solutions. The objective of this project was to test the effectiveness of UCD on optimization
by measuring the increase in information quality, use and user satisfaction after implementation
of an optimized electronic lactation assessment.
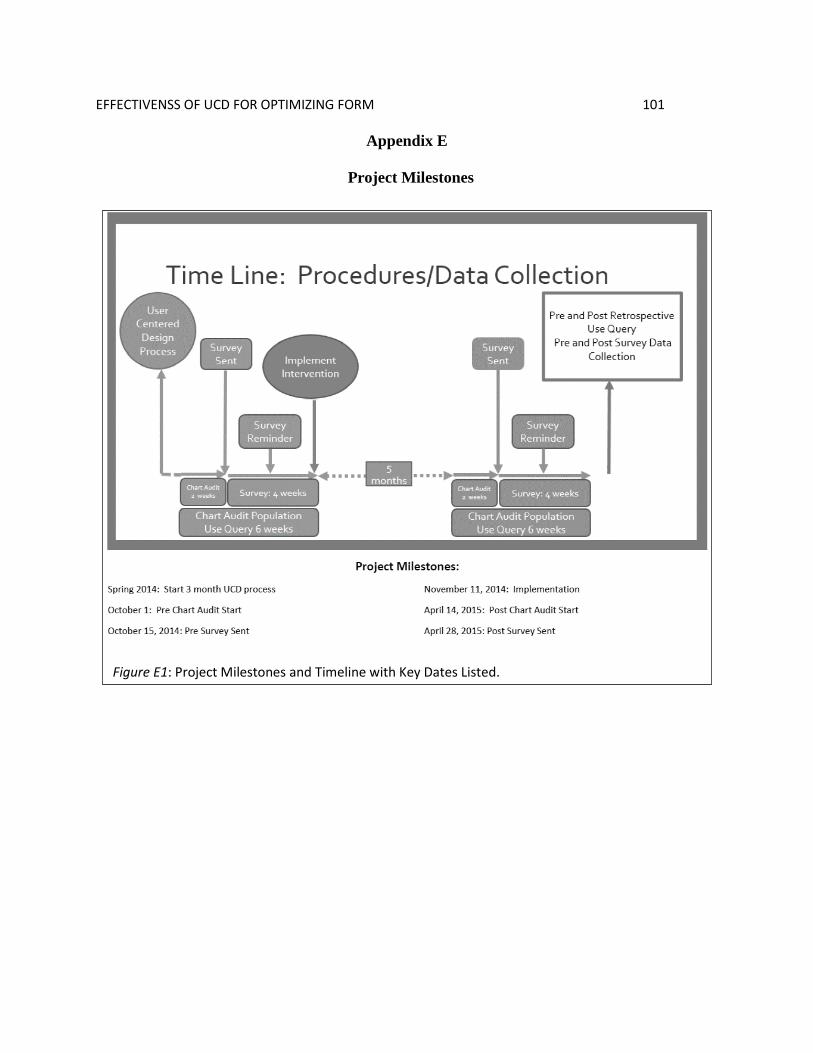
Plan. Stakeholders were identified and the electronic form was optimized through UCD. A pre-
test/post-test quasi-experimental design was chosen to measure the effect of optimization.
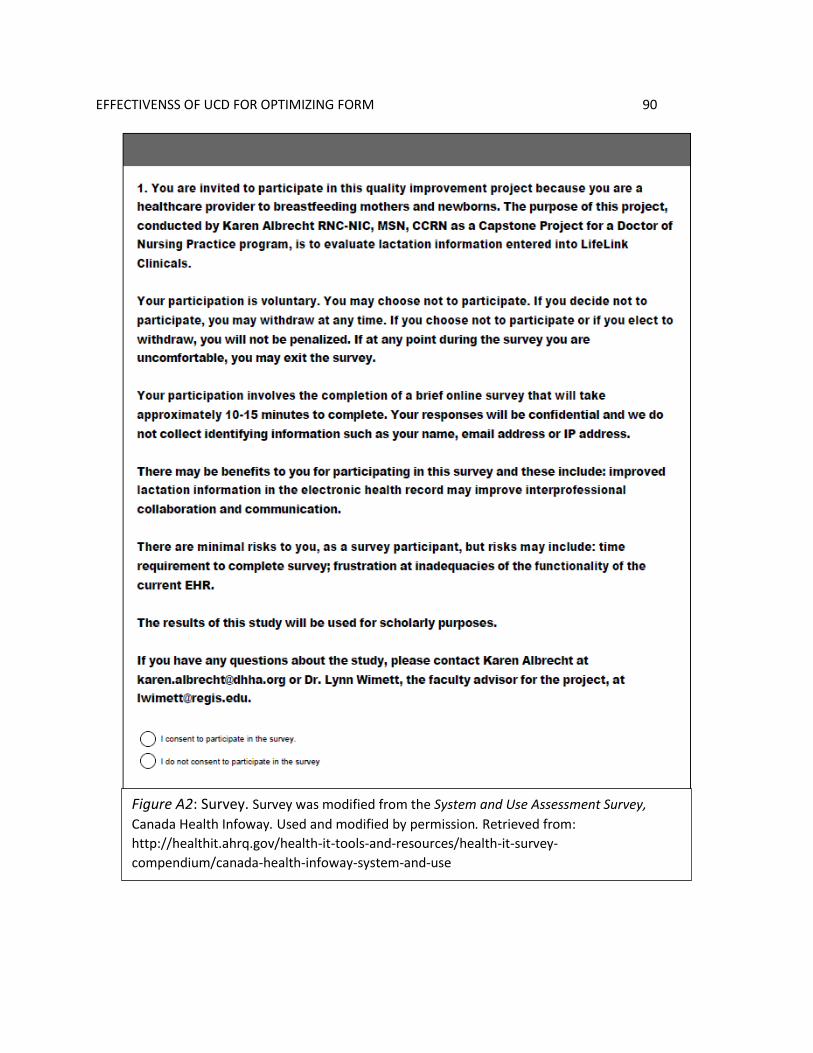
Instruments included a modified version of the System and Use Assessment Survey (AHRQ,
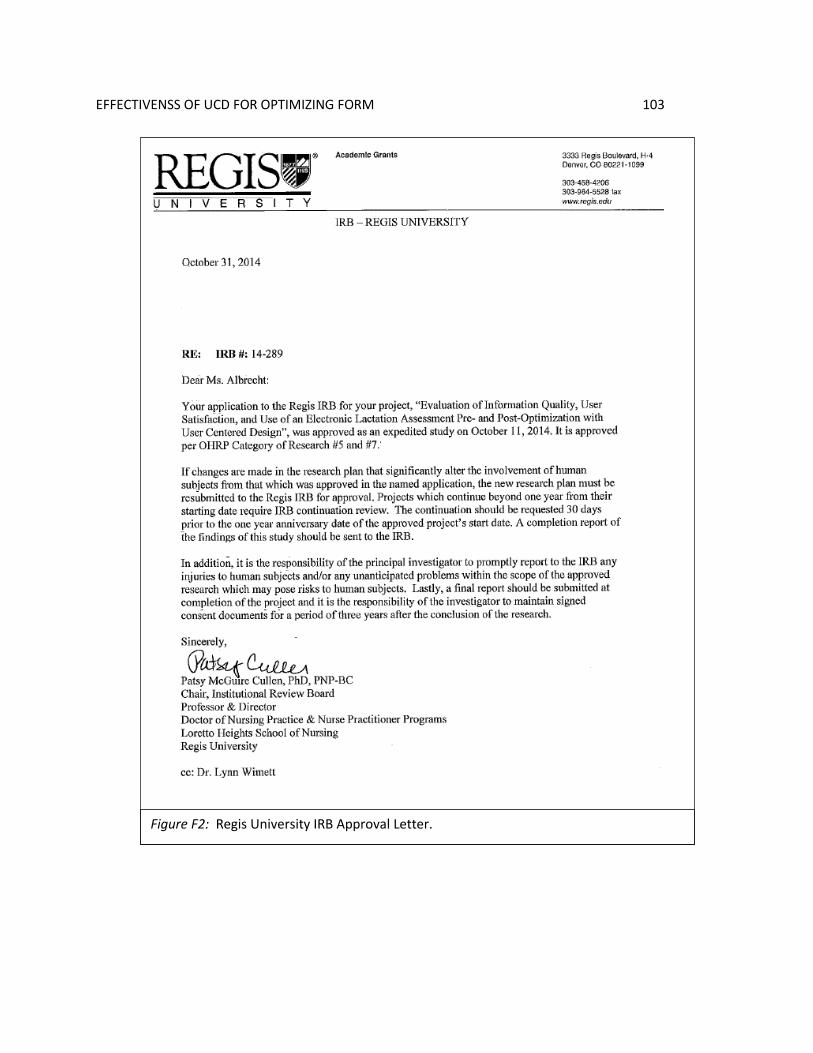
n.d.), a chart audit tool and an electronic data warehouse use query. IRB approval was obtained
from COMIRB and Regis University. The pre and post data collection periods were each six
weeks in length, allowing for a two week chart audit period and four week survey. The
intervention was implemented after the close of the pre-test period. Clinical users were educated
following the organization’s usual methods for EHR changes. Five months after the
intervention, the study timeline was repeated for the post-test period. After the post-test period, a
use query was run to collect data for both pre-test and post-test periods. Data were collected,
coded, and entered into electronic spreadsheets for storage and analysis.
Outcomes and Results. Although the sample as a whole showed no statistically significant
increases in any parameter of information quality, use, or user satisfaction, when survey
participants were divided by role, nurses and providers, there was a statistically significant
increase in the post-test nursing group for two measures of information quality and one measure
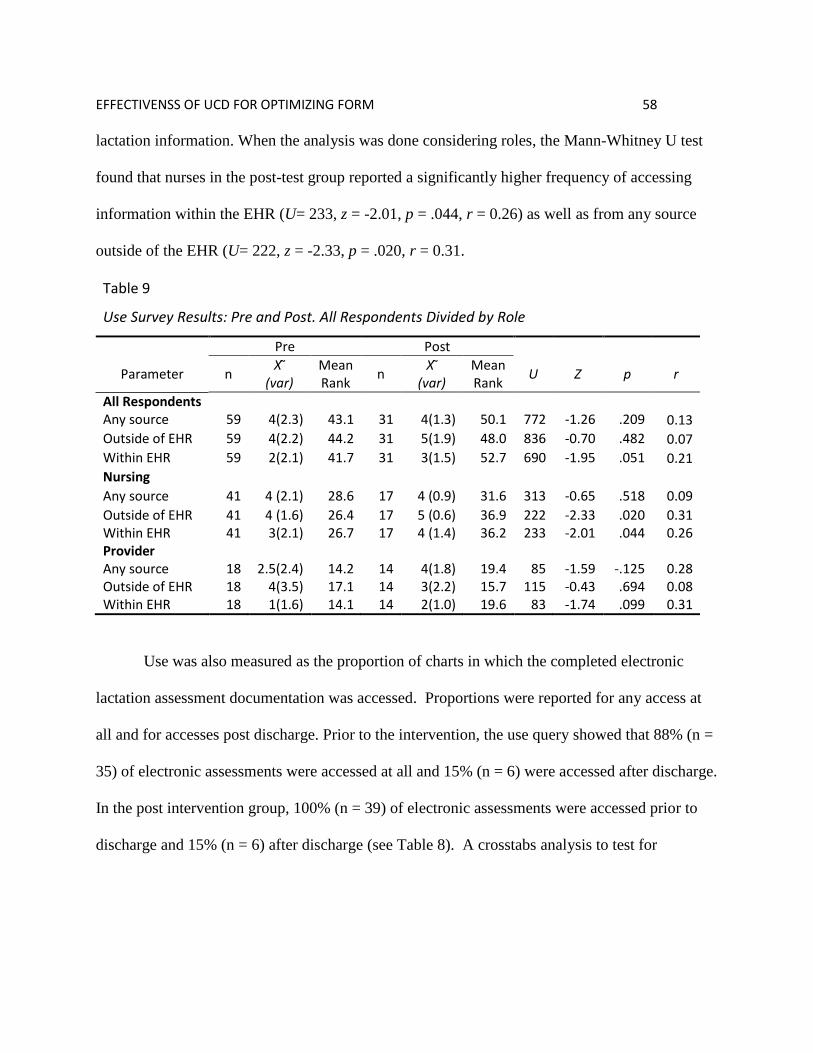
of information use. A Mann Whitney U test found a significantly higher perception of
completeness of the lactation assessment, U = 200, z = -2.11, p = .035, r = .29 and reported
frequency of accessing the lactation assessment from the EHR, U= 233, z = -2.01, p = .044, r =
0.26. A Fishers exact test found a statistically significant increase in the presence of lactation
assessments in the post- [1, N = 39] = 11.8, p =.001, φ= .39). The outcomes
may be explained by differences in how each role uses the EHR. Additional education for
providers may be necessary to overcome these differences.
Page 6
EFFECTIVENSS OF UCD FOR OPTIMIZING FORM
iv
Table of Contents
I. Preliminary Pages
A. Abstract .............................................................................................................. i
B. Copyright Page.................................................................................................. ii
C. Executive Summary ......................................................................................... iii
D. Table of Contents ............................................................................................. iv
E. List of Tables ................................................................................................... ix
F. List of Figure......................................................................................................x
G. List of Appendices ........................................................................................... xi
II. Problem Recognition and Definition ..........................................................................1
A. Project Purpose ..................................................................................................1
B. Problem Statement .............................................................................................2
C. PICO ..................................................................................................................2
D. Research Question .............................................................................................3
E. Project Significance, Scope and Rationale ........................................................3
i. Project Significance ...............................................................................3
ii. Scope ......................................................................................................4
iii. Rationale ................................................................................................4
F. Theoretical Framework and Conceptual Models ...............................................5
i. User Centered Design ............................................................................6
ii. Information Systems Success Model .....................................................7
Page 7
EFFECTIVENSS OF UCD FOR OPTIMIZING FORM
v
iii. Quality of Care Model ...........................................................................8
iv. Conceptual Model ................................................................................10
III. Review of Evidence .................................................................................................11
A. Background ......................................................................................................11
B. Systematic Review of the Literature ................................................................12
i. HIT Success .........................................................................................13
ii. Impact of Hit on Nursing .....................................................................16
iii. Nurses’ Attitude and Satisfaction ........................................................19
iv. Information Quality .............................................................................20
v. Usability ...............................................................................................23
IV. Project Plan and Evaluation .....................................................................................25
A. Market/Risk Analysis.......................................................................................25
i. Strategies, Weaknesses, Opportunities and Threats Analysis .............25
ii. Driving and Restraining Forces ...........................................................28
iii. Need, Resources, and Sustainability ....................................................28
iv. Feasibility, Risks and Unintended Consequences ...............................30
B. Stakeholders and Project Team ........................................................................30
C. Cost Benefit Analysis ......................................................................................30
D. Mission, Vision, Objectives and Goals ............................................................32
i. Project Mission ....................................................................................33
ii. Project Vision.......................................................................................33
Page 8
EFFECTIVENSS OF UCD FOR OPTIMIZING FORM
vi
iii. Project Objectives ................................................................................33
iv. Project Goals ........................................................................................34
E. Logic Model .....................................................................................................34
F. Design and Methodology .................................................................................35
i. Research Design...................................................................................35
ii. Timeline ...............................................................................................35
G. Population ........................................................................................................35
i. Human Subject Protection ...................................................................36
ii. Vulnerable Populations ........................................................................37
iii. HIPPA Compliance ..............................................................................37
iv. Setting ..................................................................................................37
H. Intervention ......................................................................................................39
i. User Centered Design Process39
I. Dependent Variables ........................................................................................40
J. Confounding Variables ....................................................................................41
K. Data Collection Instruments ............................................................................42
i. Survey ..................................................................................................43
ii. Use Query ............................................................................................45
iii. Chart Audit...........................................................................................45
L. Recruitment ......................................................................................................47
i. Power Analysis ....................................................................................48
Page 9
EFFECTIVENSS OF UCD FOR OPTIMIZING FORM
vii
ii. Sample Size ..........................................................................................48
iii. Sample Description ..............................................................................49
M. Implementation ................................................................................................51
N. Data Analysis Protocol ....................................................................................52
i. Data Collection Period .........................................................................52
ii. Missing Data ........................................................................................52
iii. Data Analysis .......................................................................................53
V. Project Findings and Results ....................................................................................54
A. Objective 1: Increase Information Quality ......................................................54
B. Objective 2: Increase Use ...............................................................................57
C. Objective 3: Increase User Satisfaction ..........................................................59
D. System Quality .................................................................................................60
E. Reliability and Validity of Findings ................................................................61
i. Methodology ........................................................................................61
ii. Sample..................................................................................................62
F. Discussion ........................................................................................................63
VI. Limitations, Recommendations, Implications for Change .......................................69
A. Limitations .......................................................................................................70
B. Recommendations ............................................................................................71
C. Implications......................................................................................................74
VII. References ................................................................................................................75
Page 10
EFFECTIVENSS OF UCD FOR OPTIMIZING FORM
viii
VIII. Appendices ...............................................................................................................88
Page 11
EFFECTIVENSS OF UCD FOR OPTIMIZING FORM
ix
List of Tables
I. SWOT Analysis: Strengths, Weaknesses, Opportunities and Threats .....................27
II. Project Expenses for Implementation and Evaluation .............................................29
III. Stakeholders and Project Team Role .......................................................................31
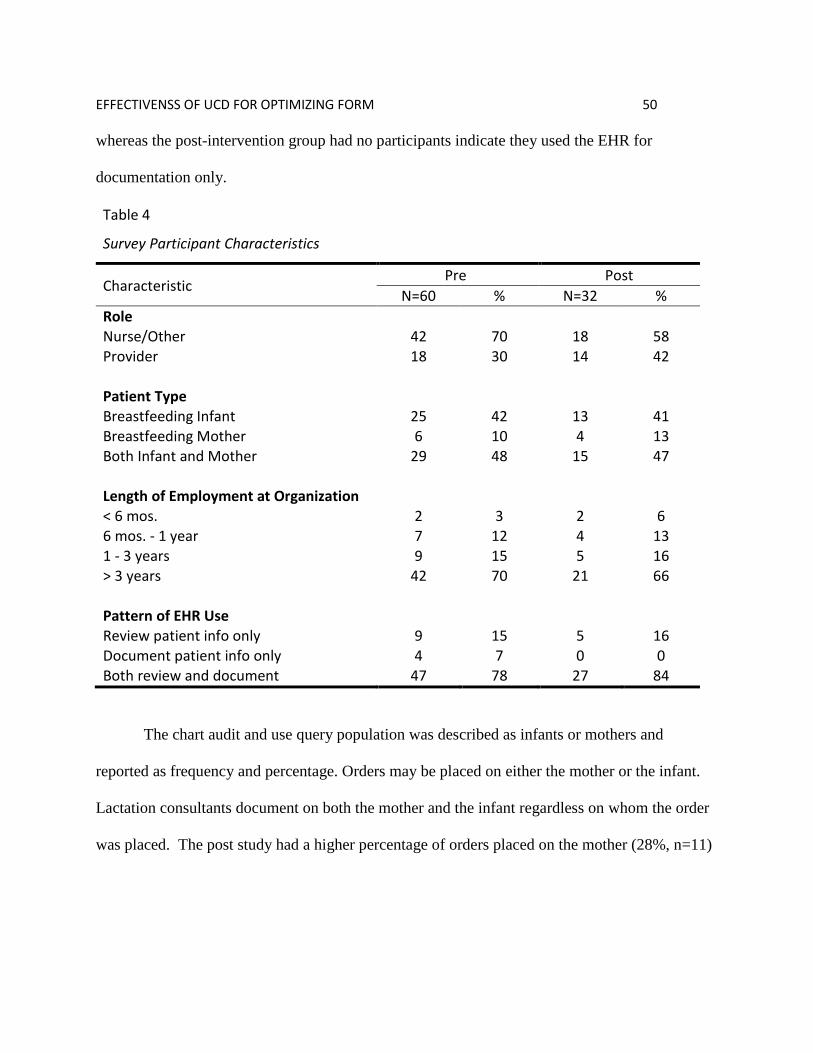
IV. Survey Participant Characteristics............................................................................50
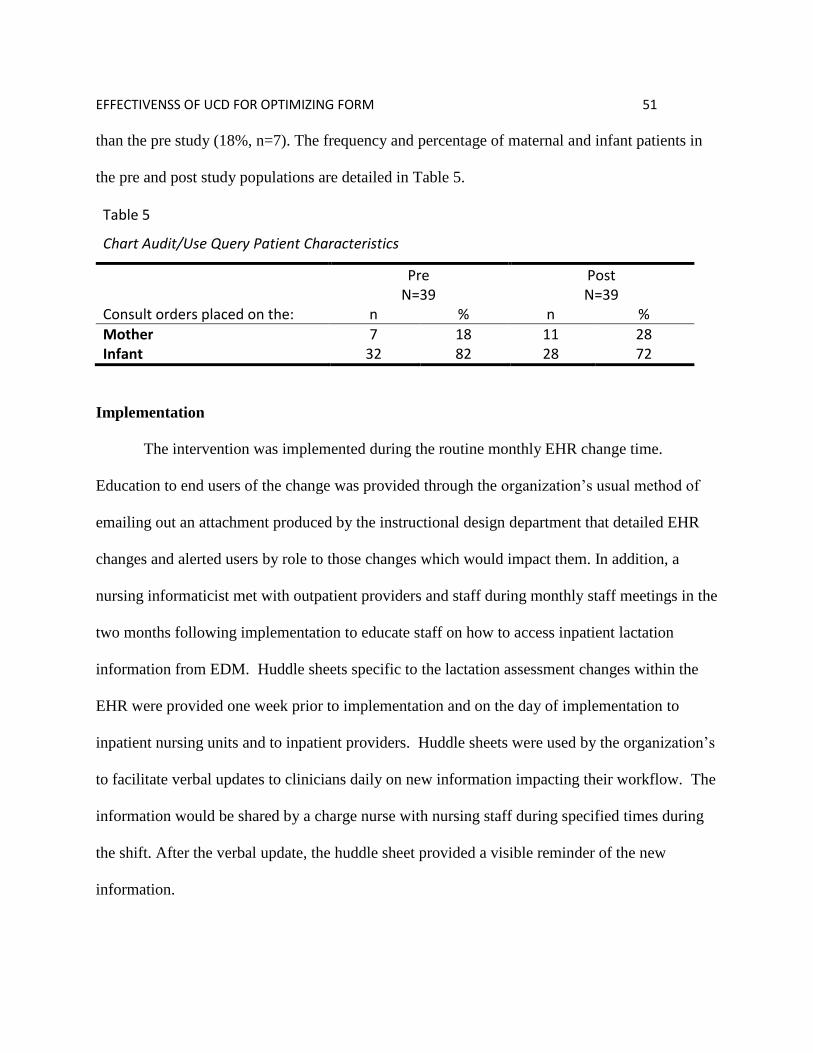
V. Chart Audit/Use Query Patient Characteristics ........................................................51
VI. Information Quality: Medians and Cumulative Percent ..........................................55
VII. Information Quality Survey Results: Divided by Role ............................................56
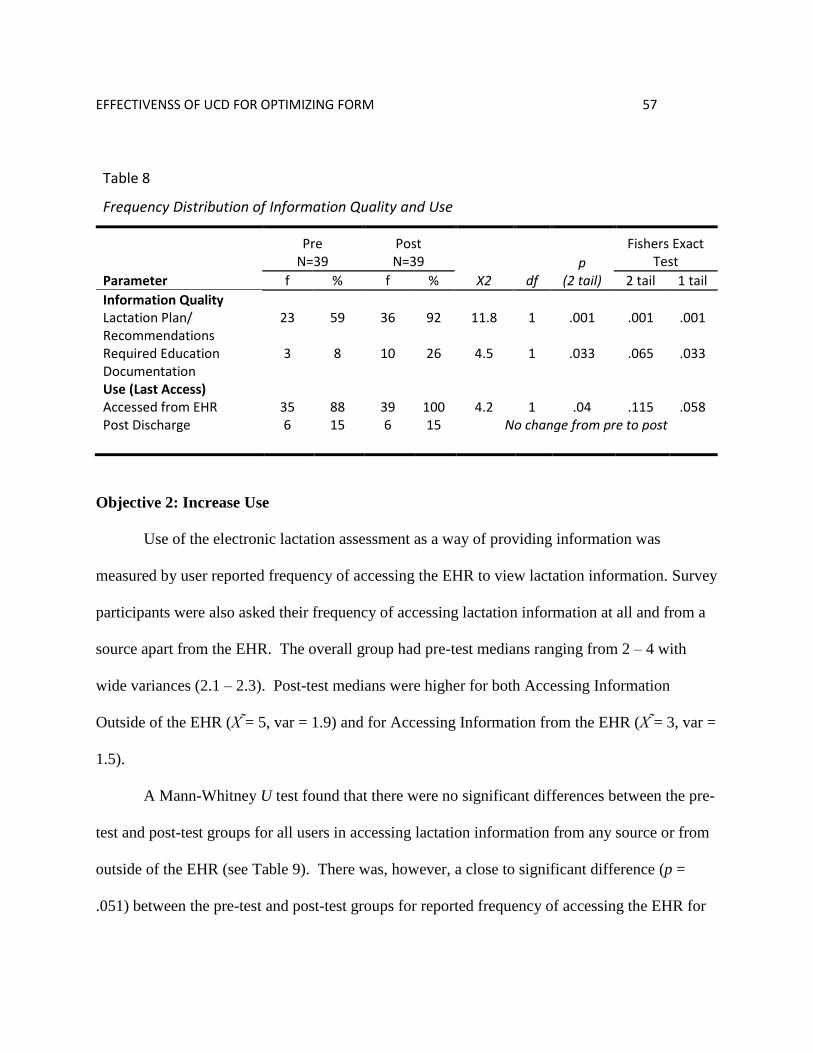
VIII. Frequency Distribution of Information Quality and Use .........................................57
IX. Use Survey Results: Divided by Role ......................................................................58
X. User Satisfaction: Medians and Cumulative Percent ...............................................59
XI. User Satisfaction Survey Results: Divided by Role .................................................60
XII. System Quality Survey Results: Divided by Role ...................................................61
Page 12
EFFECTIVENSS OF UCD FOR OPTIMIZING FORM
x
List of Figures
I. Model of User Centered Design Process ....................................................................6
II. Updated DeLone & McLean IS Success Model ........................................................7
III. Alignment of Attributes of Success with Structures of Quality .................................9
IV. Conceptual Model ....................................................................................................11
Page 13
EFFECTIVENSS OF UCD FOR OPTIMIZING FORM
xi
List of Appendices
A. Logic Model .............................................................................................................88
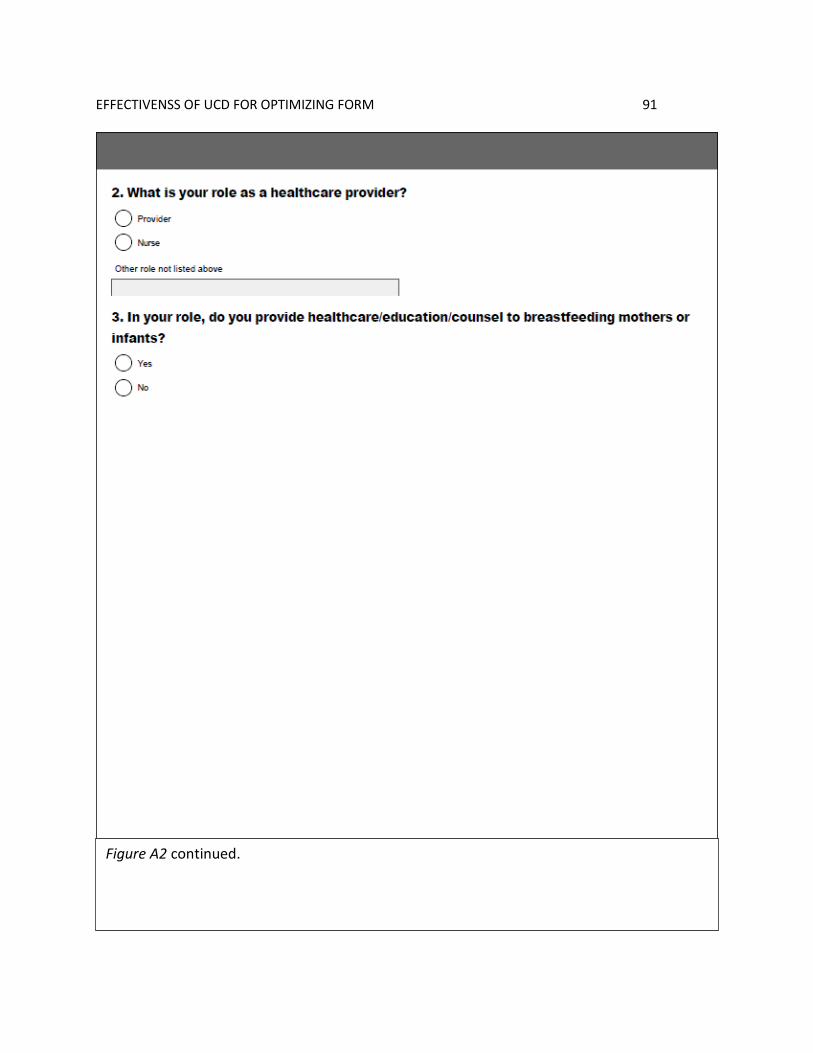
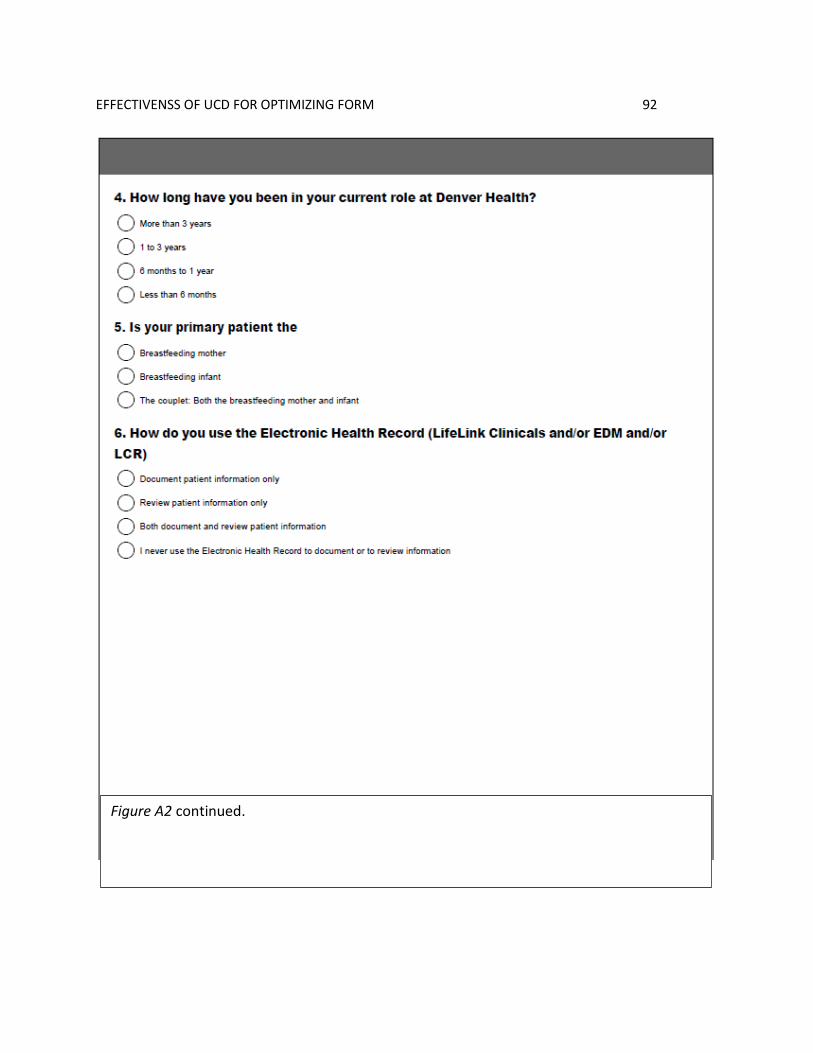
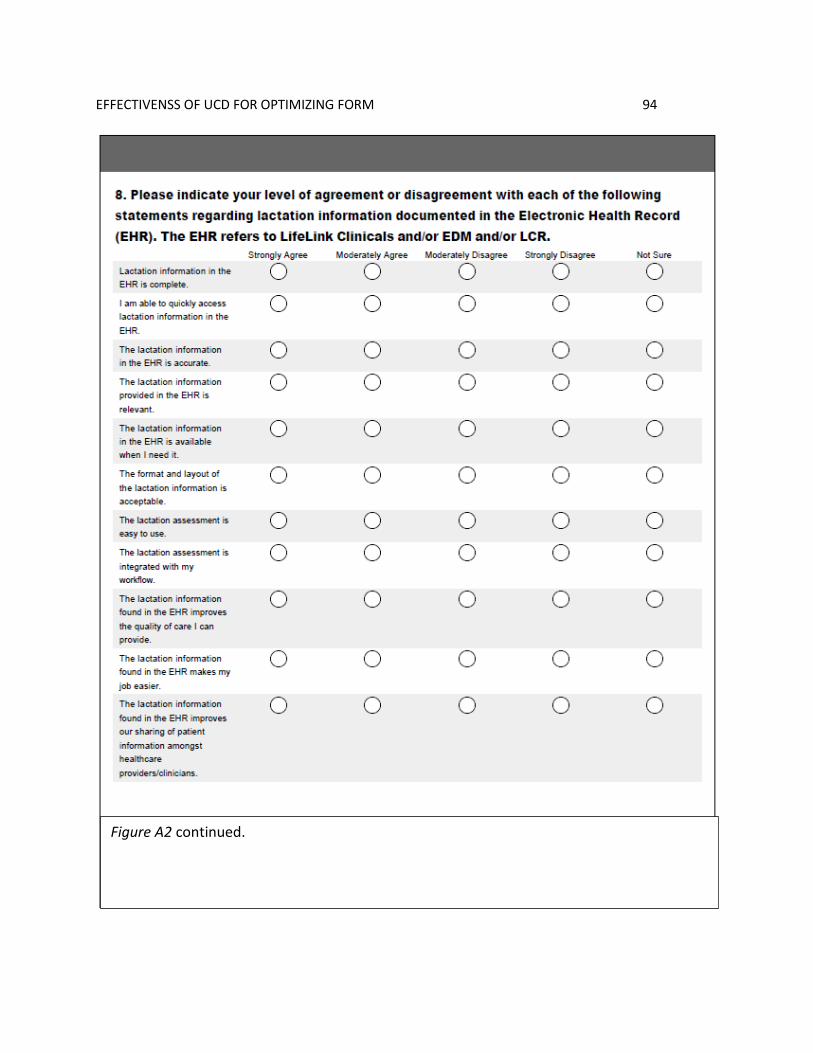
B. Instruments ...............................................................................................................89
C. Permissions ...............................................................................................................96
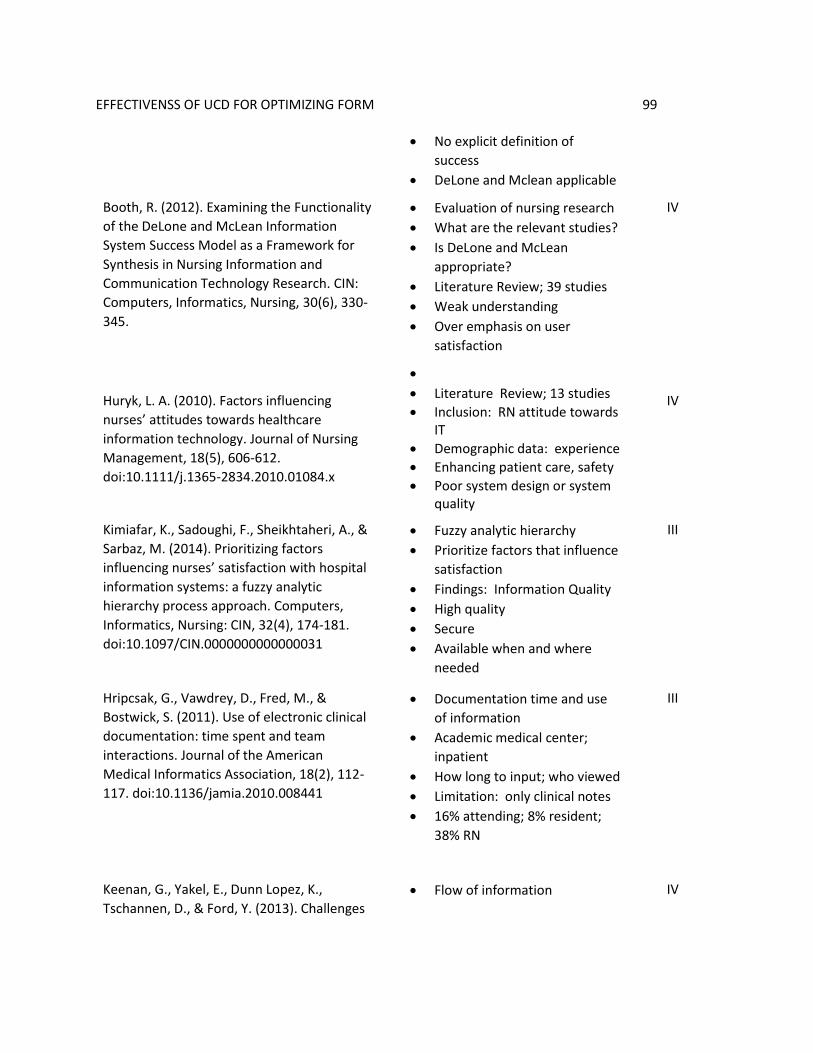
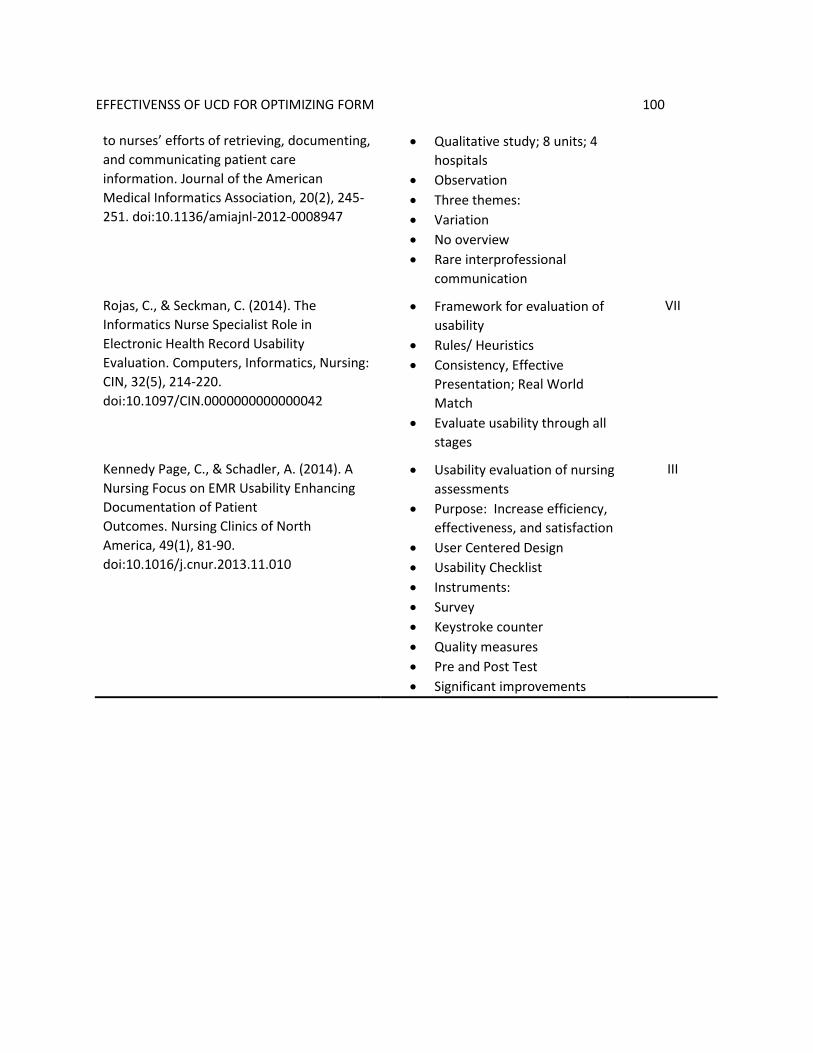
D. Systematic Review of the Literature: Exemplar.......................................................98
E. Project Milestones ..................................................................................................101
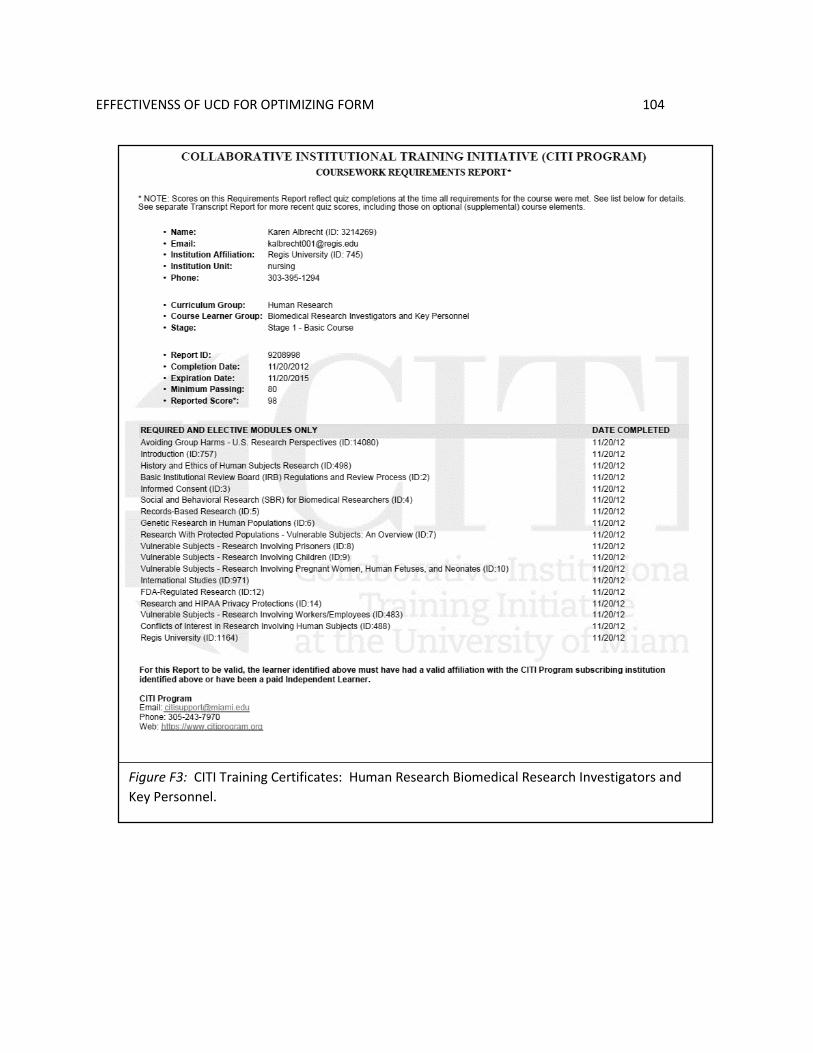
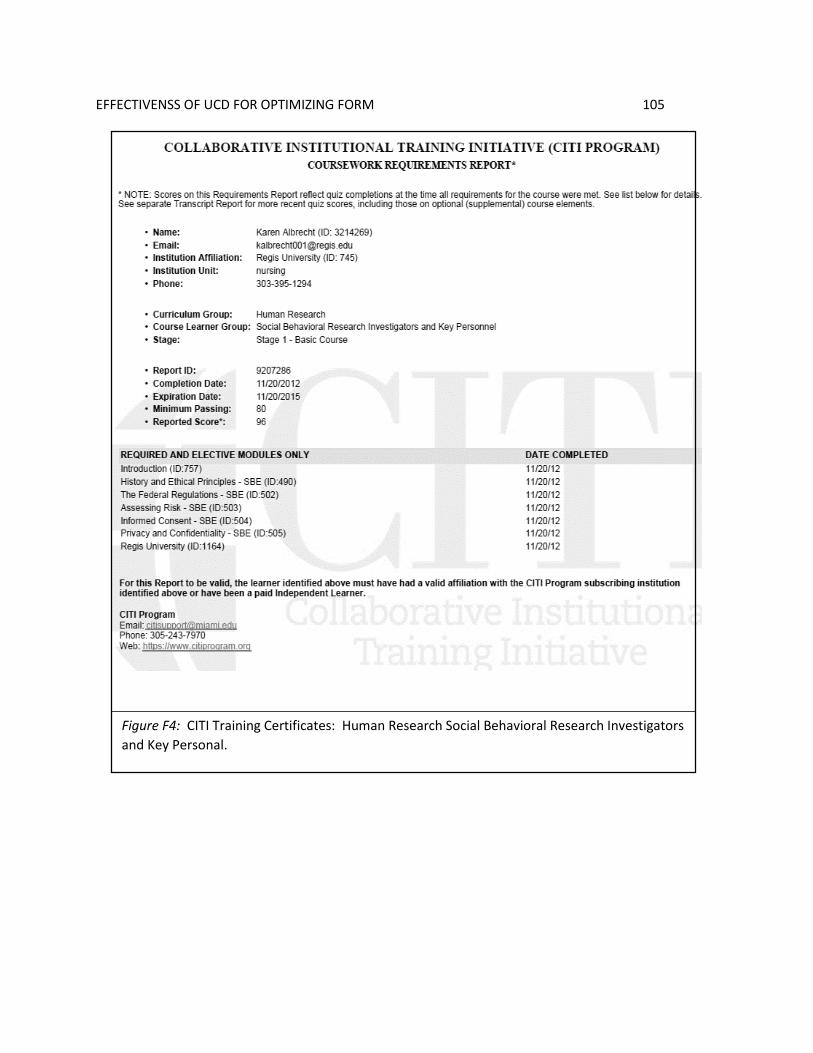
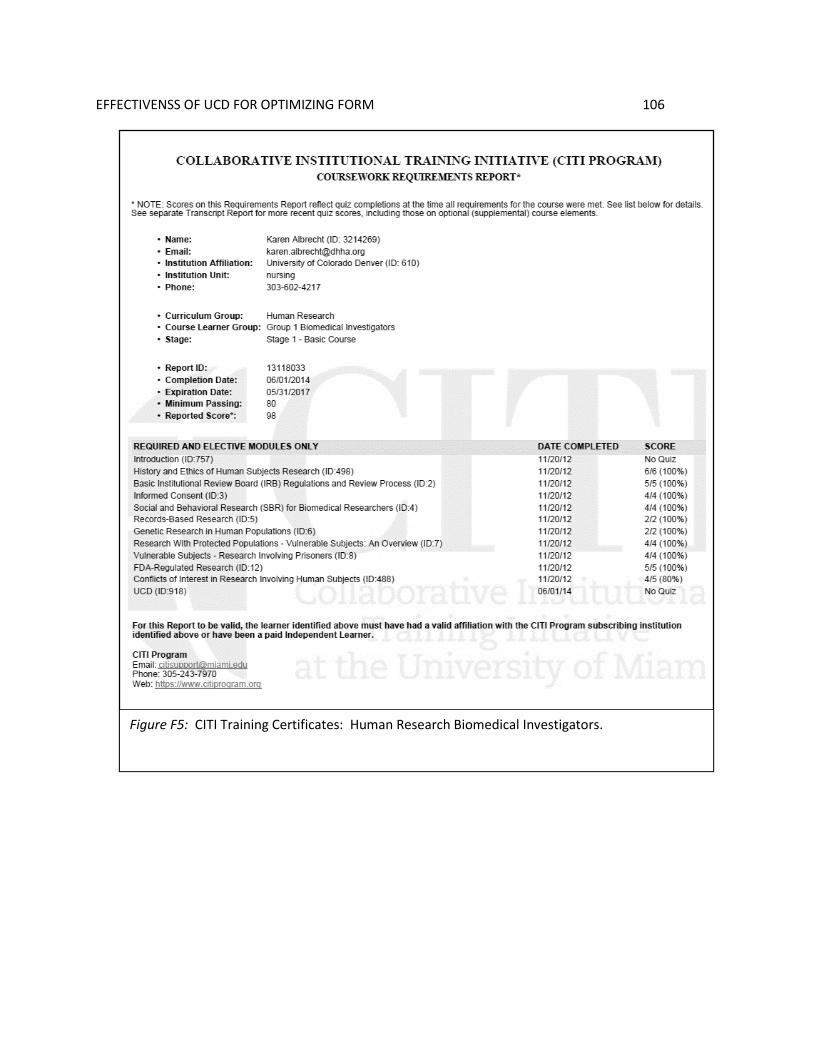
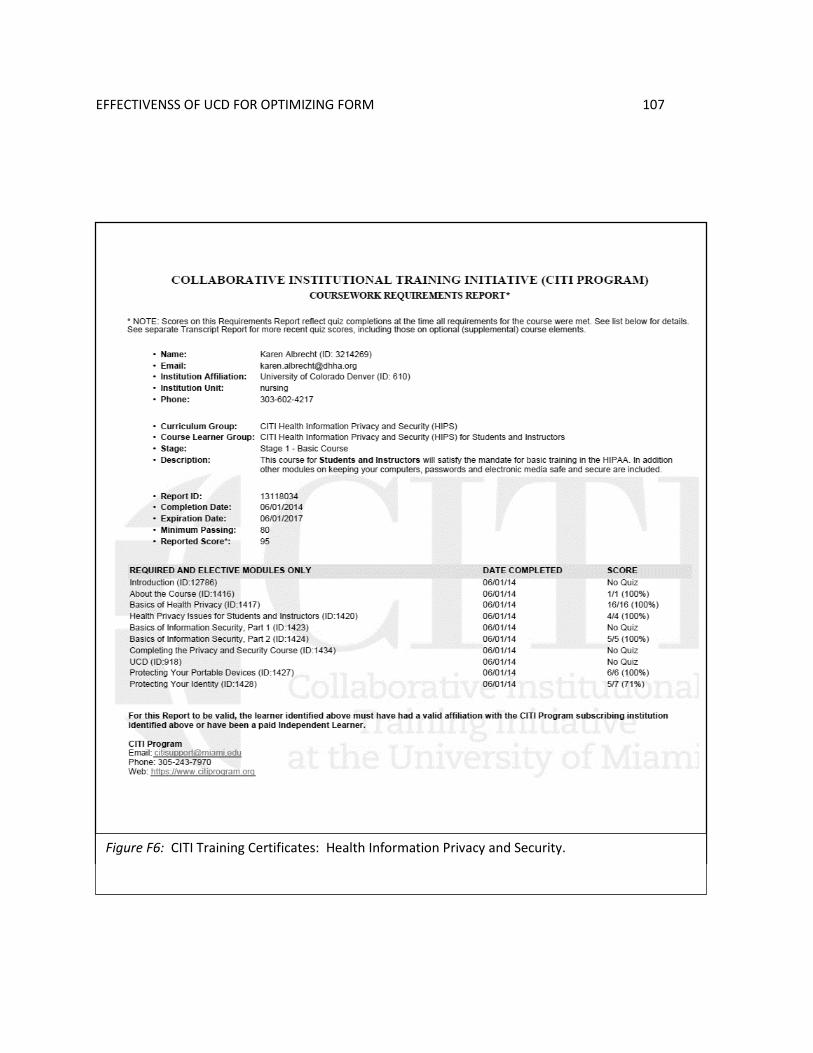
F. IRB Approvals and CITI Training .........................................................................102
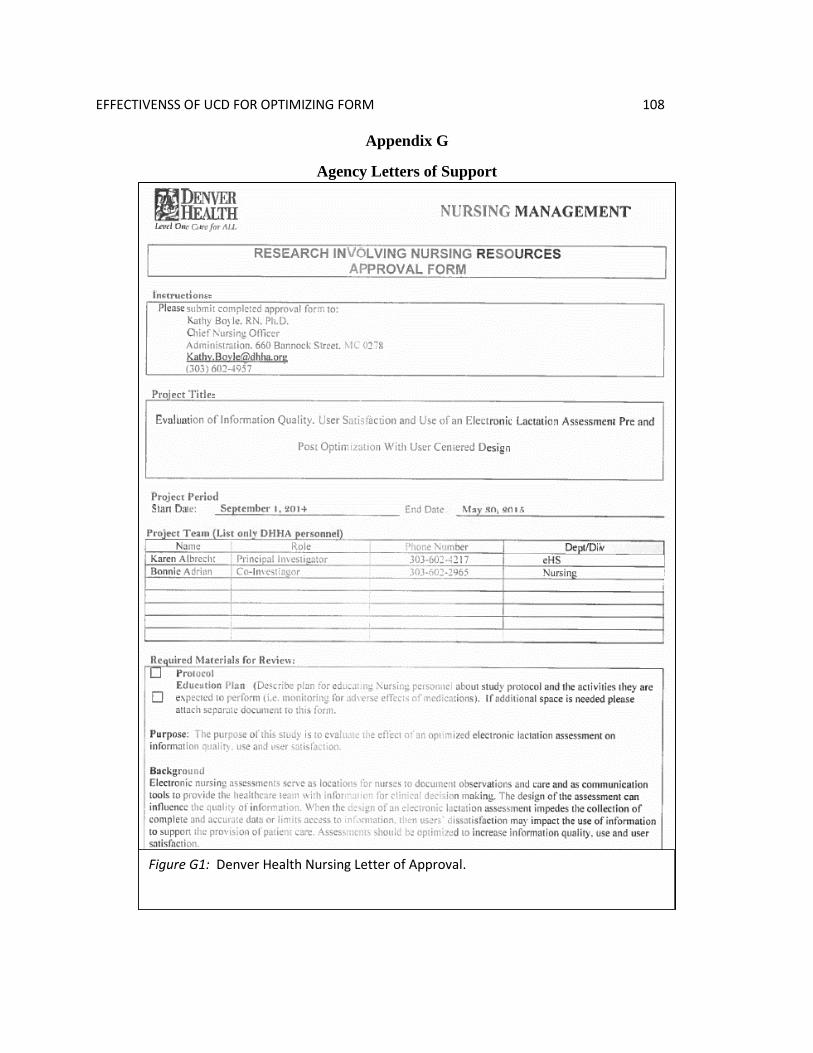
G. Agency Letters of Support .....................................................................................108
Page 14
EFFECTIVENSS OF UCD FOR OPTIMIZING FORM 1
Effectiveness of User Centered Design for Optimizing an Electronic Documentation Form
An expectation of the Health Information Technology for Economic and Clinical Health
Act (HITECH), enacted in 2009 as part of the American Recovery and Reinvestment Act, was
that the adoption of electronic health records (EHR) would improve the United States’ healthcare
delivery system and patient care through efficient access to patient information, support for
provider decision making and coordination of care (National Learning Consortium, 2014). The
envisioned benefits of a robust EHR that achieves high value health care are summed up through
the triple aim of better health, better care and decreased costs (Berwick, Nolan & Wittingham,
2008). However, recent studies on the use of EHR documentation have cast doubt on the ability
of the EHR to provide robust support for clinician decision making in part related to the quality
of documented information as well as the ease of locating information within the EHR
(Bowman, 2013; Hripcsak, Vawdrey, & Bostwick, 2011; Huryk, 2010; Keenan, Yakel, Dunn
Lopez, Tschannen, & Ford., 2013; Smith, Smith, Krugman, & Oman, 2005; Stevenson &
Nilsson, 2012). Checklist documentation, designed to improve the efficiency of data entry, lacks
the rich narrative that illustrates the impact of nursing interventions and the overall patient story
(Green & Thomas, 2008; Keenan et al., 2013). Furthermore, inefficient means of viewing
information within the EHR limits the use of the EHR as a vehicle to communicate patient
information to the healthcare team (Bowman, 2013; Hripcsak et al., 2011; Keenan et al., 2013;
Smith,et al., 2005; Stevenson & Nilsson, 2011).
Problem Recognition and Definition
Project Purpose
Page 15
EFFECTIVENSS OF UCD FOR OPTIMIZING FORM 2
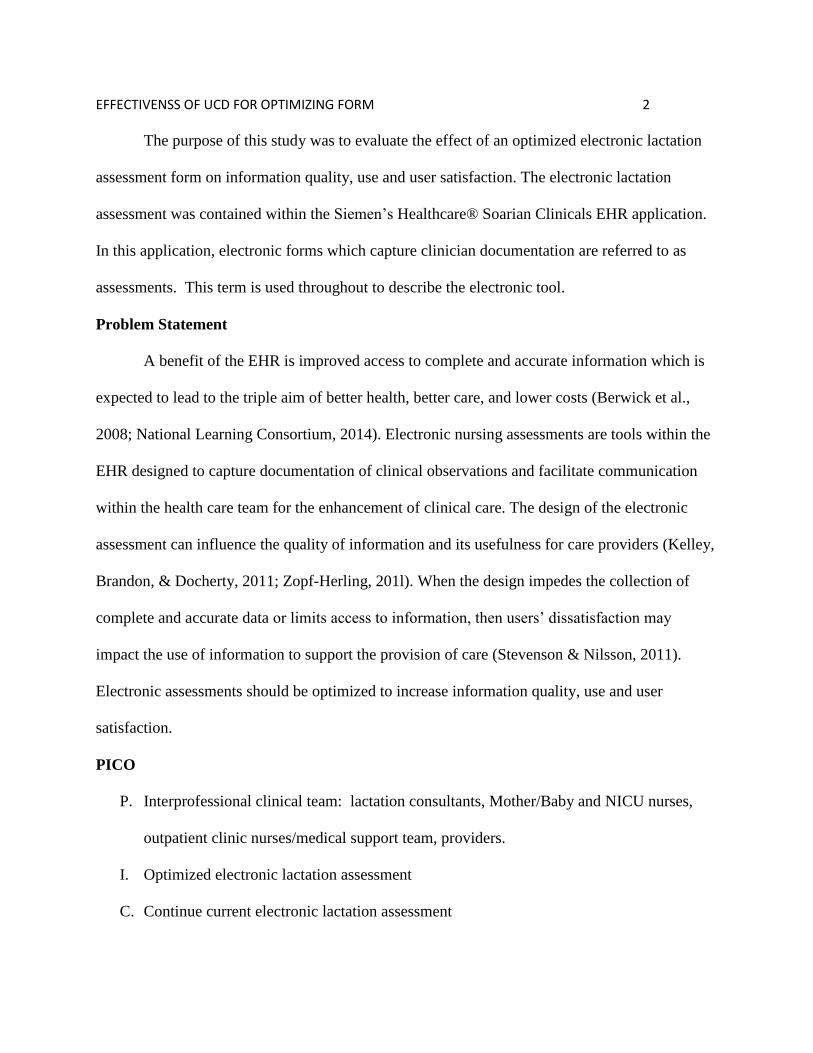
The purpose of this study was to evaluate the effect of an optimized electronic lactation
assessment form on information quality, use and user satisfaction. The electronic lactation
assessment was contained within the Siemen’s Healthcare® Soarian Clinicals EHR application.
In this application, electronic forms which capture clinician documentation are referred to as
assessments. This term is used throughout to describe the electronic tool.
Problem Statement
A benefit of the EHR is improved access to complete and accurate information which is
expected to lead to the triple aim of better health, better care, and lower costs (Berwick et al.,
2008; National Learning Consortium, 2014). Electronic nursing assessments are tools within the
EHR designed to capture documentation of clinical observations and facilitate communication
within the health care team for the enhancement of clinical care. The design of the electronic
assessment can influence the quality of information and its usefulness for care providers (Kelley,
Brandon, & Docherty, 2011; Zopf-Herling, 201l). When the design impedes the collection of
complete and accurate data or limits access to information, then users’ dissatisfaction may
impact the use of information to support the provision of care (Stevenson & Nilsson, 2011).
Electronic assessments should be optimized to increase information quality, use and user
satisfaction.
PICO
P. Interprofessional clinical team: lactation consultants, Mother/Baby and NICU nurses,
outpatient clinic nurses/medical support team, providers.
I. Optimized electronic lactation assessment
C. Continue current electronic lactation assessment
Page 16
EFFECTIVENSS OF UCD FOR OPTIMIZING FORM 3
O. Increased information quality, use, and user satisfaction of the lactation assessment
Research Question
Is there increased information quality, user satisfaction and use of an electronic lactation
assessment form after optimization using user centered design?
Project Significance, Scope, and Rationale
Project significance. Breastfeeding is a healthy behavior with benefits for both mother
and infant including decreased incidence of postpartum depression, ovarian cancer and breast
cancer for mother and decreased incidence of infections, asthma, childhood leukemia, and
lymphoma for the child. In addition, there is a decreased risk of postpartum bleeding for the
mother and decreased risk of sudden infant death syndrome for the child (Eidelman & Schanler,
2012). Exclusive breast milk feeding is a Joint Commission Perinatal Core Measure and a
Meaningful Use (MU) Clinical Quality Measure (CQM). By measuring the rate of exclusive
breast milk feeding in healthy term newborns whose mothers choose to breastfeed, hospitals will
have data and benchmarks for quality improvement (US Breastfeeding Committee, 2013).
Hospital practices have been shown to impact the rates of breastfeeding (US
Breastfeeding Committee, 2013). The Baby-Friendly Initiative is an evidence based program
promoting ten hospital practices which increase initiation of breastfeeding in some populations
and over-all rates of breastfeeding (Hawkins, Stern, Baum & Gillman, 2014; World Health
Organization, 1998). Hospitals designated as Baby Friendly have successfully demonstrated
implementation of these ten steps. Lactation consultants provide much of the education to new
breastfeeding mothers that is required by Baby Friendly. In addition, lactation consultants
develop plans of care based on their assessment of the couplet. When all caregivers are aware of
Page 17
EFFECTIVENSS OF UCD FOR OPTIMIZING FORM 4
and support the lactation consultant’s plan, breastfeeding mothers receive consistent
communication from the healthcare team. Consistent messaging is particularly important when
there are challenges in the immediate postpartum period (List et al., 2008).
Scope. The scope of the project was to implement a redesigned electronic lactation
assessment as part of the optimization phase of the system life cycle. The organization
implemented electronic documentation for the perinatal division in January of 2013 as part of a
“big bang” simultaneous implementation of clinical documentation, CPOE (computer provider
order entry) and bar-code medication administration. The implementation was problematic and
resulted in significantly less functionality than anticipated, a return to paper for some specialties,
and frustrated users. Users identified changes to the application that would result in better
support for their workflows, including a request to adjust the lactation assessment.
Rationale. The organization was a 500 bed public safety-net integrated healthcare system
with over 3,000 annual births and was recently recognized as having one of the lowest rates for
Cesarean sections in the country (The risks of C-Sections, 2014). The organization’s lactation
program consisted of International Board-Certified Lactation Consultants (IBCLCs) and
Certified Lactation Counselors offering prenatal classes, post-partum support, and follow up
care. Because of its commitment to breastfeeding support, the organization was recognized by
the Colorado Department of Public Health and Environment and the Colorado Breastfeeding
Coalition with a Breastfeeding Excellence Starts Today (BEST) award for demonstrating the
Colorado Can Do 5!, an initiative to implement five of the Baby Friendly Ten Steps (Colorado
Breastfeeding Coalition, n.d.). A future organizational goal was to achieve Baby Friendly
certification, which would require implementation of all ten steps.
Page 18
EFFECTIVENSS OF UCD FOR OPTIMIZING FORM 5
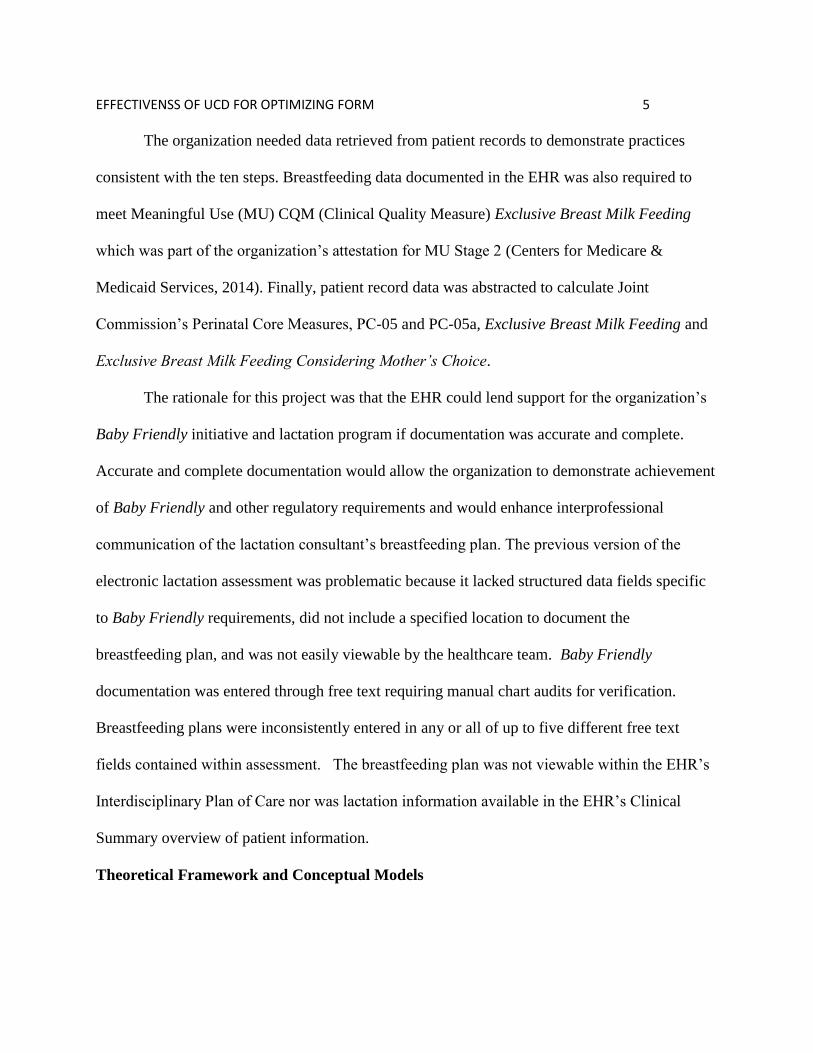
The organization needed data retrieved from patient records to demonstrate practices
consistent with the ten steps. Breastfeeding data documented in the EHR was also required to
meet Meaningful Use (MU) CQM (Clinical Quality Measure) Exclusive Breast Milk Feeding
which was part of the organization’s attestation for MU Stage 2 (Centers for Medicare &
Medicaid Services, 2014). Finally, patient record data was abstracted to calculate Joint
Commission’s Perinatal Core Measures, PC-05 and PC-05a, Exclusive Breast Milk Feeding and
Exclusive Breast Milk Feeding Considering Mother’s Choice.
The rationale for this project was that the EHR could lend support for the organization’s
Baby Friendly initiative and lactation program if documentation was accurate and complete.
Accurate and complete documentation would allow the organization to demonstrate achievement
of Baby Friendly and other regulatory requirements and would enhance interprofessional
communication of the lactation consultant’s breastfeeding plan. The previous version of the
electronic lactation assessment was problematic because it lacked structured data fields specific
to Baby Friendly requirements, did not include a specified location to document the
breastfeeding plan, and was not easily viewable by the healthcare team. Baby Friendly
documentation was entered through free text requiring manual chart audits for verification.
Breastfeeding plans were inconsistently entered in any or all of up to five different free text
fields contained within assessment. The breastfeeding plan was not viewable within the EHR’s
Interdisciplinary Plan of Care nor was lactation information available in the EHR’s Clinical
Summary overview of patient information.
Theoretical Framework and Conceptual Models
Page 19
EFFECTIVENSS OF UCD FOR OPTIMIZING FORM 6
The conceptual model for this project includes elements from three theoretical
frameworks: User centered design (Schumacher & Lowry, 2010), DeLone and McLean’s
information systems (is) success model (DeLone & McLean, 2003), and Donabedian’s quality of
care model (1988). Each of these is explained further. Then, the conceptual model for this
project is presented.
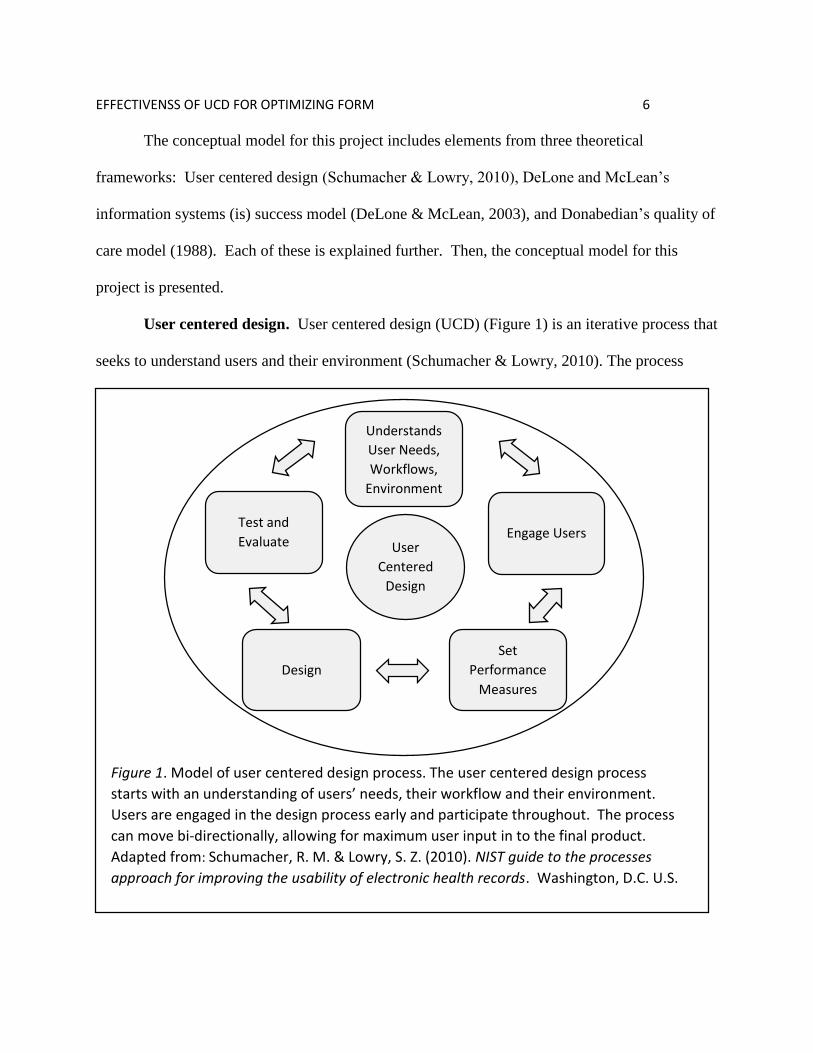
User centered design. User centered design (UCD) (Figure 1) is an iterative process that
seeks to understand users and their environment (Schumacher & Lowry, 2010). The process
Understands
User Needs,
Workflows,
Environment
Test and
Evaluate
Design
Set
Performance
Measures
Engage Users User
Centered
Design
Figure 1. Model of user centered design process. The user centered design process
starts with an understanding of users’ needs, their workflow and their environment.
Users are engaged in the design process early and participate throughout. The process
can move bi-directionally, allowing for maximum user input in to the final product.
Adapted from: Schumacher, R. M. & Lowry, S. Z. (2010). NIST guide to the processes
approach for improving the usability of electronic health records. Washington, D.C. U.S.
Department of Commerce.
Page 20
EFFECTIVENSS OF UCD FOR OPTIMIZING FORM 7
starts with an understanding of the users’ needs, workflows and environments. The next step is
engaging users in the design process by setting performance measures, designing the solution
and testing and evaluating the solution. The process can flow in either direction through design,
testing, adaptation, and re-testing until performance objectives are met (Schumacher & Lowry,
2010). The goal of optimization is to improve the information quality of the assessment.
Information systems success model. DeLone and McLean’s information systems (IS) success
model, first developed in 1992 and updated in 2003, is a framework to illustrate dependent
variables, or attributes, of IS success (see Figure 2). These attributes are interdependent and
System Quality
Information
Quality
Service Quality
Intention to Use/
Use
User Satisfaction
Net Benefits
Figure 2. Updated D&M IS Success Model. The model proposes that the three dimensions
of information systems success, system quality, information quality and service quality,
either alone or in combination influence use and user satisfaction. The direction of the
arrows indicate the flow, either positively or negatively, of influence. Adapted from “The
DeLone and McLean Model of Information Systems Success: A Ten-Year Update,” by
W.H. DeLone and E. R. McLean, 2003, Journal of Management Information Systems,
12(4), p. 24. Copyright 2003 by M. E. Sharpe, Inc.
Page 21
EFFECTIVENSS OF UCD FOR OPTIMIZING FORM 8
include service quality, system quality, information quality, use, user satisfaction, and net
benefits for the organization (DeLone & McLean, 2003). The IS success model is a causal
model; when one or more attribute(s) are impacted by an outside intervention, there is a positive
or negative effect on successive attributes (DeLone & McLean, 2003). Van der Meijden, Tange,
Troost and Hasman (2003) analyzed 33 studies of patient care information systems for
determinants of success using the attributes of the IS success model and found the model
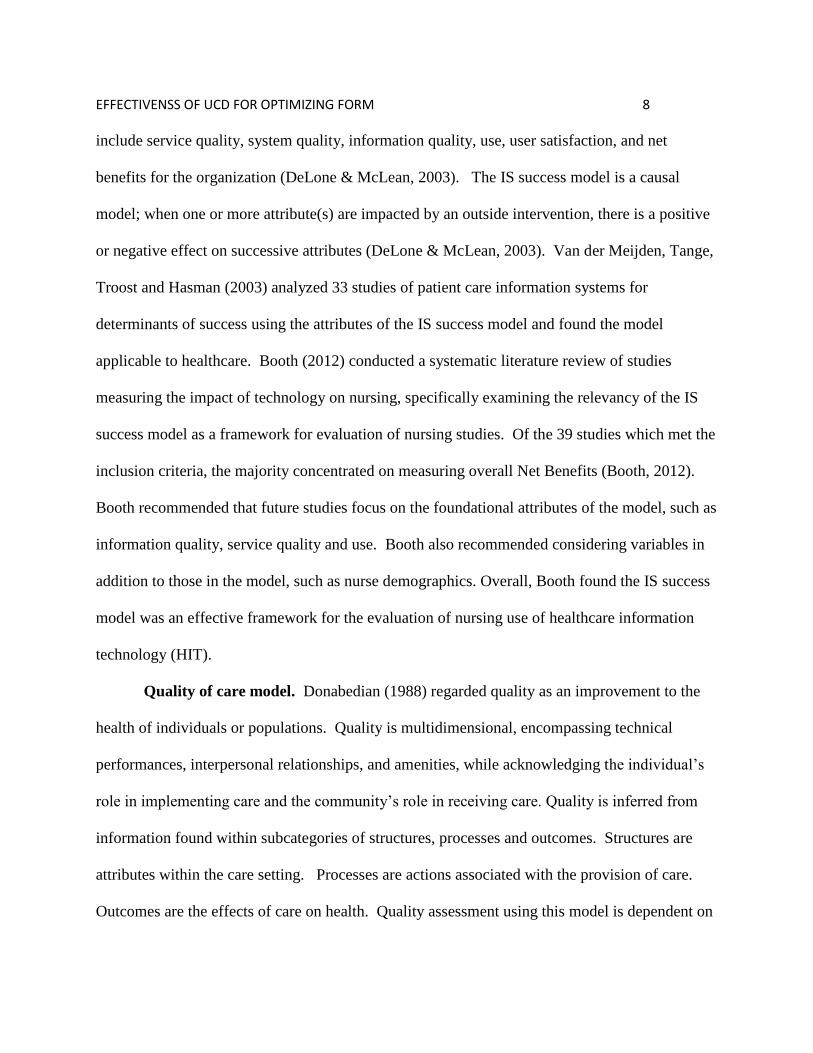
applicable to healthcare. Booth (2012) conducted a systematic literature review of studies
measuring the impact of technology on nursing, specifically examining the relevancy of the IS
success model as a framework for evaluation of nursing studies. Of the 39 studies which met the
inclusion criteria, the majority concentrated on measuring overall Net Benefits (Booth, 2012).
Booth recommended that future studies focus on the foundational attributes of the model, such as
information quality, service quality and use. Booth also recommended considering variables in
addition to those in the model, such as nurse demographics. Overall, Booth found the IS success
model was an effective framework for the evaluation of nursing use of healthcare information
technology (HIT).
Quality of care model. Donabedian (1988) regarded quality as an improvement to the
health of individuals or populations. Quality is multidimensional, encompassing technical
performances, interpersonal relationships, and amenities, while acknowledging the individual’s
role in implementing care and the community’s role in receiving care. Quality is inferred from
information found within subcategories of structures, processes and outcomes. Structures are
attributes within the care setting. Processes are actions associated with the provision of care.
Outcomes are the effects of care on health. Quality assessment using this model is dependent on
Page 22
EFFECTIVENSS OF UCD FOR OPTIMIZING FORM 9
existing positive linkages between structures and processes and between processes and
outcomes. Kelley, Brandon and Docherty (2011) used Donabedian’s quality of care model to
develop a framework for examining the use of electronic documentation on quality of patient
care. Structures were the nurses themselves and characteristics of the EHR. Processes were the
use of the EHR by nurses in the provision of patient care. Outcomes were the health status of the
patient and nurses’ satisfaction with the EHR.
Page 23
EFFECTIVENSS OF UCD FOR OPTIMIZING FORM 10
Although a causal model, the IS success model is based on the processes of information
systems (IS) which parallel Donabedian’s subcategories of structures, processes, outcomes. The
IS process begins with IS structures such as hardware, software and support systems. Structures
are measured by attributes of information quality, service quality and system quality. The next
step in the IS process is use of structures which is measured by attributes of use and user
satisfaction. The final process step is the outcome or effect of the system measured through net
benefits to the organization (see Figure 3).
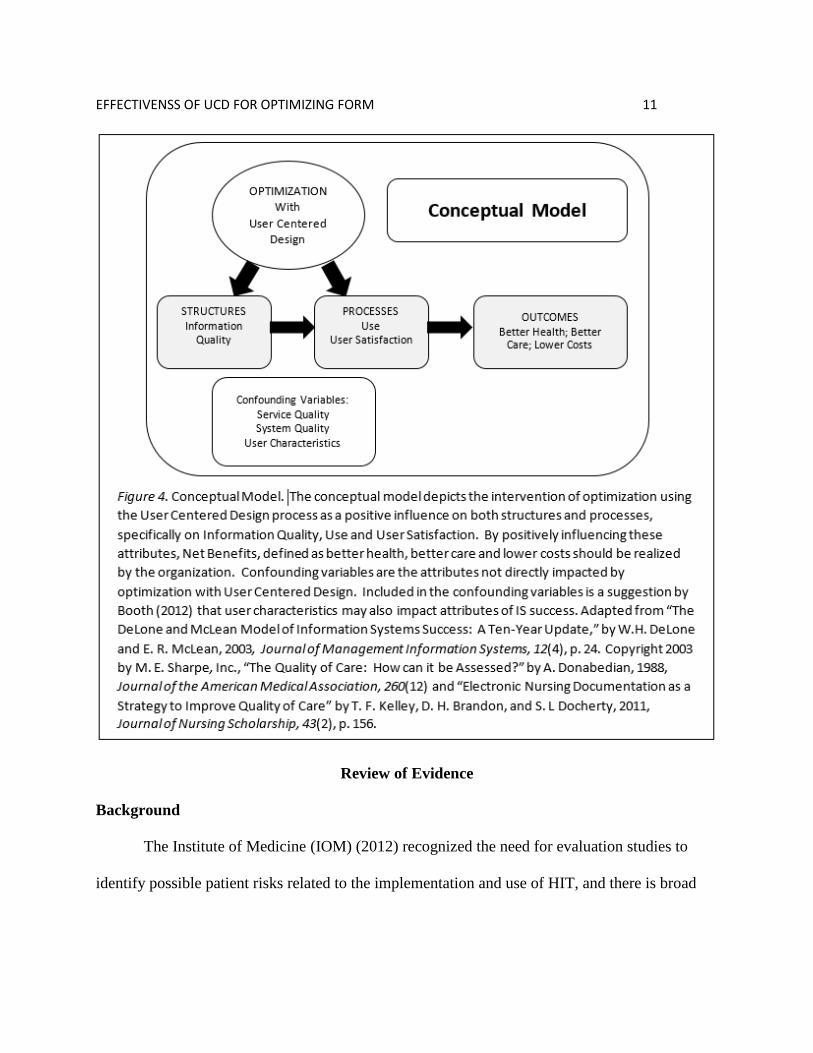
Conceptual model. The conceptual model for this project was developed by combining
the dependent variables from the IS success model with the processes depicted in Donabedian’s
quality of care model while retaining the causal properties of the IS Success Model to illustrate
quality improvement effect on information quality, use, and user satisfaction (see Figure 4). The
conceptual model depicts Donabedian’s subcategories (structures, processes, and outcomes)
aligned with dependent variables from the IS success model information quality, use and user
satisfaction. The net benefits of better health, better care, and lower costs (the triple aim),
although unmeasured, are depicted as the long term, desired outcomes of the project. DeLone
and McLean’s causal IS success model predicts any increase to information quality will increase
use and/or user satisfaction which will then increase net benefits. Arrows depict the expected
effect of each attribute on its successor. The independent variable, the optimized lactation
assessment, is shown impacting both Information quality and use/user satisfaction. Confounding
variables are the remaining attributes of the IS success model (service quality and system
quality) which are not impacted by the independent variable. User characteristics are included as
a confounding variable as suggested by Booth (2012).
Page 24
EFFECTIVENSS OF UCD FOR OPTIMIZING FORM 11
Review of Evidence
Background
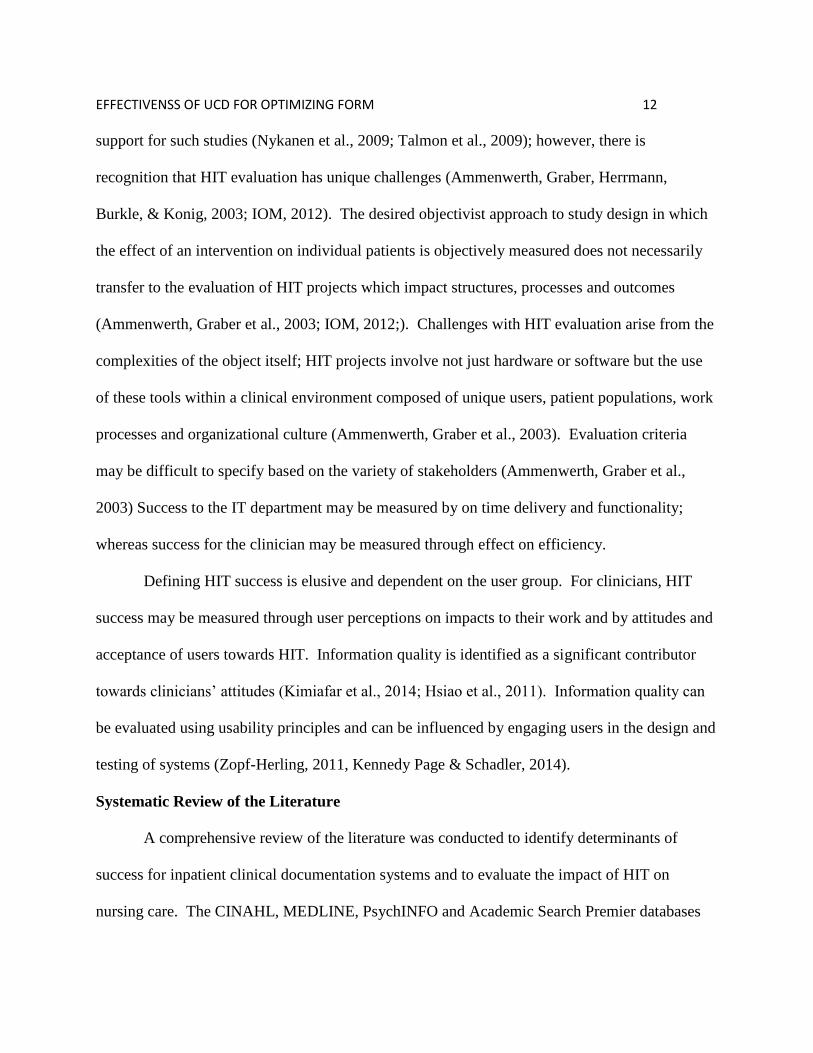
The Institute of Medicine (IOM) (2012) recognized the need for evaluation studies to
identify possible patient risks related to the implementation and use of HIT, and there is broad
Page 25
EFFECTIVENSS OF UCD FOR OPTIMIZING FORM 12
support for such studies (Nykanen et al., 2009; Talmon et al., 2009); however, there is
recognition that HIT evaluation has unique challenges (Ammenwerth, Graber, Herrmann,
Burkle, & Konig, 2003; IOM, 2012). The desired objectivist approach to study design in which
the effect of an intervention on individual patients is objectively measured does not necessarily
transfer to the evaluation of HIT projects which impact structures, processes and outcomes
(Ammenwerth, Graber et al., 2003; IOM, 2012;). Challenges with HIT evaluation arise from the
complexities of the object itself; HIT projects involve not just hardware or software but the use
of these tools within a clinical environment composed of unique users, patient populations, work
processes and organizational culture (Ammenwerth, Graber et al., 2003). Evaluation criteria
may be difficult to specify based on the variety of stakeholders (Ammenwerth, Graber et al.,
2003) Success to the IT department may be measured by on time delivery and functionality;
whereas success for the clinician may be measured through effect on efficiency.
Defining HIT success is elusive and dependent on the user group. For clinicians, HIT
success may be measured through user perceptions on impacts to their work and by attitudes and
acceptance of users towards HIT. Information quality is identified as a significant contributor
towards clinicians’ attitudes (Kimiafar et al., 2014; Hsiao et al., 2011). Information quality can
be evaluated using usability principles and can be influenced by engaging users in the design and
testing of systems (Zopf-Herling, 2011, Kennedy Page & Schadler, 2014).
Systematic Review of the Literature
A comprehensive review of the literature was conducted to identify determinants of
success for inpatient clinical documentation systems and to evaluate the impact of HIT on
nursing care. The CINAHL, MEDLINE, PsychINFO and Academic Search Premier databases
Page 26
EFFECTIVENSS OF UCD FOR OPTIMIZING FORM 13
along with Google Scholar and PubMED where searched using keywords: Healthcare IT,
Clinical Information Systems, Electronic Health Record, Nursing Documentation Systems,
Nursing Attitudes, Nursing Satisfaction, Quality, Success, Human Factors, Usability and
Evaluation. Reference lists of pertinent articles were searched to identify additional studies.
Articles included in the review were descriptive or research studies, from academic journals,
published after 2003, and which evaluated HIT implementation or use in a clinical setting. The
majority of HIT studies found in the literature were reports from expert committees, qualitative
or descriptive studies or systematic reviews of descriptive and qualitative studies. A limitation
of this body of literature is that, for the most part, these studies fall into the lower levels of
evidence as described by Houser and Oman (2011). A second limitation is that HIT studies, in
general, tend to lack external validity due to the small sample sizes, the unique work processes
localized to a particular setting, or the specificity of the system (Ammenwerth, Graber et al.,
2003; Heathfield, Pitty, & Hanka, 1998). After an initial review of studies evaluating overall HIT
success, subsequent articles were limited to those which specifically addressed an impact on
nursing. Additional topics for further review were identified from the initial literature review and
include the impact of HIT on nursing, nursing satisfaction with and attitudes towards HIT,
information quality and usability.
HIT success. Defining Healthcare IT (HIT) success is complex and dependent on the
organization and the perception of the stakeholder (Kaplan & Harris-Salamone, 2009; Laramee,
Bosek, Kasprisin, & Powers-Phaneuf, 2011; Spetz, Burgess & Phibbs, 2012; Van der Meijden et
al., 2003). Various measures for evaluating HIT success include costs, quality, safety, system
performance, morale, or user time (Spetz et al., 2012, Van der Meijden et al., 2003). HIT has the
Page 27
EFFECTIVENSS OF UCD FOR OPTIMIZING FORM 14
potential to affect clinicians’ workflows and how they communicate and collaborate (Kaplan &
Harris-Salamone, 2009; Laramee et al., 2011; Spetz et al., 2012). When HIT disrupts established
workflows, communication or collaboration patterns, users may create alternatives, or
workarounds, that duplicate or bypass the application (Halbesleben, Wakefield, & Wakefield,
2008). Thus, additional measures of HIT success are user acceptance, motivation, and use
(Ammenwerth, Mansmann, Iller & Eichstadter, 2003; De Veer, Fleuren, Bekkema & Francke,
2011).
Ammenwerth, Mansmann, Iller and Eichstadter (2003) examined user acceptance of a
computerized nursing documentation system in a pre and post, mixed method study. The
intervention (electronic nursing documentation) was developed with nursing involvement and
fully supported the nursing care plan process. A clear definition of the concept “user acceptance”
was not provided, although the concept was related to motivation. The pilot study was
conducted on four nursing wards in German hospitals. There were three data collection time
points: three months prior to implementation and three months and nine months after
implementation. Results were gathered via a questionnaire and group interviews. The
instrument was developed with questions drawn from validated questionnaires previously
presented in the literature. Group interviews were audiotaped and content was transcribed and
analyzed. The authors found overall that user acceptance of the clinical documentation system
was medium to high and continued throughout the study period.
Van der Meijden, Tange, Troost and Hasman (2003) reviewed the literature from 1991-
2001 to identify factors that attributed to success of inpatient HIT applications and found that
defining HIT success was difficult. Thirty-three studies met the inclusion criteria. Factors were
Page 28
EFFECTIVENSS OF UCD FOR OPTIMIZING FORM 15
analyzed using the six determinants of success proposed by the DeLone and McLean IS Success
Model. The majority of studies evaluated information quality, system quality, user satisfaction,
and individual impact. Usage and organizational impact were evaluated in fewer studies.
Evaluation of HIT was limited when the design of the study failed to identify stakeholders
because perception of success varies with stakeholders. When studies measured success
immediately after implementation, they did not allow sufficient time for full impacts to be
realized. Studies measuring success against the previous system may not have considered the
limitations of the previous system which were corrected by the new system. As a
multidimensional framework, the IS Success Model was useful for evaluation of HIT success
and was recommended for future studies. Additional factors, such as organizational culture or
user involvement in design, should be considered as antecedent or confounding variables.
Spetz, Burgess, and Phibbs (2011) conducted a qualitative study to identify success
factors for implementation of inpatient HIT, specifically a patient record application and bar-
code medication administration. The study targeted nurses as the primary users of these
applications with the greatest impact to workflows. The setting was seven Veterans
Administration (VA) hospitals representative of the inpatient VA system overall. Semi-
structured interviews were conducted with participants selected by site coordinators based on
their job classification. Thematic analysis was conducted and five themes impacting the success
of HIT implementation emerged: leadership/organizational stability; equipment; phased
implementation; training; and workflow changes. Nurses acknowledged that HIT can impact
established workflows including the organization of their work, documentation processes, and
Page 29
EFFECTIVENSS OF UCD FOR OPTIMIZING FORM 16
communication patterns. Addressing changes to workflow prior to implementation was
identified as a success factor for HIT implementation.
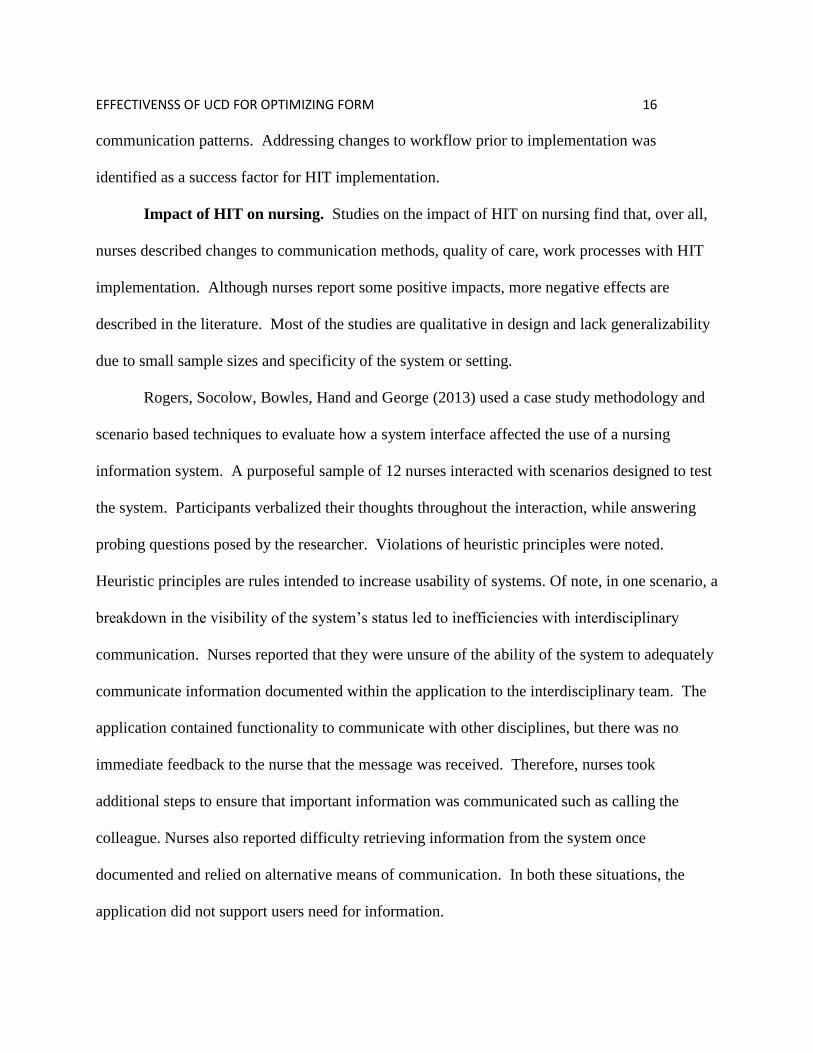
Impact of HIT on nursing. Studies on the impact of HIT on nursing find that, over all,
nurses described changes to communication methods, quality of care, work processes with HIT
implementation. Although nurses report some positive impacts, more negative effects are
described in the literature. Most of the studies are qualitative in design and lack generalizability
due to small sample sizes and specificity of the system or setting.
Rogers, Socolow, Bowles, Hand and George (2013) used a case study methodology and
scenario based techniques to evaluate how a system interface affected the use of a nursing
information system. A purposeful sample of 12 nurses interacted with scenarios designed to test
the system. Participants verbalized their thoughts throughout the interaction, while answering
probing questions posed by the researcher. Violations of heuristic principles were noted.
Heuristic principles are rules intended to increase usability of systems. Of note, in one scenario, a
breakdown in the visibility of the system’s status led to inefficiencies with interdisciplinary
communication. Nurses reported that they were unsure of the ability of the system to adequately
communicate information documented within the application to the interdisciplinary team. The
application contained functionality to communicate with other disciplines, but there was no
immediate feedback to the nurse that the message was received. Therefore, nurses took
additional steps to ensure that important information was communicated such as calling the
colleague. Nurses also reported difficulty retrieving information from the system once
documented and relied on alternative means of communication. In both these situations, the
application did not support users need for information.
Page 30
EFFECTIVENSS OF UCD FOR OPTIMIZING FORM 17
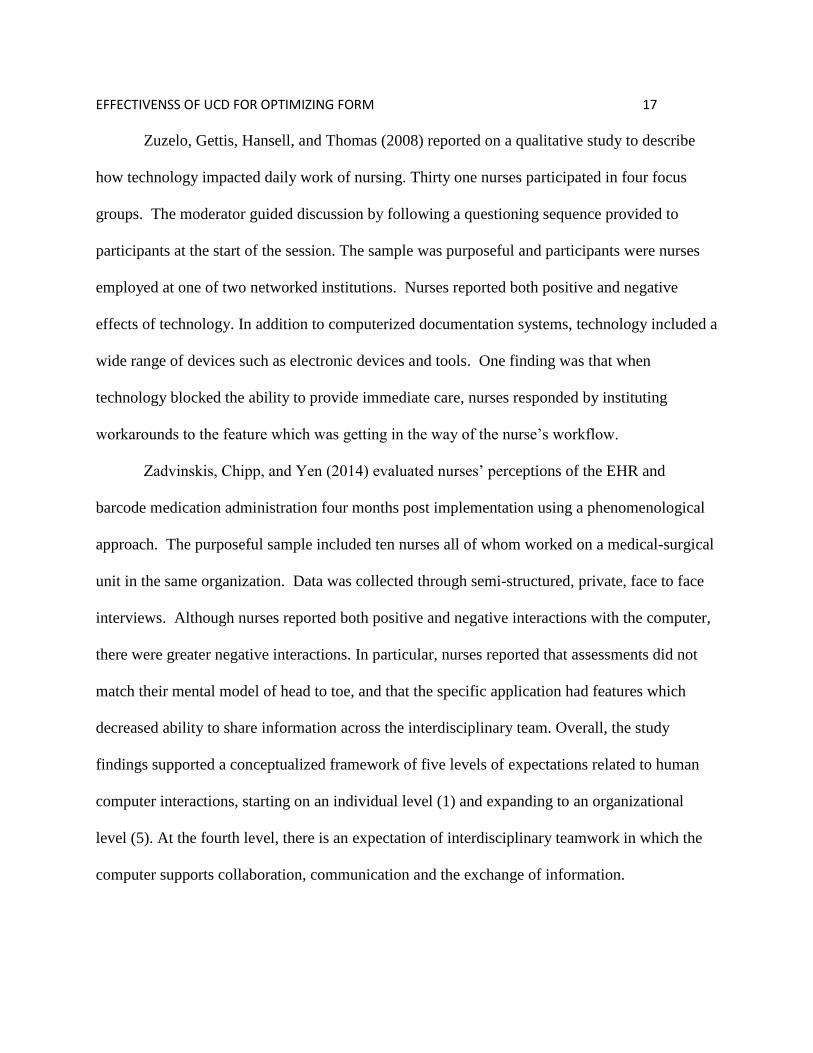
Zuzelo, Gettis, Hansell, and Thomas (2008) reported on a qualitative study to describe
how technology impacted daily work of nursing. Thirty one nurses participated in four focus
groups. The moderator guided discussion by following a questioning sequence provided to
participants at the start of the session. The sample was purposeful and participants were nurses
employed at one of two networked institutions. Nurses reported both positive and negative
effects of technology. In addition to computerized documentation systems, technology included a
wide range of devices such as electronic devices and tools. One finding was that when
technology blocked the ability to provide immediate care, nurses responded by instituting
workarounds to the feature which was getting in the way of the nurse’s workflow.
Zadvinskis, Chipp, and Yen (2014) evaluated nurses’ perceptions of the EHR and
barcode medication administration four months post implementation using a phenomenological
approach. The purposeful sample included ten nurses all of whom worked on a medical-surgical
unit in the same organization. Data was collected through semi-structured, private, face to face
interviews. Although nurses reported both positive and negative interactions with the computer,
there were greater negative interactions. In particular, nurses reported that assessments did not
match their mental model of head to toe, and that the specific application had features which
decreased ability to share information across the interdisciplinary team. Overall, the study
findings supported a conceptualized framework of five levels of expectations related to human
computer interactions, starting on an individual level (1) and expanding to an organizational
level (5). At the fourth level, there is an expectation of interdisciplinary teamwork in which the
computer supports collaboration, communication and the exchange of information.
Page 31
EFFECTIVENSS OF UCD FOR OPTIMIZING FORM 18
Abbass, Helton, Mhatre, and Sansgiry (2012) proposed to study the impact of the EHR
on nursing productivity using data collected on a national level from the American Hospital
Association survey and Centers for Medicare & Medicaid Services data. One purpose of the
study was to provide a more generalizable study than previous evaluations of nursing
productivity which were limited in external validity due to the previously mentioned constraints:
small sample size, specificity of unit and/or application. The retrospective cross sectional study
hypothesized that productivity would increase in hospitals with higher levels of EHR
implementation. Nursing productivity was operationalized with a formula involving the number
of full time equivalent RNs who produced a defined output calculated from inpatient and
outpatient days and from inpatient and outpatient revenue. EHR implementation was
operationalize by the number of EHR components functioning. The study made some
assumptions about staffing including that the EHR would decrease documentation time and
increase time for patient care. Sample size was 3368 hospitals after excluding hospitals with
outliers in any of the measured variables. Findings did not support the hypothesis and the authors
concluded that expectations of decreased staffing based on implementation of EHR would likely
not be met. This is an important consideration when defining HIT success.
Ward, Vartak, Schwichtenberg, and Wakefield (2011) evaluated the impact of an EHR
implementation on nurses ‘perceptions of workflow and patient care in a rural hospital. Using a
survey developed and validated for the study, participants rated their perceptions on effects to
communication, care, support/resources, and individual impacts. The survey was administered
over three periods, pre training, post-implementation and post implementation. Positive
responses decreased over all three study periods. From the first to the second study period, 17%
Page 32
EFFECTIVENSS OF UCD FOR OPTIMIZING FORM 19
of survey items had a significant decrease and from the second to third study period 79% of
survey items had a significant decrease. The greatest decrease concerned perceptions of
communication, improved care and care processes.
Nurses’ attitude and satisfaction. User satisfaction with clinical applications is an
important component of HIT success and impacts the use of applications by clinicians (Palm,
Colmbet, Sicotte & Degoulet, 2006; Ward, Stevens, Brentnall, & Briddon, 2008). Attitudes are
influenced by the functionality of the system, design of content, and training (Ward et al., 2008).
Chow, Chin, Lee, Leung and Tang (2011) used a cross sectional survey design to study
nurses’ attitudes and satisfaction with a computerized documentation system implemented in a
450 bed private hospital. Survey questions addressed level of IT support, perceived usefulness,
perceived ease of use and level of satisfaction with the application and attitude. Results
indicated that although nurses had a level of satisfaction with the application, they were not
satisfied that the application would improve care or efficiency.
Kimiafar, Sadoughi, Sheikhtaheri, and Sarbaz (2014) used a fuzzy analytic hierarchy
process to weight factors for their degree of influence on nursing satisfaction with HIT. Based
on a review of the literature, the authors selected information quality, service quality and system
quality as the main factors impacting user satisfaction. Subfactors for each of the main factors
were also determined. For example, a subfactor for information quality was availability and a
subfactor for service quality was training. Weights for each factor were calculated through a
process which presented the factors as pairs for comparison by a sample of ten experienced
nurses. The highest weighted factor was information quality which was twice as impactful as
service quality. The lowest weighted factor was system quality. A limitation of this study was
Page 33
EFFECTIVENSS OF UCD FOR OPTIMIZING FORM 20
the small sample size; however the findings can inform future studies evaluating user satisfaction
based on interventions applied to one or more of these factors.
Hsiao, Chang and Chen (2011) used a survey to gather data on nursing perspective of
factors affecting acceptance of healthcare information systems. The instrument was a 39 item
questionnaire adapted from a previously validated and published study. Content validity of the
adapted instrument was measured using Cronbach’s alpha and the tool showed a high content
validity. The sample consisted of nurses working in one hospital. The study’s conceptual
framework suggested that satisfaction with HIT indicated acceptance and was a product of
perceived usefulness and perceived ease of use. Information quality was found to significantly
impact both usefulness and ease of use. Top management support and compatibility were other
factors with significant impacts on usefulness.
Information quality. Nurses often serve as the central coordinators and communicators
of patient information, and much of this information is entered as data into the medical record
(Keenan et al, 2013). Data may include a patient’s past or current condition, nursing cares and
interventions provided to the patient, the patient’s response to treatment, the nurse’s decision
making processes based on the patient’s presentation and progress, and data required for
regulatory agencies (Urquhart, Currell, Grant, & Hardiker, 2009; Wang, Hailey, & Yu, 2011).
The patient’s record should serve as a communication tool for the healthcare team; however, for
the team to efficiently and effectively use nurse collected data, information must be complete
and easily located, readable and actionable (Cusack, et al. 2013).
Challenges with the quality of nursing information in the EHR arise from processes of
entering and accessing information. Checklist documentation is designed to improve the
Page 34
EFFECTIVENSS OF UCD FOR OPTIMIZING FORM 21
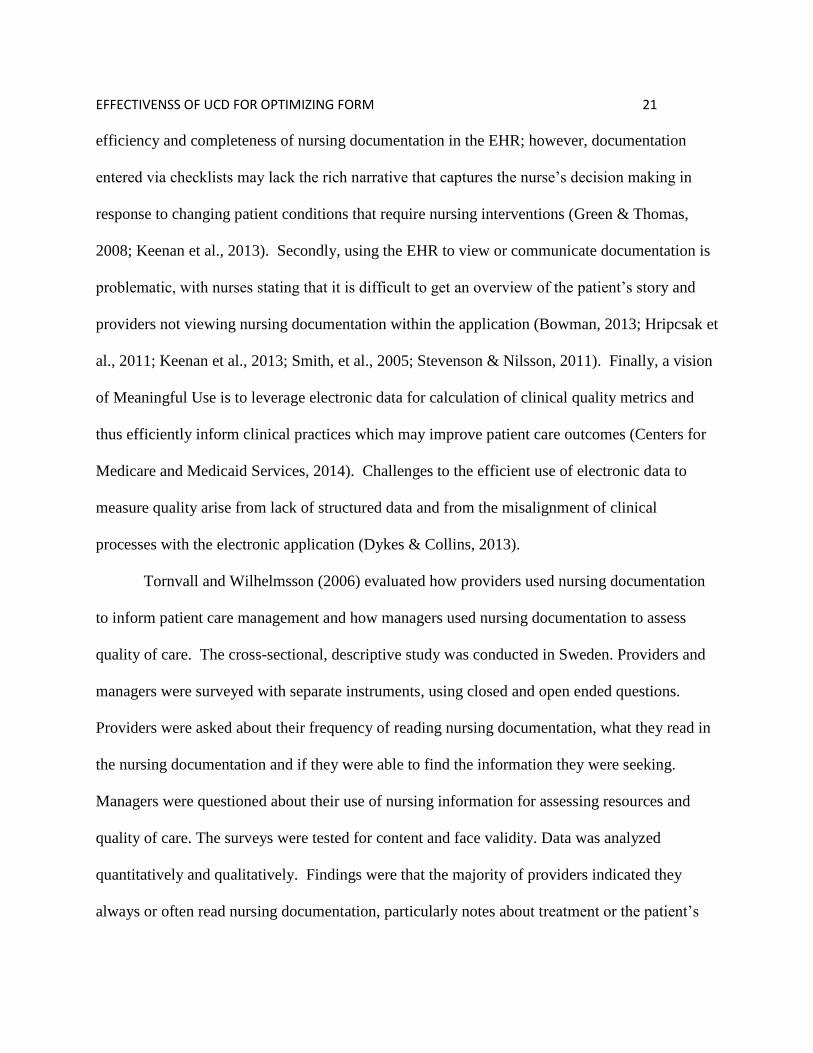
efficiency and completeness of nursing documentation in the EHR; however, documentation
entered via checklists may lack the rich narrative that captures the nurse’s decision making in
response to changing patient conditions that require nursing interventions (Green & Thomas,
2008; Keenan et al., 2013). Secondly, using the EHR to view or communicate documentation is
problematic, with nurses stating that it is difficult to get an overview of the patient’s story and
providers not viewing nursing documentation within the application (Bowman, 2013; Hripcsak et
al., 2011; Keenan et al., 2013; Smith, et al., 2005; Stevenson & Nilsson, 2011). Finally, a vision
of Meaningful Use is to leverage electronic data for calculation of clinical quality metrics and
thus efficiently inform clinical practices which may improve patient care outcomes (Centers for
Medicare and Medicaid Services, 2014). Challenges to the efficient use of electronic data to
measure quality arise from lack of structured data and from the misalignment of clinical
processes with the electronic application (Dykes & Collins, 2013).
Tornvall and Wilhelmsson (2006) evaluated how providers used nursing documentation
to inform patient care management and how managers used nursing documentation to assess
quality of care. The cross-sectional, descriptive study was conducted in Sweden. Providers and
managers were surveyed with separate instruments, using closed and open ended questions.
Providers were asked about their frequency of reading nursing documentation, what they read in
the nursing documentation and if they were able to find the information they were seeking.
Managers were questioned about their use of nursing information for assessing resources and
quality of care. The surveys were tested for content and face validity. Data was analyzed
quantitatively and qualitatively. Findings were that the majority of providers indicated they
always or often read nursing documentation, particularly notes about treatment or the patient’s
Page 35
EFFECTIVENSS OF UCD FOR OPTIMIZING FORM 22
experience with illness and the providers could generally find what they were looking for;
however, providers indicated that sometimes nursing documentation was too wordy and this
made it difficult to find the information the provider considered important. Furthermore, nursing
information may lack specific details the provider needed, with the nurse emphasizing
descriptions of care provided rather than assessment of patient condition. The authors concluded
that in order to serve as an effective interprofessional communication tool, nursing
documentation needs to be developed collaboratively with the healthcare team. A limitation of
the study is that the findings are not generalizable due to work processes unique to the
organization and to the specificity of the electronic application.
Two recent studies evaluating information quality after implementation of electronic
nursing documentation showed mixed results in the perception of quality by users. Ammenwerth,
Raughegger, Ehlers, Hirsh, and Schaubmayr (2010) evaluated quality of information processing
after implementation of electronic documentation. A survey was administered to nurses after
training on the new system and repeated one year post. The survey evaluated the quality of the
hospital information system and was validated with Cronbach’s alpha. Benefits perceived by
users of electronic documentation were faster data entry, more complete documentation,
improved communication, and improved presentation of data; however, presentation was also
described as problematic, because it was difficult to identify important information. Other
problems were that the electronic system was time consuming, at times required double
documentation, and was missing the ability to free text in some assessments.
Michel-Verkerke (2012) evaluated the perception of information quality, ease of use and
frequency of use by nurses in the Netherlands using open and closed ended questions. Validity of
Page 36
EFFECTIVENSS OF UCD FOR OPTIMIZING FORM 23
the instrument was not addressed. Nurses identified that they want information that is timely,
accessible, complete and accurate. With electronic documentation, nurses indicated that they did
not always trust that data entered was accurate and that entering data was time consuming. A
recommendation was that standardizing assessment forms could reduce the effort required to
enter data.
Usability. Studies evaluating information quality frequently address the efficiency and
effectiveness of data entry and retrieval. The efficiency, effectiveness and satisfaction with
which users are able to “achieve specified goals” with an application is referred to as usability
(National Institute of Standards and Technology [NIST], 2013, Overview). The full benefit and
safe use of an EHR may not be realized unless the system is usable (NIST, 2013; Rojas &
Seckman, 2014; McDowell, Dillon & Lending, 2008). Usability evaluation involves applying
usability principles or heuristics (Rojas & Seckman, 2014; Rogers et al., 2013). Examples of
these principles include internal and external consistency of the application; effective
presentation of information, match with mental model, efficiency, flexibility, and recovery from
errors (Rogers et al., 2013; Rojas & Seckman). The evaluation of usability has historically been
aimed at the appearance or the functionality of systems; but future emphasis on usability
evaluation of HIT should consider the impact of the system on the workflow of clinicians
(Rogers et al., 2013).
The National Institute of Standards and Technology (NIST) has published guidelines for
improving usability of the EHR (Schumacher & Lowry, 2010). A recommendation is to
incorporate a process of user centered design (UCD) which results in EHRs that are “efficient,
effective, and satisfying to the user” (Schumacher & Lowry, 2010, p. 5). UCD, or similar user
Page 37
EFFECTIVENSS OF UCD FOR OPTIMIZING FORM 24
centered processes, have been used to enhance electronic nursing documentation, develop
customized HIT tools, design electronic clinical handover tools, design interactive consumer
health technologies, and redesign interfaces (Dabbs et al., 2009; DeVoe et al., 2014; Johnson,
Johnson & Zhang, 2005; Kennedy Page & Schadler, 2014; Wong, Cummings, & Turner, 2013;
Zopf-Herling, 2011). An observation in this body of literature is that poor designs have been
tolerated by users of HIT, and there has been little attention to the impact poor design has on
desired outcomes (Dabbs et al., 2009; Johnson et al., 2005; Wong et al., 2013; Zopf-Herling,
2011).
Zopf-Herling (2011) described a process of redesigning nursing documentation with user
input and incorporating “rules of thumb” (p. 680). These rules addressed the efficiency and
effectiveness of data entry. For example, one rule required consistency in presentation of data
fields within an assessment: all data should be entered with checkboxes or all data should be
contained within drop downs. An example of effectiveness was using triggers to guide content
based on the answer to a previous question. After redesigning assessments, the number of data
fields on some assessments was reduced by almost 50%, there was decreased number of clicks,
and users recognized the value of the electronic health record as a tool supporting clinician
efforts.
Kennedy Page and Schadler (2014) also redesigned, or optimized, existing electronic
assessments using a usability checklist. The purpose of the study was to increase the efficiency,
effectiveness and user satisfaction with the HIT application which would then impact patient
outcomes. The process involved early and frequent engagement of users during the design and
testing phases, following the UCD iterative process of engagement, design, test, and redesign.
Page 38
EFFECTIVENSS OF UCD FOR OPTIMIZING FORM 25
Users rated the design with a checklist developed from usability heuristics addressing such
attributes as: simplicity, consistency, naturalness, flexibility, and effectiveness. Evaluation
measured user satisfaction with a questionnaire, efficiency metrics by counting keystrokes, and
impact on certain patient outcomes measured for regulatory purposes. The study followed a pre
and post design. Findings were statistically significant for improvements in efficiency,
effectiveness and satisfaction post optimization with user engagement in the design and testing
using a usability checklist.
Project Plan and Evaluation
Market/Risk Analysis
The organization is the primary safety net hospital for the region and provides both
inpatient and ambulatory services through a 500 bed acute care hospital, eight community health
centers and sixteen school based clinics. Trends currently influencing the provision of healthcare
in the United States and impacting safety-net organizations include:
Sustaining financial viability;
Increasing patient engagement;
Implementation and continued development of Health Information Technology (HIT) to
meet Meaningful Use (MU) standards (Zaman, Cummings, & Laycox, 2012).
As a safety-net hospital, the mission of organization is to provide care to all; this includes the
uninsured and Medicaid and Medicare populations. In 2011, the uninsured generated $374
million in billed charges, of which the organization collected five cents on the dollar (Burnett,
2011). Meeting the healthcare needs of this population within the financial constraints of limited
or no reimbursement for costs is a continuing challenge for safety-net hospitals.
Page 39
EFFECTIVENSS OF UCD FOR OPTIMIZING FORM 26
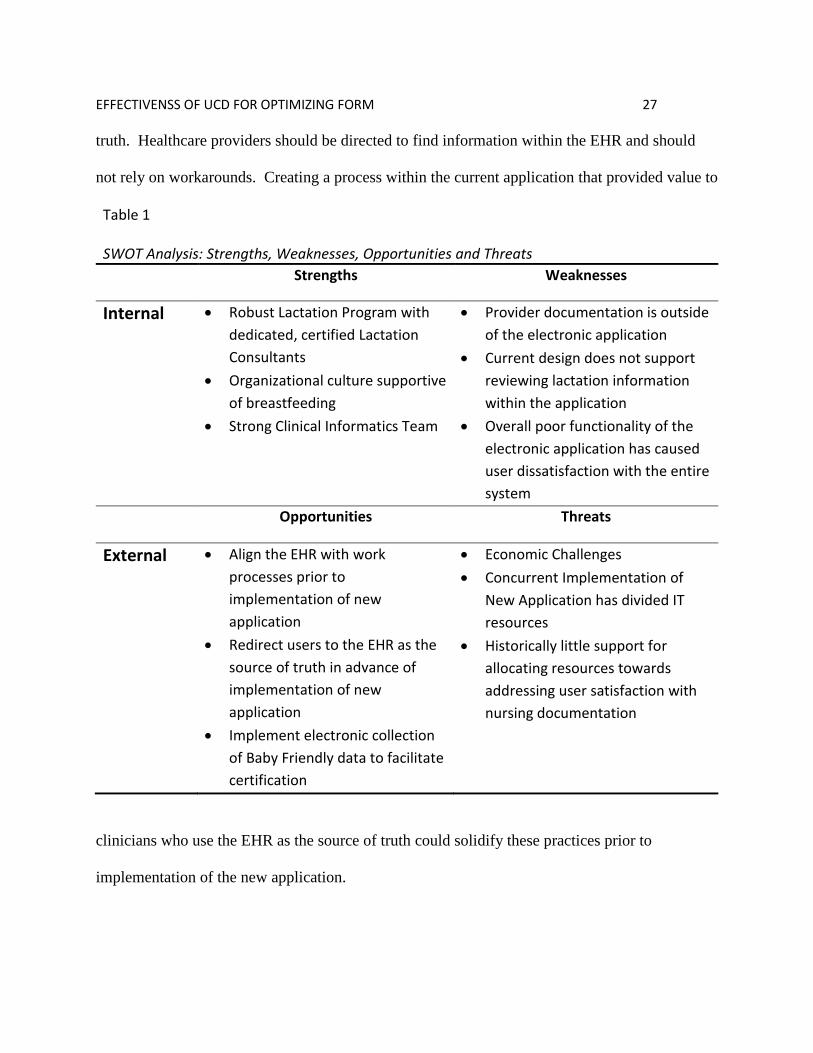
Strategies, weaknesses, opportunities and threats analysis. A SWOT analysis (see
Table 1) identifies the strengths, weaknesses, opportunities and threats from internal and external
factors which drive and restrain product implementation (Harris, Rouseel, Walters & Dearman,
2011). For this project, internal factors were the strengths and weaknesses which impact
clinicians, whereas external factors were the opportunities and threats affecting the organization
as a whole. The product implemented was the optimized lactation assessment. Support for the
change came from the clinical informatics team and the lactation team, but the project competed
for limited technical resources with other organizational initiatives.
Internal strengths included the two teams advocating for change as well as organizational
support for breastfeeding. The lactation team has been described previously. The clinical
informatics (CI) team was a bridge between technicians who develop an electronic application
and clinicians who use the application. Without the input of clinicians on the CI team,
technicians risked designing and implementing processes which did not support provider and/or
nursing workflows. The CI team advocated for clinicians so that technical applications
successfully added value to clinician work.
Internal weaknesses identified were that provider documentation was outside of the
electronic application which decreased opportunities for providers to efficiently use the
application to view nursing documentation, regardless of the quality of the information or the
ease of locating information. Due to the poor functionality of the application, users were doubtful
that any optimization of the current system would improve clinician work.
An opportunity, however, was to implement processes in advance of the new application
to correct user’s disconnect with the EHR. Ideally, the EHR would be seen as the source of
Page 40
EFFECTIVENSS OF UCD FOR OPTIMIZING FORM 27
truth. Healthcare providers should be directed to find information within the EHR and should
not rely on workarounds. Creating a process within the current application that provided value to
Table 1 SWOT Analysis: Strengths, Weaknesses, Opportunities and Threats
Strengths Weaknesses
Internal Robust Lactation Program with
dedicated, certified Lactation
Consultants
Organizational culture supportive
of breastfeeding
Strong Clinical Informatics Team
Provider documentation is outside
of the electronic application
Current design does not support
reviewing lactation information
within the application
Overall poor functionality of the
electronic application has caused
user dissatisfaction with the entire
system
Opportunities Threats
External Align the EHR with work
processes prior to
implementation of new
application
Redirect users to the EHR as the
source of truth in advance of
implementation of new
application
Implement electronic collection
of Baby Friendly data to facilitate
certification
Economic Challenges
Concurrent Implementation of
New Application has divided IT
resources
Historically little support for
allocating resources towards
addressing user satisfaction with
nursing documentation
clinicians who use the EHR as the source of truth could solidify these practices prior to
implementation of the new application.
Page 41
EFFECTIVENSS OF UCD FOR OPTIMIZING FORM 28
Threats to implementation were competing IT projects which took resources away from
optimization of the current system. The organization was embarking on a multi-million dollar
effort to implement a new enterprise wide system over the proceeding twenty-four months. This
effort not only pulled resources that supported the current system but also demanded justification
for optimizing the current state when changes would be only be temporary. A final threat was
that, overall, the organization had historically put resources towards developing order sets and
not towards optimizing documentation.
Driving and restraining forces. Driving forces for the project were the regulatory
measures of exclusive breastmilk feeding, the Baby Friendly initiative, and organizational
support for projects which impact patient engagement and safety and quality. Restraining forces
were other projects driven by regulatory, patient safety, or economic impacts competing for
limited information technology resources.
Need, resources, and sustainability. The organization’s strategic plan consisted of six
pillars: financial strength, workforce engagement, patient experience, growth, patient safety and
quality, and community. Any new initiative within the organization would support at least one
of these pillars. The lactation team requested changes to their lactation assessment to facilitate
documentation requirements. Optimization of the lactation assessment directly supported the
workforce engagement pillar and indirectly supported patient experience, patient safety and
quality, and financial strength pillars.
The eHS (electronic Health Services) department had developed standard work for
addressing EHR issues and requests. Issues or requests were identified by users and triaged by a
small eHS team to the appropriate solutions group. The solutions group consisted of leaders
Page 42
EFFECTIVENSS OF UCD FOR OPTIMIZING FORM 29
within the clinical area who, with the assistance of the clinical informatics team, conducted an
initial analysis to identify the current state, ideal future state, and possible solutions. The
solutions group then endorsed or declined the issue. Senior eHS management assigned resources
for endorsed electronic health service initiatives. Work that required fewer than forty hours to
complete was assigned by the team manager; when the project required more than forty hours to
implement, the request was reviewed by a panel of senior leadership for approval and assignment
of project resources. Because this project required less than forty hours of effort, the team
manager assigned resources as available to complete the request (See Table 2).
Table 2
Project Expenses for Implementation and Evaluation
Effort Task Responsible Role Hours Cost (in
dollars)
Analysis and Design Clinical Informaticist; Subject Matter Experts 5 250 Build Application Analyst 8 320 Test Testing Office 3 60 Educate Clinical Informaticist 5 250 Evaluate Clinical Informaticist 4 200
Implementation TOTAL 25 $1080
Sustainability: Ongoing Support Yearly 4 $175
Changes made to any EHR are part of the ongoing systems life cycle applicable to
electronic applications. Optimization is continuous and has been likened to a philosophy of
continuous quality improvement (CQI) (National Learning Consortium, 2013). By adopting a
CQI approach to EHR optimization, the organization continuously drives the application towards
an ever moving future state. Consequently, changes to the lactation assessment itself are
Page 43
EFFECTIVENSS OF UCD FOR OPTIMIZING FORM 30
sustainable only until there are new documentation requirements for implementation. An
estimate of ongoing yearly costs to audit use and educate end users based on audit results is
supplied in Table 2.
Feasibility, risks and unintended consequences. The requested changes to the lactation
assessment were feasible within the functionality of the application and within the resources of
the organization. The change management process followed by the organization for changes to
the EHR was intended to identify and eliminate risks. Actively involving clinical users in the
optimization process through the process of user centered design and monitoring for
workarounds was a means of mitigating unintended consequences resulting from EHR change
(Jones et al., 2011).
Stakeholders and Project Team
Stakeholders are members of an organization who endorse a project and advocate for
support (Harris et al., 2011). Stakeholders included: lactation consultants, providers, staff
nurses, support staff, the clinical informatics team and IT experts. The project team consisted of
those individuals who would create the product and included members from all stakeholder
groups (see Table 3). The project team identified the problem, the current state, the ideal future
state, and a feasible solution. The project manager was the single source of accountability and
was responsible for the overall project outcome. Resources for project completion were directed
by the resource manager. The business owner was the stakeholder who had identified the
problem and was responsible for the overall solution as well as aligning work process with the
proposed solution.
Cost Benefit Analysis
Page 44
EFFECTIVENSS OF UCD FOR OPTIMIZING FORM 31
Measuring the costs and benefits of an EHR implementation and optimization has
challenges because traditional methods of calculating ROI fail to account for the potential long
term benefits of EHR adoption that extend beyond the boundaries of a single organization and
Table 3
Stakeholders and Project Team Role
Stakeholder
Skill Set Project Team Role
Lactation Consultants
Experts who assess breastfeeding couplets and develop plans of care to support breastfeeding goals for the couplet, mother or infant. The clinicians who document within the electronic lactation assessment.
Subject Matter Expert Business Owner
Providers Responsible for the medical care for mothers and/or newborns. Practice in both inpatient and outpatient care settings. Use the lactation plan of care to inform healthcare decision making.
Subject Matter Expert
Staff Nurses: Mom/Baby Unit; NICU
Provide 24/7 care to breastfeeding mothers and or infants and use the lactation plan of care to inform healthcare decision making.
Subject Matter Expert
Outpatient Support Staff: WIC, Nurse Line
Use the lactation plan of care to inform healthcare decision making.
Subject Matter Expert
Clinical Informatics and IT experts
Use the system lifecycle to develop electronic solutions to support clinician work processes. Understands technology limitations which may impact ideal solutions.
Resource Manager Project Manager Principal Investigator Application Analyst Educator Solution Tester
Page 45
EFFECTIVENSS OF UCD FOR OPTIMIZING FORM 32
could impact society as a whole (Arlotto, 2014). Traditionally, return on investment (ROI) for
IT implementation has been measured through reductions in FTEs, supplies, and errors (Arlotto,
2014). Additionally, published reports of ROI for EHR implementations have not used
consistent reporting frameworks which decreases the ability to make comparisons between
organizations or applications (Adler-Milstein et al, 2014). Yet, the benefits to society of a
robust, meaningful EHR expand beyond the ROI for a single organization (Adler-Milstein et al.,
2014; Arlotto, 2014). Realizing the full benefit of a meaningful EHR will require that
organizations align anticipated benefits of the EHR with “next generation” values of patient
centered care coordinated between providers (Arlotto, 2014).
A model was proposed by a subgroup of the Institute of Medicine’s Roundtable on Value
and Science-Driven Health Care to assess institutional ROI by identifying expenses and benefits
resulting from implementation and ongoing support of an EHR (Adler-Milstein et al, 2014). One
of the expenses depicted in the model is administrative time spent optimizing the EHR. Benefits
depicted in the model included improved communication to decrease office visits, reduced
variability of care, reduced clinician time spent documenting, and reduced time spent obtaining
paper charts (Adler-Milstein et al, 2014).
Following this model, the organization could expect to see a long-term ROI for expenses
related to optimizing the lactation assessment even though these benefits are not quantifiable.
Long term benefits were expected to be improved communication between the healthcare team
resulting in consistent messaging to breastfeeding woman and support for exclusive breast milk
feeding. Although benefits were not quantifiable, costs were calculated (see Table 2) and were in
Page 46
EFFECTIVENSS OF UCD FOR OPTIMIZING FORM 33
line with similar eHS projects which are considered part of ongoing management of the
application.
Mission, Vision, Objectives and Goals
The organization’s mission described its role as an academic, safety net organization
providing health care to all while educating future health care professionals. The outcome of the
vision was the organization’s mission of a healthy community. The organization measured
performance against the six pillars of financial strength, growth, patient experience, workforce
engagement, community and patient safety and quality. The organization asked that new
initiatives align with these pillars. This project’s mission and vision demonstrate alignment with
the pillars and support for a healthy community.
Project mission. Optimize an electronic lactation assessment with user centered design
and realize immediate positive impacts to Information Quality, User Satisfaction and Use with a
goal of benefiting the triple aim of better health, better care and lower costs for the community.
Project vision. Implement user centered IT solutions to:
Enhance the patient experience,
Ensure patient safety and quality and
Support work force engagement.
Project objectives. The project objectives encompass the short term outcomes as
depicted on the Logic Model (see Appendix A). The project objectives test the effectiveness of
user centered design for increasing determinants of IS Success (information quality, use and user
satisfaction) through the implementation of an optimized electronic lactation assessment within
Page 47
EFFECTIVENSS OF UCD FOR OPTIMIZING FORM 34
the study period and measuring use, information quality and user satisfaction pre and post
implementation. The project objectives are to:
Increase use of information within the lactation assessment by the healthcare team from
pre intervention to post intervention;
Increase user satisfaction with the electronic lactation assessment from pre intervention to
post intervention;
Increase information quality of the electronic lactation assessment from pre intervention
to post intervention.
Project goals. Project goals are the long term outcomes and the impact of the project as
noted on the Logic Model. Project goals are to:
Provide support for:
o Collaborative, consistent messaging for breastfeeding families;
o Baby Friendly certification;
o Exclusive breast milk feeding.
Positively impact the triple aim of better care, lower costs, and better health.
Logic Model
A logic model is a tool to communicate the plan for a project from resources needed,
constraints to consider, activities to plan, outputs and outcomes (White and Zaccagnini, 2011).
The logic model (see Appendix A) can be either a general overview or a detailed plan. This
project was within the scope of the ongoing expenses associated with EHR maintenance and
optimization. Inputs were consistent with these expenses. Constraints were competition with
Page 48
EFFECTIVENSS OF UCD FOR OPTIMIZING FORM 35
other projects for limited EHR resources, the functionality of the current application, and
undefined work process, which was also viewed as an opportunity for the organization to
implement not only changes to the EHR assessment but changes to work processes that would
support the new application as well. Activities for the project followed the systems life cycle for
EHR projects and included the specific tasks of user centered design. The output of the project
was an optimized electronic lactation assessment. Success was measured through effects on
information quality, use, and user satisfaction. DeLone and McLean’s (2003) causal model
predicts that positive effects to these attributes of IS success will, in turn, positively impact net
benefits for the organization, which are listed in the logic model under long term outcomes. The
impact of IS success is the triple aim of better care, lower costs, and better health.
Design and Methodology
Research design. The design chosen for this study was a quasi-experimental, pre-test-
post-test design. Randomization was not feasible due to ethical and financial considerations
around withholding an intervention that was expected to improve patient care and due to
increased costs related to maintenance of the pre-test application. The use of a non-
experimental design increased the risk of threats to causality from confounding variables which
may have offered alternative explanations (Harris et al., 2006). It was hoped that a relatively
short evaluation period would decrease the threat to internal validity from alternative
explanations arising from changes to the confounding variables identified within the conceptual
model.
Timeline. After approval from Loretto Heights School of Nursing, Regis University, the
project was submitted to the Colorado Multiple Institutional Review Board (COMIRB) and to
Page 49
EFFECTIVENSS OF UCD FOR OPTIMIZING FORM 36
Regis University’s IRB for approval. The pre and post-test periods covered six weeks each. The
pre-test period began on October 1, 2014. The intervention was implemented on November 11,
2014. The post-test period began on April 14, 2015.
Population
Two populations were identified, one for participation in a survey and one for
retrospective chart audit and documentation use query. The survey population consisted of
inpatient and outpatient healthcare clinicians. Inclusion criteria were clinical employees of the
organization who provided care to breastfeeding infants and/or mothers and documented in
and/or accessed information from the EHR. Exclusion criteria was all who did not fit the
inclusion criteria.
The chart audit and use query population was identified as postpartum breastfeeding
women and newborns who received inpatient care at the organization. Inclusion criteria were
newborns or postpartum patients receiving care on the Mom/Baby unit, who had a lactation
consult order placed during their postpartum or newborn encounter, and whose lactation consult
was documented electronically during their inpatient stay. Exclusion criteria were those who did
not meet the inclusion criteria.
Human subject protection. Expedited IRB approval as a research study was received
from both the organization and from Regis University. Volunteers for survey participation were
solicited through invitations sent to work email addresses. The survey was completed
electronically and the participant’s name, IP address, and/or login were not recorded. Survey
results were stored in a file on the principal investigator’s password protected drive within the
Page 50
EFFECTIVENSS OF UCD FOR OPTIMIZING FORM 37
organization’s servers. Results will remain in the protected drive for a period of seven years
from the completion of the study or until August 31, 2022.
There were minimal risks identified for survey participants and these included time to
complete the survey. Risks were minimized by educating survey participants that the survey was
voluntary and that they could choose to withdraw from the survey at any point. Benefits for
healthcare providers were that the study could lead to improved information quality which may
provide efficient and effective access to information to inform clinical decision making.
The chart audit tool and use query temporarily recorded the patient’s MRN number. The
data was stored on the organization’s password protected computer drive in a password protected
folder. At the conclusion of each data collection period, the data was de-identified and this de-
identified information was stored on the principal investigator’s password protected drive within
the organization’s server. The de-identified information will remain on the password protected
drive for a period of seven years from the completion of the study or August 31, 2022. There
were no identified risks to patients. Benefits for patients were identified as a potential for
improved care coordination and consistent communication.
Vulnerable populations. This project did involve newborns which are considered a
vulnerable population. There were no risks identified for this populations. Consideration for this
vulnerable population was through de-identification of all patient data. Medical and nursing care
of newborns was unaffected.
HIPAA compliance. The project complied with HIPPA regulations allowing a waiver of
consent for the use of patient data by de-identifying all data collected after the fourteen day
collection period. Consent for the user survey was obtained within the survey.
Page 51
EFFECTIVENSS OF UCD FOR OPTIMIZING FORM 38
Setting. The setting was an integrated safety-net healthcare organization in an urban,
southwestern United States location. The organization delivered over 3000 newborns annually,
of which the majority were followed after discharge in the organization’s outpatient clinics. The
organization implemented the Soarian Clinicals application for inpatient electronic nursing
documentation and CPOE in January of 2013. Electronic nursing documentation consisted of
assessments and plan of care documentation. Inpatient provider documentation remained on
paper. Outpatient provider documentation was in a separate electronic application. Outpatient
users could access either Soarian Clinicals or a third application, the electronic data management
system (EDM), to view inpatient records. EDM was the long term storage application for patient
information and was considered the legal medical record. Only EDM included both electronic
documentation and scanned paper documentation.
A challenge with viewing electronically documented information in EDM was that the
format was not designed to provide a user friendly view of information. The presentation was in
small print and veered slightly from the flow of the electronic form. For example, information
that flowed vertically in the electronic version, was presented left to right in EDM. This
sometimes resulted in a disjointed presentation of electronically documented information.
Newborns were scheduled for a two week follow up visit after discharge with their
outpatient provider. During this visit, the provider routinely accesses EDM to view the scanned
inpatient Newborn Medical Record form which contains the inpatient provider’s documentation
of maternal history, delivery information, and the initial and discharge exams. The electronic
lactation assessment documentation was also available within this same EDM encounter. The
Page 52
EFFECTIVENSS OF UCD FOR OPTIMIZING FORM 39
forms were listed alphabetically so the lactation form was close to the Newborn Medical Record
in the EDM list.
The initial electronic lactation assessment, prior to optimization, was used by lactation
consultants to document assessment findings, interventions, and recommendations. This
assessment was designed in-house based on the previous paper form. The electronic form did
not contain discrete data elements addressing Baby Friendly documentation requirements,
making required audits challenging. In addition, the assessment did not contain a specific
location to document recommendations and a plan of care. Instead, the assessment had a total of
five free text boxes placed throughout the assessment following each section: the breast
assessment, the infant assessment, the feeding assessment, the education documentation, and the
reason for the consult. An audit of lactation documentation showed that recommendations or
plans were scattered throughout the assessment in any one or more of the text boxes. This made
quickly locating and reading the lactation consultant’s plan challenging, particularly when
accessing this information in the already difficult presentation in EDM.
Intervention
The intervention was an optimized electronic lactation assessment. Through a user-
centered design process, the lactation assessment was optimized to allow users to efficiently and
effectively enter and view information. One goal of optimization was to provide a lactation
assessment form that allowed for discrete data entry of required Baby Friendly education
documentation. A second goal was to clearly identify the lactation consultant’s plan and
recommendations within the documentation. Meeting these goals would allow for more efficient
Page 53
EFFECTIVENSS OF UCD FOR OPTIMIZING FORM 40
auditing of documentation for Baby Friendly and provide clinicians with a focused view of the
breastfeeding plan and recommendations when reviewing the documentation.
User centered design process. Optimization of the lactation assessment took place over
a period of three months prior to the study period. Optimization was facilitated by a Nursing
Informaticist (NI). The NI met with the lactation consultants to identify the lactation
consultants’ perception of documentation requirements and to engage them in the design process.
The NI shadowed three lactation consultants during this time to observe their workflow and
documentation. The NI also met with outpatient providers to develop an understanding of their
requirements for accessing lactation information. The NI designed the optimized assessment
using a tool that was part of the EHR application and allowed users to view the new assessment
in a form that mirrored the electronic screens within the application. Screen shots were reviewed
by the lactation consultants and changes were made based on user input until the users expressed
satisfaction with the design and indicated that all requirements for documentation were met. The
NI then coordinated with a technical analyst who built the assessment in the application’s test
environment. Once the assessment was live in the test environment, the users tested the
assessment within the electronic system. No further changes were made at this time because
users expressed satisfaction with the design. The test assessment then went through the
organization’s processes for testing prior to implementation in the live environment. This
process took approximately one month. No further changes were indicated.
Dependent Variables
The dependent variables were information quality, use, and user satisfaction. Information
quality was conceptually defined as the “desirable characteristics of the system outputs” (Petter,
Page 54
EFFECTIVENSS OF UCD FOR OPTIMIZING FORM 41
DeLone & McLean, 2008, p. 239). Examples include completeness, accuracy, relevance and
usability. DeLone and McLean (2003) do not further define usability; however, a well-accepted
definition of usability is efficiency, effectiveness and user satisfaction with an application
(Schumacher & Lowry, 2010). Information quality was operationally defined by the proportion
of lactation assessments containing recommendations or plans, the proportion of lactation
assessments indicating that patients were educated on the risks and benefits of formula, a
required component of Baby Friendly education, and by the level of agreement users indicated
with survey statements addressing completeness, accessibility, accuracy, relevance, availability
and acceptability of the electronic lactation assessment. There is moderate to strong support for
the causal relationship between information quality and user satisfaction, and there is insufficient
data to support the causal relationship between information quality and use (Petter et al., 2008).
Use was conceptually defined as how users “utilize the capabilities of the information
system” (Petter et al., 2008, p. 239). Examples include amount of use and frequency of use. Use
was operationally defined as the number of completed lactation assessments accessed by users
within the EHR and as the reported frequency of accessing the EHR for lactation information.
There is moderate to strong support for the causal relationship between use and net benefits, and
there is insufficient data to support the proposed relationship between use and user satisfaction
(Petter et al., 2008).
User satisfaction was conceptually defined as the level of satisfaction with HIT products
(Petter et al., 2008). User satisfaction was operationally defined as the level of agreement with
survey statements addressing the impact of the electronic lactation information on quality of
care, ease of job, and ability to share patient information amongst healthcare team members.
Page 55
EFFECTIVENSS OF UCD FOR OPTIMIZING FORM 42
There is moderate to strong support for the causal relationship between user satisfaction and use
and between user satisfaction and net benefits (Petter et al., 2008).
Confounding Variables
Confounding variables pose a risk to internal validity in quasi experimental studies
(Harris et al., 2006). The interdependent relationships proposed in the IS Success Model
(DeLone & McLean, 2003) that are not included as dependent variables in the conceptual model
were considered to be possible confounding variables. These included system quality and
service quality. System quality was conceptually defined as desirable characteristics of the
system itself such as how easy it is it to use the application as a whole, how the application fits
into the user’s workflow or how intuitive it is (Petter et al., 2008). Two components of system
quality were measured by the survey instrument. These were ease of use and integration with
workflow, and were operationalized by level of agreement with survey statements addressing
ease of use, integration with workflow.
Service quality, is conceptually defined as the level of support users receive from the
organization. Service quality was expected to remain constant throughout the study period and
was not operationally defined. There is strong support for the effect of system quality on user
satisfaction, mixed support for the effect of system quality on use and service quality on user
satisfaction and insufficient data on the effect of service quality on use (Petter et al., 2008).
Booth (2012) identified additional recommendations for variables that may increase
generalizability of studies including the type of technology, nurse demographics and patient
populations. None of these variables were anticipated to change during the study period.
Page 56
EFFECTIVENSS OF UCD FOR OPTIMIZING FORM 43
Demographic data on the study sample was collected including profession, length of experience
at the organization, and patient population cared for by the participant.
Data Collection Instruments
Data was collected from completed surveys, chart audits and a use query. Survey data
included user demographics, self-reported use, and user’s perception of system quality, user
satisfaction and information quality. Chart audits gathered data on information quality of
lactation assessments (see Appendix B). Use query data was the number of lactation
assessments accessed by users pre and post discharge as a measure of use. An explanation of
variables is given previously (see Dependent variables and Confounding variables).
Survey. The survey (see Appendix B) was modified from the Canada Health Infoway’s
System and Use Assessment Survey, publically available from the Agency for Healthcare
Research and quality (AHRQ) Health IT Survey Compendium (AHRQ, n.d.). The System and
Use Assessment Survey is a questionnaire focusing on satisfaction and components of usability
appropriate for use across the health care system and for evaluation studies that include the EHR
(AHRQ, n.d.). The survey was developed as an evaluation tool to measure components of the
Infoway Benefits Evaluation Framework, which is closely based on the DeLone and McLean IS
Success model (Canada Health Infoway, 2012). Dimensions addressed by the survey are system,
information and service quality, self-reported use and user satisfaction. Survey questions were
developed by evaluation of Subject Matter Experts and the organization’s evaluation team
(Canada Health Infoway, n.d. Benefits Evaluation Survey Process). The survey consisted of five
point Likert-type response formats with answers ranging from strongly agree to strongly
disagree.
Page 57
EFFECTIVENSS OF UCD FOR OPTIMIZING FORM 44
The System and Use Assessment Survey was modified for use in this study. Some
questions that did not pertain to the current study were eliminated and some verbiage was
changed to include the specific assessment evaluated. Questions on use were added by the
researcher. Permission for use of the survey in a modified form was received from the
developers (see Appendix C).
Although reliability and validity of the instrument were not addressed in publically
available documents, several published studies have referenced the study in whole or modified
format including an evaluation study on the use of an EHR by Canadian physicians in clinic care
(Paterson et al., 2010), a study on the use of technology to conduct a delirium assessment by
family members of patients with dementia living in the community which modified the
instrument (Steis et al., 2012), and a study on the use of the EHR in hospital settings which used
the questionnaire in a modified version (Bah et al.2011).
Face validity was defined by persons with subject matter expertise. For this study, the
modified survey was distributed electronically to experts with clinical, informatics or academic
expertise. Suggestions for further modification were incorporated into the final version of the
survey.
The survey was converted to an electronic format and hosted on the organization’s
account with SurveyMonkey, Inc. A link to the survey was generated and was contained in the
email invitation to prospective participants. The survey was closed after the four week period.
An identical survey with a new link was generated for the post-intervention survey. The survey
was labeled internally as “post lactation survey” to help keep the data from the two surveys
Page 58
EFFECTIVENSS OF UCD FOR OPTIMIZING FORM 45
separate; however, the name seen by participants was identical on both the pre-test and post-
intervention surveys.
Survey data was collected at either the nominal or ordinal level. Demographic data was
nominal and was evaluated using descriptive statistics including frequencies and percentages.
Responses to questions were designed at the ordinal level and were presented on a five point
scale ranging from strongly disagree to strongly agree or from never to often, depending on the
question. Responses were assigned a value from 1 to 5, with the lowest values given to strongly
disagree and to never. Data were evaluated with descriptive statistical tests resulting in
frequencies, percentages, medians, and variances. Comparison between groups on ordinal data
was analyzed with the nonparametric Mann Whitney U test.
Use query. The use query was an electronic query that counted the number of completed
lactation assessments accessed from the EHR during the specified time frame. Use was
operationally defined as accessing the information within the electronic lactation assessment.
The query identified all patients by medical record number (MRN) with an electronic lactation
assessment documented in the EHR. The query identified if the electronic assessment had been
accessed and, if so, the date and time of the last access. The query was then limited to the six
week period for both the pre and post groups and to patients identified for the sample by meeting
the inclusion criteria. More patients than just the ones in the sample had lactation documentation
in the EHR, because lactation consultants also evaluated and treated patients without a consult
order placed on the patient; consequently, the need to limit the query to just those in the sample.
Reliability of the query was tested by comparing two patients identified on each period’s
query as positive for post discharge access of the electronic assessment form with a second
Page 59
EFFECTIVENSS OF UCD FOR OPTIMIZING FORM 46
report that listed all electronic documents accessed within a patient’s record. The second report
was scanned for the presence of the lactation assessment. Both patients from each study period
showed that the lactation assessment was an accessed document in the second report.
Use query data was at the nominal level. Descriptive statistics were used to report
frequencies and percentages of access both prior to discharge and post discharge. Fisher’s exact
test was used to analyze differences between groups.
Chart audit. Chart audits were conducted on all patients in the pre and post intervention
samples. Chart audits measured information quality of the lactation assessment documentation.
information quality was operationally defined as completeness of information documented in the
lactation assessment. Completeness was measured by either the presence of a specific
educational requirement of Baby Friendly, that the risk and benefits of formula be explained, or
by inclusion of a lactation plan or recommendation. Lactation consultants had identified that
improving the ability to audit for the presence of Baby Friendly patient education requirements
was a goal after optimization; thus whether this was present in the documentation was considered
a measure of information quality. In the same way, a goal of optimization was to increase the
visibility of the lactation plan within the documentation so that when other members of the care
team needed this information, it would be easily located within the EHR. A measure of
information quality was the presence of a plan within the electronic assessment.
Pre-test charts were audited for free-text stating that the risks and benefits of formula
were explained to the mother. The words “risks and benefits of formula” had to be present to
meet the measure. Plans were identified in pre-test charts if there was free-text indicating
instructions for ongoing management of breastfeeding.
Page 60
EFFECTIVENSS OF UCD FOR OPTIMIZING FORM 47
Post-test charts had discrete data fields that collected both pieces of information. Users
had to check the element within the education section that stated, “Risks and benefits of formula
were explained” to meet the measure. To meet the measure for presence of plan or
recommendations, users had to either have selected a discrete data element within the
recommendations section of the assessment or to have entered free text in the area of the
assessment labeled “Lactation Plan/Recommendations.”
All chart audits were performed by the principal investigator (PI). The PI is a registered
nurse with thirty years of perinatal nursing experience and extensive knowledge of lactation,
post-partum, and newborn nursing care. Chart audit data was collected at the nominal level.
Descriptive statistics were used to report frequencies and percentages for both completeness of
required education documentation and presence of a lactation plan or recommendations. Fisher’s
exact test was used to analyze differences between groups.
Recruitment
The chart audit population was recruited during the first two weeks of each six week
study period. Participants were identified by an electronic report of all patients meeting the
inclusion criteria during this time period. IRB approval was received for a full waiver of consent
for the chart audit participants.
Survey participants were recruited via emails sent two weeks into each six week study
period. An email from the PI was sent to organizational email list serves for general pediatrics
(inpatient and ambulatory care providers/clinicians), certified nurse midwives, and clinicians
working on the Mom/Baby couplet care and Neonatal Intensive Care Unit (NICU) units. The
email explained the purpose of the study, an invitation to participate in the study by completing
Page 61
EFFECTIVENSS OF UCD FOR OPTIMIZING FORM 48
an online survey, and the estimated time requirement for survey completion. In addition the
email indicated that the survey did not collect personal, identifying information and that
participation was voluntary. The timeline for survey completion, four weeks from the time of the
initial email, was provided. A second identical email was sent two weeks into the four week
survey timeline to the same population. Survey participants self-selected themselves for the
study by opening the survey link and consenting to participate, affirming that they provided care
to breastfeeding mothers or infants, and affirming that they use the EHR to either document or
review patient information. If survey participants indicated that they did not consent, did not
provide care to breastfeeding patients or did not access the EHR, then the survey ended and these
participants were excluded from the final sample.
Power analysis. A power analysis for sample size was conducted using a statistical
calculator (Power and Precision, v.4) (Borenstein, Rothstein & Cohen, 2001). Effect size was
anticipated to be small and was set at 0.2 (Cohen’s d). Desired statistical power level was set at
0.8. Probability level (alpha) was set at 0.05. The minimum total sample size for a one tail
hypothesis was 620 total, or 310 per group.
Sample size. The survey link was sent electronically to email lists consisting of email
addresses for 319 employees within the general pediatrics division, the certified nurse midwives
group, and the Neonatal Intensive Care and Mom/Baby nursing units. The convenience sample
consisted of the respondents to the survey. The pre-test survey had 65 responses and the post-
intervention survey 37 responses. Five surveys were removed from the pre-test data set and five
survey were removed from the post data set because the participant had not completed the
consent question or one of the two excluding questions addressing use of the EHR and provision
Page 62
EFFECTIVENSS OF UCD FOR OPTIMIZING FORM 49
of care to breastfeeding newborns. The final sample sizes were N=60 for the pre-test group and
N=32 for the post intervention group.
During the two week chart audit recruitment periods, a total of 116 newborns were
admitted to the Mom/Baby unit during the pre-test period and 127 during the post-intervention
period. The initial sample for the pre-test group was 44; however, four patients with lactation
consult orders had no lactation documentation in the EHR so they were excluded resulting in a
final sample size of N=39 for the pre-test period. The post intervention group initially had 53
patients; however, nine patients had no lactation documentation in the EHR and four patients
were identified by the order report; however, upon further examination, the order was noted to
have been placed outside of the two week study period so these patients were excluded resulting
in a final sample size of N=39 for the post-test period.
Sample description. Characteristics of the pre-test and post-test survey participants are
contained in Table 4. Information was collected from demographic questions within the survey
instrument. Data was categorical and reported as frequencies and percentages. The pre-test
sample (N=60) was 70% (n=42) nursing staff and 30% (n=18) provider staff; whereas, the post-
test sample (N=32) was 58% (n=18) nursing staff and 42% (n=14) provider staff. The
percentages for patient types which received care from participants was consistent across both
groups. The post-intervention group had a higher percentage (6%, n=2) of participants employed
less than six months at the organization than did the pre-test (3%, n=2). Patterns of EHR use was
fairly consistent in the percentages of participants indicating that they only reviewed patient
information in the EHR (15%, n=9 pre-test; 16%, n=5 post-intervention). The pre-test group did
have four respondents (7%) who indicated that the EHR was only used to document information,
Page 63
EFFECTIVENSS OF UCD FOR OPTIMIZING FORM 50
whereas the post-intervention group had no participants indicate they used the EHR for
documentation only.
Table 4
Survey Participant Characteristics
Characteristic Pre Post
N=60 % N=32 %
Role Nurse/Other 42 70 18 58
Provider 18 30 14 42
Patient Type Breastfeeding Infant 25 42 13 41 Breastfeeding Mother 6 10 4 13 Both Infant and Mother 29 48 15 47 Length of Employment at Organization < 6 mos. 2 3 2 6 6 mos. - 1 year 7 12 4 13 1 - 3 years 9 15 5 16 > 3 years 42 70 21 66
Pattern of EHR Use Review patient info only 9 15 5 16 Document patient info only 4 7 0 0 Both review and document 47 78 27 84
The chart audit and use query population was described as infants or mothers and
reported as frequency and percentage. Orders may be placed on either the mother or the infant.
Lactation consultants document on both the mother and the infant regardless on whom the order
was placed. The post study had a higher percentage of orders placed on the mother (28%, n=11)
Page 64
EFFECTIVENSS OF UCD FOR OPTIMIZING FORM 51
than the pre study (18%, n=7). The frequency and percentage of maternal and infant patients in
the pre and post study populations are detailed in Table 5.
Table 5
Chart Audit/Use Query Patient Characteristics
Pre
N=39 Post N=39
Consult orders placed on the: n % n %
Mother 7 18 11 28 Infant 32 82 28 72
Implementation
The intervention was implemented during the routine monthly EHR change time.
Education to end users of the change was provided through the organization’s usual method of
emailing out an attachment produced by the instructional design department that detailed EHR
changes and alerted users by role to those changes which would impact them. In addition, a
nursing informaticist met with outpatient providers and staff during monthly staff meetings in the
two months following implementation to educate staff on how to access inpatient lactation
information from EDM. Huddle sheets specific to the lactation assessment changes within the
EHR were provided one week prior to implementation and on the day of implementation to
inpatient nursing units and to inpatient providers. Huddle sheets were used by the organization’s
to facilitate verbal updates to clinicians daily on new information impacting their workflow. The
information would be shared by a charge nurse with nursing staff during specified times during
the shift. After the verbal update, the huddle sheet provided a visible reminder of the new
information.
Page 65
EFFECTIVENSS OF UCD FOR OPTIMIZING FORM 52
Data Analysis Protocol
Data collection protocol. All survey data was collected retrospectively after the
completion of the study. SurveyMonkey, Inc. data for each period’s survey was exported from
the website in electronic spreadsheets. The spreadsheets included raw data from all participants
for each period. SurveyMonkey, Inc. had recorded the IPN for each participant; however, this
was immediately deleted after the data was retrieved. Chart audit data was collected during the
four weeks following each period and stored on an electronic spreadsheet. The use query was run
retrospectively on each group after the conclusion of the study. Data was retrieved on an
electronic spreadsheet and stored in the password protected PHI folder on the organization’s
server. Prior to conducting statistical analysis, data was transferred from the electronic
spreadsheets into IBM’s SPSS (v.23) statistical software. Data was entered on three SPSS
spreadsheets, one for survey data, one for chart audit data, and one for use query data. Within
each spreadsheet, the data’s study period was identified as a variable. Nominal data was coded
with numerals one and two. Ordinal data was codes with numerals one through five. After data
was entered into SPSS spreadsheets, data was visually compared with the original electronic
spreadsheets to verify accuracy.
Missing data. As a first step in data analysis, SPSS spreadsheets were reviewed for
missing data. If survey questions that would have excluded the participant from the sample were
not answered, the results from that respondent were purged from the data set. Otherwise,
missing survey data was allowed to remain in the dataset. Missing datum for individual survey
questions ranged from one to seven for the pre-test period (N=60) and from one to five for the
post intervention period (N=32). Percentages were calculated using the adjusted, valid sample
Page 66
EFFECTIVENSS OF UCD FOR OPTIMIZING FORM 53
size for each measure. There was no missing demographic data. For the chart review, if there
was no lactation documentation in the chart, that chart was excluded from the chart audit sample
and the use query sample. For the pre-test period (N=39), four charts were excluded and for the
post-test period (N=39), nine charts were excluded for lack of documentation. The use query
resulted in no missing data.
Data analysis. As a next step in data analysis, each dataset was split into pre-test and
post-test groups using the data split functionality in SPSS. Data for each group was analyzed
using SPSS’s descriptive statistical tests. Results included total sample size, number of missing
data per item, frequencies, percentages calculated from both N (percent) and n (valid percent).
For ordinal date, median, variance and cumulative percent were also included.
Additional nonparametric statistical tests were run using SPSS software based on the
measurement plan. Chi-square tests were run using the SPSS Crosstabs analysis. Fisher’s exact
test on nominal data from the pre-test and post-test chart audit and use query was used to report
findings. SPSS was used to calculate phi (φ) as a measure of the strength of association between
the variables. Effect size for phi was considered small if 0.10, medium if 0.30 and large if 0.50
(Nandy, 2012).
The SPSS legacy version of the non-parametric Mann-Whitney U test was run for
analysis of pre-test and post-test ordinal data from the survey. Effect size (r) was calculated
manually using the formula r=Z/√𝑛1 + 𝑛2 and the absolute value was reported (Yatani, 2014).
Effect size was determined to be small if 0.1, medium if 0.3, and large if 0.5 (Nandy, 2012;
Page 67
EFFECTIVENSS OF UCD FOR OPTIMIZING FORM 54
Yatani, 2014). The pre-test and post-test survey groups were then further divided by role and all
statistical analysis was repeated for the provider group and the nursing group.
Project Findings and Results
The project objectives measured the effectiveness of optimization of electronic
documentation forms with user centered design to increase determinants of IS success. These
determinants were identified as information quality, use and user satisfaction. In addition, the
survey measured a confounding variable, system quality.
Objective 1: Increase Information Quality
Information quality was measured by chart audit and by user survey. Survey responses
assessed user perceptions of completeness, accessibility, accuracy, relevance, availability, and
acceptability of information within the electronic lactation assessment. Median scores for all
participants by pre-test and post-test samples are listed in Table 6. Medians for information
quality ranged from 2.5 - 4 on the 5 point scale. All medians either increased or stayed the same
from pre-test to post-test except for Available (pre X =̃ 4; post X =̃ 3) in the overall group and
Quickly Accessed (pre X =̃ 3; post X =̃ 2.5) in the provider group. When medians are the same
between pre-test and post-test groups, the cumulative percent at the median can give an
indication of the direction of movement. A lower cumulative percent indicates that more
respondents answered positively compared to the same median with a higher cumulative percent.
With the exception of Available for all groups and Accessible for the provider group, all
measures of information quality for which the pre-test and post-test medians were the same had a
lower cumulative percent in the post-test group indicating that the movement for these indicators
was positive.
Page 68
EFFECTIVENSS OF UCD FOR OPTIMIZING FORM 55
Table 6
Information Quality: Medians and Cumulative Percent at the Median Pre and Post
Provider Nurse All Pre Post Pre Post Pre Post
Parameter X ̃ %* X ̃ %* X ̃ %* X ̃ %* X ̃ %* X ̃ %*
Complete 3 81.3 3 66.7 4 89.5 4 68.8 3 53.7 4 78.6 Quickly Accessed 3 87.5 2.5 83.3 4 83.8 4 58.8 3 58.5 3 51.7 Accurate 3 75.0 3 66.7 4 73.7 4 52.9 3.5 64.8 4 65.5 Relevant 3 75.0 3 54.5 4 73.7 4 64.7 4 77.8 4 71.4 Available 3 81.3 3 83.3 4 76.3 4 76.5 4 83.3 3 55.2 Acceptable format and layout
3 87.5 3 100 3 52.6 4 70.6 3 63.0 3 57.1
Note: X ̃= Median; % = Cumulative Percent at the Median *When the median is the same in the pre-test and post-test groups, the cumulative percent gives information on the percent of respondents answering at or below the median. The lower the cumulative percent, the higher the number of respondents answering more positively, or greater than, the median.
In the pre-test and post-test samples overall, considering all participants, a Mann-Whitney U test
determined there was no significant (p = .107-.831) differences between the pre-test and post-test
samples for any qualifier of information quality. When the groups were divided by role,
however, nurses had a statistically significantly higher perception of Completeness post-test
(mean rank = 34) than pre-test (mean rank = 24.8), U = 200, z = -2.11, p = .035, r = .029. The
provider group did not have any significant differences between pre-test and post-test groups for
information quality (see Table 7).
Information quality was also measured by the chart audit (see Table 8). Lactation plans
were present on 59% (n = 23) of pre intervention charts (N = 39) and 92% (n = 36) of post
intervention charts (N = 39). Required documentation was a second measure of information
quality and was measured in the chart audit. Three pre-test charts (8%) had the required
education elements compared to 10 post-test charts (26%). Fisher’s exact two tailed test found
Page 69
EFFECTIVENSS OF UCD FOR OPTIMIZING FORM 56
Table 7
Information Quality Survey Results: Pre and Post. All Respondent Divided by Role
Pre Post
Parameter n X ̃
(var) Mean Rank
n X ̃
(var) Mean Rank
U Z p r
All Respondents Complete 54 3(1.0) 38.6 28 4(0.8) 47.1 600 -1.61 .107 0.19
Quickly Accessed 53 3(1.6) 41.1 29 3(3.4) 42.2 747 -.210 .831 0.02
Accurate 54 3.5(0.9) 39.7 29 4(1.0) 46.4 657 -1.27 .203 0.14
Relevant 54 4(0.9) 39.7 28 4(0.8) 45.0 658 -1.01 .312 0.11
Available 54 4(1.1) 44.0 29 3(1.2) 38.3 677 -1.06 .289 0.12
Acceptable format and layout
54 3(1.3) 41.0 29 3(1.5) 42.6 725 -.314 .754 0.03
Nursing Complete 38 4 (1.2) 24.8 16 4 (0.7) 34.0 200 -2.11 .035 0.29 Quickly Accessed 37 4 (1.5) 25.7 17 4 (2.2) 31.5 247 -1.30 .193 0.18 Accurate 38 4 (1.1) 25.6 17 4 (0.8) 33.4 232 -1.75 .081 0.24 Relevant 38 4 (1.0) 26.6 17 4 (0.7) 31.2 270 -1.04 .301 0.14 Available 38 4 (1.2) 28.5 17 4 (1.4) 26.8 303 -0.40 .692 0.05 Acceptable format and layout
38 3 (1.6) 26.0 17 4 (1.6) 32.4 249 -1.39 .164 0.19
Providers
Complete 16 3(0.7) 13.7 12 3(0.6) 15.6 83 -0.71 .568 0.13
Quickly Accessed 16 3(1.5) 15.1 12 2.5(1.5) 13.8 87 -0.45 .698 0.08
Accurate 16 3(0.4) 14.3 12 3(0.8) 14.9 92 -0.23 .873 0.04
Relevant 16 3(0.6) 13.1 11 3(0.9) 15.3 74 -0.78 .512 0.15
Available 16 3(0.5) 15.2 12 3(0.7) 13.6 85 -0.60 .631 0.11
Acceptable format and layout
16 3(0.7) 15.4 11 3(0.5) 12.0 66 -1.30 .294 0.25
that lactation plans were significantly more likely to be present in the EHR post-test ( [1, N =
39] = 11.8, p =.001, φ= .39). Although not reaching a level of significance (p<.05), a two tailed
Fisher exact test found completeness of required documentation was close to significance in the
post-test ( [1, N = 39] = 4.5, p = .065, φ = .24).
Page 70
EFFECTIVENSS OF UCD FOR OPTIMIZING FORM 57
Table 8
Frequency Distribution of Information Quality and Use
Pre N=39
Post N=39
X2 df p
(2 tail)
Fishers Exact Test
Parameter f % f % 2 tail 1 tail
Information Quality Lactation Plan/ Recommendations
23 59 36 92 11.8 1 .001 .001 .001
Required Education Documentation
3 8 10 26 4.5 1 .033 .065 .033
Use (Last Access) Accessed from EHR 35 88 39 100 4.2 1 .04 .115 .058 Post Discharge 6 15 6 15 No change from pre to post
Objective 2: Increase Use
Use of the electronic lactation assessment as a way of providing information was
measured by user reported frequency of accessing the EHR to view lactation information. Survey
participants were also asked their frequency of accessing lactation information at all and from a
source apart from the EHR. The overall group had pre-test medians ranging from 2 – 4 with
wide variances (2.1 – 2.3). Post-test medians were higher for both Accessing Information
Outside of the EHR (X =̃ 5, var = 1.9) and for Accessing Information from the EHR (X =̃ 3, var =
1.5).
A Mann-Whitney U test found that there were no significant differences between the pre-
test and post-test groups for all users in accessing lactation information from any source or from
outside of the EHR (see Table 9). There was, however, a close to significant difference (p =
.051) between the pre-test and post-test groups for reported frequency of accessing the EHR for
Page 71
EFFECTIVENSS OF UCD FOR OPTIMIZING FORM 58
lactation information. When the analysis was done considering roles, the Mann-Whitney U test
found that nurses in the post-test group reported a significantly higher frequency of accessing
information within the EHR (U= 233, z = -2.01, p = .044, r = 0.26) as well as from any source
outside of the EHR (U= 222, z = -2.33, p = .020, r = 0.31.
Table 9
Use Survey Results: Pre and Post. All Respondents Divided by Role
Pre Post
Parameter n X ̃
(var) Mean Rank
n X ̃
(var) Mean Rank
U Z p r
All Respondents Any source 59 4(2.3) 43.1 31 4(1.3) 50.1 772 -1.26 .209 0.13
Outside of EHR 59 4(2.2) 44.2 31 5(1.9) 48.0 836 -0.70 .482 0.07
Within EHR 59 2(2.1) 41.7 31 3(1.5) 52.7 690 -1.95 .051 0.21
Nursing
Any source 41 4 (2.1) 28.6 17 4 (0.9) 31.6 313 -0.65 .518 0.09
Outside of EHR 41 4 (1.6) 26.4 17 5 (0.6) 36.9 222 -2.33 .020 0.31 Within EHR 41 3(2.1) 26.7 17 4 (1.4) 36.2 233 -2.01 .044 0.26 Provider Any source 18 2.5(2.4) 14.2 14 4(1.8) 19.4 85 -1.59 -.125 0.28 Outside of EHR 18 4(3.5) 17.1 14 3(2.2) 15.7 115 -0.43 .694 0.08 Within EHR 18 1(1.6) 14.1 14 2(1.0) 19.6 83 -1.74 .099 0.31
Use was also measured as the proportion of charts in which the completed electronic
lactation assessment documentation was accessed. Proportions were reported for any access at
all and for accesses post discharge. Prior to the intervention, the use query showed that 88% (n =
35) of electronic assessments were accessed at all and 15% (n = 6) were accessed after discharge.
In the post intervention group, 100% (n = 39) of electronic assessments were accessed prior to
discharge and 15% (n = 6) after discharge (see Table 8). A crosstabs analysis to test for
Page 72
EFFECTIVENSS OF UCD FOR OPTIMIZING FORM 59
significant differences between the number of charts accessed at all in the pre-test and post-test
groups was run using Fisher’s exact two tailed test ([1, N = 39] = 4.2, p = .115, φ = .04). A
crosstabs analysis was not done on the number of post discharge accesses because the groups
were equal (n = 6).
Objective 3: Increase User Satisfaction
User satisfaction was measured as the reported agreement with survey statements about
the impact of the lactation assessment on quality of care, job ease, and ability to share
information with the healthcare team. For the overall group and provider group medians for
Table 10
User Satisfaction: Medians and Cumulative Percent at the Median Pre and Post
Provider Nurse All Pre Post Pre Post Pre Post
Parameter X ̃ %* X ̃ %* X ̃ %* X ̃ %* X ̃ %* X ̃ %*
Quality of care 3 81.3 3 63.6 3 56.8 4 81.3 3 64.2 3 51.9 Ease of work 3 87.5 3 63.6 2 52.6 3 58.8 3 74.1 3 60.7 Sharing of information
3 80 3 72.7 3 52.6 4 82.4 3 60.4 4 89.3
Note: X ̃= Median; % = Cumulative Percent at the Median *When the median is the same in the pre-test and post-test groups, the cumulative percent gives information on the percent of respondents answering at or below the median. The lower the cumulative percent, the higher the number of respondents answering more positively, or greater than, the median.
quality of care (X =̃ 3 pre and post) and ease of work (X =̃ 3, pre and post) did not change
between the pre-test and post-test groups; however, the cumulative percent did decrease
indicating movement of scores in the positive direction from pre to post (see Table 10) The
medians for Sharing of Information increased in the overall group and nursing group (pre X =̃ 3,
post X =̃ 4). For the provider group, the median for Sharing of Information was unchanged, but
Page 73
EFFECTIVENSS OF UCD FOR OPTIMIZING FORM 60
the cumulative percent decreased from pre to post). The nursing group also showed increases in
medians from pre to post for Quality of Care (pre X =̃ 3; post X =̃ 4) and Ease of Work (pre X =̃
2; post X =̃ 3).
Table 11
User Satisfaction Survey Results: Pre and Post. All Respondent Divided by Role
Pre Post
n X ̃
(var) Mean Rank
n X ̃
(var) Mean Rank
U Z p r
All respondents Quality of care 53 3(1.3) 38.5 27 3(1.2) 44.4 612 -1.10 .274 -0.12
Ease of work 54 3(1.4) 38.1 28 3(1.0) 48.1 572 -1.86 .063 -0.21
Sharing of information
53 3(1.3) 38.6 28 4(0.9) 45.5 616 -1.31 .191 -0.15
Nursing
Quality of care 37 3 (1.6) 26.4 16 4 (1.7) 28.5 261 -1.18 .638 -0.16
Ease of work 38 2 (1.7) 26.4 17 3 (1.2) 31.7 223 -1.79 .238 -0.24 Sharing of information
38 3 (1.4) 25.5 17 4 (0.8) 33.5 261 -1.18 .074 -0.16
Providers Quality of care 16 3(0.7) 12.5 11 3(0.5) 16.2 64 -1.42 .251 -0.27 Ease of work 16 3(0.9) 12.1 11 3(0.7) 16.8 58 -1.70 .134 -0.33 Sharing of information
15 3(1.1) 13.7 11 3(0.8) 13.7 80 -0.15 .919 -0.03
A Mann-Whitney U test was run on measures of user satisfaction to test for statistically
significant differences between pre and post groups. No significant differences between pre-test
and post-test were found for any measure or in any group (see Table 11).
System Quality
System quality is an attribute of IS success and has been found to be correlated with user
satisfaction (Petter, Delone, & McLean, 2008). In this study, system quality was identified as a
confounding variable. System quality was measured with the survey instrument through user’s
Page 74
EFFECTIVENSS OF UCD FOR OPTIMIZING FORM 61
level of agreement with statements addressing ease of use and integration with workflow.
Medians ranged from 2 – 4 for all measures and all groups.
There were no significant differences between pre-test and post-test groups for any
indicator of system quality for the all participant group or for the provider group. A Mann-
Whitney U test did find that nurses reported a significant (p = .022) difference between the pre-
test and post-test for ease of use, U = 201, z = -2.29, p = 0.22, r = 0.32 (see Table 12).
Table 12
System Quality Survey Results: Pre and Post. All Respondents Divided by Role
Pre Post
n X ̃
(var) Mean Rank
n X ̃
(var) Mean Rank
U Z p r
All Respondents Ease of use 54 3(1.0) 39.3 28 4(1.3) 49.8 635 -1.23 .220 0.14
Integration with workflow
54 3(1.7) 41.9 28 4(2.0) 40.8 735 -0.21 .834 0.02
Nursing
Ease of use 38 4(1.7) 24.8 17 4(1.0) 35.1 201 -2.29 .022 0.31
Integration with workflow
38 3(1.9) 26.3 17 4 (2.0) 31.8 259 -1.21 .227 0.16
Provider Ease of use 16 3(0.6) 14.6 11 3(0.6) 13.1 78 -0.64 .645 0.12 Integration with workflow
16 3(1.3) 16.2 11 3(0.9) 10.8 53 -1.90 .080 0.37
Reliability and Validity of Findings
Several threats to reliability and validity of results are identified. These threats primarily
arise from the methodology of the study and sampling.
Methodology. In the timeline of the study, the survey period overlapped the use query
period. Use was operationalized as electronically accessing information documented on the
Page 75
EFFECTIVENSS OF UCD FOR OPTIMIZING FORM 62
lactation assessment. Exposure to the survey may have encouraged users to access electronic
lactation information. If users were prompted by the survey to increase their access of the EHR
for lactation information, then findings from the use query may demonstrate higher use rates than
had the design not had this overlap, potentially leading to a Type 1 error. To reduce the
possibility of error, the survey period could come after the chart audit and use query are
complete.
A second threat to reliability of results based on methodology was that the intervention
may not have been implemented in a way that every participant received the same exposure.
When the implementation is delivered differently to participants in the study, then there is a lack
of intervention fidelity (Polit & Beck, 2012). Although the protocol included training users, there
was no standardization of training, no measurement of who did or did not receive training, and
no measurement of level of understanding. If users were not exposed to the intervention, then
answers to the post-test survey would not reflect their interaction with the optimized form
potentially causing a Type II error. To reduce this threat to reliability, the protocol could have
included a post-test measure of the participant’s exposure to the intervention and understanding
of how to access the intervention.
Sample. The pre-test and post-test survey samples were recruited from the same
population but were assumed to be independent groups. The Mann-Whitney U test assumes that
the samples are independent and without duplication (Laerd, n.d.). A threat to the reliability of
the results was that some of the participants in the pre-test may have also been represented in the
post-test sample. If participants from the pre-test were represented in the post-test, then the data
would not have met the assumptions for the Mann-Whitney U test. An alternative non-
Page 76
EFFECTIVENSS OF UCD FOR OPTIMIZING FORM 63
parametric test was considered, the Wilcoxon signed-rank test. The Wilcoxon signed-rank test is
a nonparametric test that is the equivalent to the paired-samples t-test and compares dependent
samples of paired or matched observations (Laerd, n.d.). The samples can be the same
participants or can be matched on a characteristic (Laerd, n.d.). Because the sample size of the
second group was half the size of the sample size of the first group, and because it was unknown
if any of the participants were duplicated in the two samples, the Wilcoxon would have had
similar threats to the reliability of the findings. To reduce this threat to reliability, the research
design could either identify a dependent sample for before and after testing; or include an
identifier in the survey to eliminate participants from the second sample who had participated in
the first.
A second threat to reliability from sampling is the low sample size which did not reach
power. When sample size does not reach power, then the relationship between the independent
and dependent variables may be found statistically insignificant when there is, in fact, a
significant relationship that was not measured because of small sample size (Polit & Beck,
2012). Unpowered sample size also reduces the generalizability of the findings (Polit & Beck,
2012).
Although online surveying as a data collection tool is convenient, selection bias may lead
to threats to the reliability of findings. Self-selected survey samples may not represent the
overall population (Khazaal et al., 2014). Bias resulting from self-selection may also impact
generalizability of findings (Cusack et al., 2009; Eysenbach & Wyatt, 2002).
Discussion
Page 77
EFFECTIVENSS OF UCD FOR OPTIMIZING FORM 64
What makes an HIT implementation successful? For clinicians, HIT success is achieved
when the application supports workflows, allowing effective and complete documentation of
information and efficient communication of information (Ammenwerth, Mansmann, et al., 2003;
De Veer, Fleuren, Bekkema & Francke, 2011). Based on the conceptual model for this study,
improved information quality would lead to increased user satisfaction which would result in
increased use. The vehicle for improving information quality was the UCD process, which
engaged end users in the design process. By engaging users in the design, the result would be a
product which satisfied users, both those entering information as well as those reviewing
information. Satisfied users would continue to use the application. With increased use, clinicians
would have more complete information, documented by lactation consultants, to inform care
provided to breastfeeding mothers and infants.
When survey participants were considered as a whole, this study did not find any
statistical differences between pre-test and post-test groups on any determinants of IS Success.
When survey participants were divided by role, this study did find significant differences for two
measures of information quality and one measure of information use.
Nurses in the post-test sample had a significantly higher perception of completeness of
the lactation assessment, a measure of information quality. Furthermore, the post-test chart
review showed a statistically significant increase in the presence of lactation assessments, a
second measure of information quality and completeness. Finally, nurses in the post-test sample
indicated a significantly higher frequency of accessing the lactation assessment from the EHR, a
measure of use. Although no statistically significant differences between pre-test and post-test
were found on measures of user satisfaction, every measure of user satisfaction for every group
Page 78
EFFECTIVENSS OF UCD FOR OPTIMIZING FORM 65
(overall, providers, and nurses) showed either an increase in the median or a decrease in the
cumulative percent at the median, if the median was unchanged, indicating more positivity in
responses post-test.
The differences in findings for measures of information quality between the two groups,
nursing and providers, may be related to the differences between their use of the Soarian
Clinicals application. Electronic lactation assessments are entered into Soarian Clinicals by the
lactation consultant. Nurses use Soarian Clinicals to both document and review information.
Because of their familiarity with the application and because it is within this application where
they do their own documentation, nurses may be more comfortable than providers using Soarian
Clinicals to review information, including the lactation assessment.
Providers could access information entered into Soarian Clinicals in either of two ways.
They have access to Soarian Clinicals and use this application to review vital signs, medications,
and notes. They also enter CPOE (computerized physician order entry) orders into Soarian
Clinicals. Accessing assessment data is possible, however providers may not be familiar with
navigating the application to access information entered by other clinicians.
A second method providers could use to access lactation information is within the
electronic data management system, EDM, which is used as the legal medical record. All paper
forms completed during the inpatient stay are scanned into EDM, and providers do routinely
access EDM during newborn outpatient provider visits for the scanned copy of the form
containing the newborn’s admission and discharge exam. All electronic documentation from
Soarian Clinicals is also converted into forms that are accessible in EDM.
Page 79
EFFECTIVENSS OF UCD FOR OPTIMIZING FORM 66
A provider was consulted during the UCD process to identify which information from the
lactation assessment was most important to providers. Documentation fields that captured this
information were positioned in the electronic assessment so that, when converted to EDM, the
information would be found at the top of the EDM form when reviewed by the provider.
Although providers do access EDM for scanned inpatient paper forms, they may not know that
assessment information documented within Soarian Clinicals is also available in EDM. Two
providers wrote comments on the post-test survey indicating that they did not know how to
access lactation information within EDM.
Each user group reported an increased frequency of finding lactation information within
the EHR from pre-test to post-test. The median value for this measure increased by a value of
one for each group, although, as previously discussed, the difference from pre to post was only
significant for the nursing group. For providers, the pre-test median (X ̃= 1) corresponded to a
value of never, and the post-test median (X =̃ 2) corresponds to rarely. If providers routinely did
not access the EHR for lactation information, even post-test, then the survey would not
accurately reflect their perceptions of information quality of the electronic assessment or their
degree of satisfaction with the lactation assessment. Providers were given education on how to
access lactation assessments from EDM post implementation; however, the effectiveness of that
education was not measured.
Overall, providers gave more negative scores than nurses for every measure of IS Success
except Ease of Work, as measured by median or the cumulative percentage at the median when
medians were equal. Because providers were unfamiliar with the EHR application, their lower
scores overall may have been indicative of their lack of knowledge on how to use the application
Page 80
EFFECTIVENSS OF UCD FOR OPTIMIZING FORM 67
to find information within the EHR application rather than their frequency of use, perception of
information quality or their satisfaction with either the information or the system.
It is important to note that nurses, which include the role of lactation consultant, did
access the application to both enter and review documentation, and had a significantly higher
perception of completeness post-test, as measured on the survey. In addition, the chart audit
results, measuring the presence of lactation plans/recommendations and required education
within the electronic assessment, also had a significant increase in completeness of information
post-test. The chart audit measure of completeness corresponds to entry of information, was the
user able to enter all required information, whereas the perception of completeness on the survey
corresponds to review of information, did the user find all the information needed. These
findings may be point towards a degree of success in meeting the goal of optimizing the
assessment to allow efficient and effective documentation as well as to provide users with
efficient and effective review. If providers had accessed the lactation information, they may
have also found that the information was more completed.
The optimized lactation assessment was designed to facilitate discrete documentation by
creating checklists to capture lactation consultant recommendations and plans as well as required
education topics. The checklist for recommendations and plans was compiled by the consultants
to include the phrases they most frequently entered as free text into the previous assessment.
The checklist for education topics included those topics that were required by Baby Friendly as
well as other topics that the lactation consultants routinely taught. Because the optimized
lactation assessment included an opportunity to discretely document education, it was somewhat
surprising that the number of charts meeting the measure of required education documentation
Page 81
EFFECTIVENSS OF UCD FOR OPTIMIZING FORM 68
was not higher. One reason for this may be that the statement chosen to operationalize this
measure addressed both risks and benefits of formula. Although this is required education,
lactation consultants may be hesitant to explain benefits of formula to their breastfeeding
patients. Many charts had checkmarks by every topic in the education checklist except for risks
and benefits of formula.
The use query was able to supply the date and time of electronic access of the
assessment. Interestingly, for assessments that were accessed while the patient was still an
inpatient, the time was often around change of shift, particularly the day to night shift change.
This may indicate that nurses were reviewing lactation consultant plans prior to beginning their
night shifts when the lactation consultants were not on site and when breastfeeding babies and
mothers may face additional breastfeeding challenges. When the use query indicated a date and
time post discharge, this was assumed to be by an outpatient clinician. The time was during the
workday and on weekdays. Although no further analysis was done to see if the date and time of
a post-discharge access to the electronic assessment corresponded to any outpatient
documentation, either an office visit or phone call, this may be an area for further study. It
would also be informative to implement structured education for providers on accessing
electronically entered inpatient information through EDM and measure effect on use post
discharge.
A goal of this project was to increase provider access to electronic lactation information
by improving the overall design of the assessment so that important information, relevant to
providers, would be easily located within the EDM documents accessible to providers. This was
particularly challenging. Unlike applications where all clinicians access the same electronic
Page 82
EFFECTIVENSS OF UCD FOR OPTIMIZING FORM 69
application to review all clinical information, at this organization, providers did not access
clinical assessments within the electronic application where they were entered. Instead, this
information was translated into a PDF document that was then stored in EDM. Providers
accessed EDM routinely during the first newborn outpatient clinic visit to review am electronic
copy of the paper form where the newborn’s history and physical and discharge information was
hand written during the inpatient stay. However, providers were not used to accessing the
documents in EDM that converted electronically entered assessment information into a PDF
document. This project was unable to overcome this limitation of the organization’s overall
dichotomy of electronic documentation that divides users by application.
Limitations, Recommendations, Implications for Change
If the EHR will serve as a patient safety and quality tool, then the EHR must be
continuously adapted as new information is known (National Learning Consortium, 2013).
Optimization is the process though which implemented EHRs are adjusted to better meet existing
safety and/or quality initiatives. Optimization is also the process by which the EHR is
configured to meet new safety and/or quality initiatives. It may be difficult for organizations that
have invested a significant amount of resources in the implementation of the EHR to commit
additional resources to continuous improvement of the EHR. McAlerney et al. (2010) found that
the distinguishing factor between organizations with “good” EHR implementations and those
with “great” EHR implementations was a focus on optimization (p. 45). This focus included the
commitment to invest additional time and resources beyond implementation to allow the EHR to
be used as a tool for quality improvement.
Page 83
EFFECTIVENSS OF UCD FOR OPTIMIZING FORM 70
The conceptual model for this project theorized that if structures which impact IS
success, such as information quality, are improved through a process such as User Centered
Design, then user satisfaction with the application and processes, such as use of the application
to obtain information, will increase. This will lead to achievement of long term outcomes and
net benefits to the organization.
A long term outcome of this project was to support quality initiatives through the short
term goal of increasing the success of the EHR to support users’ needs for efficient and effective
capturing and communicating lactation information. The significant findings that nurses did
perceive information to be more complete, and that information within the assessment was
measured as more complete, lend a degree of confirmation that optimization of the EHR, through
a user centered process, may have long term benefits for patients by increasing clinician access
to information. The findings of this study lend themselves to recommend future studies and
suggest ways that the findings impact clinical practice.
Limitations. Several potential limitations of this study have been identified. Many of
these were have been discussed previously as threats to the validity or reliability of the findings.
Additional limitations of the study are that the complexity of the model and multiplicity of
variables, both dependent and confounding, as well as the study design, limits the identification
of correlational relationships between variables. The causal nature of the DeLone and McLean
(2003) IS success model assumes that such relationships exist; however, the study design did not
allow further confirmation.
A second limitation, previously identified, is that the size of the sample did not reach
power thus limiting the generalizability of the findings. A third limitation was the ability of the
Page 84
EFFECTIVENSS OF UCD FOR OPTIMIZING FORM 71
use query to identify information that would better inform objective use of the electronic
assessment by identifying the role of the user accessing the assessment as well as the number of
times the assessment was accessed. Without these additional pieces of information, the value of
the use query was minimal.
The most significant limitation, however, as previously described, was the impact of the
organization’s three separate electronic applications: Soarian Clinicals, where inpatient clinicians
other than providers documented patient information; EDM, which served as the legal medical
record and contained all documentation, but did not present electronically documented
information in a user-friendly view; and an outpatient application where outpatient clinical
information was documented.
Recommendations. Despite the limitations of the findings, several recommendations
arise from this study. For clinical users of electronic clinical documentation systems, the User
Centered Design process, built on principles of usability, is a valuable process for ensuring that
EHR applications meet the needs of users. Nursing Informaticists should follow UCD processes
when implementing or optimizing electronic documentation forms.
A second recommendation is to ensure that end-user education of new EHR processes is
heard and understood. Auditing and re-educating, as appropriate, is recommended to hardwire
new processes. Findings in this study may indicate that providers were not adequately educated
on the new features and added value of the optimized assessment. Lack of education, rather than
lack of user satisfaction, may have been the reason for lack of use. Nursing Informaticists
should implement closed loop education processes for any new or changed EHR processes.
Page 85
EFFECTIVENSS OF UCD FOR OPTIMIZING FORM 72
Eight months after the optimized assessment was implemented into the Soarian Clinicals
application, the PI met with lactation consultants during the analysis stage of a new, enterprise-
wide, EHR implementation project. The purpose of the meeting was to validate content of the
lactation assessment that would be implemented in the new application. That the organization
would be implementing a new EHR application was known throughout this study and was a
focus of the design process for the Soarian Clinicals lactation assessment. The PI had access to
clinical documentation assessments used by organizations which had implemented the new EHR
system. These were shared with the participants in the UCD process and helped inform the
design of the optimized electronic lactation assessment. Having used the assessment for eight
months, the users were in an ideal position to identify if there were content changes to make
before implementing in the next EHR. Except for minor changes, the lactation consultants
indicated that the current, optimized lactation assessment was efficiently and effectively meeting
their documentation requirements. Because the design of the lactation assessment will be
unchanged in the next EHR application, there will be an opportunity to study the effect of
increased user access to the application on use of the application to review lactation information.
A limitation of this study was that providers did not use the same clinical documentation
application as nursing and lactation consultants. In the future EHR, all clinical users will
document in the same application, thus increasing the opportunity to share information
electronically. A third recommendation is to consider studying the effect of the new application
on user satisfaction, information quality and use of the electronic lactation assessment.
A fourth recommendation is for nursing informaticists to develop carefully designed,
robust studies to inform EHR usability. Although the objectivist design may appear to be more
Page 86
EFFECTIVENSS OF UCD FOR OPTIMIZING FORM 73
valuable, based on its historical use as a gold standard of research, methodological challenges of
controlled studies arise from the dynamic nature of technology and may impact the validity and
reliability of findings when measured against objectivist ideals (Moehr, 2002). Instead, nursing
informaticists should consider a subjectivist approach where findings will provide information
that is desired to be known, that describes effects on users, and that leads to better understanding
(Moehr, 2002). This study may have added more value to the body of knowledge on HIT
success if a subjectivist design had been used that explored the reasons why providers did not
access lactation information electronically and what attributes of IS Success, such as information
quality or system quality, may increase provider access.
A fifth recommendation is for organizations to support continued research in HIT and
application of evidence, particularly around usability, when implementing or optimizing EHRs.
The findings of this study support the application of usability principles of efficiency and
effectiveness to the design of electronic assessments to ensure completeness of documentation.
More research to inform usability principles supporting inputting and exporting of information
within the EHR are needed to ensure the EHR can impact better care, lower costs, and better
health.
In order for HIT research to flourish, a sixth recommendation is to encourage terminal
degrees for practicing nursing informaticists. When educated at the doctoral level, Nursing
Informaticists can develop a body of evidence to drive optimization and use of the EHR in order
to achieve the goal that the EHR will be a learning system to inform clinical practice while
supporting quality and safety initiatives.
Page 87
EFFECTIVENSS OF UCD FOR OPTIMIZING FORM 74
A final recommendation is to engage legislators to develop policy that will fund future
research and development of usability around clinical electronic documentation tools. Concerns
about the usability of EHR applications was the impetus behind the formation of a bipartisan
working group to identify ways to improve the ability of the EHR to meet expectations that the
application will support quality of care, patient safety, exchange of information, and patient
engagement (Monegain, 2015). The findings of this study support funding of legislation to
develop policy around ensuring that usability principals are included in EHR design,
implementation and optimization. When principles of usability, such as efficiency and
effectiveness, are a focus of optimization, then use of the application and information quality
may increase, resulting in improved outcomes from increased access to clinical information.
Implications. Findings from this study support an optimization process that includes
User Centered Design to develop documentation tools to support clinicians when entering
information into the EHR or retrieving information from the EHR. When information quality is
improved, then clinicians may find information to be more complete. When information is
complete, clinicians may use the EHR to access and review patient data to inform clinical
practice. Limitations of the application, however, such as system quality or access, may decrease
user satisfaction with the application and result in workarounds. When members of the
healthcare team have challenges in accessing electronically documented patient information,
they may develop workarounds to accessing the application. When workarounds are in place,
then clinicians may not increase use of or access to the application even when information
quality is increased.
Page 88
EFFECTIVENSS OF UCD FOR OPTIMIZING FORM 75
References
Abbass, I., Helton, J., Mhatre, S., & Sansgiry, S. (2012). Impact of electronic health records on
nurses’ productivity. Journal of the Association of Occupational Health Professionals in
Healthcare, 32(3), 33-37.
Adler-Milstein, J., Daniel, G., Grossmann, C., Mulvany, C., Nelson, R., Pan, E., . . . Perlin, J.
(2014). Return on Information: A standard model for assessing institutional return on
electronic health records. Digital Learning Collaborative of the IOM Roundtable on
Value & Science-Driven Health Care. Institute of Medicine. Retrieved from:
http://www.iom.edu/Global/Perspectives/2014/ReturnOnInformation.aspx
Agency for Healthcare Research and Quality (AHRQ) (n.d.) Health IT survey compendium.
Health IT Tools and Resources. http://healthit.ahrq.gov/health-it-tools-and-
resources/health-it-survey-compendium
Ammenwerth, E., Gräber, S., Herrmann, G., Bürkle, T., & König, J. (2003). Evaluation of health
information systems—problems and challenges. International Journal of Medical
Informatics, 71(2/3), 125. doi:10.1016/S1386-5056(03)00131-X
Ammenwerth, E., Mansmann, U., Iller, C., & Eichstädter, R. (2003). Factors affecting and
affected by user acceptance of computer-based nursing documentation: results of a two-
year study. Journal of the American Medical Informatics Association, 10(1), 69-84.
Ammenwerth, E., Rauchegger, F., Ehlers, F., Hirsch, B., & Schaubmayr, C. (2011). Effect of a
nursing information system on the quality of information processing in nursing: An
evaluation study using the HIS-monitor instrument. International Journal of Medical
Informatics, 80(1), 25-38. doi:10.1016/j.ijmedinf.2010.10.010
Page 89
EFFECTIVENSS OF UCD FOR OPTIMIZING FORM 76
Arlotto, P. (2014). Accelerating the ROI of EHRs. HFM (Healthcare Financial
Management), 68(2), 72-79.
Bah, S., Alharthi, H., El Mahalli, A., Jabali, A., Al-Qahtani, M., & Al-kahtani, N. (2011).
Annual survey on the level and extent of usage of electronic health records in
government-related hospitals in Eastern Province, Saudi Arabia. Perspectives in Health
Information Management / AHIMA, American Health Information Management
Association, 81b.
Berwick, D. M., Nolan, T. W., & Whittington, J. (2008). The Triple Aim: cares health, and cost.
Health Affairs, 27(3), 759-769. doi:10.1377/hlthaff.273.759
Booth, R. (2012). Examining the functionality of the DeLone and McLean Information System
Success Model as a framework for synthesis in nursing information and communication
technology research. CIN: Computers, Informatics, Nursing, 30(6), 330-345.
Borenstein, M., Rothstein, H., & Cohen, J. (2001). Power and precision. Englewood, NJ:
Biostat, Inc. Retrieved from: http://www.power-
analysis.com/pdfs/power_precision_manual.pdf
Bowman, S. (2013). Impact of electronic health record systems on information integrity: Quality
and safety implications. Perspectives in Health Information Management, 1-19.
Burnette, P., (2011). Denver Health and Hospital Authority. Healthcare Business News.
Retrieved from: http://www.modernhealthcare.com/article/20110131/NEWS/110129981
Canada Health Infoway (n.d.). Benefits evaluation survey process. Retrieved from:
https://www.infoway-inforoute.ca/index.php/resources/toolkits/change-
management/national-framework/monitoring-and-evaluation/resources-and-
Page 90
EFFECTIVENSS OF UCD FOR OPTIMIZING FORM 77
tools/doc_download/1139-benefits-evaluation-survey-process-system-use-assessment-
survey
Canada Health Infoway (2012). Canada Health Infoway benefits evaluation indicators technical
report. Version 2.0. Retrieved from: https://www.infoway-inforoute.ca/.../544-benefits-
evaluation-indicators- technical-report-version-2-0
Centers for Medicare & Medicaid Services (2014). Clinical quality measures basics. Retrieved
from: http://www.cms.gov/Regulations-and-
Guidance/Legislation/EHRIncentivePrograms/ClinicalQualityMeasures.html
Chow, S., Chin, W., Lee, H., Leung, H., & Tang, F. (2011). Nurses’ perceptions and attitudes
towards computerization in a private hospital. Journal of Clinical Nursing, 21(11/12),
1685-1696. doi:10.1111/j.1365-2702.2011.03905.x
Colorado Breastfeeding Coalition (n.d.). The Colorado Can Do 5! Retrieved from:
http://www.cobfc.org/2014-03-06-17-22-52/co-can-do-5
Cusack, C. M., Byrne, C., Hook, J. M., McGowan, J., Poon, E. G., &Zafar, A. (2009). Health
information technology evaluation toolkit: 2009 Update. Rockville, MD: Agency for
Healthcare Research and Quality. Retrieved from: http://www.healthit.gov/unintended-
consequences/sites/default/files/pdf/ModuleIIpdf1.5.pdf
Dabbs, A., Myers, B., Mc Curry, K., Dunbar-Jacob, J., Hawkins, R., Begey, A., & Dew, M.
(2009). User-centered design and interactive health technologies for patients. CIN:
Computers, Informatics, Nursing, 27(3), 175-183. doi:10.1097/NCN.0b013e31819f7c7c
Page 91
EFFECTIVENSS OF UCD FOR OPTIMIZING FORM 78
De Veer, A., Fleuren, M., Bekkema, N., & Francke, A. (2011). Successful implementation of
new technologies in nursing care: a questionnaire survey of nurse-users. BMC Medical
Informatics and Decision Making, 1167. doi:10.1186/1472-6947-11-67
DeLone, W. H., & McLean, E. R. (2003). The DeLone and McLean Model of Information
Systems Success: A ten-year update. Journal of Management Information Systems, 19(4),
9-30
DeVoe, J., Angier, H., Likumahuwa, S., Hall, J., Nelson, C., Dickerson, K., & … Cohen, D.
(2014). Use of qualitative methods and user-centered design to develop customized
health information technology tools within federally qualified health centers to keep
children insured. Journal of Ambulatory Care Management, 37(2), 148-154.
doi:10.1097/JAC.0000000000000016
Donabedian A. (1988). The Quality of Care: How Can It Be Assessed? Journal of the American
Medical Association, 260(12), p. 1743-1748. doi:10.1001/jama.1988.03410120089033
Dykes, P. C., & Collins, S. A. (2013). Building linkages between nursing care and improved
patient outcomes: The role of health information technology. Online Journal of Issues in
Nursing, 18(3), 1-17. doi:10.3912/OJIN.Vol18No03Man04
Eidelman, A. K., & Schanler, R. J. (2012). Breastfeeding and the use of human
milk. Pediatrics, 129(3), 598-601. doi:10.1542/peds.2011-3552
Eysenbach, G., & Wyatt, J. (2002). Using the internet for surveys and health research. Journal of
Medical Internet Research, 4(2), e13. doi:10.2196/jmir.4.2.e13
Green, S., & Thomas, J. (2008). Interdisciplinary collaboration and the electronic medical
record. Pediatric Nursing, 34(3), 225.
Page 92
EFFECTIVENSS OF UCD FOR OPTIMIZING FORM 79
Halbesleben, J. R., Wakefield, D. S., & Wakefield, B. J. (2008). Work-arounds in health care
settings: literature review and research agenda. Health Care Management Review, 33(1),
2-12.
Harris, A., McGregor, J., Perencevich, E., Furuno, J., Zhu, J., Peterson, D., & Finkelstein, J.
(2006). The use and interpretation of quasi-experimental studies in medical
informatics. Journal of the American Medical Informatics Association, 13(1), 16-23.
Harris, J. L., Roussel, L., Walters, S. E. & Dearman, C. (2011). Project planning and
management. A guide for CNLs, DNPs, and nurse executives. Sudbury, MA: Jones &
Bartlett.
Hawkins, S., Stern, A., Baum, C., & Gillman, M. (2014). Evaluating the impact of the Baby-
Friendly Hospital Initiative on breast-feeding rates: a multi-state analysis. Public Health
Nutrition, 1-9. Electronically published ahead of time.
Heathfield, H., Pitty, D., & Hanka, R. (1998). Evaluating information technology in health care:
Barriers and challenges. BMJ: British Medical Journal (International
Edition), 316(7149), 1959-1961.
Houser, J. & Oman, K. S. (2011). Evidence-based practice. An implementation guide for
healthcare organizations. Sudbury, MA: Jones and Bartlett.
Hripcsak, G., Vawdrey, D., Fred, M., & Bostwick, S. (2011). Use of electronic clinical
documentation: time spent and team interactions. Journal of the American Medical
Informatics Association, 18(2), 112-117. doi:10.1136/jamia.2010.008441
Page 93
EFFECTIVENSS OF UCD FOR OPTIMIZING FORM 80
Hsiao, J., Chang, H., & Chen, R. (2011). A study of factors affecting acceptance of hospital
information systems: a nursing perspective. Journal of Nursing Research (Lippincott
Williams & Wilkins), 19(2), 150-160.
Huryk, L. A. (2010). Factors influencing nurses’ attitudes towards healthcare information
technology. Journal of Nursing Management, 18(5), 606-612. doi:10.1111/j.1365-
2834.2010.01084.x
Institute of Medicine (IOM). 2012. Health IT and patient safety: Building safer systems for
better care. Washington, DC: The National Academies Press
Johnson, C., Johnson, T., & Zhang, J. (2005). A user-centered framework for redesigning health
care interfaces. Journal of Biomedical Informatics, 38(1), 75-87.
Jones, S. S., Koppel, R., Ridgely, M. S., Palen, T. E., Wu, S., & Harrison, M. I. (2011). Guide to
reducing unintended consequences of electronic health records. Rockville, MD: Agency
for Healthcare Research and Quality. Retrieved from:
http://www.healthit.gov/unintended-consequences/#sidebar
Kaplan, B., & Harris-Salamone, K. (2009). Health IT success and failure: Recommendations
from literature and an AMIA workshop. Journal of the American Medical Informatics
Association, 16(3), 291-299. doi:10.1197/jamia.M2997
Keenan, G., Yakel, E., Dunn Lopez, K., Tschannen, D., & Ford, Y. (2013). Challenges to nurses’
efforts of retrieving, documenting, and communicating patient care information. Journal
of the American Medical Informatics Association, 20(2), 245-251. doi:10.1136/amiajnl-
2012-000894
Page 94
EFFECTIVENSS OF UCD FOR OPTIMIZING FORM 81
Kelley, T. F., Brandon, D. H., & Docherty, S. L. (2011). Electronic nursing documentation as a
strategy to improve quality of patient care. Journal of Nursing Scholarship, 43(2), 154-
162. doi:10.1111/j.1547-5069.2011.01397.x
Kennedy Page, C., & Schadler, A. (2014). A nursing focus on EMR usability enhancing
documentation of patient outcomes. Nursing Clinics of North America, 49(1), 81-90.
doi:10.1016/j.cnur.2013.11.010
Khazaal, Y., van Singer, M., Chatton, A., Achab, S., Zullino, D., Rothen, S., ... & Thorens, G.
(2014). Does self-selection affect samples’ representativeness in online surveys? An
investigation in online video game research. Journal of Medical Internet Research, 16(7),
e164. doi:10.2196/jmir.2759
Kimiafar, K., Sadoughi, F., Sheikhtaheri, A., & Sarbaz, M. (2014). Prioritizing factors
influencing nurses’ satisfaction with hospital information systems: a fuzzy analytic
hierarchy process approach. Computers, Informatics, Nursing: CIN, 32(4), 174-181.
doi:10.1097/CIN.0000000000000031
Laerd Statistics (n.d.) Mann-Whitney U test using SPSS. Retrieved July 19, 2015 from:
https://statistics.laerd.com/spss-tutorials/mann-whitney-u-test-using-spss-statistics.php
Laramee, A., Bosek, M., Kasprisin, C., & Powers-Phaneuf, T. (2011). Learning from within to
ensure a successful implementation of an electronic health record. CIN: Computers,
Informatics, Nursing, 29(8), 468-477. doi:10.1097/NCN.0b013e3181fc3fc7
List, B., Ballard, J., Langworthy, K., Vincent, A., Riddle, S., Tamayo, O., & Geraghty, S. (2008).
Electronic health records in an outpatient breastfeeding medicine clinic. Journal of
Human Lactation, 24(1), 58-68.
Page 95
EFFECTIVENSS OF UCD FOR OPTIMIZING FORM 82
McAlearney, A. S., Song, P. H., Robbins, J., Hirsch, A., Jorina, M., Kowalczyk, N., & Chisolm,
D. (2010). Moving from good to great in ambulatory electronic health record
implementation. Journal for Healthcare Quality, 32(5), 41-50.
McDowell, D., Dillon, T., & Lending, D. (2008). Perceived quality benefits influenced by
usefulness and documentation accuracy of information systems. Computers, Informatics,
Nursing: CIN, 26(6), 350-357. doi:10.1097/01.NCN.0000336463.72069.7c
Michel-Verkerke, M. B. (2012). Information Quality of a Nursing Information System depends
on the nurses: A combined quantitative and qualitative evaluation. International Journal
of Medical Informatics, 81(10), 662-673. doi:10.1016/j.ijmedinf.2012.07.006
Moehr, J. R. (2002). Evaluation: salvation or nemesis of medical informatics? Computers in
Biology & Medicine, 32(3), 113.
Monegain, B. (2015, April 30). Senate panel to look into EHR usability. In Healthcare IT News.
Retrieved from: http://www.healthcareitnews.com/news/senate-panel-look-ehr-usability
Nandy, K. (2012). Understanding and quantifying effect sizes. Retrieved from:
http://nursing.ucla.edu/workfiles/research/Effect%20Size%204-9-2012.pdf
National Institute of Standards and Technology (NIST) (2013). Usability. Retrieved from:
http://www.nist.gov/healthcare/usability/upload/Usability-Fact-Sheet-SEPT2013.pdf
National Learning Consortium (2014, March 19). Health care quality and convenience. Benefits
of EHRs. Retrieved from: http://www.healthit.gov/providers-professionals/health-care-
quality-convenience
Page 96
EFFECTIVENSS OF UCD FOR OPTIMIZING FORM 83
National Learning Consortium (2013). Continuous quality improvement (CQI) strategies to
optimize your practice. Retrieved from:
https://www.healthit.gov/sites/default/files/nlc_continuousqualityimprovementprimer.pdf
Nykänen, P., Brender, J., Talmon, J., de Keizer, N., Rigby, M., Beuscart-Zephir, M., &
Ammenwerth, E. (2011). Guideline for good evaluation practice in health informatics
(GEP-HI). International Journal of Medical Informatics, 80(12), 815-827.
doi:10.1016/j.ijmedinf.201.08.004
Palm, J., Colombet, I., Sicotte, C., & Degoulet, P. (2006). Determinants of user satisfaction with
a Clinical Information System. AMIA … Annual Symposium Proceedings / AMIA
Symposium. AMIA Symposium, 614-618.
Paterson, G., Shaw, N., Grant, A., Leonard, K., Delisle, E., Mitchell, S., & … Kraetschmer, N.
(2010). A conceptual framework for analyzing how Canadian physicians are using
electronic medical records in clinical care. Studies in Health Technology and
Informatics, 160(Pt 1), 141-145.
Petter, S., Delone, W., & McLean, E. (2008). Measuring information systems success: models,
dimensions, measures, and interrelationships. European Journal of Information
Systems, 17(3), 236-263. doi:10.1057/ejis.2008.15
Polit, D. (2010). Statistics and data analysis for nursing research (2nd ed.). Upper Saddle
River, NJ: Pearson, Inc.
Polit, D. F. & Beck, C. T. (2012). Nursing research (12th ed.). Philadelphia, PA: Wolters Kluwer
Page 97
EFFECTIVENSS OF UCD FOR OPTIMIZING FORM 84
Rogers, M., Sockolow, P., Bowles, K., Hand, K., & George, J. (2013). Use of a human factors
approach to uncover informatics needs of nurses in documentation of care. International
Journal of Medical Informatics, 82(11), 1068-1074. doi:10.1016/j.ijmedinf.2013.08.007
Rojas, C., & Seckman, C. (2014). The Informatics Nurse Specialist Role in Electronic Health
Record Usability Evaluation. Computers, Informatics, Nursing: CIN, 32(5), 214-220.
doi:10.1097/CIN.0000000000000042
Schumacher, R. M. & Lowry, S. Z. (2010). NIST guide to the processes approach for improving
the usability of electronic health records. Washington, D.C. U.S. Department of
Commerce. Retrieved from;
http://www.nist.gov/itl/hit/upload/Guide_Final_Publication_Version.pdf
Smith, K., Smith, V., Krugman, M., & Oman, K. (2005). Evaluating the impact of computerized
clinical documentation. CIN: Computers, Informatics, Nursing, 23(3), 132-138.
Spetz, J., Burgess, J.F., & Phibbs, C. S. (2012). What determines successful implementation of
inpatient information technology systems? The American Journal of Managed Care,
18(3), 157-162.
Steis, M. R., Prabhu, V. V., Kolanowski, A., Kang, Y., Bowles, K. H., Fick, D., & Evans, L.
(2012). Detection of delirium in community-dwelling persons with dementia. Online
Journal of Nursing Informatics, 16(1), 6-20.
Stevenson, J. E., & Nilsson, G. (2012). Nurses' perceptions of an electronic patient record from a
patient safety perspective: a qualitative study. Journal of Advanced Nursing, 68(3), 667-
676. doi:10.1111/j.1365-2648.2011.05786.x
Page 98
EFFECTIVENSS OF UCD FOR OPTIMIZING FORM 85
Talmon, J., de Keizer, N., Nykänen, P., Rigby, M., Brender, J., & Ammenwerth, E. (2013).
STARE-HI – Statement on Reporting of Evaluation Studies in Health Informatics:
explanation and elaboration. Applied Clinical Informatics, 4(3), 331-358.
doi:10.4338/ACI-2013-04-RA-0024
The risks of C-Sections. What hospitals don’t want you to know. (2014). Consumerreports.org.
Retrieved from: http://consumerreports.org/cro/2014/05/what-hospitals-do-not-want-
you-to-know-about-c-sections/index.html
Törnvall, E., & Wilhelmsson, S. (2008). Nursing documentation for communicating and
evaluating care. Journal of Clinical Nursing, 17(16), 2116-2124. doi:10.1111/j.1365-
2702.2007.02149.x
United States Breastfeeding Committee. (2013). Implementing The Joint Commission Perinatal
Care core measure on exclusive breast milk feeding (2nd ed.). Washington, DC: United
States Breastfeeding Committee. Retrieved from:
http://www.usbreastfeeding.org/Portals/0/Publications/Implementing-TJC-Measure-
EBMF-2013-USBC.pdf
Urquhart, C., Currell, R., Grant, M., & Hardiker, N. (2009). Nursing record systems: effects on
nursing practice and healthcare outcomes. Cochrane Database of Systematic Reviews,
(1), doi:10.1002/14651858.CD002099.pub2
Van der Meijden, M., Tange, H., Troost, J., & Hasman, A. (2003). Determinants of success of
inpatient clinical information systems: a literature review. Journal of the American
Medical Informatics Association, 10(3), 235-243.
Page 99
EFFECTIVENSS OF UCD FOR OPTIMIZING FORM 86
Wang, N., Hailey, D., & Yu, P. (2011). Quality of nursing documentation and approaches to its
evaluation: a mixed-method systematic review. Journal of Advanced Nursing, 67(9),
1858-1875. doi:10.1111/j.1365-2648.2011.05634.x
Ward, R., Stevens, C., Brentnall, P., & Briddon, J. (2008). The attitudes of health care staff to
information technology: a comprehensive review of the research literature. Health
Information & Libraries Journal, 25(2), 81-97.
Ward, M., Vartak, S., Schwichtenberg, T., & Wakefield, D. (2011). Nurses’ perceptions of how
clinical information system implementation affects workflow and patient care. CIN:
Computers, Informatics, Nursing, 29(9), 502-511. doi:10.1097/NCN.0b013e31822b8798
White, K.W. & Zaccagnini, M.E. (2011). A template for the DNP scholarly project. In K.W.
White & M. E Zaccagnini (eds.) The Doctor of Nursing Practice essential (pp. 451-493).
Sudbury, MA: Bartlett and Jones
Wong, M., Cummings, E., & Turner, P. (2013). User-centered design in clinical handover:
exploring post-implementation outcomes for clinicians. Studies in Health Technology and
Informatics, 192253-257.
World Health Organization Division of Child Health and Development (1998). Evidence for the
ten steps to successful breast-feeding. Geneva, Switzerland: World Health Organization.
Retrieved from: http://whqlibdoc.who.int/publications/2004/9241591544_eng.pdf
Yantani, K. (2014). Mann-Whitney’s U test. Retrieved July 25, 2015 from:
http://yatani.jp/teaching/doku.php?id=hcistats:mannwhitney
Page 100
EFFECTIVENSS OF UCD FOR OPTIMIZING FORM 87
Zadvinskis, I., Chipps, E., & Yen, P. (2014). Exploring nurses’ confirmed expectations regarding
health IT: a phenomenological study. International Journal of Medical
Informatics, 83(2), 89-98. doi:10.1016/j.ijmedinf.2013.11.00
Zaman, O. S., Cummings, L. C., & Laycox, S. (2012). American’s safety net hospitals. Results
of the annual NAPH hospital characteristics survey. Washington D. C.: National
Association of Public Hospitals and Health Systems.
Zopf-Herling, K. (2011). Enhancing usability in EMR screen design. CIN: Computers,
Informatics, Nursing, 29(12), 679-691. doi:10.1097/NCN.0b013e31823ea54e
Zuzelo, P., Gettis, C., Hansell, A., & Thomas, L. (2008). Describing the influence of
technologies on registered nurses’ work. Clinical Nurse Specialist: The Journal for
Advanced Nursing Practice, 22(3), 132-142.
Page 101
EFFECTIVENSS OF UCD FOR OPTIMIZING FORM 88
Appendix A
Logic Model
Appendix B
Instruments
Figure D1: Logic Model. The logic model is based on a model from White & Zaccagnini, 2011,
p. 481.
Page 102
EFFECTIVENSS OF UCD FOR OPTIMIZING FORM 89
Appendix B
Instruments
Figure A1: Chart Audit Tool. The chart audit tool was used for compiling data from chart review.
Page 103
EFFECTIVENSS OF UCD FOR OPTIMIZING FORM 90
Figure A2: Survey. Survey was modified from the System and Use Assessment Survey,
Canada Health Infoway. Used and modified by permission. Retrieved from:
http://healthit.ahrq.gov/health-it-tools-and-resources/health-it-survey-
compendium/canada-health-infoway-system-and-use
Page 104
EFFECTIVENSS OF UCD FOR OPTIMIZING FORM 91
Figure A2 continued.
Page 105
EFFECTIVENSS OF UCD FOR OPTIMIZING FORM 92
Figure A2 continued.
Page 106
EFFECTIVENSS OF UCD FOR OPTIMIZING FORM 93
Figure A2 continued.
Page 107
EFFECTIVENSS OF UCD FOR OPTIMIZING FORM 94
Figure A2 continued.
Page 108
EFFECTIVENSS OF UCD FOR OPTIMIZING FORM 95
Figure A2 continued.
Page 109
EFFECTIVENSS OF UCD FOR OPTIMIZING FORM 96
Appendix C
Permissions
Figure B1. Permission to Use and Modify System and Use Assessment Survey. Permission
was received from Canada Health Infoway to use the System and Use Assessment Survey.
Page 110
EFFECTIVENSS OF UCD FOR OPTIMIZING FORM 97
Figure B2. Permission to Use DeLone and McLean D&M IS Success Model.
Page 111
EFFECTIVENSS OF UCD FOR OPTIMIZING FORM 98
Appendix D
Systematic Review of the Literature: Exemplar
Table C1
Systematic Literature Review: Exemplar
Search Term All Results Included
HIT Success 215 10
Electronic Health Record & Nursing 116 10
Electronic Health Record & Evaluation 416 6
Nursing Documentation Systems AND: 1002 10
Nursing Attitudes 117 13
• Nursing Satisfaction 76 10
• Quality 347 3
• Usability 8 28
Databases: CINAHL, MEDLINE, Academic Search Premier, PsycINFO
Limits Full text, academic journals, 2003 or later, English language
Citation Key Findings Level of Evidence
Ammenwerth, E., Gräber, S., Herrmann, G.,
Bürkle, T., & König, J. (2003). Evaluation of
health information systems—problems and
challenges. International Journal of Medical
Informatics, 71(2/3), 125.
doi:10.1016/S1386-5056(03)00131-X
HIT evaluation is complex:
Evaluation of the OBJECT
Evaluation of the PROCESS
III
Van der Meijden, M., Tange, H., Troost, J., &
Hasman, A. (2003). Determinants of success
of inpatient clinical information systems: a
literature review. Journal of the American
Medical Informatics Association, 10(3), 235-
243.
Determinants of success for
inpatient clinical information
systems
Based on DeLone and McLean
framework
Literature Review; 33 articles
IV
Page 112
EFFECTIVENSS OF UCD FOR OPTIMIZING FORM 99
No explicit definition of
success
DeLone and Mclean applicable
Booth, R. (2012). Examining the Functionality
of the DeLone and McLean Information
System Success Model as a Framework for
Synthesis in Nursing Information and
Communication Technology Research. CIN:
Computers, Informatics, Nursing, 30(6), 330-
345.
Evaluation of nursing research
What are the relevant studies?
Is DeLone and McLean
appropriate?
Literature Review; 39 studies
Weak understanding
Over emphasis on user
satisfaction
IV
Huryk, L. A. (2010). Factors influencing
nurses’ attitudes towards healthcare
information technology. Journal of Nursing
Management, 18(5), 606-612.
doi:10.1111/j.1365-2834.2010.01084.x
Literature Review; 13 studies
Inclusion: RN attitude towards IT
Demographic data: experience
Enhancing patient care, safety
Poor system design or system quality
IV
Kimiafar, K., Sadoughi, F., Sheikhtaheri, A., &
Sarbaz, M. (2014). Prioritizing factors
influencing nurses’ satisfaction with hospital
information systems: a fuzzy analytic
hierarchy process approach. Computers,
Informatics, Nursing: CIN, 32(4), 174-181.
doi:10.1097/CIN.0000000000000031
Fuzzy analytic hierarchy
Prioritize factors that influence
satisfaction
Findings: Information Quality
High quality
Secure
Available when and where
needed
III
Hripcsak, G., Vawdrey, D., Fred, M., &
Bostwick, S. (2011). Use of electronic clinical
documentation: time spent and team
interactions. Journal of the American
Medical Informatics Association, 18(2), 112-
117. doi:10.1136/jamia.2010.008441
Documentation time and use
of information
Academic medical center;
inpatient
How long to input; who viewed
Limitation: only clinical notes
16% attending; 8% resident;
38% RN
III
Keenan, G., Yakel, E., Dunn Lopez, K.,
Tschannen, D., & Ford, Y. (2013). Challenges Flow of information IV
Page 113
EFFECTIVENSS OF UCD FOR OPTIMIZING FORM 100
to nurses’ efforts of retrieving, documenting,
and communicating patient care
information. Journal of the American
Medical Informatics Association, 20(2), 245-
251. doi:10.1136/amiajnl-2012-0008947
Qualitative study; 8 units; 4
hospitals
Observation
Three themes:
Variation
No overview
Rare interprofessional
communication
Rojas, C., & Seckman, C. (2014). The
Informatics Nurse Specialist Role in
Electronic Health Record Usability
Evaluation. Computers, Informatics, Nursing:
CIN, 32(5), 214-220.
doi:10.1097/CIN.0000000000000042
Framework for evaluation of
usability
Rules/ Heuristics
Consistency, Effective
Presentation; Real World
Match
Evaluate usability through all
stages
VII
Kennedy Page, C., & Schadler, A. (2014). A
Nursing Focus on EMR Usability Enhancing
Documentation of Patient
Outcomes. Nursing Clinics of North
America, 49(1), 81-90.
doi:10.1016/j.cnur.2013.11.010
Usability evaluation of nursing
assessments
Purpose: Increase efficiency,
effectiveness, and satisfaction
User Centered Design
Usability Checklist
Instruments:
Survey
Keystroke counter
Quality measures
Pre and Post Test
Significant improvements
III
Page 114
EFFECTIVENSS OF UCD FOR OPTIMIZING FORM 101
Appendix E
Project Milestones
Figure E1: Project Milestones and Timeline with Key Dates Listed.
Page 115
EFFECTIVENSS OF UCD FOR OPTIMIZING FORM 102
Appendix F
IRB Approvals and CITI Training
Figure F1: Colorado Multiple Institutional Review Board (COMIRB) IRB Approval Letter.
Page 116
EFFECTIVENSS OF UCD FOR OPTIMIZING FORM 103
Figure F2: Regis University IRB Approval Letter.
Page 117
EFFECTIVENSS OF UCD FOR OPTIMIZING FORM 104
Figure F3: CITI Training Certificates: Human Research Biomedical Research Investigators and
Key Personnel.
Page 118
EFFECTIVENSS OF UCD FOR OPTIMIZING FORM 105
Figure F4: CITI Training Certificates: Human Research Social Behavioral Research Investigators
and Key Personal.
Page 119
EFFECTIVENSS OF UCD FOR OPTIMIZING FORM 106
Figure F5: CITI Training Certificates: Human Research Biomedical Investigators.
Page 120
EFFECTIVENSS OF UCD FOR OPTIMIZING FORM 107
Figure F6: CITI Training Certificates: Health Information Privacy and Security.
Page 121
EFFECTIVENSS OF UCD FOR OPTIMIZING FORM 108
Appendix G
Agency Letters of Support
Figure G1: Denver Health Nursing Letter of Approval.
Page 122
EFFECTIVENSS OF UCD FOR OPTIMIZING FORM 109
Figure G1. Continued.
Page 123
EFFECTIVENSS OF UCD FOR OPTIMIZING FORM 110
Figure G1. Continued.
Page 124
EFFECTIVENSS OF UCD FOR OPTIMIZING FORM 111
Figure G2: Denver Health Sponsored Programs and Research Office