RD-R145 426 EFFECTS OF LACTIC ACID BACTERIA ON RESIDUAL NITRITE IN 1/2 SUMMER STYLE SAUSRGE(U) UTAH UNIV SALT LAKE CITY UNCLASSIFIED F/G 6/13 NL I flh/hh/hlf/lfllf I fl l.flfflfflfflf mhmmhhhhhhhhhl mhhmhhhhhhhhmu III I IIffll lfll EIIIIIIIIIIEI
Transcript
RD-R145 426 EFFECTS OF LACTIC ACID BACTERIA ON RESIDUAL NITRITE IN 1/2SUMMER STYLE SAUSRGE(U) UTAH UNIV SALT LAKE CITY
UNCLASSIFIED F/G 6/13 NL
I flh/hh/hlf/lfllfI fl l.flfflfflfflfmhmmhhhhhhhhhlmhhmhhhhhhhhmuIII I IIffll lfllEIIIIIIIIIIEI
1.0
liiiim I5
11111 1..2V.*
.4 %
%r A.** -
MICRIOCOPY RESOLUTION TEST CHIART . ,
NATION AL BUREAU Or STANDARDS % ' A (I.' * * -
;-.. -..
0
".,.,
N .L
-. ~~~~ ~ ~ - I.... . .i %
EFFECTS OF LACTIC ACID BACTERIA ON RESIDUAL NITRITE
3. Lactic acid bacteria isolated from fresh meatusing the conditions listed below including120 ppm nitrite .................................... 25 0
4. Methods of identification of bacteria .............. 25
5. Formulations for three model meat systems .......... 32
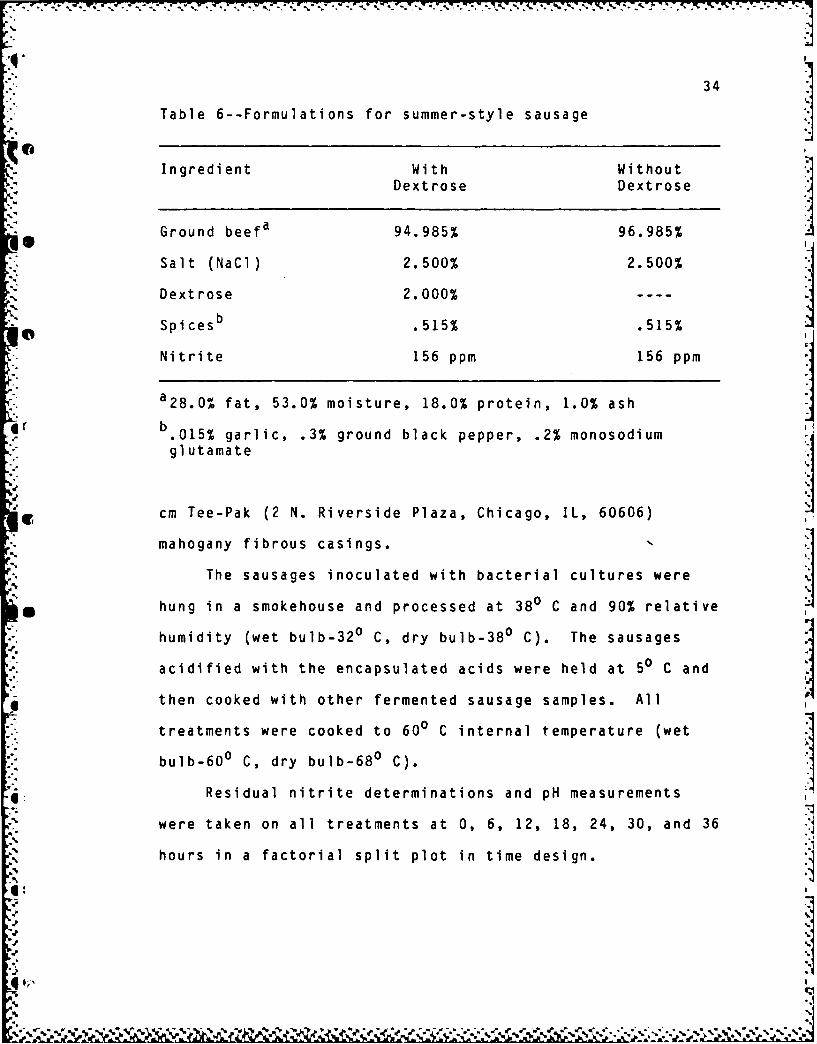
6. Formulations for summer-style sausage .............. 34 O
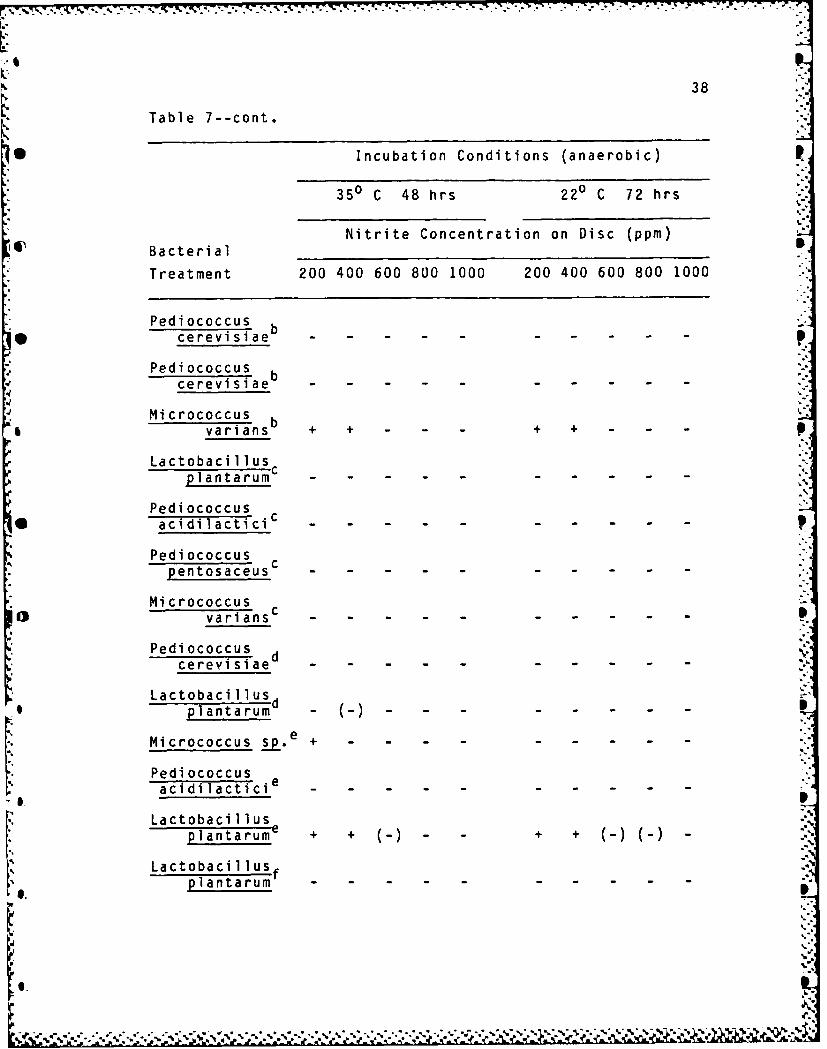
7. Nitrite reduction by bacteria using an adaptionof the MINITEK (BBL) hardware ...................... 37
8. Nitrite reduction by bacteria in basal MRS brothcontaining 120 parts per million nitrite ........... 41
9. Residual nitrite and pH in basal MRS broth,having 200 ppm added nitrite, by bacterialtreatments grown in carbon monoxideand anaerobic atmospheres at 220 C for 48 hours .... 45
10. Duncan's multiple range test comparing meanresidual nitrite for bacterial treatments inbasal MRS broth (Appendix A) containing noadded carbohydrate 156 ppm nitrite, incubated 4.anaerobically at 56, 150, and 350 C for 48 and A096 hours ........................................... 47
11. Duncan's multiple range test comparing mean pHand residual nitrite (ppm) values for bacterialtreatments incubated for various times in MRS(Difco) media containing 2% fermentablecarbohydrate and 156 ppm nitrite ................... 49 0
12. Duncan's multiple range test comparing mean pHand residual nitrite (ppm) values for bacterialtreatments incubated at various temperaturesin MRS (Difco) media containing 2% fermentablecarbohydrate and 156 ppm nitrite ................... 49
,1L*% O* ... . l. ~ * p *-~
vi
LIST OF TABLES (cont.)
Table Page
13. Duncan's multiple range test comparing mean pHvalues for bacterial and chemically acidifiedtreatments in MRS (Difco) media containing 2%carbohxdrate, 1,6 ppm nitrite and incubated at50, 15 , and 35 C for 48 and 96 hours ............. 51
14. Duncan's multiple range test comparing meanresidual nitrite for bacterial and chemically
* acidified treatments in MRS (Difco) brothcontaining 2% Sarbohydrate, A56 ppm nitrite andincubated at 5 , 150, and 35 C for 48 and 96hours .............................................. 53
15. Duncan's multiple range test comparing mean pHand residual nitrite (ppm) values of 3 modelmeat systems containing 156 ppm nitrite andincubated at 35 C with measurements taken at0, 12, 24, and 36 hours ........ ... ... ..... . 56
16. Duncan's multiple range test comparing mean residualnitrite for bacterial and chemically acidifiedtreatments in 3 model meat systems containing 156ppm nitrite and incubated at 35 C withmeasurements taken at 0, 12, 24, and 36 hours ...... 57
17. Terminal pH and residual nitrite values forbacterial and chemically acidified treatments inmodel meat systems containing 156 ppm nitrite,taken after 36 hours incubation at 350 C ........... 59
18. Duncan's multiple range test comparing meanpH values for bacterial and chemically acidifiedtreatments in 3 model meat systems containing 156 0ppm nitrite and incubated at 35 C withmeasurements taken at 0, 12, 24, and 36 hours ...... 60
19. Terminal pH and residual nitrite values forbacterial and chemically acidified treatmentsin 2 finished summer-style sausage formulations Scontaining 156 ppm nitrite and beef with andwithout added carbohydrate ......................... 63
e..0
C S;
LIST OF TABLES (cont.)
Table Page
20. Duncan's multiple range test comparing meanI. residual nitrite for bacterial and chemically -
acidified treatments in summer-style sausagesformulated with and without added carbohydrate,containing 156 ppm nitrite and incubated at380 C with determinations taken at 0, 6, 12,18, 24, 30, and 36 hours..... .......&...... ........ 65
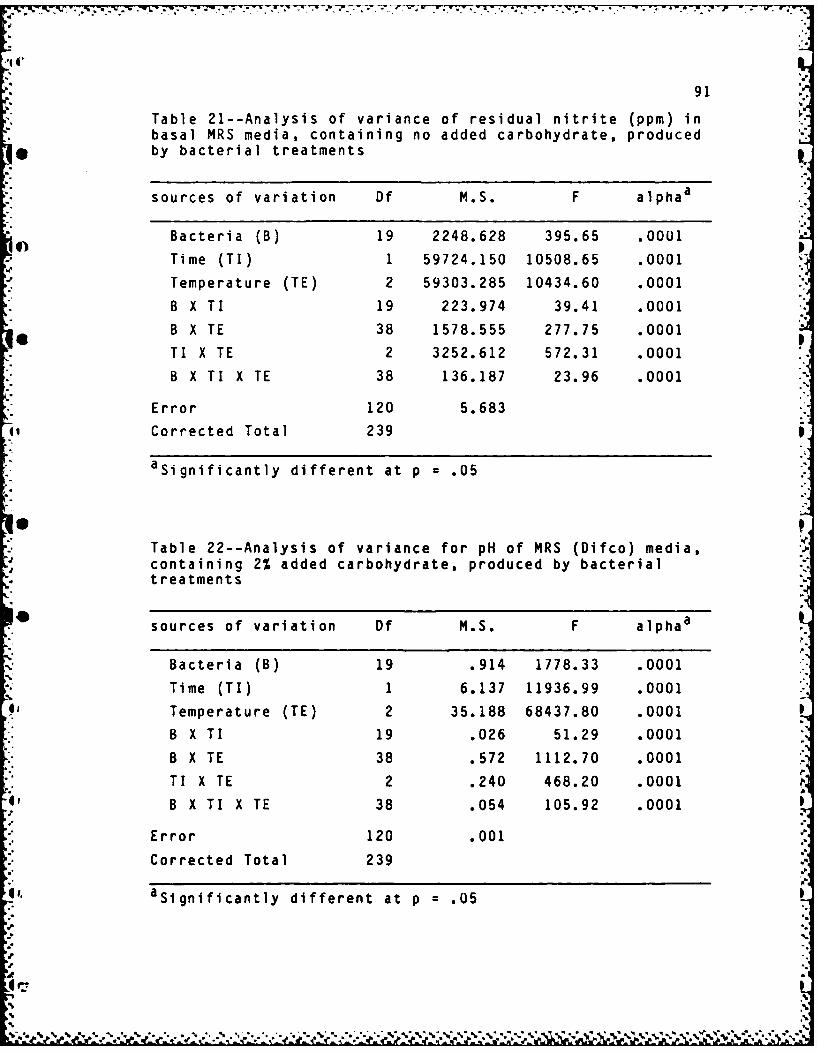
21. Analysis of variance of residual nitrite (ppm)in basal MRS media, containing no addedcarbohydrate, produced by bacterial treatments ..... 91
22. Analysis of variance for pH of MRS (Difco)media, containing 2% added carbohydrate,
*produced by bacterial treatments ................... 91
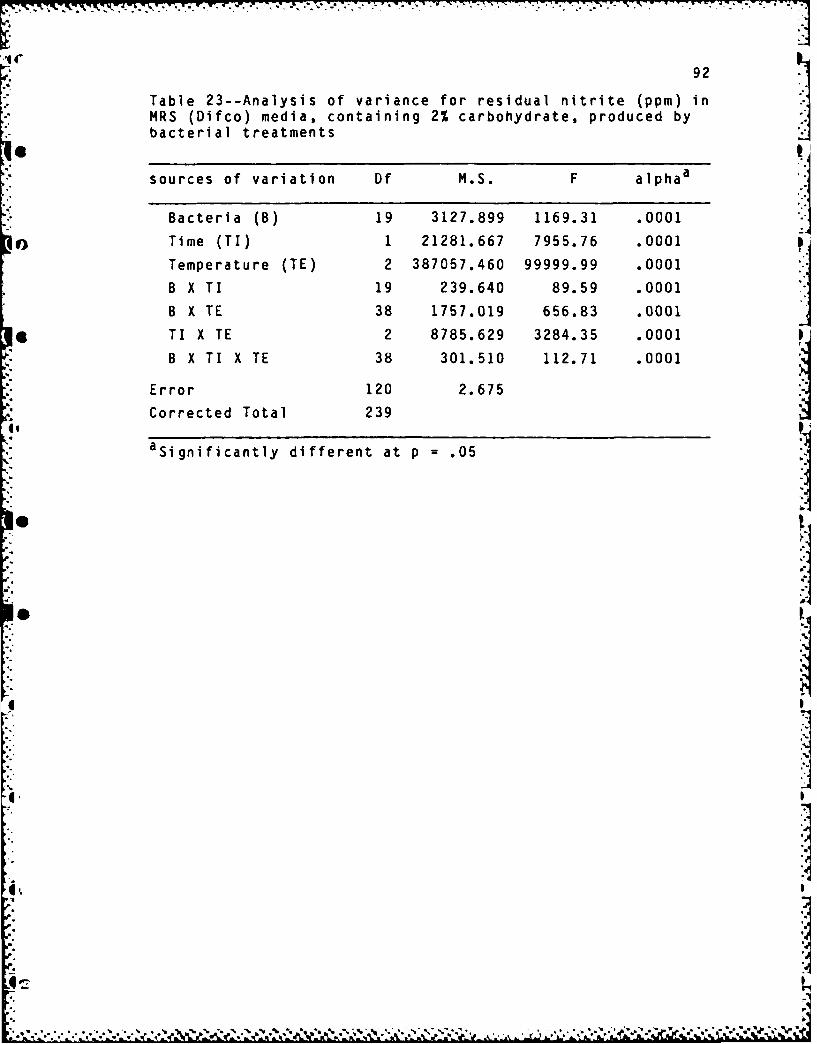
23. Analysis of variance for residual nitrite (ppm)in MRS (Difco) media, containing 2% carbohydrate,produced by bacterial treatments ......... .. ........ .92
*24. Analysis of variance of pH in 3 model meatsystems composed of mutton and beef with andwithout added carbohydrate ...... . ............. .. ... 93
25. Analysis of variance of residual nitrite (ppm)in 3 model meat systems composed of mutton and
*beef with and without added carbohydrate ........... 94
26. Analysis of variance of pH in 2 fermentedsummer-style sausage formulations composed ofbeef with and without added carbohydrate ........... 95
* 27. Analysis of variance of residual nitrite in 2fermented summer-style sausage formulationscomposed of beef with and without added
1. Nitrite depletion n summer-style sausagesinoculated with 10 bacterial cells per gof meat, containing 156+/-2 ppm added nitriteand 2% added carbohydrate and processed at 380 C . 67..6
2. Changes in pH in simmer-style sausagesinoculated with 10 bacterial cells per gof meat, containing 156+/-2 ppm added nitriteand 2% added carbohydrate and processed at 380 C .... 69 0
* 0
,.'
-* S
O N'
'a,?
a:,.
ix
ABSTRACT
Effects of Lactic Acid Bacteria on Residual Nitrite
in a Summer Style Sausage
by
Bruce L. Woodbury, Master of Science
Utah State University, 1984
Major Professor: Dr. Darrell T. BartholomewDepartment: Nutrition and Food Sciences
Lactic acid bacteria were evaluated for their ability
to reduce nitrite and produce acid. Tests were conducted in
broth, model meat systems, and a fermented sausage. The
bacteria were screened for their ability to reduce nitrite
irrespective of pH effects, in broth containing no added
Technics), L. plantarum (ABC Research Corp.), and isolate
Beef LBS 3-2 reduced the nitrite on the 400 ppm disk under
both incubation conditions while Streptococcus faecalis j(pork isolate) reduced the nitrite on the 400 ppm disk when
incubated at 350 C for 48 hours.
Basal MRS Broth
The relative ability of bacteria to reduce 120 ppm
nitrite in MRS broth (Appendix A) containing no added
carbohydrate is shown in Table 8. Again nitrite depletion0
due to time and temperature was compensated for by
comparison of treatments with identically incubated
controls. The pH of the autoclaved, uninoculated broth was
6.64 and terminal pH values of the bacterial samples ranged
from 6.48 to 6.71. Nitrite depletion due to the slight
fluctuation in pH (+.07 to -.16) of the bacterial treatments
compared to the control was probably minimal since the
majority of the treatments had color values similar to the
control. All bacteria showing ability to reduce nitrite in
the MINITEK (BBL) adaptation showed similar ability in
broth. P. pentosaceus and M. varians (both Trumark Inc.)
showed an ability not expressed in the MINITEK system.
Inhibition
The values of residual nitrite and terminal pH for
41 bacterial strains incubated in a carbon monoxide atmosphere
0
41
41
Table 8--Nitrite reduction by bacteria in basal MRS brothcontaining 120 parts per million nitrite
qt
Incubation Conditions (anaerobic)
350 C 24 hrs 220 C 24 hrs
Bacterial
- Treatment REP 1 REP 2 REP 1 REP 2
hControl h
Lactobacillus* acidophilusa
Lactobacilluscaseia
LactobacillusV leichmanniia (+)+ + +
Lactobacillusplantarum '
Lactobacillusbulgaricus a
Lactobacillusfermentuma
Lactobacilluscasei, subsp a
rhamnosus
Pediococcusaacidilactici a
Lactobacillus
viridescensa
Streptococcusfaecalis a -- + - +
Streptococcus
Leuconostocmesenteroidesa
4'
4..
4...
* - . N*(*. .~ n~n.~
42
Table 8--cont.
Incubation Conditions (anaerobic)
acei 350 C 24 hrs 220 C 24 hrs
Treatment REP 1 REP 2 REP 1 REP 2
Pediococcusbcerevisiae b
Pediococcus b----
Micrococcus b( ) (
Lactobacill1usplantarum --
Pediococcus
pentosace us () (- + +
Mi crococcus() ()
Pediococcusd----
Lactobaci llus dplantaruni--
Micrococcus sp e - ()() (+
Pediococcuse
Lactobacill1us*plantarum' H+ H+ + +
r*. LactobacillusK f
plantarum----
43
Table 8--cont.
(9 Incubation Conditions (anaerobic)
350 C 24 hrs 220 C 24 hrs:.- Bacterial
Treatment REP 1 REP 2 REP 1 REP 2
Mutton MRS 4-1 ....
Mutton LBS 10-4 (+) (+) (+) (+)
Mutton MRS 5-5 (+) (+) + (+)
Beef MRS 3-3 - (-) - -
B e e f L B S 1 -3 ....
I* Beef LBS 3-2 (-) (+) (+) (+)
Streptococcusfaecalis (+) (+) + +
*l, aATCC
bMicrolife Technics
cTrumark Inc.
*D dChr. Hansen's Laboratory, Inc.
eABC Research Corp.
fB. Heller & Co.
gpork isolate
hSymbols: + no nitrite remaining, completely reduced(+) little nitrite remaining, mostly reduced(-) most of the nitrite remaining, some reduction
- no change in nitrite level, no reduction
VL
44
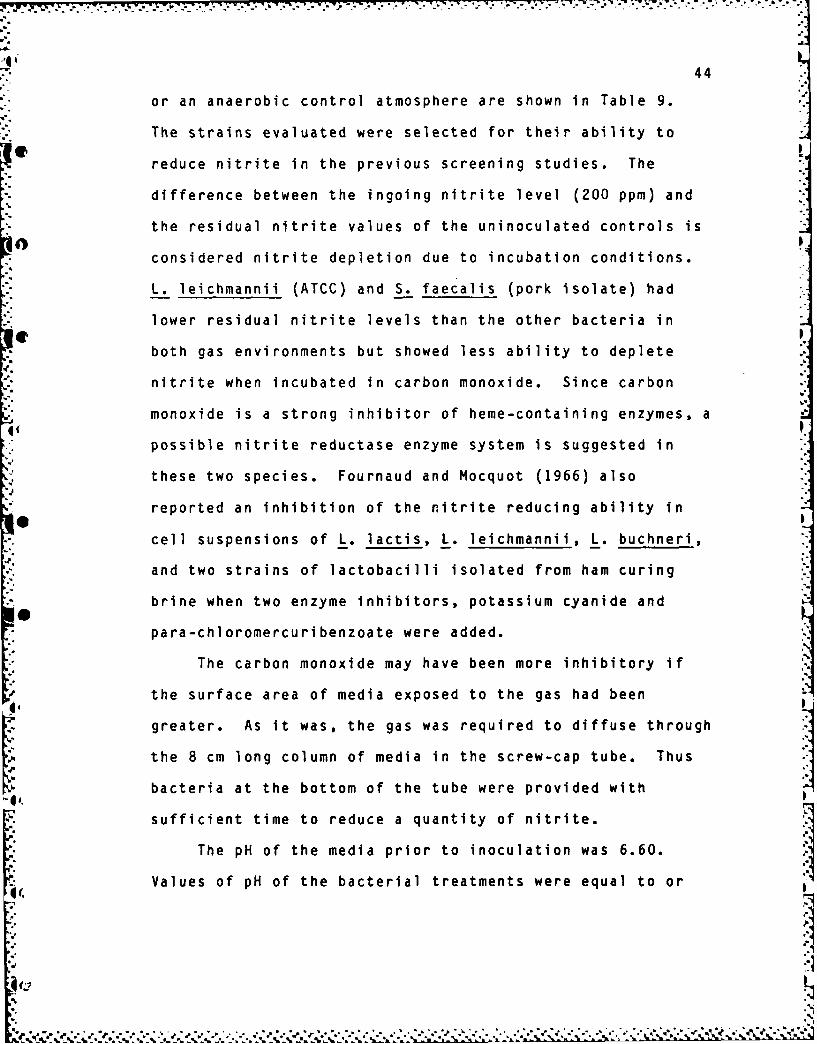
or an anaerobic control atmosphere are shown in Table 9.
The strains evaluated were selected for their ability to :A
reduce nitrite in the previous screening studies. The
difference between the ingoing nitrite level (200 ppm) and
the residual nitrite values of the uninoculated controls is
considered nitrite depletion due to incubation conditions.
L. leichmannii (ATCC) and S. faecalis (pork isolate) had
lower residual nitrite levels than the other bacteria in
both gas environments but showed less ability to deplete
nitrite when incubated in carbon monoxide. Since carbon
monoxide is a strong inhibitor of heme-containing enzymes, a
possible nitrite reductase enzyme system is suggested in
these two species. Fournaud and Mocquot (1966) also
reported an inhibition of the nitrite reducing ability in
cell suspensions of L. lactis, L. leichmannii, L. buchneri,
and two strains of lactobacilli isolated from ham curing
brine when two enzyme inhibitors, potassium cyanide and
para-chloromercuribenzoate were added.
The carbon monoxide may have been more inhibitory if
the surface area of media exposed to the gas had been
greater. As it was, the gas was required to diffuse through
the 8 cm long column of media in the screw-cap tube. Thus
bacteria at the bottom of the tube were provided with
sufficient time to reduce a quantity of nitrite.
The pH of the media prior to inoculation was 6.60.
Values of pH of the bacterial treatments were equal to or
4'
Jq*1
45
Table 9--Residual nitrite and pH values in basal MRS broth,having 200 ppm added nitrite, by bacterial treatmenta growni in a carbon monoxide and anaerobic atmospheres at 22 C for
above those of the controls, thus eliminating any nitrite
depletion due to pH/nitrite interaction.
Quantitative Nitrite Depletion and Acid Production
Determinations in Laboratory Media
Twenty bacterial strains and an uninoculated control
were evaluated for their ability to reduce nitrite in basal
broth with no fermentable carbohydrate added. A 20X3X2
factorial design was used with 3 incubation temperatures
.V NIZ&
46
(50, 150, and 350 C) and 2 incubation times (48 and 96
hours)
Analysis of variance of residual nitrite in basal MRS
media is shown in Appendix E, Table 21. Differences in mean
residual nitrite levels between the two incubation times (48
and 96 hours) was significant (p=.O001) with the longest
time (96 hours) showing the greatest depletion (p=.05). A
significant difference (p=.0001) also occured between
temperatures (50, 150, and 350 C). However, mean residual
nitrite levels were not different between 50 and 150 C while
greater nitrite depletion occured at 350 C (p=.05).
Fournaud and Mocquot (1966) found that the optimum
temperature for enzymatic nitrite reduction by .
leichmannii, L. lactis, L. buchneri, and two lactobacilli
isolated from ham curing brine was 220 C. Bacterial
treatment means showed highly significant differences
0 (p=.O001). Several bacteria were able to reduce nitrite to
a greater degree than observed during screening. Two
strains, S. faecium and P. acidilactici (ABC Research
Corp.), which had not shown any nitrite reducing ability in
screening, had lower mean nitrite levels than Mutton LBS
10-4, Mutton MRS 5-5, or Beef LBS 3-2, three strains showing
good reduction in previous screening (Table 10). L.
leichmannii and S. faecalis (pork isolate) reduced more
nitrite (p=.05) than all other strains tested (Table 10;
4-, p=.05).
""' I1• R.. Y - -.. Kxv ... ~~' -f*'~ - -
47
Table 10--Duncan's multiple range test comparing meanresidual nitrite for bacterial treatments in basal MRS broth(Appendix A) containing no added carb 8hydrgte, 156 gpmnitrite, incubated anaerobically at 5 ,15 ,and 35 C f o r48 and 96 hours
Mean ResidualDuncan Grouping a Nitrite (ppm) Treatment
0h135.17 Control' (uninoculated)
A 129.83 Beef LBS 1-3
B A 127.92 Mutton MRS 4-1
*B 127.17 Beef MRS 3-3
B C 126.83 Lactobacillus viridescensb
D C 125.08 Pediococcus cerevisiaeC
D 124.67 Beef LBS 3-2
D E 124.00 Pediococcus cerevisiaee
D E F 123.08 Mutton LBS 10-4
G E F 122.42 Lactobacillus piantarumb
G F 121.83 Mutton MRS 5-5GF121.83 Lactobacillus bulaiu
aMeans with the same letter are not significantly different
at p = .05. Duncan value = 1.91.bATCC
CMicrolife Technics
* dTrumark Inc.
eChr. Hansen's Laboratory, Inc.
fABC Research Corp.
gpork isolatem hAnalysis for nitrite is accurate to 1 ppm. Fractional
values are due to mean computation (12 data points) and arenecessary for Duncan procedure.
"Not given a Duncan grouping since not included in analysisof variance.
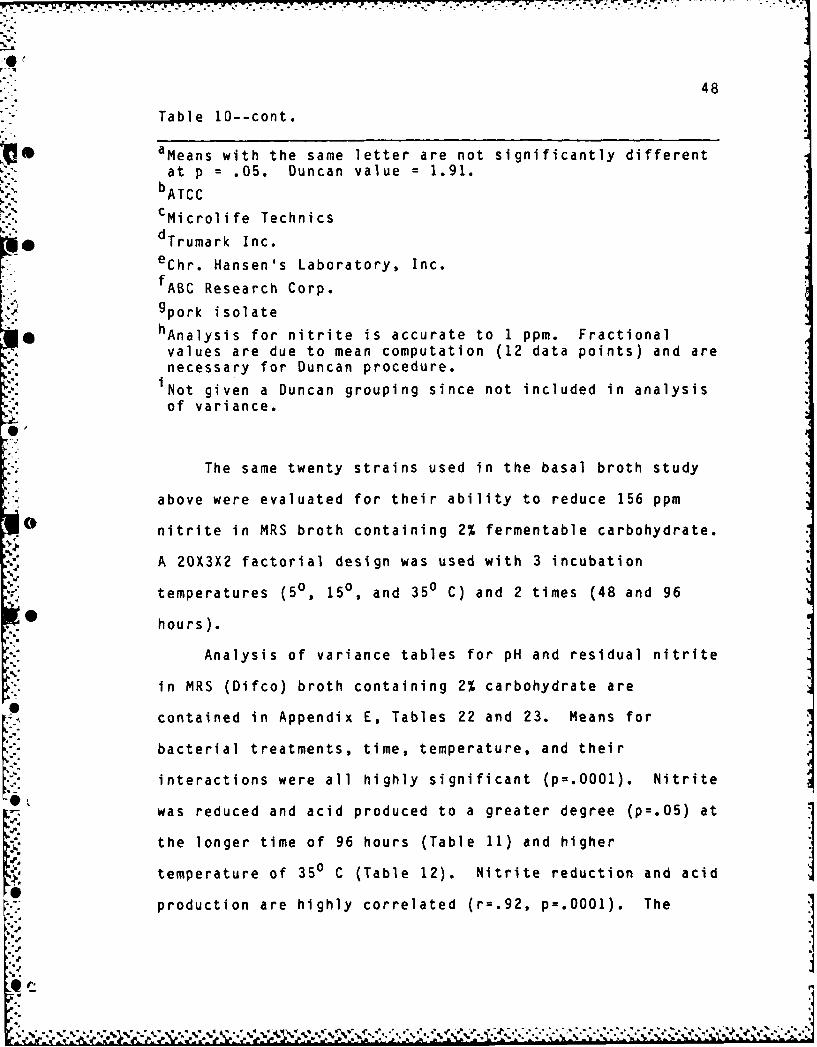
The same twenty strains used in the basal broth study
above were evaluated for their ability to reduce 156 ppm
nitrite in MRS broth containing 2% fermentable carbohydrate.
A 20X3X2 factorial design was used with 3 incubation
temperatures (50, , and 350 C) and 2 times (48 and 96
hours).
Analysis of variance tables for pH and residual nitrite
in MRS (Difco) broth containing 2% carbohydrate are
S. contained in Appendix E, Tables 22 and 23. Means for
bacterial treatments, time, temperature, and their
interactions were all highly significant (p=.O001). Nitrite
was reduced and acid produced to a greater degree (p=.05) at
the longer time of 96 hours (Table 11) and higher15 temperature of 350 C (Table 12). Nitrite reduction and acid
production are highly correlated (r=.92, p=.0001). The
4.
49
Table 11--Duncan's multiple range test comparing mean pH andresidual nitrite (ppm) values for bacterial treatmentsincubated for various times in MRS (Difco) media containing2% fermentable carbohydrate and 156 ppm nitrite
Means/Duncan Groupinga
Residual b* Incubation Times pHb Nitrite (ppm)
48 hours 5.3819 A 94.542 A
96 hours 5.0621 B 75.708 B
aMeans with the same letter are not significantly different
at p = .05. Duncan value = .0626 (pH) and 3.238 (residualnitrite).
* bAnalysis for nitrite is accurate to 1 ppm and pH to .01.
Fractional values are due to mean computation and arenecessary for Duncan procedure.
Table 12--Duncan's multiple range test comparing mean pH andresidual nitrite (ppm) values for bacterial treatmentsincubated at various temperatures in MRS (Difco) mediacontaining 2% fermentable carbohydrate and 156 ppm nitrite
Means/Duncan Groupinga P.
Res id ualIIncubation Temperatures pHb Nitrite (ppm)b
5 0 C 5.8331 A 149.97 A S
15 0 C 5.3161 B 93.74 B
35 0 C 4.5167 C 11.66 C
aMeans with the same letter are not significantly differentat p = .05. Duncan value = .0538 (pH) and 2.783 (residualnitrite).
bAnalysis for nitrite is accurate to 1 ppm and pH to .01.Fractional values are due to mean computation and arenecessary for Duncan procedure.
6 . . . ~ .. . ..-
50
means of residual nitrite (85 ppm) and pH (5.22) for MRS
broth containing fermentable carbohydrate were significantly
lower (p=.05) than for the basal MRS broth (115 ppm, pH
6.55). This supports the findings of Olsman and Krol (1972)
that nitrite depletion was enhanced by lower pH levels. In
addition, broth acidified with gluconic and lactic acids had
the lowest (p=.05) mean pH values of 4.71 and 4.26
respectively (Table 13) and the lowest mean residual nitrite
of 49 and 38 ppm (Table 14).
Collins-Thompson and Rodriguez Lopez (1981) found L.
mesenteroides reduced nitrite levels in APT broth at a
greater rate than L. plantarum or L. viridescens. In this
study results were found in MRS broth (Table 14) where three
strains of L. plantarum had lower mean residual nitrite
levels than L. mesenteroides (p=.05). All interactions of
bacterial treatment, time, and temperature were significant
(p=.05).
The atypical lactobacilli isolated from mutton and beef
had lower mean pH values (p=.05) than all but three
bacterial treatments (Table 13) and had the lowest mean
residual nitrite levels (Table 14, p=.05). L. leichmannii
and S. faecalis (pork isolate) were less efficient at acid
production than most treatments (Table 13) and subsequently
had higher corresponding mean nitrite levels (Table 14).
51
Table 13--Duncan's multiple range test comparing mean pHvalues for bacterial and chemically acidified treatments inMRS (Difco) media containing 2% carbohydrate, 156 ppmnitrite and incubated at 50, 150 and 350 C for 48 and 96hours
Duncan Groupinga Mean pH Treatment
6.0575 Control i (uninoculated)b-
A 5.8242 Lactobacillus viridescensbA 5.8142 Streptococcus faecalis
B 5.5933 Streptococcus faecalis g
C 5.4908 Streptococcus faeciumb
D 5.3792 Leuconostoc mesenteroidesb
E 5.3525 Lactobacillus bulgaricusb
F 5.3308 Lactobacillus leichmannii b
fG 5.1675 Pediococcus acidilactici
G 5.1667 Pediococcus cerevisiaec
H 5.1200 Lactobacillus plantarumb5.1200 Lactobacillus plantarum e
H 5.1183 Lactobacillus plantarume
I 5.0742 Mutton MRS 4-1
I 5.0725 Lactobacillus plantarum f
J 1 5.0692 Beef LBS 3-2
0 J 5.0508 Mutton LBS 10-4
K 5.0292 Beef LBS 1-3
L 5.0042 Mutton MRS 5-5
M 4.9625 Pediococcus pentosaceusd
N 4.9133 Beef MRS 3-3
N 4.9067 Pediococcus cerevisiaee
0 4.7075 gluconic acid
P 4.2608 lactic acid
K%
o S
tin[S
52
Table 13--cont.
aMeans with the same letter are not significantly different 4
at p = .05. Duncan value = .0245bATCC
CMicrolife Technics
dTrumark Inc.
echr. Hansen's Laboratory, Inc.
fABC Research Corp.gpork isolate
o hMeasurement of ph is accurate to .01. Fractional
values are due to mean computation (12 data points) and arenecessary for Duncan procedure.
"Not given a Duncan grouping since not included in analysisof variance.
-pp
[.'.
L-.•
.
r",
|.".
m# %-Ij4.7
l-,,.J*
53
Table 14--Duncan's multiple range test comparing meanresidual nitrite for bacterial and chemically acidified
0 treatments in MRS (Difco) broth containng 2% carbohydrate,156 ppm nitrite and incubated at 5 ,15 , and 350 C for 48and 96 hours
Mean Residual0 Duncan Groupinga Nitrite (ppm) Treatment
125.29 Control1 (uninoculated)b
A 118.58 Lactobacillus viridescens
B 115.00 Streptococcus faecalisb|o b
C 98.25 Lactobacillus leichmannii b
C 98.25 Leuconostoc mesenteroidesbbC 97.75 Lactobacillus bulgaricus
D 95.83 Pediococcus acidilacticif
E 92.17 Streptococcus faeciumb
cE 91.83 Pediococcus cerevisiaeF 88.33 Lactobacillus plantarume£ F 87.92 Lactobacillus plantarumb
G 85.25 Streptococcus faecalis g
H 77.67 Pediococcus pentosaceusd
H 76.42 Lactobacillus plantarumf
" eI 72.67 Pediococcus cerevisiae
J 1 72.08 Mutton LBS 10-4
J I 71.75 Beef LBS 1-3
J 70.83 Mutton MRS 4-1
K 68.08 Mutton MRS 5-5
L 62.83 Beef LBS 3-2
M 61.00 Beef MRS 3-3
N 49.58 gluconic acid
0 38.50 lactic acid
7 7
54
Table 14--cont.
aMeans with the same letter are not significantly different
at p = .05. Duncan value = 1.2676.bATCC
CMicrolife TechnicsdTrumark Inc. it
eSeChr. Hansen's Laboratory, Inc....f. ,ABC Research Corp.
gpork isolate• hAnalysis for nitrite is accurate to 1 ppm. Fractional
values are due to mean computation (12 data points) and arenecessary for Duncan procedure.
iNot given a Duncan grouping since not included in analysisof variance.
Model Meat System
Twelve bacterial treatments, selected from the previous
0 broth studies for their nitrite reduction and acid.'
production abilities, uninoculated controls, and two
encapsulated acids were evaluated in a 3X2 factorial design
0 using 3 model meat systems (beef and mutton with added
carbohydrate and beef without) and 2 repetitions.
Analysis of variance tables for pH and residual nitrite
* are shown in Appendix E, Tables 24 and 25. The means of
bacterial treatment, meat media, time, and all interactions
for both pH and residual nitrite were significant at
p=.0001, however; the mean residual nitrite level of mutton
with added carbohydrate was not different from beef without
carbohydrate.
t0
~ S .5"- -
.5o
* . . ... . . . . . .
55
Residual nitrite and pH were highly correlated in all
three meats (r=.86 in both beef systems, r=.94 in mutton;
p=.O001). Although the mean pH (5.54) of the basal beef
formulation (Table 15) was significantly higher (p=.05) than
pH values of beef with added car)ohydrate (5.46) and mutton P
with added carbohydrate (5.43), its concommittant depletion
of nitrite was not different than mutton with added
P 41 carbohydrate. In fact, four of the twelve bacteria had
equivalent or lower terminal nitrite levels in the basal
beef mixture than in the two systems containing added
carbohydrate (Table 16). Two strains, L. leichmannii and
the atypical lactobacilli isolate Mutton MRS 5-5 had lower
mean residual nitrite levels in the basal beef (Table 16).
41 The reduction in pH level from the initial value of 5.81 to
the terminal values listed for basal beef in Table 17 may be
evidence of naturally occuring fermentable substrate in the
ID meat which may mask any microbial depletion other than that
due to pH.
The two encapsulated acids, glucono delta lactone and
lactic, had pH values less than the uninoculated controls in
all three meat systems (Table 18) yet the controls had
significantly lower mean residual nitrite levels (Table 16;
p=.05). Although the meat systems containing encapsulated
acids were prepared with those inoculated with bacterial
cultures, they were held at a lower temperature (50 C) for
30 hours during incubation of the microbial treatments.
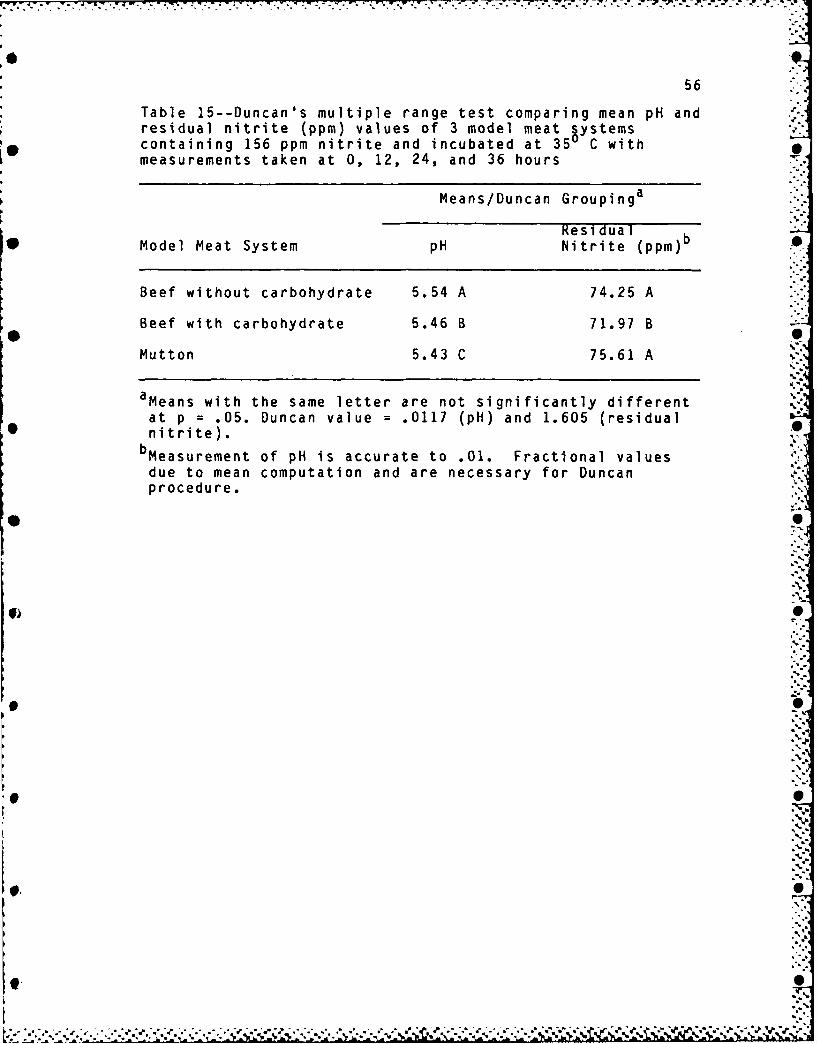
Table 15--Duncan's multiple range test comparing mean pH andresidual nitrite (ppm) values of 3 model meat systemscontaining 156 ppm nitrite and incubated at 350 C withmeasurements taken at 0, 12, 24, and 36 hours
Means/Duncan Groupinga
ResidualModel Meat System pH Nitrite (ppm)b
Beef without carbohydrate 5.54 A 74.25 A
Beef with carbohydrate 5.46 B 71.97 B
Mutton 5.43 C 75.61 A
aaMeans with the same letter are not significantly different
at p = .05. Duncan value = .0117 (pH) and 1.605 (residualnitrite).
bMeasurement of pH is accurate to .01. Fractional values
due to mean computation and are necessary for Duncanprocedure.
Table 16--Duncan's multiple range test comparing meanresidual nitrite for bacterial and chemically acidifiedtreatments in 3 model meat aystems containing 156 ppmnitrite and incubated at 35 C with measurements taken at 0,12, 24, and 36 hours
Mean Residual Nitrite (ppm)g/Duncan Groupinga
Beef with Beef withoutTreatment Carbohydrate Carbohydrate Mutton
Controlh (uninoc) 72.88 68.38 80.75
glucono delta lactone 121.75 A 126.38 B 117.38 A
lactic acid (encap.) 117.00 B 128.38 A 117.75 A
Beef MRS 3-3 79.25 C 80.88 C 80.88 B
Mutton MRS 4-1 68.50 D 75.00 D 75.25 C
Mutton LBS 10-4 68.00 D E 75.12 D 75.13 C
Lactobaci l lusleichmannii 'b 67.00 F 44.50 K 68.88 E
Mutton MRS 5-5 65.00 G 61.88 I 71.50 DBeef LBS 1-3 64.25 G 69.63 E 71.63 DStreptococcus
bfaecium 62.63 H 67.00 F 62.00 H I
Pediococcuspentosaceusc 60.75 1 67.50 F 61.50 1
0 Streptococcusffa eca Iis 60.38 I J 65.38 G 63.88 G
Lactobaci l1 usplantarume 60.00 I J 64.00 H 67.00 F
Pedi ococcuscerevisiaed 58.75 K 66.00 G 62.63 H
Beef LBS 3-2 55.63 L 57.13 J 59.38 J
l,1
• .o .- * V -. - * • V . • - - * * • - .~ . . % •-•. * - •- • - I- • ** • • i P. . ,
58
Table 16--cont.
,* aMeans with the same letter are not significantly different
at p = .05. Duncan value = .8437.bATCC
CTrumark Inc.
* dChr. Hansen's Laboratory, Inc.
' eABC Research Corp.
fpork isolate
gAnalysis for nitrite is accurate to 1 ppm. Fractionalvalues are due to mean computation (8 data points) and arenecessary for Duncan procedure.
hNot given a Duncan grouping since not included in analysis
of variance.
IN?
-4,
I'
59
Table 17--Terminal pH and residual nitrite values forbacterial and chemically acidified treatments in model meat
Ob systems containing 156 ppm nitrite, taken after 36 hoursincubation at 35 C
Model Meat System
Beef with Beef withoutCarbohydrate Carbohydrate Mutton
aTaken at time of inoculation dChr. Hansen's Lab., Inc.
bATCC eABC Research Corp.
CTrumark Inc. fpork isolate
,V.•
* .'-- i'-' 9.: -'..,.--. V J:: <
.-. .. ._
.41
60
Table 18--Duncan's multiple range test comparing mean pHvalues for bacterial and chemically acidified treatments in3 model meat systems containing 156 ppm nitrite andincubated at 350 C with measurements taken at 0, 12, 24, and36 hours
Mean pHg/Duncan Groupinga
Beef with Beef withoutTreatment Carbohydrate Carbohydrate Mutton
Controlh (uninoc.) 5.7413 5.7275 5.6775
41 Beef MRS 3-3 5.6800 A 5.6800 A 5.6625 B
glucono delta lactone 5.6475 B 5.6575 C 5.6725 A
lactic acid (encap.) 5.6425 B 5.6650 B 5.6700 A
Mutton MRS 4-1 5.4700 C 5.5600 D 5.4688 C
Mutton LBS 10-4 5.4500 D 5.4913 H 5.4350 DStreptococcusfaecalisf 5.4375 E 5.5288 F 5.3675 F
Beef LBS 1-3 5.4163 F 5.5150 G 5.3450 G
* Mutton MRS 5-5 5.3913 G 5.4725 1 5.3750 E
Lactobacillusleichmanniib 5.3700 H 5.5500 E 5.3263 H
Lactobacillusplantarume 5.3638 I 5.4300 L 5.3625 F
Streptococcusfaecium 5.3388 J 5.5250 F 5.2550 K
Pediococcuspentosaceusc 5.3200 K 5.4700 1 J 5.2688 I
Beef LBS 3-2 5.2900 L 5.4425 K 5.2650 1 J
Pediococcus
cerevisiaed 5.2550 M 5.4675 J 5.2675 I J
iI'
bI4':
61
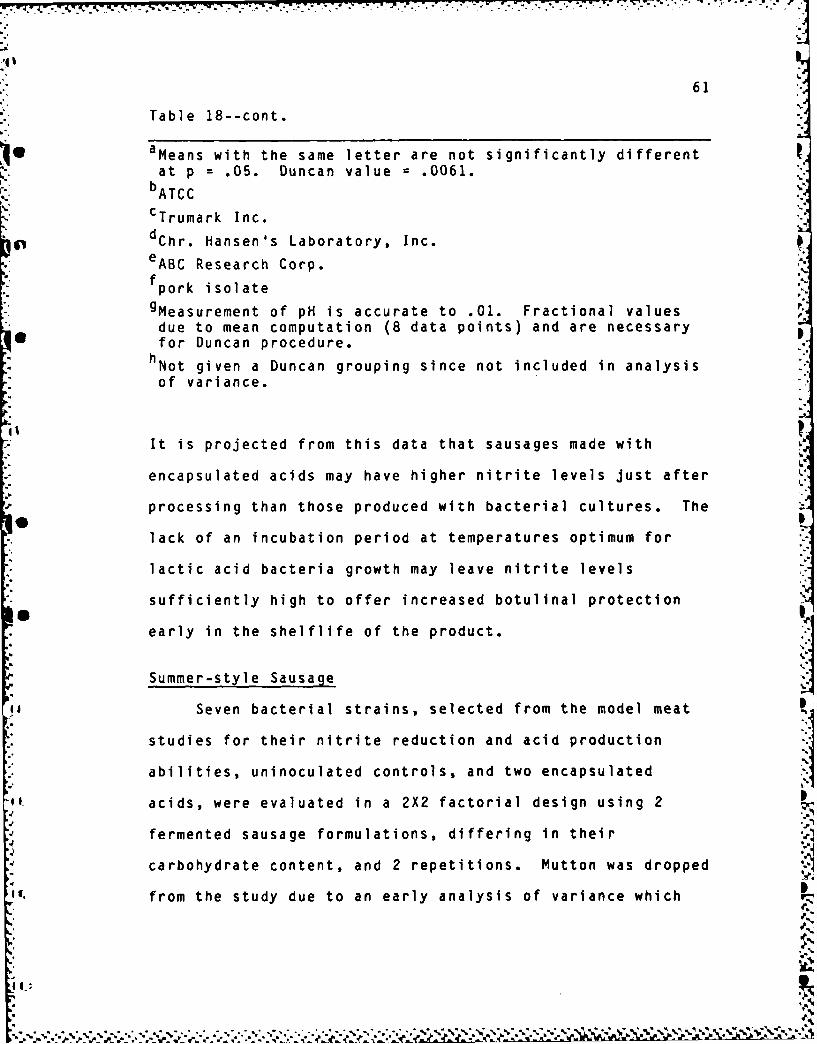
Table 18--cont.
aMeans with the same letter are not significantly differentat p = .05. Duncan value = .0061.
bATCC
CTrumark Inc.
dChr. Hansen's Laboratory, Inc.
eABC Research Corp.
fpork isolate
gMeasurement of pH is accurate to .01. Fractional valuesdue to mean computation (8 data points) and are necessaryfor Duncan procedure.
hNot given a Duncan grouping since not included in analysis
of variance.
It is projected from this data that sausages made with
encapsulated acids may have higher nitrite levels just after
processing than those produced with bacterial cultures. The
lack of an incubation period at temperatures optimum for
lactic acid bacteria growth may leave nitrite levels
sufficiently high to offer increased botulinal protection
early in the shelflife of the product.
Summer-style Sausage
Seven bacterial strains, selected from the model meat
studies for their nitrite reduction and acid production
abilities, uninoculated controls, and two encapsulated Iacids, were evaluated in a 2X2 factorial design using 2
fermented sausage formulations, differing in their
carbohydrate content, and 2 repetitions. Mutton was dropped
from the study due to an early analysis of variance which
showed mutton and beef, both with added carbohydrate, were
the same in their mean pH and residual nitrite values
produced by bacterial treatments. A more precise
statistical model used after this research was complete
showed that these two model meat systems were not the same.
Analysis of variance tables for pH and residual nitrite
are shown in Appendix E, Tables 26 and 27. Since the
strains showing the best acid production and nitrite
reduction were selected for this study, the differences in
their abilities to reduce pH was found insignificant. As a
population, bacterial mean pH values were not found to be
different, nor was the variation due to added carbohydrate
level (dextrose level), time, or any and all interactions of
9these variables (Table 26).0
The variation in residual nitrite was significantly
affected by the differences in means of bacterial treatment,
added carbohydrate level, time, and all interactions (Table
27). Therefore, bacterial treatments are not all the same
in their nitrite reducing abilities even though their mean
* pH values are similar.
Nitrite depletion and pH were highly correlated (r=.95,
p=.OOO1) in the sausages containing added carbohydrate while N
only slightly less (r=.87, p=.0001) in the sausages 0
formulated without. Although the mean pH levels of
bacterial treatments was found not significant, the terminal
pH levels (Table 19) of sausages without added carbohydrate
63 !Table 19--Terminal pH and residual nitrite values forbacterial and chemically acidified treatments in 2 finishedsummer style sausage formulations containing 156 ppm nitriteand beef with and without added carbohydrate
Beef with Beef without
Carbohydrate Carbohydrate
I Nitrite Nitrite
Treatment pH (ppm) pH (ppm)
" Initial valuea 5.85 156 5.84 157
Control (uninoc.) 5.63 46 5.70 56
lactic acid (encap.) 5.15 9 5.14 10
glucono delta lactone 5.13 14 5.14 15
Beef LBS 1-3 5.24 10 5.44 16
Streptococcusf aecal1i s' 5.14 6 5.47 14
Mutton MRS 5-5 5.23 5 5.46 10
Pediococcuspentosaceusc 5.01 4 5.47 9
* Lactobacillusleichmanniib 5.00 1 5.42 11
Lactobacillusplantarum d 5.00 4 5.39 11
Beef LBS 3-2 5.03 2 5.49 15
aTaken at time of inoculationbATCC
CTrumark Inc.
dABC Research Corp.
epork isolate
-.-
Il
I"
a.!
a. , t.
• ... 4 ,. ... )...•. .......-. ." '"" " ' :' li.ii.*. Ji iiii l i ili ii
*1O°i
I._ -.°,V -T
64
fall in a range (pH 5.39-5.49) decidedly above that stated
by Kramlich et al. (1973) as acceptable for a commercial
fermented product (pH 4.8-5.0). This, combined with
may make a product containing a bacterial culture but no
added fermentable carbohydrate suspect as to its botulinal
safety.
L. leichmannii, S. faecalis (pork isolate), and beef
isolates Beef LBS 1-3 and Beef LBS 3-2, appear to have
abilities to reduce nitrite (Table 20, Fig 1) and pH (Fig.
2) similar to L. plantarum and P. pentosaceus, two p
commercial starter cultures already in use. These four
species are not currently used commercially but may be
deserving of further research, including sensory evaluation
of the products they produce.
Z!.
"%C
|(-r' ol
.- 4'!• A.
*.'* .;* .. '*!1'
1-F
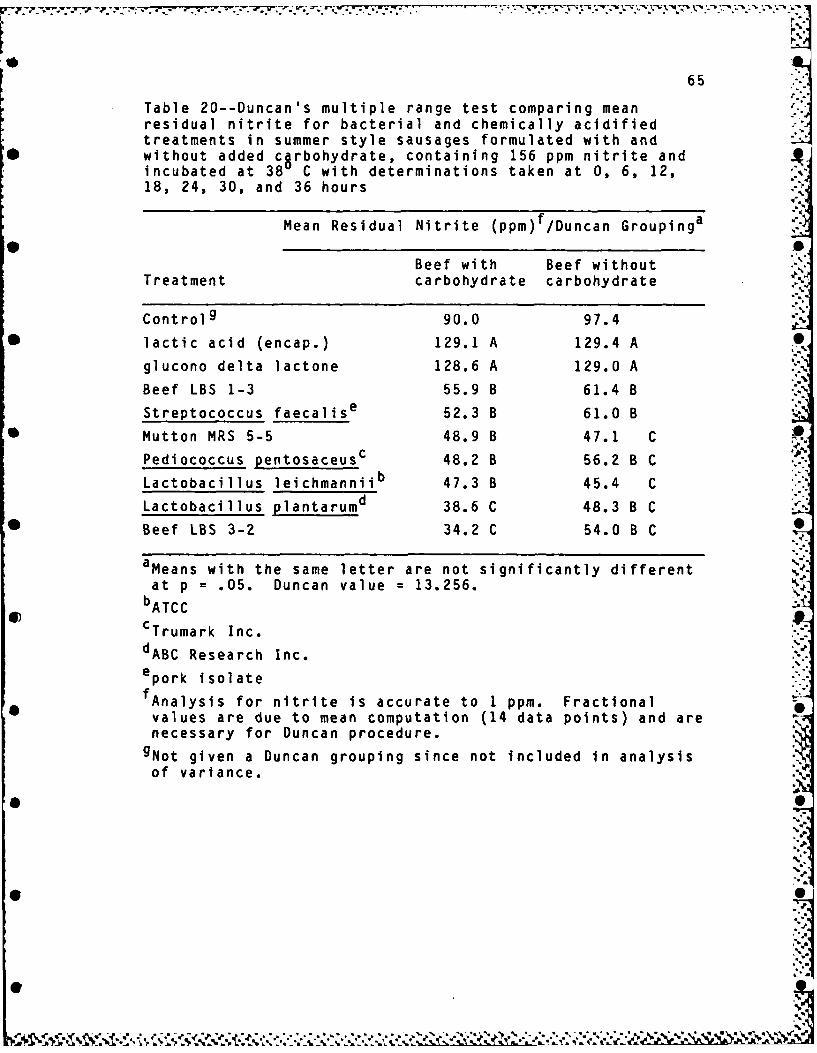
65
Table 20--Duncan's multiple range test comparing meanresidual nitrite for bacterial and chemically acidifiedtreatments in summer style sausages formulated with andwithout added cgrbohydrate, containing 156 ppm nitrite andincubated at 38 C with determinations taken at 0, 6, 12,18, 24, 30, and 36 hours
Mean Residual Nitrite (ppm) /Duncan Groupinga
Beef with Beef without .Treatment carbohydrate carbohydrate
Controlg 90.0 97.4
lactic acid (encap.) 129.1 A 129.4 A
glucono delta lactone 128.6 A 129.0 A
Beef LBS 1-3 55.9 B 61.4 B
Streptococcus faecalise 52.3 B 61.0 B
Mutton MRS 5-5 48.9 B 47.1 C
Pediococcus pentosaceusc 48.2 B 56.2 B C
Lactobacillus leichmannii 47.3 B 45.4 CdLactobacillus plantarum 38.6 C 48.3 B C
Beef LBS 3-2 34.2 C 54.0 B C
aMeans with the same letter are not significantly differentat p = .05. Duncan value = 13.256.bATCC
cTrumark Inc.
dABC Research Inc.
epork isolate
fAnalysis for nitrite is accurate to 1 ppm. Fractionalvalues are due to mean computation (14 data points) and arenecessary for Duncan procedure.
gNot given a Duncan grouping since not included in analysisof variance.
* 0
V..
J.I
Fig. 1--Nitrite d~einin summer-style sausages -inoculated with 10 bacterial cells per g of meat,"
*containing 156+I-2 ppm added nitrite and 2% added ,carbohydrate and processed at 380 C. ,
0Fig. 2 -7Changes in pH in summer-style sausages inoculatedwith 10 bacterial cells per g of meat, containing 156+/- 2ppm added nitrite and 2% added carbohydrate and processed at380 C.
0 IJ
69
* .0
InDin)
on 7
E~ 0l
a , ci// 1* 1
r - 40 '0
40 c 0 ItN of Go
Hd
70
CONCLUSION
* Nitrite depletion and acid production are affected by
the factors of time, incubation temperature, pH, and
bacterial action independent of pH. TemperatLres greater
O0 than 150 C were more effective in increasing the rate of
acid production and nitrite depletion. These rates were
also shown to increase over time.
Nitrite depletion and acid production are highly
correlated in all systems where any fermentable carbohydrate
was present to lower pH values. Decreasing pH values
enhanced significantly the rate of nitrite depletion in all
media used for bacterial growth.
In basal broth where fermentable carbohydrate was
negligible, L. leichmannii, S. faecalis, P. pentosaceus, L.
plantarum, and three atypical lactobacilli isolated from
fresh beef and mutton showed an ability to reduce nitrite
irrespective of pH. In meat systems containing no added
carbohydrate, this ability is masked by decreasing pH values
apparently due to fermentable substances naturally in the
meat.
Individual bacterial species affect the amount of
nitrite reduced through their ability to lower pH and
through a system independent of pH. When the pH levels
produced by several bacteria were statistically the same,
their rates of nitrite depletion were found to be different.
go
It
/'-.-. . , ..... :;. --'. '.,. . - N L. . -- . -. - -. . .
71
L. leichmannii and S. faecalis were inhibited somewhat
in their nitrite reduction abilities in basal broth by
carbon monoxide gas, an efficient enzyme inhibitor. These
bacteria need to be looked at more closely to determine the
exact nature of their possible nitrite reductase enzyme
systems.
Three bacterial strains not used commercially in
fermented meat products showed abilities to produce acid and
reduce nitrite as well as two starter cultures presently
used by industry. Although not subjected to sensory
evaluation, L. leichmannii, S. faecalis, and an atypical
lactobacillus isolated from beef produced summer-style
sausages with similar pH and residual nitrite levels and
should be examined for their commercial application.
72
REFERENCES
Anon. 1980. Does nitrite impart color? Meat Industry.
June: 42.
Association of Official Analytical Chemists. 1980. "Official
Methods of Analysis," 13th Ed. Washington, D.C.
Bard, J. 1977. Collaborative USDA, FDA, and AMI studies on
sodium nitrate and sodium nitrite in cured meat
products. Presented to the Expert Panel on Nitrites
Kand Nitrosamines. June 27. USDA, Washington, D.C.
Bartholomew, D.T., and Blumer, T.N. 1980. Inhibition of
6Staphylococcus by lactic-acid bacteria in
country-style hams. J. Food Sci. 45:420.
Binkerd, E.F., and Kolari, O.E. 1975. The history and use of
nitrate and nitrite in the curing of meat. Food
Cosmet. Toxicol. 13:655.
Buchanan, R.E., and Gibbons, N.E. (Ed.) 1974. "Bergey's
Manual of Determinative Bacteriology," 8th ed. The
Table 27--Analysis of variance of residual nitrite in 2fermented summer style sausage formulations composed of beefwith and without added carbohydrate
sources of variation Df M.S. F alphaa
Rep (R) 1 168.339 1.28 NSb
o Bacteria (B) 6 918.209 7.01 .005
Dextrose level (D) 1 2168.681 16.55 .005
B X D 6 392.042 3.00 .05
" Error(a) 12 131.042
6 Time (T) 6 77710.537 2616.25 .0001
- Error(b) 6 29.703
B X T 36 164.455 5.53 .0001
D X T 6 78.175 2.63 .025
B X D X T 36 64.437 2.17 .005
Error(c) 72 29.713
Corrected Total 188
asignificantly different at p .05bNot significantly different at p = .05
* -I
El, . . .. ° . .
97
VITA
Bruce L. Woodburyt
Candidate for the Degree of
Master of Science
Thesis: Effects of Lactic Acid Bacteria on Residual Nitritein a Fermented Summer Style Sausage
Major Field: Nutrition and Food Science
* Biographical Information:
Personal Data: Born at Logan, Utah, 27 April 1951, sonof LaVar D. and Lora A. Woodbury; marriedPatricia J. Berardy 11 January 1974; children--
44 Angela, Ben, and Ryan.
Education: Attended elementary and junior high schoolin Logan, Utah; graduated from Logan High Schoolin 1969; received Bachelor of Science Degree inNutrition and Food Science from Utah StateUniversity in Logan, Utah in 1976; completedU.S. Army Quartermaster Food Management Courseat the Quartermaster School, Fort Lee, Virginia in1976.
Experience: 1970-1972, completed a mission to EnglandIfor The Church of Jesus Christ of Latter-daySaints; 1976, commissioned in the Regular Army and
called to active duty as a Quartermaster Officer;1976-1984, served in several food-related
assignments including Subsistance (FoodManagement) Staff Officer and Company Commander