M E T A B O L I S M C L I N I C A L A N D E X P E R I M E N T A L 6 3 ( 2 0 1 4 ) 1 1 1 5 – 1 1 2 4
Ava i l ab l e on l i ne a t www.sc i enced i r ec t . com
Metabolism
Effects of 12 weeks high dose vitamin D3 treatment
www.metabo l i sm jou rna l . com
on insulin sensitivity, beta cell function, andmetabolic markers in patients with type 2 diabetesand vitamin D insufficiency – a double-blind,randomized, placebo-controlled trial☆,☆☆
Ulla Kampmanna,⁎, Leif Mosekildea, Claus Juhl c, Niels Moller a, Britt Christensena, d,Lars Rejnmarka, Louise Wamberg c, Lotte Orskovb
a Department of Endocrinology and Internal Medicine, Aarhus University Hospital, Aarhus, Denmarkb Department of Internal Medicine, Silkeborg Regional Hospital, Silkeborg, Denmarkc Department of Endocrinology, Sydvestjysk Hospital, Esbjerg, Denmarkd Section of Sports Science, Institute of Public Health, Aarhus University Hospital, Aarhus, Denmark
Article history:Received 14 January 2014Accepted 13 June 2014
Objectives. Vitamin D insufficiency is common in subjects with type 2 diabetes.Observational studies suggest that vitamin D plays a role in the pathogenesis of type 2diabetes. However, results of intervention studies have been inconsistent. We investigatedthe effects of improving vitamin D status on insulin sensitivity, insulin secretion, andinflammatory markers in patients with type 2 diabetes.
Materials/methods. A double blind, randomized, placebo controlled trial was conducted.Sixteen patients with type 2 diabetes and hypovitaminosis D were recruited. Eight patientsreceived colecalciferol and (280 μg daily for 2 weeks, 140 μg daily for 10 weeks) and 8patients received identical placebo tablets for 12 weeks. Before and after intervention,patients underwent IVGTT, hyperinsulinemic euglycemic clamp, assessment of baselinehigh-frequency insulin pulsatility, glucose-entrained insulin pulsatility, DXA scans,24-hour-ambulatory blood pressure monitorings, and fasting blood samples.
Results. Serum-25(OH) vitamin D and serum-1,25(OH)2 vitamin D increased significantlyafter 12 weeks in the intervention group (p = 0.01, p = 0.004). Serum-25(OH) vitamin D wasalso significantly higher in the vitamin D group compared to the placebo group (p = 0.02)after intervention. Although no significant changes in insulin sensitivity, inflammation,
Keywords:Vitamin D deficiencyHyperinsulinemic euglycemic clampInsulin pulsatilityInflammation
1116 M E T A B O L I S M C L I N I C A L A N D E X P E R I M E N T A L 6 3 ( 2 0 1 4 ) 1 1 1 5 – 1 1 2 4
blood pressure, lipid profile, or HbA1c were found, we observed borderline (p between 0.05and 0.10) improvements of insulin secretion, in terms of c-peptide levels, first phaseincremental AUC insulin and insulin secretory burst mass.
Conclusions. Improvement in vitamin D status does not improve insulin resistance, bloodpressure, inflammation or HbA1c, but might increase insulin secretion in patients withestablished type 2 diabetes.
Vitamin D deficiency is a worldwide health problem and thefinding that most organs and immune cells in the body havevitamin D receptors has provided new insights into the non-skeletal effects of vitamin D [1]. A relationship between lack ofvitamin D and development of type 1 diabetes has beenreported [2–4] and several observational studies suggest a roleof vitamin D in the pathogenesis of type 2 diabetes. In theNurse's Health Study low vitamin D intakes were associatedwith a higher risk of developing type 2 diabetes [5] and serum25OHD concentrations were inversely related to the preva-lence of diabetes in the Third National Health and NutritionExamination Survey (1988–1994) [6] as well as to insulinresistance in a smaller cross sectional study [7]. In a 10-yearprospective study an inverse association between baselineserum 25OHD and future glycemia and insulin resistance wasfound [8]. Despite supporting evidence from abundant obser-vational studies the results of intervention studies withvitamin D on glucose metabolism and other components ofthe metabolic syndrome have been inconsistent [9–22]. Theavailable trials are conducted in different settings withdifferences in subject populations, length of interventionand forms of vitamin D supplementation. In addition, moststudies have used indirect measures of insulin secretion andsensitivity (HOMA) and are unable to show relevant increasein serum 25OHD [19,23]. Most studies regarding the potentialeffects of vitamin D on glucose metabolism have examinednormal subjects or subjects with impaired glucose tolerance(IGT). Whether vitamin D has an impact on metabolic controland complications in patients with established diabetes hasnot been well addressed. It is however an area of greatimportance as many individuals with diabetes are vitamin Dinsufficient [6,23].
Also only limited and conflicting data exist concerning therelationship between vitamin D status and systemic inflam-mation in type 2 diabetes [5,12,24].
This study was designed to investigate the effects ofimproved vitamin D status on insulin sensitivity, insulinsecretion, and on inflammatory markers in vitamin Dinsufficient patients with type 2 diabetes. As vitamin D statushas been associated with plasma lipid concentrations, bloodpressure [19,22,25], and bone mineral density (BMD) [26] thesevariables were also measured.
2. Methods
The study design was a randomized, placebo-controlled,double-blind trial. Danish participants aged ≥18 years with
a diagnosis of type 2 diabetes mellitus were recruited from aprimary care and a secondary care diabetes clinic. Exclusioncriteria were as follows: Serum 25OHD level ≥50 nmol/L;serum urea >12 mmol/L; serum total calcium >2.52 mmol/L,a history of coronary infarction, sarcoidosis, malabsorption,primary hyperparathyroidism or malignancy. Women, whowere pregnant, lactating or not undertaking effectivecontraceptive measures, were also excluded. In total 192patients were screened (Fig. 1). Sixteen patients (8 men and8 women) were enrolled for 12 weeks. Subjects wereadvised to contact research staff immediately if theysuspected a reaction to the supplements and all adverseevents were recorded. To avoid sun exposure and thusdermal production of vitamin D, the intervention periodwas from December until March. Participants were notallowed to use tanning beds or to travel at latitudes below52°, where photoconversion of 7-dehydrocholesterol toprevitamin D occurs during winter months, nor were theyallowed to take vitamin D or calcium supplements duringthe intervention period, except from what was provided inthe study. The study was conducted in accordance with theHelsinki Declaration and monitored by the GCP-Unit atAarhus University Hospital. The study protocol wasreviewed and approved by the Regional Ethical Committeeand the Danish Medicines Agency and the nature andpotential risks were explained before participants gavewritten informed consent. The protocol was registered atclinicaltrials.gov (ID: NCT00812578).
A summary of the study design is depicted in Fig. 1.Recruited subjects were randomized into a treatment group ofeight (2 women, 6 men), who received oral cholecalciferol(11,200 IU (280 μg) daily for 2 weeks, followed by 5600 IU(140 μg) daily for 10 weeks) and eight patients (6 women, 2men) who received placebo (tablets identical to the cholecal-ciferol tablets in number and external appearance). Arestricted block randomization procedure was used. Fourindividuals were included in each block; two subjects wererandomly allocated to placebo, two subjects received chole-calciferol. Neither data collectors nor the laboratory staffknew the randomized group status of the participants. Theparticipants were asked to fill out a questionnaire at baselineconcerning medical conditions, medication, vitamin D andcalcium intake, sun exposure, smoking habits, and physicalactivity, and they were advised to continue their lifestyleduring the intervention period. Moreover, they wereinstructed not to change dosages of their antihypertensiveor antidiabetic medicine (insulin and/or metformin) duringthe trial.
Outcome measures were performed at baseline (immedi-ately prior to first dosing) and after 12 weeks.
Fig. 1 – Study flowdiagram. (The first figure refers to the number of patients screened in secondary care, the second figure refersthe number of patients screened in primary care.)
1117M E T A B O L I S M C L I N I C A L A N D E X P E R I M E N T A L 6 3 ( 2 0 1 4 ) 1 1 1 5 – 1 1 2 4
On the day of the study the subjects rested in bed from0700 h in a quiet, thermoneutral environment. The subjectswere studied after an overnight fast and they were fastingduring the study day. Oral antidiabetic drugs were pausedtwo days before the experiment. On the day before theexperiment the patients who were treated with insulin hadtheir usual insulin treatment replaced with short actinginsulin (Actrapid; Novo Nordisk, Bagsværd, Denmark). Anintravenous cannulawas inserted into an antecubital vein forinfusions and another intravenous cannula was inserted intoa dorsal hand vein for blood sampling. The latter wasmaintained heated, allowing for arterialized blood samplesto be drawn.
2.1. Insulin pulsatility
Baseline (nonstimulated) high-frequency insulin pulsatilitywas assessed by collection of blood samples every minute for60 min by the study procedure described previously [27].Hereafter the ability of the beta cell to sense and respond tominor glucose oscillations (entrainment) was evaluatedduring repeated punctuated glucose infusions every 10 min(pulse duration 1 min, glucose infusion rate 6 mg/kg/min) bysimilar high-frequency blood sampling for 60 min. Theresultant insulin concentration time series was analyzedby deconvolution analysis and time series analysis asdescribed below.
2.2. Deconvolution analysis
Serum insulin concentration time series were analyzed in ablinded manner by deconvolution analysis to quantitateinsulin secretory burst mass, burst amplitude, basal secretion,and interpulse interval [28,29].
2.3. Detrending
To eliminate the effects of nonstationarity in the data,approximate entropy (ApEn), spectral analysis, and autocor-relation analysis were performed on the residuals, aftersubtraction of an 11-point centered moving average process[30–32]. This length of themoving average process was chosento ensure optimal detrending.
2.4. ApEn
Regularity of insulin concentration time series during baselineand glucose-entrained conditions was assessed by ApEn [33].ApEnmeasures the likelihood that patterns repeat throughoutthe time series. Precise mathematical definition is describedelsewhere [33]. By application of a small r value (e.g. r =0.2 × SD), ApEn evaluates fine (sub) patterns in the time series,and a larger r value (e.g. r = 1.0 × SD) is applied to evaluateeven more coarse patterns [34]. A higher ApEn value indicatesa more irregular time series.
1118 M E T A B O L I S M C L I N I C A L A N D E X P E R I M E N T A L 6 3 ( 2 0 1 4 ) 1 1 1 5 – 1 1 2 4
2.5. Spectral analysis and autocorrelation analysis
The ability of glucose infusion to entrainment insulin releasewas measured by spectral analysis and autocorrelationanalysis. By spectral analysis insulin concentration timeseries is described by sinus waves of different frequencies toevaluate the magnitude of a 10-min frequency. A Turkeywindow of 25 data points was used, and spectra werenormalized, assuming that the total variance in each timeseries was 100%, enabling comparison of spectral estimatesdespite the different absolute insulin values. Autocorrelationanalysis was performed and the lag time and the maximalautocorrelation coefficient were recorded. All data analyseswere performed in a blinded manner.
2.6. Intravenous glucose tolerance test (IVGTT)
First-phase insulin secretion was assessed by an IVGTT. Abolus dose of 25 g as 50% glucose was infused within 2 minand subsequent blood samples were drawn for the analysis ofinsulin and glucose at 0, 4, 6, 8, and 10 min relative to the endof the glucose infusion. Areas under the curve (AUC)1–10 min forinsulin and peak insulin1–10 min values were calculated usingthe trapezoidal method.
2.7. Hyperinsulinemic euglycemic clamp
The IVGTT was followed by a hyperinsulinemic euglycemicclamp to assess insulin sensitivity as previously described[35]. Insulin (Actrapid; Novo Nordisk, Bagsværd, Denmark)was given from t = 30 min after the IVGTT as a continuousinfusion (1.5 mU × kg−1 × min−1) for 150 min. Plasma glucosewas clamped at 6 mmol/L by adjusting the infusion rate of20% glucose according to plasma glucosemeasurements every10 min. Steady-state plasma glucose infusion rates were usedfor estimating insulin sensitivity (M-value). Plasma glucosewas measured every 10 min in duplicate immediately aftersampling on BeckmanGlucoanalysers (Beckman Instruments,Palo Alto, CA).
2.8. Assays, DXA and APBM
Blood samples were drawn at t = −15 min. Plasma levels ofcalcium, creatinine, albumin, urea, lipids, magnesium andalkaline phosphatasewere determined by standard laboratorymeasures. Wemeasured plasma intact PTH by ELISA using anautomated instrument (Elecsys, 2010 immunoassay analyzer;RocheDiagnostics). Plasma 25-hydroxyvitaminD (25OHD)wasmeasured by an enzyme immunoassay (OCTEIA; Immunodi-agnostic Systems, Boldon, UK), using a Spectra II ELISA Reader(PerkinElmer Life and Analytical Sciences, Boston, MA). 1,25Dihydroxyvitamin D [1,25(OH)2D] was determined by a radio-immunoassay (Gamma-B 1,25-Dihydroxy Vitamin D; Immu-nodiagnostic Systems) using a Wizard 1470 Gamma Counter(PerkinElmer Life and Analytical Sciences). Insulin wasanalyzed using commercial time-resolved immuno fluo-rometric assays (TR-IFMA; AutoDELFIA, PerkinElmer, Turku,Finland), C-peptide wasmeasured by ELISA (DakoCytomation,Cambridgeshire, UK) and glucagon was determined by an in-house radioimmunoassay [36]. IL-6, IL-10 and TNF-alfa were
measured by the Human Ultrasensitive Cytokine 10-plexpanel (Invitrogen, LHC6004) on a Luminex 100 Bio-Plex system(BioRad). Serum samples were frozen immediately aftercollection and stored at −20 °C until the time of analyses.Bone mineral density (g/cm2) was measured with DXA at thelumbar spine (L1–L4) and hip using a Hologic Discovery QDR(Hologic, Waltham, MA) and ambulatory blood pressuremonitoring was performed using an Ultralite 90217-15Q(Spacelabs Medical Health Care, Issaquah, WA).
2.9. Statistical analysis
Results are expressed as mean ± SE. Data were tested fornormal distribution using the Shapiro–Wilk test. Differencesbetween study groups were assessed using a two-samplet-test or Mann–Whitney U test. To compare baseline andendpoint measures within groups we used one-sample t-testor Wilcoxon's test, as appropriate. Insulin responses toglucose stimulation were compared by area under the curve(AUC) computations. A two-tailed p-value of <0.05 wasconsidered statistically significant. Power calculations werebased on the primary endpoint namely the M-values found inthe hyperinsulinemic euglycemic clamp. The SD of the M-value has been shown to be 10% in previous studies in ourlaboratory and λ is the difference that we wished to detect, inthis case 14%. The power calculation was therefore: N =2 × 7.9 × (10/14)2 = 8. Consequently eight patients would berequired for each arm of the trial to demonstrate a significantdifference at 80% power and 5% significance.
All calculationswere carried out using SPSS version 18.0 forWindows (SPSS, Chicago, IL) and Sigma Plot version 11.0.
3. Results
One hundred and ninety-two patients with type 2 diabeteswere recruited and screened for vitamin D insufficiency(25OHD ≤50 nmol/L). Thirty-two subjects qualified for partic-ipation and of those 16 accepted to be enrolled in theintervention trial. One patient in the vitamin D group wasexcluded shortly after inclusion due to renal insufficiency. Itwas not possible to include another subject as the interventionperiod was restricted to December, January, February, andMarch. Baseline characteristics of the vitamin D and placebogroups are shown in Tables 1–3. There were no significantdifferences between the groups at baseline, apart from HbA1c(p = 0.02) and IL-10 (p = 0.04). In the vitamin D supplementedgroup serum25OHD concentrations increased in average 238%from baseline, from 31.0 ± 4.9 nmol/L at baseline to 104.9 ±19.0 nmol/L at study end as compared to a 7.8% decrease (from34.8 ± 3.8 nmol/L to 32.1 ± 3.4 nmol/L) in the placebo group(p = 0.02). 1,25(OH)2D also increased significantly in thesupplemented group from 110.0 ± 17.2 to 155.0 ± 19.3 pmol/L(p = 0.004). There were no significant changes in serum levelsof calcium, PTH, creatinine, or in hip and lumbar spine BMD.
3.1. Insulin pulsatility
The overall insulin release was mainly comparable betweenthe intervention group and the control group with similar
Table 1 – Study sample characteristics – clinical and anthropometric measures.Baseline parameters (mean and SE) and comparison of parameters in the supplementation and in the placebo group at 12 weeks.
Baseline values Changes frombaseline after3 months (deltavalues: end − baseline)
⁎ Vitamin D group versus placebo group regarding delta values.
1119M E T A B O L I S M C L I N I C A L A N D E X P E R I M E N T A L 6 3 ( 2 0 1 4 ) 1 1 1 5 – 1 1 2 4
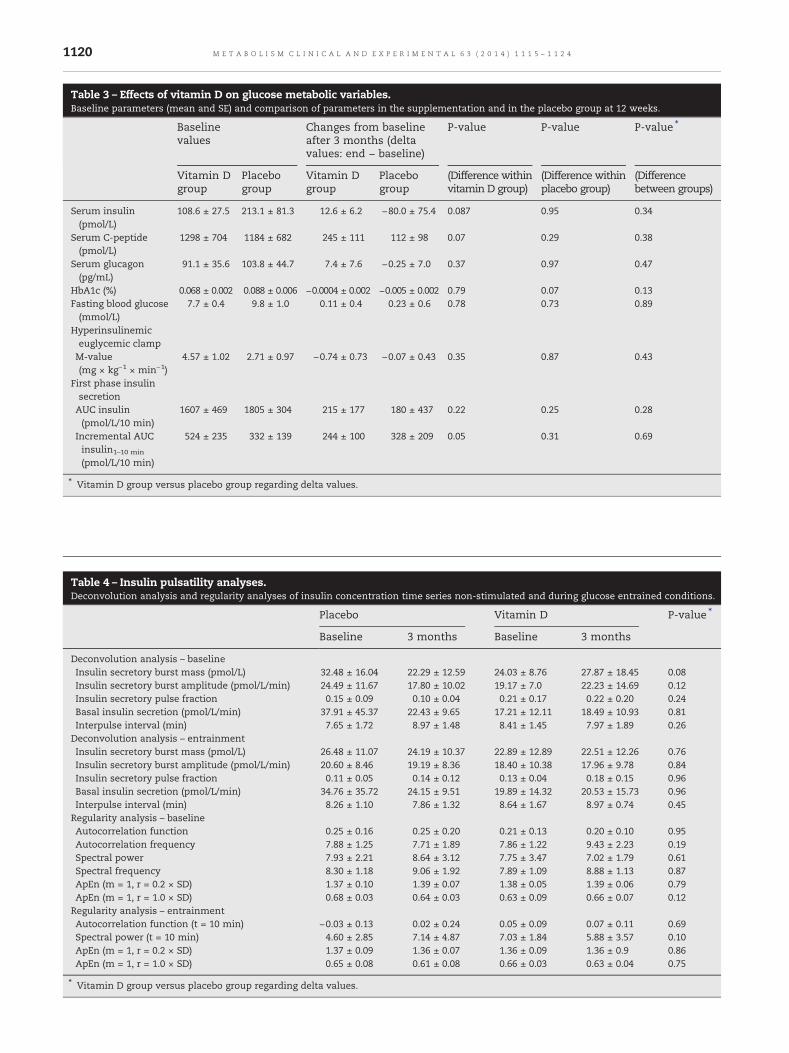
burst mass and amplitude, as well as basal secretion.However there was borderline significant increase (p =0.08) in the insulin secretory burst mass (non-stimulated)in the vitamin D supplemented group after 12 weekscompared to the placebo group, where a decrease in theinsulin secretory burst mass was observed. The regularity ofthe insulin release pattern, as assessed by approximate
Table 2 – Study sample characteristics – biochemical measuresBaseline parameters (mean and SE) and comparison of parameters in the
Base l inevalues
Changes from basafter 3 months (dvalues: end − base
Table 3 – Effects of vitamin D on glucose metabolic variables.Baseline parameters (mean and SE) and comparison of parameters in the supplementation and in the placebo group at 12 weeks.
Baselinevalues
Changes from baselineafter 3 months (deltavalues: end − baseline)
⁎ Vitamin D group versus placebo group regarding delta values.
Table 4 – Insulin pulsatility analyses.Deconvolution analysis and regularity analyses of insulin concentration time series non-stimulated and during glucose entrained conditions.
⁎ Vitamin D group versus placebo group regarding delta values.
1120 M E T A B O L I S M C L I N I C A L A N D E X P E R I M E N T A L 6 3 ( 2 0 1 4 ) 1 1 1 5 – 1 1 2 4
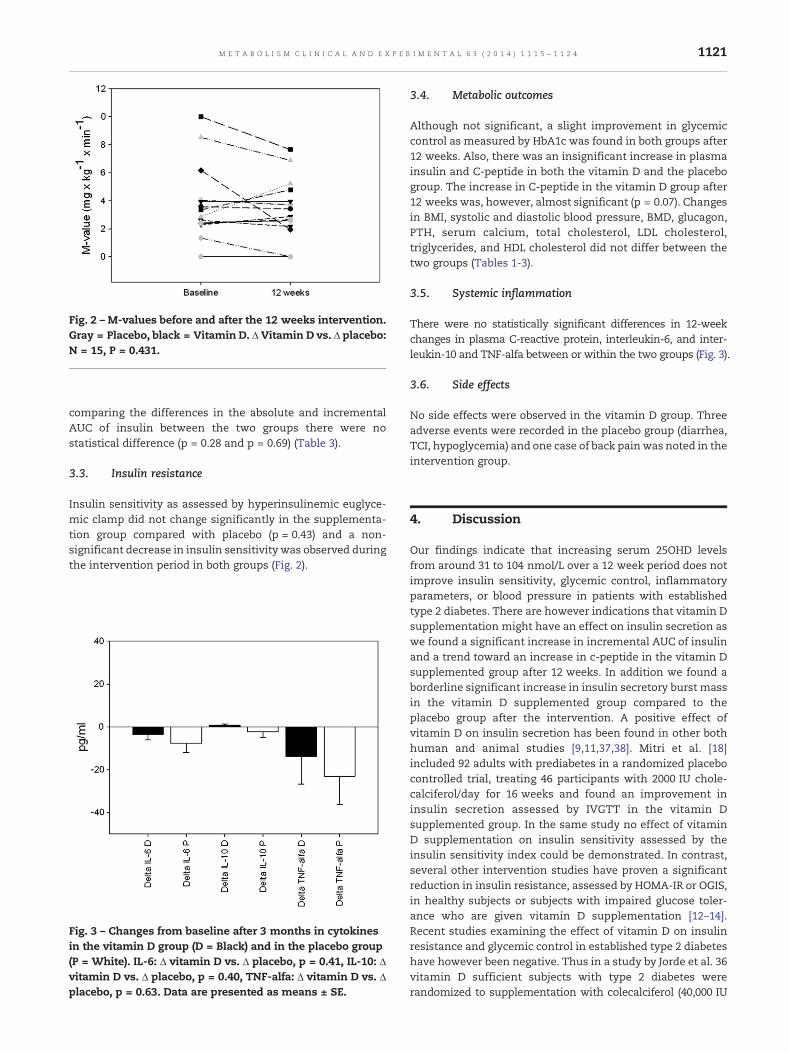
Fig. 2 – M-values before and after the 12 weeks intervention.Gray = Placebo, black = Vitamin D. Δ Vitamin D vs. Δ placebo:N = 15, P = 0.431.
1121M E T A B O L I S M C L I N I C A L A N D E X P E R I M E N T A L 6 3 ( 2 0 1 4 ) 1 1 1 5 – 1 1 2 4
comparing the differences in the absolute and incrementalAUC of insulin between the two groups there were nostatistical difference (p = 0.28 and p = 0.69) (Table 3).
3.3. Insulin resistance
Insulin sensitivity as assessed by hyperinsulinemic euglyce-mic clamp did not change significantly in the supplementa-tion group compared with placebo (p = 0.43) and a non-significant decrease in insulin sensitivity was observed duringthe intervention period in both groups (Fig. 2).
Fig. 3 – Changes from baseline after 3 months in cytokinesin the vitamin D group (D = Black) and in the placebo group(P = White). IL-6: Δ vitamin D vs. Δ placebo, p = 0.41, IL-10: Δvitamin D vs. Δ placebo, p = 0.40, TNF-alfa: Δ vitamin D vs. Δplacebo, p = 0.63. Data are presented as means ± SE.
3.4. Metabolic outcomes
Although not significant, a slight improvement in glycemiccontrol as measured by HbA1c was found in both groups after12 weeks. Also, there was an insignificant increase in plasmainsulin and C-peptide in both the vitamin D and the placebogroup. The increase in C-peptide in the vitamin D group after12 weeks was, however, almost significant (p = 0.07). Changesin BMI, systolic and diastolic blood pressure, BMD, glucagon,PTH, serum calcium, total cholesterol, LDL cholesterol,triglycerides, and HDL cholesterol did not differ between thetwo groups (Tables 1-3).
3.5. Systemic inflammation
There were no statistically significant differences in 12-weekchanges in plasma C-reactive protein, interleukin-6, and inter-leukin-10 and TNF-alfa between or within the two groups (Fig. 3).
3.6. Side effects
No side effects were observed in the vitamin D group. Threeadverse events were recorded in the placebo group (diarrhea,TCI, hypoglycemia) and one case of back painwas noted in theintervention group.
4. Discussion
Our findings indicate that increasing serum 25OHD levelsfrom around 31 to 104 nmol/L over a 12 week period does notimprove insulin sensitivity, glycemic control, inflammatoryparameters, or blood pressure in patients with establishedtype 2 diabetes. There are however indications that vitamin Dsupplementation might have an effect on insulin secretion aswe found a significant increase in incremental AUC of insulinand a trend toward an increase in c-peptide in the vitamin Dsupplemented group after 12 weeks. In addition we found aborderline significant increase in insulin secretory burst massin the vitamin D supplemented group compared to theplacebo group after the intervention. A positive effect ofvitamin D on insulin secretion has been found in other bothhuman and animal studies [9,11,37,38]. Mitri et al. [18]included 92 adults with prediabetes in a randomized placebocontrolled trial, treating 46 participants with 2000 IU chole-calciferol/day for 16 weeks and found an improvement ininsulin secretion assessed by IVGTT in the vitamin Dsupplemented group. In the same study no effect of vitaminD supplementation on insulin sensitivity assessed by theinsulin sensitivity index could be demonstrated. In contrast,several other intervention studies have proven a significantreduction in insulin resistance, assessed by HOMA-IR or OGIS,in healthy subjects or subjects with impaired glucose toler-ance who are given vitamin D supplementation [12–14].Recent studies examining the effect of vitamin D on insulinresistance and glycemic control in established type 2 diabeteshave however been negative. Thus in a study by Jorde et al. 36vitamin D sufficient subjects with type 2 diabetes wererandomized to supplementation with colecalciferol (40,000 IU
1122 M E T A B O L I S M C L I N I C A L A N D E X P E R I M E N T A L 6 3 ( 2 0 1 4 ) 1 1 1 5 – 1 1 2 4
perweek) versus placebo treatment for 6 months. No effect wasfound on glucose metabolism when assessed by HOMA andHbA1c [16]. In another study correction of vitamin D deficiencydid not have any impact on metabolic control (HbA1c), bloodpressure, lipid profile or inflammatory markers (hsCRP andferritin) in Chinese patients with type 2 diabetes [15]. Likewise,Witham et al. recently found that high-dose vitamin D3 did notimprove insulin resistance, measured by HOMA, or HbA1c inpatients with type 2 diabetes [39]. In line with these findings,Borrisova found no significant improvement in insulin sensi-tivity, assessed by HOMA-IR, in 10 females with type 2diabetes, treated with colecalciferol, 1332 IU (33.3 μg) daily forone month [11].
Themechanisms by which vitamin D deficiency and type 2diabetes might be related are not resolved. Hurst et al. reportthat there are at least two possible ways by which increasedinsulin sensitivity in response to improved vitamin D statuscould be explained: 1) suppression of chronic inflammation,and 2) increased expression of the insulin receptor and/orproteins of the insulin-signaling cascade [14]. With regards tothe positive effects of vitamin D on insulin secretion, it hasbeen propounded that vitamin D may have a direct effectthrough the binding of 1,25(OH)2vitD to the vitamin D receptorwhich is expressed in the beta cells [40,41]. Furthermore, anindirect effect of vitamin D on the pancreatic beta cell may bemediated via its regulation of calcium as secretion of insulinfrom the beta cell is a calcium dependent process [42].
Chronic low-grade inflammationandactivationof the innateimmune system are presumed to be involved in the pathogen-esis of type 2 diabetes. CRP and IL-6 are strongly related to thedevelopment of type 2 diabetes and TNF-alfa is usually elevatedin established type 2 diabetes, contributing to insulin resistance[43]. Moreover, IL-10, a major anti-inflammatory cytokine, hasbeen reported to be inversely associated with obesity, themetabolic syndrome, hyperglycemia and type 2 diabetes [44].VitaminDhas been reported tohave an immune-regulatory roleand seems to affect the innate as well as the adaptive immunesystem [45].
In the present study, we could not demonstrate any effectof vitamin D supplementation on IL-6, IL-10, TNF-alfa, or CRP.However, 4 out of 7 patients in the vitamin D group and 6 outof 8 in the placebo group received statins, which have aconsiderable anti-inflammatory effect [43]. This may havemasked an anti-inflammatory effect of vitamin D. On theother hand, inflammation might already be stimulated inestablished type 2 diabetes to such an extent, that vitamin Dsupplementation for 3 months does not have a measurableeffect. Furthermore, by the time of established type 2 diabetes,insulin resistance is presumably less reversible and thereforemore difficult to influence than in healthy or IGT subjects,where a positive effect of vitamin D on insulin sensitivity hasbeen shown [12–14]. Consequently, vitamin Dmay have a rolein improving insulin sensitivity in subjects without estab-lished diabetes mellitus but may not be effective in insulino-penic and inflammatory situations.
The present study has certain limitations. First of all, thesubjects received different anti-diabetic treatments, makingthem a heterogenous group. Even though the subjects werecorrectly randomized, there was a difference between thedistribution of men and women in the two groups (p = 0.04).
However the use of a paired design, where the subjects aretheir own controls, and the fact that the participating womenwere all postmenopausal, not receiving estrogen replacementtherapy and thereby reducing the favorable effects of estrogenon insulin and glucose homeostasis and pro-inflammatorymarkers [46], at least partly eliminates the potential effects ofthe gender difference. In addition we found no significantdifference in baseline values between men and women,regarding M-values, inflammatory markers, blood pressureor total cholesterol, HDL and LDL cholesterol (data not shown).Moreover, the placebo group had a higher HbA1c than thevitamin D group. In line with this, baseline insulin sensitivitywas higher, although not significantly, in the vitamin D groupcompared to the placebo group. This could imply, that apotential beneficial effect of vitamin D on glucosemetabolismwould be easier to detect in the vitamin D group, based on thepositive results from the studies of vitamin D replacement onglucose metabolism in subjects without diabetes. Interveningduring the winter could also imply that some of the normallyphysically active subjects were forced to lead a much moresedentary life, resulting in a decrease in insulin sensitivity.However this was the case for both study groups, but mightexplain the decrease in insulin sensitivity observed in bothgroups after intervention. Finally, the 12 week treatmentperiod might have been too short to detect an effect ofvitamin D on glucose metabolism. Hurst et al. found a trendtoward improvement in insulin sensitivity in insulin resistantSouth Asian women after 3 months treatment with vitaminD3, but no significant change was seen until 6 months [14],indicating that a prolonged treatment period may be neces-sary for a vitamin D effect to become apparent. Thisknowledge was however not available when the presentstudy was designed as the study by Hurst et al. was publishedafter the initiation of the present study.
The largest weakness of our study is the power. Asdescribed in the Method section the power calculationswere based on the M-values found in the hyperinsulinemiceuglycemic clamp and it was calculated that eight patientswould be required for each arm of the trial to demonstratea significant difference when the difference we wished todetect was 14%. Power calculations performed in retrospecthowever show that the study is underpowered as thepower was only 12.5% using the actual SD values of theM-values found in the study. Applying the observed meanand SD for the actual M-values it can also be calculatedthat 91 subjects are required in each group to detect asignificant difference.
Clamp studies are however usually small, often includingaround 10 subjects since it is a very labor intensive methodand as it has not been applied to subjects treated with highdoses of vitamin D previously there is no precedent, thatallows us to compare our results or power calculations withother studies.
To our knowledge no study has ever examined insulinpulsatility in subjects treated with high doses of vitamin D. Itwas therefore not possible to perform a power calculation toestimate how many subjects are needed to detect a possiblesignificant difference. It has however been possible to detectsignificant differences in a small number (between 10 and 14)of participants in other studies [47–49].
1123M E T A B O L I S M C L I N I C A L A N D E X P E R I M E N T A L 6 3 ( 2 0 1 4 ) 1 1 1 5 – 1 1 2 4
Our study also has several strengths. First of all the double-blind randomized controlled design is recommended bymost.To assess insulin sensitivity we used the gold standardmethod, the hyperinsulinemic euglycemic clamp, whereasmost other studies have used surrogate measures like HOMA[11–16,39]. In addition, we used advancedmethods to examinethe potential effects of vitaminD supplementation on the betacell function which has not been done previously.
Other studies examining the potential effects of vitamin Don glucose metabolism included vitamin D sufficient subjects[11,14,16], and reasonably conclude that a more pronouncedeffect of vitamin D supplementation would be expected invitamin D deficient subjects [16]. Moreover, not all studiesdemonstrate a sufficient increase in plasma 25OHD [19,23],whereas in our study, we included only vitamin D insufficientsubjects and supplementation increased vitamin D levels torecommended levels. Other studies observed an increase invitamin D levels in the placebo as well as in the interventiongroup [14], whereas we treated patients during wintertime tomaintain low vitamin D levels in the placebo group. Inaddition, calcium intake was evaluated by use of a question-naire at baseline and subjects were asked not to change theirdiet during the intervention period. Finally, to our knowledgeno other study has assessed the effects of vitamin D on IL-6,IL-10, and TNF-alfa in a randomized clinically controlled studyin patients with type 2 diabetes [14].
In conclusion, correction of vitamin D deficiency inpatients with type 2 diabetes over a period of 12 weeks doesnot improve glycemic control, insulin sensitivity, inflamma-tory parameters, or blood pressure. This is confirmed by otherintervention studies [15,16,39]. However, in line with otherstudies [9,11,18,37,38] we found that insulin secretion mightbe improved by increasing vitamin D levels significantly, inthis case above 100 nmol/L. Much larger randomized con-trolled trials are however needed to confirm the hypothesis,that vitamin D supplementation could be a possible interven-tion to improve insulin secretion and thus retard theprogression of diabetes in type 2 diabetic subjects.
Author contributions
U. K. collected, analyzed and interpreted data and wrote themanuscript. L.M. designed the study, interpreted data andwrote the manuscript. C.J. analyzed and interpreted data andwrote the manuscript. N.M. designed the study and wrote themanuscript. B.C. collected and analyzed data. L. R. interpreteddata and wrote the manuscript L.W. interpreted data andwrote the manuscript. L.O. designed the study, collected andinterpreted data and wrote the manuscript.
Funding
Thestudywassupportedby funding fromtheFOODStudyGroup/Ministry of Food,Agriculture andFisheries andMinistry of Familyand Consumer Affairs, Denmark, “Fonden af 17-12-1981”, “DenSundhedsvidenskabelige Forskningsfond, Region Midtjylland”and “Hospitalsenheden Silkeborg Forskningspulje”.
Acknowledgments
We owe great thanks to Marijke Vocks for performing the DXAscans and the ambulatory blood pressuremonitoring. Medicallaboratory technicians A Mengel and L Buus are thanked forexcellent technical assistance and we are grateful to HKampmann for her effort in recruiting the patients.
Disclosures
The authors have no conflict of interests.
R E F E R E N C E S
[1] Holick M. Diabetes and the vitamin D connection. Curr DiabRep 2008;8:393–8.
[2] Hypponen E, Laara E, Reunanen A, et al. Intake of vitamin Dand risk of type 1 diabetes: a birth-cohort study. Lancet2001;358:1500–3.
[3] The EURODIAB Substudy 2 Study Group. Vitamin Dsupplement in early childhood and risk for type 1(insulin-dependent) diabetes mellitus. Diabetologia1999;42:51–4.
[4] Stene LC, Ulriksen J, Magnus P, et al. Use of cod liver oilduring pregnancy associated with lower risk of type 1diabetes in the offspring. Diabetologia 2000;43:1093–8.
[5] Pittas AG, Dawson-Hughes B, Li T, et al. Vitamin D andcalcium intake in relation to type 2 diabetes in women.Diabetes Care 2006;29:650–6.
[6] Scragg R, Sowers M, Bell C. Serum 25-hydroxyvitamin D,diabetes, and ethnicity in the third national health andnutrition examination survey. Diabetes Care 2004;27:2813–8.
[7] Chiu KC, Chu A, Go VL, et al. Hypovitaminosis D is associatedwith insulin resistance and beta-cell dysfunction. Am J ClinNutr 2004;79:820–5.
[8] Forouhi NG, Luan J, Cooper A, et al. Baseline serum25-hydroxy vitamin D is predictive of future glycemic statusand insulin resistance: the Medical Research Council ElyProspective Study 1990–2000. Diabetes 2008;57:2619–25.
[9] Gedik O, Akalin S. Effects of vitamin D deficiency andrepletion on insulin and glucagon secretion in man.Diabetologia 1986;29:142–5.
[10] Lind L, Pollare T, Hvarfner A, et al. Long-term treatment withactive vitamin D (alphacalcidol) in middle-aged men withimpaired glucose tolerance. Effects on insulin secretion andsensitivity, glucose tolerance and blood pressure. DiabetesRes 1989;11:141–7.
[11] Borrisova AM, Tankova T, Kirilov G, et al. The effect of vitaminD3 on insulin secretion and peripheral insulin sensitivity intype 2 diabetic patients. Int J Clin Pract 2003;57:258–61.
[12] Pittas AG, Stark PC, Harris SS, et al. The effects of calcium andvitamin D supplementation on blood glucose and markersand inflammation in nondiabetic adults. Diabetes Care2007;30:980–6.
[13] Nagpal J, Pande JN, Bhartia A. A double-blind, randomized,placebo-controlled trial of the short term effect of vitamin D3
supplementation on insulin sensitivity in apparently healthy,middle-aged, centrally obese men. Diabet Med 2009;26:19–27.
[14] Von Hurst P, Stonehouse W, Coad J. Vitamin Dsupplementation reduces insulin resistance in South Asianwomen living in New Zealand who are insulin resistantand vitamin D deficient – a randomized, placebo-controlled trial. Br J Nutr 2009;103:549–55.
1124 M E T A B O L I S M C L I N I C A L A N D E X P E R I M E N T A L 6 3 ( 2 0 1 4 ) 1 1 1 5 – 1 1 2 4
[15] Luo C, Wong J, Brown M, et al. Hypovitaminosis D in Chinesetype 2 diabetes: lack of impact on clinical metabolic statusand biomarkers of cellular inflammation. Diab Vasc Dis Res2009;6:194–9.
[16] Jorde R, Figenschau Y. Supplementation with cholecalciferoldoes not improve glycemic control in diabetic subjects withnormal serum 25-hydroxyvitamin D levels. Eur J Nutr2009;48:349–54.
[17] Grimnes G, Figenschau Y, Almås B, et al. Vitamin D, insulinsecretion, sensitivity, and lipids.Diabetes 2011;60(11):2748–57.
[18] Mitri J, Dawson-Hughes B, Hu F, et al. Am J Clin Nutr 2011;94:486–94.
[19] Al-Daghri NM, Alkharfy KM, Al-Saleh Y, et al. Modest reversal ofmetabolic syndromemanifestationswithvitaminDcorrection: a12-month prospective study. Metabolism 2012;61:661–6.
[20] Pittas AG, Chung M, Trikalinos T, et al. Vitamin D andcardiometabolic outcomes: a systematic review. Ann InternMed 2010;152:307–14.
[21] Parker J, Hashmi O, Mavrodaris A, et al. Levels of vitamin Dand cardiometabolic syndrome: systematic review andmetaanalysis. Maturitas 2010;65:225–36.
[22] El-Hajj Fuleihan G. Can the sunshine vitamin melt the fat?Metabolism 2012;61:603–10.
[23] Alvarez J, Ashraf A. Role of vitamin D in insulin secretion andinsulin sensitivity for glucose homeostasis. Int J Endocrinol2010;2010:1–18 [Article ID 351385].
[24] CigoliniM, IagulliMP,MiconiV, et al. Serum25-hydroxyvitaminD3 concentrations and prevalence of cardiovascular diseaseamong type 2 diabetic patients. Diabetes Care 2006;29:722–4.
[25] Lind L, Hanni A, Lithell H, et al. Vitamin D is related to bloodpressure and other cardiovascular risk factors inmiddle-agedmen. Am J Hypertens 1995;8:894–901.
[26] Mosekilde L. Vitamin D, and the elderly. Clin Endocrinol2005;62:265–81.
[27] Pørksen N, Munn S, Steers J, et al. Pulsatile insulin secretionaccounts for 70% of total insulin secretion during fasting. AmJ Physiol 1995;269:E478–88.
[28] Veldhuis JD, Carlson ML, Johnson ML. The pituitary glandsecretes in bursts: appraising the nature of glandularsecretory impulses by simultaneous mutiple-parameterdeconvolution of plasma hormone concentrations. Proc NatlAcad Sci U S A 1987;84:7686–90.
[29] Pørksen NK, Nyholm B, Veldhuis JD, et al. In humans at least75% of insulin secretion arises from punctuated secretorybursts. Am J Physiol 1997;273:E908–14.
[30] Chatfield C. The analysis of time series. An introduction5thed. . London: Chapman and Hall; 1996.
[31] Juhl CB, Schmitz O, Pincus SM, Holst JJ, et al. Short-termtreatment with GLP-1increases pulsatile insulin secretion intype II diabetes with no effect on orderliness. Diabetologia2000;43:583–8.
[32] Juhl CB, Pørksen N, Hollingdal M, et al. Repaglinide acutelyamplifies pulsatile insulin secretion by augmentation of burstmass with no effect on burst frequency. Diabetes Care2000;23:675–81.
[33] Pincus SM. Approximate entropy as a measure of systemcomplexity. Proc Natl Acad Sci U S A 1991;88:2297–301.
[34] Pincus SM, Hartman ML, Roelfsema F, et al. Hormonepulsatility discrimination via coarse and short time-sampling. Am J Physiol 1999;277:E948–57.
[35] Tripathy D, Wessman Y, Gullstrom M, et al. Importance ofobtaining independent measures of insulin secretion andinsulin sensitivity during the same test: results with theBotnia clamp. Diabetes Care 2003;26:1395–401.
[36] Orskov H, Thomsen HG, Yde H. Wick chromatography forrapid and reliable immunoassay of insulin, glucagon andgrowth hormone. Nature 1968;219:193–5.
[37] Kadowaki S, Norman AW. Dietary vitamin D is essential fornormal insulin secretion from the perfused rat pancreas.J Clin Invest 1984;73:759–66.
[38] Cade C, Norman AW. Vitamin D3 improves impaired glucosetolerance and insulin secretion in the vitamin D-deficient ratin vivo. Endocrinology 1986;119:84–90.
[39] WithamMD, Dove FJ, DryburghM, et al. The effect of differentdoses of vitamin D3 on markers of vascular health in patientswith type 2 diabetes: a randomized controlled trial.Diabetologia 2010;53:2112–9.
[40] Johnson JA, Grande JP, Roche PC, et al. Immunohistochemicallocalization of the 1,25(OH)2D3 receptor and calbindin D28kin human and rat pancreas. Am J Physiol 1994;267:E356–60.
[41] Zeitz U, Weber K, Soegiarto DW, et al. Impaired insulinsecretory capacity in mice lacking a functional vitamin Dreceptor. FASEB J 2003;17:509–11.
[42] Sergeev IN, Rhoten WB. 1,25-Dihydroxyvitamin D3 evokesoscillations of intracellular calcium in a pancreatic beta-cellline. Endocrinology 1995;136:2852–61.
[43] Pickup JC. Inflammation and activated innate immunity inthe pathogenesis of type 2 diabetes. Diabetes Care2004;27:813–23.
[44] Scarpelli D, Cardellini M, Andreozzi F, et al. Variants of theinterleukin-10 promoter gene are associated with obesity andinsulin resistance but not type 2 diabetes in Caucasian Italiansubjects. Diabetes 2006;55:1529–33.
[45] Kamen DL, Tangpricha V. Vitamin D and molecular actionson the immune system: modulation of innate andautoimmunity. J Mol Med 2010;88:441–50.
[46] Geer EB, Shen W. Gender differences in insulin resistance,body composition and energy balance. Gend Med2009;6:60–75.
[47] Meier JJ, Pennartz C, Schenker N, et al. Hyperglycaemia isassociated with impaired pulsatile insulin secretion: effect ofbasal insulin therapy. Diabetes Obes Metab 2013;15:258–63.
[48] Juhl CB, Gjedsted J, Nielsen MF, et al. Increased action ofpulsatile compared to non-pulsatile insulin delivery during ameal-like glucose exposure simulated by computerizedinfusion in healthy humans. Metabolism 2012;61:1177–81.
[49] Hollingdahl M, Sturis J, Gall MA, et al. Repaglinide treatmentamplifies first-phase insulin secretion and high-frequencypulsatile insulin release in type 2 diabetes. Diabet Med2005;22:1408–13.