Effects of a 1080 operation on kaka and kereru survival and nestingsuccess, Whirinaki Forest Park
R.G. Powlesland1, D.E. Wills2, A.C.L. August3 and C.K. August31Science & Research Unit, Department of Conservation, P.O. Box 10 420, Wellington, New Zealand(E-mail: [email protected])2Present address: Tauranga Area Office, Department of Conservation, P.O. Box 9003, Tauranga,New Zealand3Present address: c/o Rangitaiki Area Office, Department of Conservation, P.O. Box 114, Murupara,New Zealand
__________________________________________________________________________________________________________________________________Abstract: To measure the costs and benefits of an aerial 1080 possum control operation to kereru and kaka inWhirinaki Forest Park, individuals of both species were radio-tagged from October 1998 to June 2002. Wemonitored birds in one treatment and one non-treatment study area to compare toxin-related mortality, nestingsuccess and survival. The poison operation involved the spreading of non-toxic carrot baits on 1 May 2000, andthe toxic baits on 17/18 May 2000. Possums and rats were moderately abundant in both study areas prior to thepoison operation, but afterwards few possums and rats remained in the treatment area. All radio-tagged kaka andkereru in the treatment area survived the poison operation. No radio-tagged kereru and too few radio-tagged kakabred in either study area during the 2000/01 nesting season to show whether reduced possum and rat populationswould enable the birds to nest more successfully. A reduction in possum and rat densities in the non-treatmentarea (and an increase in densities in the treatment area) during 2001/02 meant that during the second nestingseason after the poison operation, possum and rat densities were similar in the two study areas. The nesting effortand success of kaka and kereru is described for each of four nesting seasons, with the main cause of nesting failurefor both species being predation. While no radio-tagged adult male kaka died during the study, 6 females did,giving them a mean life expectancy of 9.5 years. In contrast, radio-tagged adult kereru suffered high mortality,resulting in a mean life expectancy of just 1.5 years. Predation by introduced mammalian predators was the maincause of mortality of kaka eggs, chicks, fledglings and adult females, and of kereru eggs, chicks, fledglings andadults. Effective control of introduced mammalian predators, including control by aerial 1080 operations, justbefore mast fruiting events that invariably promote prolific kaka and kereru breeding, should benefit these birdpopulations.__________________________________________________________________________________________________________________________________
IntroductionThe introduced brushtail possum (Trichosurusvulpecula) is a serious pest throughout New Zealandbecause of its detrimental impacts on indigenous forestecosystems (Department of Conservation, 1994;Atkinson et al., 1995; Cowan, 2001), and on agriculturethrough the spread of bovine tuberculosis to cattle anddeer (Livingstone, 1994; Cowan, 2001). The possum’simpacts as a folivore on native plants, including changesto the composition of some forest communities, havebeen well documented (Nugent et al., 2000; Payton,2000; Cowan, 2001). In addition, it is now recognisedthat predation by possums may be sufficiently high tohave a negative impact on the populations of somenative bird species (Brown et al., 1993; Innes, 1995;Sadleir, 2000).
Over the past 30 years the main method used toreduce possum densities over large areas has involvedaerial broadcasting of carrot or cereal baits containingsodium monofluoroacetate (compound 1080), whichcan achieve a reduction of greater than 90% inpopulations at equilibrium density (Eason et al., 1994;Morgan et al., 1997; Veltman and Pinder, 2001).Native birds, including kereru and kaka, have beenpoisoned during aerial 1080 operations (Spurr andPowlesland, 1997). Various procedures have beenimplemented to reduce the number of birds killedduring aerial 1080 operations. These include the sievingout of small fragments of bait or ‘chaff’ that birds arecapable of swallowing, dying baits green so that theyare less attractive to birds, adding cinnamon which actsas a repellent to birds but not possums, and reducingapplication rates on the assumption that it will reduce
126 NEW ZEALAND JOURNAL OF ECOLOGY, VOL. 27, NO. 2, 2003
bird-bait encounters (Harrison, 1978a, b; Morgan etal., 1986; Spurr, 1991).
Despite these procedures, dead native birds,especially North Island tomtits (Petroica macrocephalatoitoi) (Powlesland et al., 2000), have been found afterrecent aerial 1080 possum poisoning operations. As aconsequence, the aerial broadcasting of 1080 baits tocontrol possum populations by the Animal HealthBoard and Department of Conservation has comeunder increasing public scrutiny. Thus, informationwas urgently needed to measure both the costs andbenefits of such operations to non-target species. Spurrand Powlesland (1997) reviewed the status ofknowledge and research requirements regarding theeffects of aerial application of 1080 for possum controlon native birds, bats, lizards, frogs and invertebrates.Species identified in the review as highest priority forfurther research were kaka (Nestor meridionalis) andkereru (Hemiphaga novaeseelandiae). Thus, theobjective of this study, jointly funded by the Departmentof Conservation and the Animal Health Board, was tomeasure the costs (mortality during the poisonoperation) and benefits (improved adult survival andnesting success following poisoning of introducedmammalian predators) of an aerial 1080 possum poisonoperation to kereru and kaka in Whirinaki Forest Park.
Study areasOriuwaka study areaThe Oriuwaka study area was about 3000 ha, and wasthe non-treatment site (Fig. 1). Its altitude ranged from475 to 600 m a.s.l., and the topography was mainlyundulating to moderately steep. It had a nearlycontinuous cover of dense podocarp or podocarp-
hardwood forest, with dense stands of emergent rimu(Dacrydium cupressinum) on some ridges (Morton etal., 1984). Scattered kahikatea (Dacrycarpusdacrydioides), matai (Prumnopitys taxifolia) and miro(P. ferruginea) also occurred as emergents over amainly tawa (Beilschmiedia tawa) canopy. Occasionalcanopy and understorey species include hinau(Elaeocarpus dentatus), kamahi (Weinmanniaracemosa), mahoe (Melicytus ramiflorus), totara(Podocarpus totara), maire species (Nestegis spp.),red beech (Nothofagus fusca), wheki (Dicksoniasquarrosa) and soft tree fern (Cyathea smithii). In thegullies, valley bottoms and along roads there werepepperwood (Pseudowintera colorata), wineberry(Aristotelia serrata), kaikomako (Pennantiacorymbosa) and Dicksonia tree ferns.
Otupaka study areaThe Otupaka study area was 1880 ha within WhirinakiForest Park (Fig. 1), and was the treatment area for theaerial 1080 possum poison operation. The operationalarea consisted of 1750 ha of the Otupaka EcologicalArea, plus two additional contiguous areas of nativeforest of 500 ha in total. The two study areas (Oriuwakaand Otupaka) were separated by about four kilometresat their nearest points. The topography of the Otupakaarea was much the same as that of the non-treatmentarea, but its altitude was higher, ranging from 600 to900 m a.s.l. The forest cover of the Otupaka study areawas similar to that of the Oriuwaka study area, rimuand matai being the main emergents, with occasionalkahikatea and miro. On the ridges, kamahi, hinau,rewarewa (Knightia excelsa) and matipo (Myrsineaustralis) shared dominance in the canopy, but on theterraces tawa predominated. On some slopes above750 m a.s.l., the podocarp-hardwood forest was replacedby a mixture of rimu, miro, red beech and occasionalHall’s totara (Podocarpus hallii), emerging above amatrix of kamahi, tawari (Ixerba brexioides) andtawherowhero (Quintinia serrata) (Morton et al., 1984).Beech formed an almost continuous canopy above 840m a.s.l., the main species being red beech. Two patchesof ‘frost flat’, covered mainly in 1–2 m tall monoao(Dracophyllum subulatum), also occurred in theoperational area.
MethodsExperimental designAn unreplicated BACI (Before-After/Control-Intervention) experimental design was used to comparedifferences in the toxin-related mortality, nestingsuccess and survival of radio-tagged kaka and kereruin treatment and non-treatment study areas. The study
Figure 1. Location of the Oriuwaka (non-treatment) andOtupaka (treatment) study areas in Whirinaki Forest Park, nearMinginui.
127POWLESLAND ET AL.: 1080 EFFECTS ON KAKA AND KERERU
began in October 1998, enabling bird nesting successand survival to be monitored for 19 months (includingtwo breeding seasons) before the poison operationoccurred in May 2000. During the fortnight immediatelyafter the poison operation, the mortality of the taggedbirds was monitored intensively (birds checked every2 to 3 days). Subsequently, the nesting success andsurvival of the birds was monitored for a further 25months (again including two breeding seasons) throughto June 2002. During the 45-month long project, ratand mustelid populations were monitored concurrentlyin treatment and non-treatment study areas at 2–3month intervals, and possum populations weremonitored annually. This monitoring was carried outto determine the impact of the poison operation on thetarget species (possum), plus rats [mainly ship rats(Rattus rattus)] and mustelids (Mustela spp.), all knownto be poisoned during aerial 1080 operations (Innes etal., 1995; Murphy et al., 1999). Possums, rats andmustelids have all been recorded as predators of kaka(Moorhouse et al., 2003) and kereru (Mander et al.,1998).
Aerial 1080 operationCarrot rather than cereal baits were used in this studybecause, both kaka and kereru are more likely to eatcarrot baits; a specimen of each species has testedpositive for 1080 after being found dead followingaerial possum poison operations using carrot baits; andmany thousands of hectares of kereru and kaka foresthabitat are subjected to aerial carrot-bait operationsannually (Spurr and Powlesland, 1997). Baitpreparation and broadcasting was carried out by EproLtd., Taupo. Non-toxic pre-feed carrot baits wereaerially broadcast on 1 May 2000 at a rate of5 kg ha-1 over the 2250 ha operational area. Poison(1080 at 0.08% w/w) carrot baits (6–9 g baits) werespread at 10 kg ha-1 on 17/18 May 2000. Baits weredistributed from helicopters using differential GPS(global positioning system) to ensure baits were evenlyspread over the entire operational area, were not droppedbeyond the operational boundaries, and that sensitiveareas within the operational area were excluded. Carrotbaits were screened to remove small fragments ofcarrot, chaff weighing less than 0.5 g, prior to beingcoated with toxin. The total weight of chaff in each ofthree 1 kg samples was less than 2 g, much less than theEpro Ltd. standard of a maximum of 15 g per sample.
Bait distribution was determined along 10 lines,each line being one kilometre in length, and orientatedat right angles to the direction of the flight paths. Thelines were divided into 50 m segments, with therequirement that at least one bait be present in eachsegment. Monitoring indicated coverage of 99.5%,which was greater than the minimum coverage requiredof 95%.
Possum population indicesThe capture rate of possums in leg-hold traps (numbercaught 100 trap-nights-1) was used to provide an indexof possum abundance using the methods set out in theNational Possum Control Agencies’ national trap-catch protocol (version IV) (Warburton, 2000). Eachmonitoring session involved six trap lines being set inthe treatment and non-treatment areas, each lineconsisting of 20 Victor No. 1 traps spaced at 20 mintervals along a taped line. The randomly placed lineswere located using GPS equipment. Lure (a mixture of5 parts by weight of white flour and 1 part of icingsugar, no essence) was smeared on the tree above eachtrap, and reapplied daily if depleted. The trap lineswere operated for three fine nights, and all trappedpossums were killed and disposed of at least 10 m fromthe traps. The index of abundance (captures 100 trap-nights-1) was corrected for traps sprung without acaptive, or with a non-target capture (e.g. rats)(Cunningham and Moors, 1996). Statisticalcomparisons of trap-catch indices for the study areaswere made using the chi-square test.
Rat and mustelid population indicesThe proportion of baited tracking tunnels containingrat and mustelid foot-prints was used to provide anindex of rat and mustelid abundance (Innes et al.,1995). We assumed that there was a correlation betweenthese indices and the actual population densities, asfound by Brown et al. (1996a) for rats, but see Blackwellet al. (2002). The randomised layout and method ofoperation of the monitoring followed the protocoldeveloped by C.A. Gillies, Science and Research Unit,Department of Conservation, Hamilton, New Zealand.The layout consisted of 10 tracking-tunnel lines, eachline consisting of 10 tunnels spaced at 50 m intervals.The location, ensuring at least one kilometre betweenthe starting points of lines, and compass direction ofeach line were randomised. Each tunnel was baitedwith peanut butter at both ends and ‘set’ for one night.The next day, while removing the papers and anyremaining peanut butter, the odd numbered tunnelswere ‘re-set’ with rabbit meat in the centre of the tunneland fresh papers for mustelid monitoring inserted.These papers were collected after three nights. All 20lines in the two study areas were operatedsimultaneously. The lines were operated at three-monthly intervals, except just before (April 2000) andafter (June 2000) the May 2000 poison operation. Dataare expressed as percent ‘available’ tunnels with foot-prints; those interfered with, such as tipped over, weredeleted from analyses. The chi-square test was used tocompare rodent and mustelid indices between thestudy areas.
128 NEW ZEALAND JOURNAL OF ECOLOGY, VOL. 27, NO. 2, 2003
Capturing, marking and monitoring of kaka andkereruBoth species were captured in canopy-height mist-netrigs (Dilks et al., 1995). Kaka were attracted into mist-nets using play-back of calls of the local kaka dialect.Some females were caught in mist-nets erected a fewmetres from their nests. Kereru were attracted intomist-nets using play-back of alarm calls and the wing-flapping sounds made when birds were striking eachother during fights.
Adult kaka are sexually dimorphic, particularly inculmen length (Moorhouse et al., 1999), but kereru arenot (Clout et al., 1995). Prior to August 2001, a few ofthe tagged kereru were sexed by either observing whenthey were incubating [males incubate from late morningtill late afternoon, and females from late afternoon tilllate morning (Clout et al., 1995; Flux et al., 2001)], orby dissection if adequate remains were found followingpredation. However, after August 2001, a few smallcontour feathers were collected from each kereru atcapture so its gender could be determined from extractedDNA.
A unique, numbered metal band was fitted to eachkaka (size L) and kereru (size K). In addition, malekaka that were not radio-tagged were banded with twohalf-sized, painted metal bands to enable individualidentification. Because of their feathered legs, kereruwere individually marked with coloured leg-flags(jesses) of nylon-reinforced PVC. Transmitters werefitted to all kereru, all female kaka, and some malekaka. Two-stage Sirtrack® transmitters were attachedto the birds using a back-mounted harness design (Karland Clout, 1987). The transmitter, based on a 7PNbattery, and harness together weighed 24–29 g. Toextend battery life, the pulse rate of transmitters wasset at 20 pulses per minute, and the transmitterincorporated a duty cycle of 12 hours on/12 hours off,giving a potential field-life of 42 months. Because ofthe poor survival of the tagged kereru early in the study,lighter two-stage Sirtrack transmitters containing 3PNbatteries were attached to every second kereru fromNovember 2000 to compare the impact of transmitterweight on survival. These transmitters (20 pulsesminute-1, duty cycle of 8 h on/16 h off, a potential field-life of 21 months) and the same harness type togetherweighed c. 18 g.
We attempted to locate each radio-tagged birdonce a week to monitor survival and breeding. Findingtagged kereru and kaka involved approaching them onfoot using a radio-receiver (Telonics TR4®) and ahand-held yagi antenna (Sirtrack) until the individualwas sighted, or was known to be directly above butunsighted in a tree. Locating birds that moved severalkilometres involved radio-tracking from high-pointsor occasionally from a helicopter. During breedingseasons, accessible kereru of unknown sex were
checked both in the middle of the day and in the earlymorning. This was to ensure that nests would be foundduring incubation at any time of day, i.e. regardless ofwhether the radio-tagged bird was a male or a female.
Survival analysis was carried out on data for birdscarrying active transmitters only. Thus sightings oftagged birds whose transmitters had stopped or fallenoff were excluded from the analyses. Because kererusometimes suffer post-handling shock (Clout et al.,1995), deaths within the first fortnight after releasewere excluded from the analyses. The cause of deathof tagged birds was attributed to a particular species ofpredator only when either a predator was found feedingon a freshly killed kereru or kaka, or there was species-distinctive sign on the carcass [e.g. paired caninepunctures of size and spread consistent with that of astoat (Mustela erminea)].
When determining mean survival (life expectancy)of tagged birds that were not relocated (e.g. where thebird emigrated, the transmitter signal was not detected,or the transmitter failed), the duration of monitoringwas conservatively taken from a fortnight after releaseto when each bird was last known to be alive. Statisticalcomparisons of survivorship data for radio-taggedbirds from the two study areas or for different times ofyear were tested using a log-rank (Mantel-Haentzel)test in SPSS® (SPSS Inc., 1999)
Most nests were checked twice a week to determinewhether they were occupied. For kereru nests (platformsof twigs on branches, often in the canopy), this usuallyinvolved observing from the ground to see whetherthere was an adult or nestling in the nest. For those thatwere hidden by foliage, checks involved use of single-rope techniques to reach the nest vicinity at weekly tomonthly intervals. For kaka nests (invariably in cavitieswithin large trees), occupancy checks involveddetermining whether the signal of the radio-taggedfemale indicated she was in the cavity, or observing herentry or exit from the cavity. To determine the speciesresponsible for predation at nests, some kereru andkaka nests were monitored day and night using time-lapse video equipment (Brown et al., 1998; Lyver,2000). Alternatively, predator identity was determinedfrom sign found on recovered prey remains and aboutnests (Brown et al., 1996b). When sign was used toindicate predator identity, some doubt existed becauseof the possibility of scavenging by a different speciesfollowing predation.
ResultsPossum population indicesPossum population indices prior to the poison operationwere moderately high and similar in the two studyareas, at 27–33 captures 100 trap-nights-1 (Fig. 2).
129POWLESLAND ET AL.: 1080 EFFECTS ON KAKA AND KERERU
Monitoring during 12–16 June 2000 in the treatmentarea, following the poison operation, resulted in 4.4captures 100 trap-nights-1 (86% reduction).Subsequently, possum abundance increased graduallyin the treatment area, reaching 9.5 captures 100 trap-nights-1 by February 2002. In contrast, possumabundance declined markedly in the non-treatmentarea between February 2001 (30.8 captures 100 trap-nights-1) and February 2002 (11.5) (Fig. 2), such thatthere was no significant difference in trap-catch ratebetween the two study areas by February 2002 (χ2 =0.59 with Yates’ correction, d.f. = 1, P = 0.44).
Rat population indicesPrior to the poison operation, tracking-tunnelmonitoring indicated that rat indices in the two studyareas were similar seasonally (Fig. 3), except inSeptember 1999 when they were greater in the non-treatment area (χ2 = 11.6 with Yates’ correction, d.f. =1, P < 0.05). Immediately following the poisonoperation, indices of rat abundance in the treatmentarea declined markedly from 43% to 5%. It isnoteworthy that the only tunnel line where rats wereevident immediately after the operation was at the edgeof the operational area, and it was not until February2001 that rat footprints were recorded well within thetreatment area. Rat indices for the treatment arearemained at 11% or less for the following 21 months,but had increased to 32% by May 2002 (Fig. 3). In thenon-treatment area, rat indices were 73–76% in Juneand August 2000, and then declined to 19–36% duringNovember 2000 to August 2001. Rat indices weresignificantly greater in the non-treatment area duringJune 2000 to August 2001 (Fig. 3). However, inNovember 2001, and February and May 2002, therewas no significant difference in the rat indices betweenthe two study areas.
Mustelid population indicesIn general, mustelid population indices for the twostudy areas were low (less than 10%) (Fig. 4). Therewas no significant decline in mustelid indices for thetreatment area following the poison operation, and nosignificant difference in mustelid indices between thetwo study areas for any monitoring session (Fig. 4).
Toxin-related mortality of kaka and kereruNone of 17 radio-tagged kaka (10 male, 7 female) inthe treatment area, and 20 (9 male, 11 female) in thenon-treatment area died during the fortnight followingthe poison operation. Similarly, none of 15 radio-tagged kereru in the treatment area died after thepoison operation, but one of 11 (9.1%) died in the non-treatment area.
Figure 4. Tracking indices for mustelid abundance (% oftunnels with foot-prints) in the treatment and non-treatmentstudy areas before and after an aerial 1080 possum poisonoperation on 17/18 May 2000 in Whirinaki Forest. Bars arestandard errors for the 10 lines per study area.
Figure 2. Indices of possum abundance (captures 100 trap-nights-1) in treatment and non-treatment study areas before andafter an aerial 1080 possum poison operation on 17/18 May2000 in Whirinaki Forest. Bars are standard errors for the sixtrap lines per study area.
Figure 3. Tracking indices for rat abundance (% of tunnelswith foot-prints) in the treatment and non-treatment study areasbefore and after an aerial 1080 possum poison operation on17/18 May 2000 in Whirinaki Forest. Bars are standard errorsfor the 10 lines per study area.
130 NEW ZEALAND JOURNAL OF ECOLOGY, VOL. 27, NO. 2, 2003
Kaka nesting successCombining data for treatment and non-treatment areas,in the 1998/99 and 2001/02 breeding seasons, a largeproportion of radio-tagged female kaka nested, withnone or few nesting in the other two seasons (Table 1).At least one female was preyed upon when nestingoccurred. Nesting success (at least one nestling fledgingper nesting attempt) was similar (33–40%) for thethree seasons when nesting occurred, however themean number of fledglings per pair varied from 0.6 to1.6 (Table 1). Survival of radio-tagged fledglingsvaried between nesting seasons (Table 1), with 44%(n = 18) survival overall. Of the 19 failed nests wherethe cause was known, 13 (68.4%) were attributed topredation, of which six (31.6%) were by possums, onlyone by mustelids, and six by unidentified predators.
In the 2000/01 season, when possum and rodentpopulation indices differed significantly for the twostudy areas, there was no difference in nesting successfor kaka between the areas (non-treatment: 1 of 3 nestssuccessful, both fledglings preyed upon; treatment: 1of 2 nests successful, only fledgling preyed upon).However, sample sizes were too small to make ameaningful comparison.
Of 10 radio-tagged fledgling kaka that were founddead during 1998–2002, seven on leaving the nest
ended up on the ground and were dead within fivedays. Five of these fledglings were preyed upon andtwo died without obvious injuries. The other threewere seen in the canopy soon after fledging but werepreyed upon within three months. Of the seven thatwere preyed upon, one was being eaten by a falcon(Falco novaeseelandiae) when located, one had signconsistent with being killed by a possum, and themeagre remains of four were located in narrow cavitiesunderground suggesting they were killed by mustelids.
Kereru nesting successCombining data from both study areas, radio-taggedkereru bred only in the 1998/99 nesting season (with47% of 17 tagged birds attempting to nest) and in the2001/02 nesting season (62% of 16) (Table 2). Nestingsuccess (% of nests that fledged a chick) differedsignificantly between the two seasons; 25% in 1998/99, and 75% in 2001/02 (Fisher Exact test, P = 0.037).Also, the mean number of fledglings per pair differedmarkedly, from 0.3 in 1998/99 to 0.8 in 2001/02. Ofthe six failed nesting attempts in 1998/99, one failedwhen an adult died on the nest apparently of a naturalcause, and the other five due to unidentified predators,one during incubation and the rest during chick rearing.Of the three failed nesting attempts during 2001/02,
Table 1. Kaka nesting effort, nesting success, female mortality, and fledgling survival in Whirinaki Forest Park (combined datafor treatment and non-treatment areas) during four nesting seasons, 1998/99 to 2001/02.__________________________________________________________________________________________________________________________________
% of tagged females that nested 87% of 8 0% of 14 29% of 17 70% of 17No. of first nests 81 5 131
No. of replacement nests 2 0 5No. of females killed during nesting 1 1 2% successful nests 40% 40% 33%Mean no. of fledglings pair-1 1.6 0.6 1.1% of tagged fledglings surviving after 2 months 60% of 5 0% of 3 50% of 10__________________________________________________________________________________________________________________________________
1One nest of an untagged female found
Table 2. Kereru nesting effort, nesting success, mortality, and fledgling survival in Whirinaki Forest Park (combined data fortreatment and non-treatment areas) during four nesting seasons, 1998/99 to 2001/02.__________________________________________________________________________________________________________________________________
% of tagged birds that nested 47% of 17 0% of 26 0% of 17 62% of 16No. of first nests 71 0 0 122
No. of replacement nests 1 2No. of birds killed during nesting 0 1% successful nests 25% 75%Mean no. of fledglings pair-1 0.3 0.8% of tagged fledglings surviving after 2 months - 57% of 7__________________________________________________________________________________________________________________________________
1One nest of an untagged kereru found2Two nests of untagged kereru found, and in addition two nests were abandoned during video camera placement.
131POWLESLAND ET AL.: 1080 EFFECTS ON KAKA AND KERERU
one egg was infertile, one egg became slightly crushedagainst a branch when the nest tilted, and a chick waspreyed upon by an unidentified mammal. Four ofseven fledglings, all radio-tagged in the 2001/02breeding season, survived for more than two months.Of the three fledglings that died, two appeared to havebeen preyed upon, but the third may have died, thenbeen scavenged, since little of the soft tissues had beeneaten.
Survival of radio-tagged adult kakaTwenty-six male and 35 female adult kaka were radio-tagged during the project. For males, the monitoringperiod for individuals varied from 384 to 1392 days(mean = 911.9, SD = 212.5). No radio-tagged malekaka was found dead, and so it is not possible tocalculate their mean life expectancy. The duration ofmonitoring for individual radio-tagged females rangedfrom 15 to 1402 days (mean = 594.9, SD = 376.4).During this period there were six deaths; these occurred15, 28, 156, 616, 637 and 869 days after radio-tagging.These deaths represent a mortality rate of 0.10 per birdper year or a mean life expectancy of 9.5 years. Fourfemales died during the breeding season; two whileincubating in nest cavities [tooth punctures of theappropriate size and spacing on the remains suggestedone was killed by a stoat and one by a possum (Lyver,2000)], the remains of one female could not be retrievedfrom a cavity to determine cause of death, and thefourth was apparently preyed upon while caring forfledglings. The other two females died during the non-breeding season, one killed by an unknown predator,and the other apparently shot by a poacher. Four of thefemales were in the non-treatment area, and of the twoin the treatment area, one was found before the poisonoperation, and the other 17 months afterwards.
Survival of radio-tagged adult kereruDuring 2000/01, seven kereru were fitted with 7PNtransmitters, and another seven with the smaller 3PNtransmitters. The survival of these two groups of birdsthrough to the end of the study (June 2002) did notdiffer significantly [7PN transmitters: 2285 bird-days,1 death, mean life expectancy of 6.26 years; 3PNtransmitters: 1575 bird-days, 2 deaths, mean lifeexpectancy of 2.16 years (log-rank test, χ2 = 0.42, d.f.= 1, P = 0.52)]. Given this result, survival data for allradio-tagged kereru have been lumped for the followinganalyses.
Seventy-four kereru survived being radio-taggedfor greater than a fortnight. For the 28 kereru for whomwe were able to determine the gender, there was no biasin the sex ratio (16 male:12 female, χ2 with Yates’correction = 0.07, d.f. = 1, P = 0.79). The timeindividuals were monitored varied from 17 to 1210
days (mean = 313.2, SD = 291.8). The 74 kereru weremonitored for a total of 23 175 bird-days, during whichthere were 41 deaths; these occurred 17 to 985 daysafter being radio-tagged. These deaths represent amortality rate of 0.48 deaths per bird-year, or a meanlife expectancy of 1.55 years. Of the radio-taggedkereru that were found dead, eight died of unknowncauses, two were found being eaten by falcons, 26were apparently preyed upon (all or most of the softtissues were eaten, and remaining major bones andflight feathers were usually found in cavitiesunderground or under fallen trunks), four were takenby poachers, and one probably died of poor conditionor disease. In addition to the remains of radio-taggedkereru found, the remains of 26 non-tagged kereruwere found. The likely causes of mortality of 15 of the26 birds could not be determined because either theremains were too old or too few, but of the other 11,seven were considered to be the result of mammalpredation.
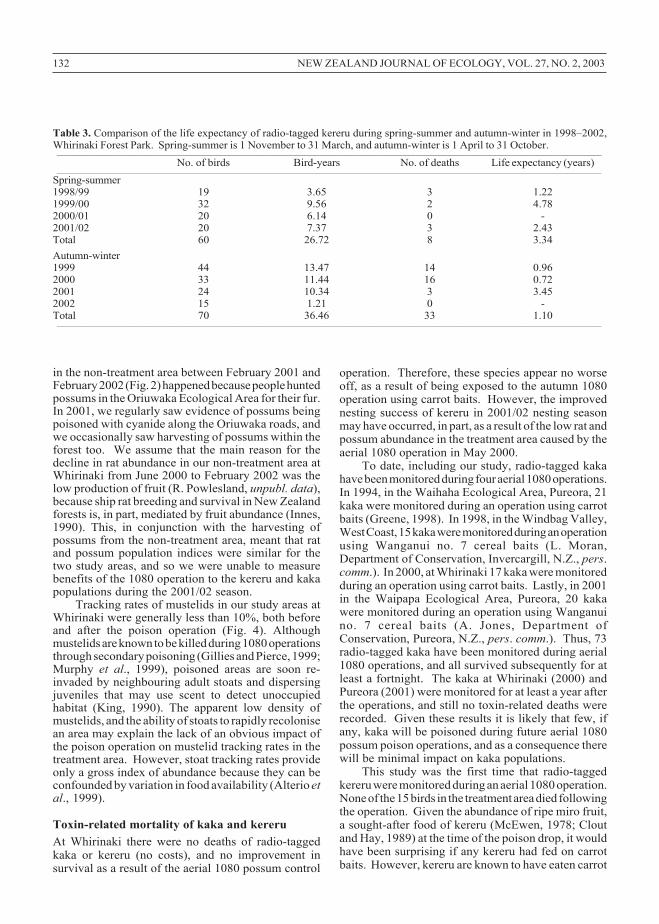
Although life expectancy differed from year toyear, overall it was significantly greater during spring-summer (3.34 years) than autumn-winter (1.10 years)(log rank test, χ2 = 6.21, d.f. = 1, P = 0.013) (Table 3).A comparison was made of the life expectancy ofradio-tagged kereru in the treatment and non-treatmentstudy areas following the poison operation (1 June2000) through to 1 March 2001. The 1 March 2001date was chosen as the end of this comparison periodbecause, following the poison operation, possum andrat indices differed significantly for the two study areasonly up until that date (Figs. 2 and 3). The mean lifeexpectancy of tagged kereru in the treatment area, at1.79 years (16 kereru, 5.37 bird-years, 3 deaths), wasnot significantly greater than that of tagged kereru inthe non-treatment area, at 1.15 years (15 kereru, 5.75bird-years, 5 deaths) (log rank test, χ2 = 0.08, d.f. = 1,P = 0.78).
DiscussionPredatory mammal population indicesThe 86% reduction in the possum population in thetreatment area following the aerial 1080 operation wastypical of results from previous poison operations(Eason et al., 1994; Morgan et al., 1997; Veltman andPinder, 2001). However, in spite of the high kill, theresidual level of 4.4% trap-catch was greater than therecommendation that possum populations be managedto <1% trap-catch to recover North Island kokako(Callaeas cinerea wilsoni) populations (Innes et al.,1999), and only just below the recommendation of<5% trap-catch to recover kereru populations (Innes etal., 2003).
We believe the decline of the possum population
132 NEW ZEALAND JOURNAL OF ECOLOGY, VOL. 27, NO. 2, 2003
Table 3. Comparison of the life expectancy of radio-tagged kereru during spring-summer and autumn-winter in 1998–2002,Whirinaki Forest Park. Spring-summer is 1 November to 31 March, and autumn-winter is 1 April to 31 October.__________________________________________________________________________________________________________________________________
No. of birds Bird-years No. of deaths Life expectancy (years)__________________________________________________________________________________________________________________________________
in the non-treatment area between February 2001 andFebruary 2002 (Fig. 2) happened because people huntedpossums in the Oriuwaka Ecological Area for their fur.In 2001, we regularly saw evidence of possums beingpoisoned with cyanide along the Oriuwaka roads, andwe occasionally saw harvesting of possums within theforest too. We assume that the main reason for thedecline in rat abundance in our non-treatment area atWhirinaki from June 2000 to February 2002 was thelow production of fruit (R. Powlesland, unpubl. data),because ship rat breeding and survival in New Zealandforests is, in part, mediated by fruit abundance (Innes,1990). This, in conjunction with the harvesting ofpossums from the non-treatment area, meant that ratand possum population indices were similar for thetwo study areas, and so we were unable to measurebenefits of the 1080 operation to the kereru and kakapopulations during the 2001/02 season.
Tracking rates of mustelids in our study areas atWhirinaki were generally less than 10%, both beforeand after the poison operation (Fig. 4). Althoughmustelids are known to be killed during 1080 operationsthrough secondary poisoning (Gillies and Pierce, 1999;Murphy et al., 1999), poisoned areas are soon re-invaded by neighbouring adult stoats and dispersingjuveniles that may use scent to detect unoccupiedhabitat (King, 1990). The apparent low density ofmustelids, and the ability of stoats to rapidly recolonisean area may explain the lack of an obvious impact ofthe poison operation on mustelid tracking rates in thetreatment area. However, stoat tracking rates provideonly a gross index of abundance because they can beconfounded by variation in food availability (Alterio etal., 1999).
Toxin-related mortality of kaka and kereruAt Whirinaki there were no deaths of radio-taggedkaka or kereru (no costs), and no improvement insurvival as a result of the aerial 1080 possum control
operation. Therefore, these species appear no worseoff, as a result of being exposed to the autumn 1080operation using carrot baits. However, the improvednesting success of kereru in 2001/02 nesting seasonmay have occurred, in part, as a result of the low rat andpossum abundance in the treatment area caused by theaerial 1080 operation in May 2000.
To date, including our study, radio-tagged kakahave been monitored during four aerial 1080 operations.In 1994, in the Waihaha Ecological Area, Pureora, 21kaka were monitored during an operation using carrotbaits (Greene, 1998). In 1998, in the Windbag Valley,West Coast, 15 kaka were monitored during an operationusing Wanganui no. 7 cereal baits (L. Moran,Department of Conservation, Invercargill, N.Z., pers.comm.). In 2000, at Whirinaki 17 kaka were monitoredduring an operation using carrot baits. Lastly, in 2001in the Waipapa Ecological Area, Pureora, 20 kakawere monitored during an operation using Wanganuino. 7 cereal baits (A. Jones, Department ofConservation, Pureora, N.Z., pers. comm.). Thus, 73radio-tagged kaka have been monitored during aerial1080 operations, and all survived subsequently for atleast a fortnight. The kaka at Whirinaki (2000) andPureora (2001) were monitored for at least a year afterthe operations, and still no toxin-related deaths wererecorded. Given these results it is likely that few, ifany, kaka will be poisoned during future aerial 1080possum poison operations, and as a consequence therewill be minimal impact on kaka populations.
This study was the first time that radio-taggedkereru were monitored during an aerial 1080 operation.None of the 15 birds in the treatment area died followingthe operation. Given the abundance of ripe miro fruit,a sought-after food of kereru (McEwen, 1978; Cloutand Hay, 1989) at the time of the poison drop, it wouldhave been surprising if any kereru had fed on carrotbaits. However, kereru are known to have eaten carrot
133POWLESLAND ET AL.: 1080 EFFECTS ON KAKA AND KERERU
baits (Spurr and Powlesland, 1997) and small pieces ofcereal baits at bait stations (R. Powlesland, unpubl.data). Also, one kereru found dead after an aerial 1080operation tested positive for the toxin (Spurr andPowlesland, 1997). Consequently, further studies ofthe survival of kereru during aerial 1080 operations arewarranted, as is an investigation of when kereru arelikely to switch from eating natural foods to baits.
Kaka nesting successThere are three results of note from our study of kakanesting. First was the annual variation in nesting effort,from no nesting in 1999/00 to most females nesting in1998/99 and 2001/02 (Table 1). A feature of the yearswhen most female kaka nested was the abundant cropson mast-fruiting podocarp species; kahikatea in 1998/99 and rimu in 2001/02.
Secondly, the poor breeding success of kaka atWhirinaki, both at the nest and fledgling stages (Table1), is similar to results for other sites where there wasno control of introduced mammalian predators (Wilsonet al., 1998; Moorhouse et al., 2003). Not only was ahigh proportion of eggs, chicks and fledglings preyedupon at Whirinaki, but more seriously some nestingfemales were killed as well.
The third feature was the impact of possums onkaka nesting. Video footage was obtained of a possumeating a brood of kaka nestlings. In addition, sign onegg shells and carcasses indicated that possums wereresponsible for predation of eggs, nestlings, fledglingsand an incubating female. While in South Island beechforests stoats have been considered the main kakapredator (Wilson et al., 1998), results from our studyand others (Veltman, 2000) suggest that in some otherforest types possums may be a critical threat to kakaconservation. Although just one of 13 failed nestingattempts at Whirinaki was attributable to mustelids,six were considered to be the direct result of possumpredation. This finding is in line with the growingweight of evidence that possums prey on the eggs andnestlings of a variety of forest bird species (Brown etal., 1993, 1996b; Garnett et al., 1999; Sadleir, 2000;Innes et al., 2003).
In addition, there is evidence that possums mayaffect kaka at the population level. Following theeradication of possums from Kapiti Island, there wasa marked increase in kaka abundance (H.A. Robertsonand A.J. Beauchamp, in Moorhouse and Greene, 1998;Veltman, 2000). Similarly, kaka abundance was muchgreater in West Coast forests where possums wereabsent, or where possums had been present for lessthan 10 years and were at low density compared towhere possums had been present for 10 or more yearsand were at moderate to high density (Veltman, 2000).Likewise, Powlesland et al. (1999) found that veryhigh kills of possums and rats greatly improved robin
(Petroica australis) nesting success, resulting in greaternumbers and a greater proportion of females beingpresent one year after the operation than before it.
Few kaka bred in the 2000/01 nesting season andso no such benefit could be detected for the kakapopulation at Whirinaki following the 1080 operation.Also populations of the two main kaka predators,possums and stoats, remained too high after theoperation, and/or the treatment area was too small,enabling mustelids to re-colonise within a few months.Moorhouse et al. (2003) found that intensive on-goingpossum and stoat control was required to enhance kakanesting success and female survival. We believeenhanced kaka nesting success, and potentially kakapopulation recovery, is possible following aerial 1080poisoning operations if they are carried out over largeareas (5000+ ha) just before kaka start breeding(November), in years when mast-fruiting of a podocarpis expected.
Kereru nesting successKereru nesting at Whirinaki coincided with mast fruitingof podocarps during the summer-autumn periods of1998/99 and 2001/02. Little or no nesting occurredduring the same periods in the intervening years whenthere was little fruit present. Similarly, Clout et al.(1995) found that no or few kereru nested when littlefruit was available in summer at Nelson and HawkesBay. Even though ample food was available atWhirinaki during 1998/99 (mast fruiting of kahikatea)and 2001/02 (mast fruiting of rimu), only 47% and62% of the radio-tagged kereru were found nesting(Table 2). It is likely that a greater proportion of taggedkereru did nest, particularly during 1998/99, but that afew nests went undetected before their contents werepreyed upon as some birds were checked at onlyweekly intervals.
The significant difference in nesting successbetween 1998/99 (25%) and 2001/02 (75%) is of note.Previous studies of kereru at five mainland sites withoutpredator control have indicated that few nestingattempts were successful, varying from 0 to 22%(Clout et al., 1995; Pierce and Graham, 1995; Innes etal., 2003). Therefore, it is the 2001/02 Whirinaki resultthat is at variance with the norm. Presumably thisoccurred because possum and rat indices for bothstudy sites were less than 12% for much of the 2001/02 breeding season (November-June) (Figs. 2 and 3).Similarly, the results from two mainland studies haveshown that when both possum and rat populationswere reduced to low densities (< 5%), kereru nestingsuccess improved dramatically; 0 to 100% at Motatau(Innes et al., 2003), and 0 to 45% at Wenderholm(Clout et al., 1995).
134 NEW ZEALAND JOURNAL OF ECOLOGY, VOL. 27, NO. 2, 2003
Survival of radio-tagged adult kaka and kereruThe relatively poor survival of radio-tagged femalekaka compared to males at Whirinaki has been foundfor other populations of kaka where predators were notcontrolled (Moorhouse et al., 2003), and is consistentwith records of unmanaged populations where thereare more males than females (Greene and Fraser,1998). Predation of nesting females has been suggestedas the cause of this sex imbalance (Wilson et al., 1998;Moorhouse et al., 2003) because only females entercavities to incubate eggs and brood chicks.
The significantly shorter life expectancy of radio-tagged kereru at Whirinaki during autumn-winter thanin spring-summer was related to predation associatedwith eating miro fruit and feeding among low shrubs.In early autumn each year, ripe miro fruit usuallybecame available. It is much sought after by kereru atWhirinaki, as elsewhere (McEwen, 1978; Clout andHay, 1989). Although kereru are not particularlyvulnerable to mammalian predators while feeding onmiro fruit in the canopy, a diet of mainly miro fruitresults in kereru getting thirsty. It is when they drinkat puddles and streams that they become vulnerable topredation by stoats and feral cats (Felis catus). EarlyMaori were also well aware that kereru feeding on mirofruit needed to drink regularly, and snared large numbersat such sites or by providing water in specially madetroughs, called whaka-kereru, surrounded by snaressited in the canopy (Best, 1942). Once fruit sourceshave been exhausted in autumn, kereru in many areassubsist on foliage during winter and spring (McEwen,1978; Clout and Hay, 1989). Some of the foliagesources they fed on at Whirinaki were understoreyshrubs less than three metres tall, and seedlings andshrubs less than a metre tall along roadsides. Theselow feeding sites again enabled cats and stoats toambush kereru, with such an incident between a catand a kereru at Whirinaki being seen (D. Wills, pers.obs.).
Given their relatively large size (c. 600 g) and slowreproductive rate (1-egg clutch, not breeding everyyear), kereru would be expected to have a longevity of20–30 years. The closely-related parea (Hemiphagachathamensis) had an annual survival rate of 0.96 andmean life expectancy 24.5 years when feral cats andpossums were intensively controlled (Grant et al.,1997). In comparison, the mean life expectancy of1.55 years of kereru in Whirinaki is similar to that ofkereru at mainland sites without predator control: 5.4years (Pelorus Bridge, Marlborough ), 1.9 years (MohiBush, Hawkes Bay), 5.5 years (Wenderholm,Auckland), and 1.2 years (Whangarei, Northland)(Clout et al., 1995; Pierce and Graham, 1995).
The mean mortality rate of 0.48 deaths per bird-year at Whirinaki is not compensated by a greater meanproductivity rate of 0.29 fledglings following pest
control. This productivity rate does not take into accountthe absence of breeding during two years, and the highmortality of radio-tagged fledglings in 2001/02. Thesefigures clearly suggest the population is in decline.Given the significant increase in kereru populations atseveral mainland sites following intensive and sustainedcontrol of introduced mammalian predators [TeUrewera (Jones, 2000); Trounson Kauri Park (Coad,2001); Motatau Forest (Innes et al., 2003); WaipapaEcological Area, Pureora (H. Speed, Department ofConservation, Auckland, N.Z. and A. Holzapfel,Department of Conservation, Hamilton, N.Z., pers.comm.)], a similar response could be expected atWhirinaki with an appropriate predator control regime.However, whether management for kereru conservationin Whirinaki is started or not, it would be prudent tomonitor the status of the population over several yearsusing the distance sampling method (Buckland et al.,2001), as has been carried out in the Waipapa EcologicalArea, Pureora (T.C. Greene, Department ofConservation, Christchurch, N.Z., pers. comm.), toensure numbers do not decline to such a critically lowlevel that local extinction is inevitable.
To maximise the benefits of an aerial 1080operation for as many forest bird species as possible itwould be important to identify the priority speciesfrom the outset. If kaka and kereru at a central NorthIsland site were the priority, then low populationdensities of mammalian predator species would berequired during their entire four-month long breedingcycle (December-March) because of the vulnerabilityof kaka and kereru eggs, nestlings and fledglings topredation. As evident from this study, and particularlyanother at Pureora Forest Park (Powlesland et al.,1999), when large areas are involved (several thousandha), possum and rodent densities in the core of thetreatment area often remain low for several monthsafter an aerial 1080 operation. This can result insignificant improvement to the nesting success andrecruitment of forest passerines, such as robins(Petroica australis) (Powlesland et al., 1999), thatregularly produce two, and sometimes three, broodsper breeding season. However, although mostinsectivorous forest passerines start nesting inSeptember, if the priority is to maximise the productivityof kaka and kereru, it would be better to conduct thepoison operation in late October or early November.This would ensure that mammalian predatorpopulations remain low for as long as possible giventhe vulnerability of kaka and kereru fledglings tomustelids, and possibly also to cats and possums.Under such a regime, passerine populations would stillbenefit, but only during the second half of their nestingseason.
In conclusion, introduced mammalian predatorswere the main cause of kaka and kereru mortality,
135POWLESLAND ET AL.: 1080 EFFECTS ON KAKA AND KERERU
including the loss of eggs, chicks, fledglings andadults. The losses were such that it is likely that bothkereru and kaka populations in Whirinaki Forest are indecline (Moorhouse et al., 2003; this study). Aerial1080 operations carried out just before kaka and kererustart breeding (normally in November for North Islandpodocarp forests) that result in low density populationsof possums (< 5% residual trap catch (Warburton,2000)), rats (< 5% of tracking tunnels tracked), andstoats (< 0.5 per 100 trap-nights or < 5% of trackingtunnels tracked) in years of podocarp mast fruitingwould greatly benefit both kaka and kereru populationsthrough improved nesting success and fledglingsurvival. Such benefits were not demonstrated in thisstudy because the 1080 operation occurred in a non-mast fruiting year when little breeding occurred.However, this study did not detect any toxin-relatedmortality of kereru and kaka. A repeat study of anaerial 1080 operation over a large area (5000+ ha) justprior to mast-fruiting of a podocarp species isrecommended to assess the toxin-related mortality ofkereru, and to better determine the benefits of suchoperations to kaka and kereru breeding and survival.
AcknowledgementsWe thank the staff of the Rangitaiki Area Office of theDepartment of Conservation for the tremendous supportthey provided to the project, in particular John Sutton,Andy Blick and Rod Warne; to the kaumatua andrunanga of Ngati Whare, the kaumatua of NgatiManawa, and the tangata whenua of Whirinaki ForestPark for endorsement of the aerial 1080 possum controloperation and interest in the project; to Claudia Gerich,Daniela Hoth and Rebecca Lander for assistance withthe field work; to Fletcher Challenge Forests for accessalong their roads in order to locate and check on somebirds that dispersed into their exotic plantations; tomembers of the Kaka Research Group of the Departmentof Conservation for advice and loan of equipment,particularly Terry Greene, Ron Moorhouse, Peter Dilks,Alan Jones and Les Moran; to Terry Greene, Rod Hay,Don Newman and Clare Veltman for improvements toearly drafts of this paper, and to journal referees (KerryBrown, John Innes) for further improvement of thetext.
ReferencesAlterio, N.; Moller, H.; Brown, K. 1999. Trappability
and densities of stoats (Mustela erminea) and shiprats (Rattus rattus) in a South Island Nothofagusforest, New Zealand. New Zealand Journal ofEcology 23: 95-100.
Atkinson, I.A.E.; Campbell, D.J.; Fitzgerald, B.M.;Flux, J.E.C.; Meads, M.J. 1995. Possums andpossum control: effects on lowland forestecosystems. A literature review with specificreference to the use of 1080. Science forConservation 1. Department of Conservation,Wellington, N.Z.
Best, E. 1942. Forest lore of the Maori, with methodsof snaring, trapping, and preserving birds andrats, uses of berries, roots, fern-root, and forestproducts, with mythological notes on origins,karakia used etc. Government Printer, Wellington,N.Z.
Blackwell, G.L.; Potter, M.A.; McLennan, J.A. 2002.Rodent density indices from tracking tunnels,snap-traps and Fenn traps: do they tell the samestory? New Zealand Journal of Ecology 26: 43-51.
Brown, K.; Innes, J.; Shorten, R. 1993. Evidence thatpossums prey on and scavenge birds’ eggs, birdsand mammals. Notornis 40: 169-177.
Brown, K.P.; Moller, H.; Innes, J.; Alterio, N. 1996a.Calibration of tunnel tracking rates to estimaterelative abundance of ship rats (Rattus rattus) andmice (Mus musculus) in a New Zealand forest.New Zealand Journal of Ecology 20: 271-275.
Brown, K.P.; Moller, H.; Innes, J. 1996b. Sign left bybrushtail possums after feeding on bird eggs andchicks. New Zealand Journal of Ecology 20: 277-284.
Brown, K.P.; Moller, H.; Innes, J.; Jansen, P. 1998.Identifying predators at nests of small birds in aNew Zealand forest. Ibis 140: 274-279.
Buckland, S.T.; Anderson, D.R.; Burnham, K.P.; Laake,J.L.; Borchers, D.L.; Thomas, L. 2001.Introduction to distance sampling: estimatingabundance of biological populations. OxfordUniversity Press, Oxford, U.K.
Clout, M.N.; Hay, J.R. 1989. The importance of birdsas browsers, pollinators and seed dispersers inNew Zealand forests. New Zealand Journal ofEcology 12 (supplement): 27-33.
Clout, M.N.; Karl, B.J.; Pierce, R.J.; Robertson, H.A.1995. Breeding and survival of New Zealandpigeons Hemiphaga novaeseelandiae. Ibis 137:264-271.
Eason, C.T.; Frampton, C.M.; Henderson, R.; Thomas,M.D.; Morgan, D.R. 1994. Sodiummonofluoroacetate and alternative toxins forpossum control. New Zealand Journal of Zoology20: 329-334.
Flux, I.A.; Powlesland, R.G.; Dilks, P.J.; Grant, A.D.2001. Breeding, survival, and recruitment ofChatham Island pigeon (Hemiphagachathamensis). Notornis 48: 197-206.
Garnett, S.T; Pedler, L.P.; Crowley, G.M. 1999. Thebreeding biology of the Glossy Black-cockatooCalyptorhychus lathami on Kangaroo Island,South Australia. Emu 99: 262-279.
Gillies, C.A.; Pierce, R.J. 1999. Secondary poisoningof mammalian predators during possum and rodentcontrol operations at Trounson Kauri Park,Northland, New Zealand. New Zealand Journalof Ecology 23: 183-192.
Grant, A.D.; Powlesland, R.G.; Dilks, P.J.; Flux, I.A.;Tisdall, C.J. 1997. Mortality, distribution, numbersand conservation of the Chatham Island pigeon(Hemiphaga novaeseelandiae chathamensis).Notornis 44: 65-77.
Greene, T.C. 1998. The effects of compound 1080 onpopulations of specific non-target species,Waihaha Ecological Area, Pureora Forest Park,winter 1994. Science for Conservation 69.Department of Conservation, Wellington, N.Z.
Greene, T.C.; Fraser, J.R. 1998. Sex ratio of NorthIsland kaka (Nestor meridionalis septentrionalis),Waihaha Ecological Area, Pureora Forest Park.New Zealand Journal of Ecology 22: 11-16.
Harrison, M. 1978a. The use of poisons and their effecton birdlife. In: Anon. (Editor), Proceedings of theseminar on the takahe and its habitat, pp. 203-211. Fiordland National Park Board, Invercargill,N.Z.
Harrison, M. 1978b. 1080. Wildlife – A Review 9: 48-53.
Innes, J.G. 1990. Ship rat. In: King, C.M. (Editor), Thehandbook of New Zealand mammals, pp. 206-225. Oxford University Press, Auckland, N.Z.
Innes, J. 1995. The impacts of possums on nativefauna. In: O’Donnell, C.F.J. (Compiler), Possumsas conservation pests, pp. 11-15. Department ofConservation, Wellington, N.Z.
Innes, J.; Warburton, B.; Williams, D.; Speed, H.;Bradfield, P. 1995. Large-scale poisoning of ship
rats (Rattus rattus) in indigenous forest of theNorth Island, New Zealand. New Zealand Journalof Ecology 19: 5-17.
Innes, J.; Hay, R.; Flux, I.; Bradfield, P.; Speed, H.;Jansen, P. 1999. Successful recovery of NorthIsland kokako Callaeas cinerea wilsonipopulations, by adaptive management. BiologicalConservation 87: 201-214.
Innes, J.; Nugent, G.; Prime, K.; Spurr, E. 2003.Responses of kukupa and other birds to mammalianpest control at Motatau, Northland. New ZealandJournal of Ecology (in press).
Jones, G. 2000. Five-minute bird count surveys. In:Beaven, B.; Burns, B.; Harrison, A.; Shaw, P.(Editors), Northern Te Urewera ecosystemrestoration project annual report, July 1998 –June 1999, pp. 66-72. Hawkes Bay Conservancy,Department of Conservation, Gisborne, N.Z.
Karl, B.J.; Clout, M.N. 1987. An improved radio-transmitter harness with a weak link to preventsnagging. Journal of Field Ornithology 58: 73-77.
King, C.M. 1990. Stoat. In: King, C.M. (Editor), Thehandbook of New Zealand mammals, pp. 288-312. Oxford University Press, Auckland, N.Z.
Livingstone, P.G. 1994. The use of 1080 in NewZealand. In: Seawright, A.A.; Eason, C.T.(Editors), Proceedings of the science workshopon 1080, pp. 1-9. The Royal Society of NewZealand, Wellington, N.Z.
Lyver, P. O’B. 2000. Identifying mammalian predatorsfrom bite marks: a tool for focusing wildlifeprotection. Mammal Review 30: 31-44.
Mander, C.J.; Hay, R.; Powlesland, R.G. 1998.Monitoring and management of kereru(Hemiphaga novaeseelandiae). Department ofConservation Technical Series No. 15. Departmentof Conservation, Wellington, N.Z.
McEwen, W.M. 1978. The food of the New Zealandpigeon (Hemiphaga novaeseelandiaenovaeseelandiae). New Zealand Journal ofEcology 1: 99-108.
Moorhouse, R.J.; Greene, T.C. 1998. Research planfor kaka (Nestor meridionalis) 1996–2002.Department of Conservation, Wellington, N.Z.
Moorhouse, R.; Greene, T.; Dilks, P.; Powlesland, R.;Moran, L.; Taylor, G.; Jones, A.; Knegtmans, J.;Wills, D.; Pryde, M.; Fraser, I.; August, A.; August,C. 2003. Control of introduced mammalianpredators improves kaka Nestor meridionalisbreeding success: reversing the decline of athreatened New Zealand parrot. BiologicalConservation 110: 33-44.
Moorhouse, R.J.; Sibley, M.J.; Lloyd, B.D.; Greene,T.C. 1999. Sexual dimorphism in the North Islandkaka Nestor meridionalis septentrionalis: selection
137POWLESLAND ET AL.: 1080 EFFECTS ON KAKA AND KERERU
for enhanced male provisioning ability? Ibis 141:644-651.
Morgan, D.R.; Batcheler, C.L.; Peters, J.A. 1986. Whydo possums survive aerial poisoning operations?Proceedings Vertebrate Pest Conference 12: 210-214.
Morgan, D.R.; Thomas, M.D.; Meeken, D.; Nelson,P.C. 1997. Less 1080 bait useage in aerialoperations to control possums. Proceedings of the50th New Zealand Plant Protection SocietyConference: 391-396.
Morton, J.; Ogden, J.; Hughes, T. 1984. To save aforest, Whirinaki. D. Bateman Ltd., Auckland,N.Z.
Murphy, E.C.; Robbins, L.; Young, J.B.; Dowding,J.E. 1999. Secondary poisoning of stoats after anaerial 1080 poison operation in Pureora Forest,New Zealand. New Zealand Journal of Ecology23: 175-182.
Payton, I. 2000. Damage to native trees. In: Montague,T.L. (Editor), The brushtail possum: biology,impact and management of an introducedmarsupial, pp. 111-125. Manaaki Whenua Press,Lincoln, N.Z.
Pierce, R.J.; Graham, P.J. 1995. Ecology and breedingbiology of kukupa (Hemiphaga novaeseelandiae)in Northland. Science & Research Series No. 91.Department of Conservation, Wellington, N.Z.
Powlesland, R.G.; Knegtmans, J.W.; Marshall, I.S.J.1999. Costs and benefits of aerial 1080 possumcontrol operations using carrot baits to NorthIsland robins (Petroica australis longipes), PureoraForest Park. New Zealand Journal of Ecology 23:149-159.
Powlesland, R.G.; Knegtmans, J.W.; Styche, A. 2000.Mortality of North Island tomtits (Petroicamacrocephala toitoi) caused by aerial 1080 possumcontrol operations, 1997-98, Pureora Forest Park.New Zealand Journal of Ecology 24: 161-168.
Sadleir, R. 2000. Evidence of possums as predators ofnative animals. In: Montague, T.L. (Editor), Thebrushtail possum: biology, impact andmanagement of an introduced marsupial, pp.126-131. Manaaki Whenua Press, Lincoln, N.Z.
SPSS Inc. 1999. SPSS advanced models 10.0. SPSSInc., Chicago, U.S.A.
Spurr, E.B. 1991. Effects of brushtail possum controloperations on non-target bird populations. ActaXX Congressus Internationalis Ornithologici:2534-2545.
Spurr, E.B.; Powlesland, R.G. 1997. Impacts of aerialapplication of 1080 on non-target native fauna:review and priorities for research. Science forConservation No. 62. Department of Conservation,Wellington, N.Z.
Veltman, C. 2000. Do native wildlife benefit frompossum control? In: Morgan, T.L. (Editor), Thebrushtail possum: biology, impact andmanagement of an introduced marsupial, pp.241-250. Manaaki Whenua Press, Lincoln, N.Z.
Veltman, C.J.; Pinder, D.N. 2001. Brushtail possummortality and ambient temperatures followingaerial poisoning using 1080. Journal of WildlifeManagement 65: 476-481.
Warburton, B. 2000. Monitoring possum populations.In: Montague, T.L. (Editor), The brushtail possum:biology, impact and management of an introducedmarsupial, pp. 132-142. Manaaki Whenua Press,Lincoln, N.Z.
Wilson, P.R.; Karl, B.J.; Toft, R.J.; Beggs, J.R.; Taylor,R.H. 1998. The role of introduced predators andcompetitors in the decline of kaka (Nestormeridionalis) populations in New Zealand.Biological Conservation 83: 175-185.
Editorial Board member: Ian Jamieson
138 NEW ZEALAND JOURNAL OF ECOLOGY, VOL. 27, NO. 2, 2003