Journal of Electrocardiology Vol. 27 No. 2 1994 Effects of Activation Sequence on the Spatial Distribution of Repolarization Properties Imran Zubair, MD, Andrew E. Pollard, PhD, Kenneth W. Spitzer, PhD, and Mary Jo Burgess, MD Abstract: The electrotonic effects of activation spread on the spatial distribution of repolarization properties were studied in animal experiments and with com- puter simulations. Refractory periods (RPs) were measured at 36 sites within a 1.0 cm 2 region of the epicardial surface of the canine pulmonary conus during 37 drives in 11 experiments. In each experiment three or four sites along the perimeter of the region bounding the RP test sites were driven. Activation propa- gated uniformly during some and nonuniformly during other drives in the same animals. In general, RPs were distributed uniformly when activation spread uniformly and nonuniformlywhen activation spread nonuniformly. The authors observed RP differences as large as 16 ms between sites with 2 mm separation during ,drive from some epicardial sites in these normal canine hearts. Indices of nonuniformity of activation and of relative RP values were used to quantify the relation between nonuniformity of activation spread and the spatial distribu- tion of the RP. There was a significant negative correlation between nonuniform- ity of activation and RP indices during the 19 drives in which activation spread nonuniformly. This indicated that RPs were relatively long at sites where activa- tion spread decelerated and relatively short at sites where activation spread accel- erated. 'When nonuniform activation spread was simulated by introducing high- resistance barriers in a model with fixed anisotropic conductivities, there were marked spatial variations in action potential duration. The spatial variations in action potential duration were negatively correlated to acceleration and deceler- ation of activation spread. The major new finding of this study is that the spatial distributions of RPs are markedly affected by activation spread. Since both char- acteristics of activation sequence and nonuniformity of RP distributions have roles in reentrant arrhythmias, the findings suggest that some sites of origin of premature activity may be more arrhythmogenic than others. The findings may also explain why ventricular tachycardia can sometimes be initiated from one but not from other sites in patients undergoing electrophysiologic testing. Key words: anisotropy, computer simulations, nonuniform activation spread, elec- trotonus, repolarization, heart ventricle. From the Nora Eccles Harrison Cardiovascular Research and Training Institute and the Departments of Internal Medicine and Physiology, University of Utah, Salt Lake City, Utah. Supported by National Institutes of Health, National Heart, Lung and Blood Institute grants HL-34288 and HL-42873, the Nora Eccles Treadwell Foundation and the Richard A. and Nora Eccles Harrison Fund for Cardiovascular Research, and awards from the Whitaker Foundation and the University of Utah Supercomputer Center. Reprint requests: Mary Jo Burgess, MD, CVRTI, Building 500, University of Utah, Salt Lake City, UT 84112. 115
Transcript
Journal of Electrocardiology Vol. 27 No. 2 1994
Effects of Activation Sequence on the Spatial Distribution of Repolarization
Properties
Imran Zubair, MD, Andrew E. Pollard, PhD, Kenneth W. Spitzer, PhD, and Mary Jo Burgess, MD
Abstract: The electrotonic effects of activation spread on the spatial distribution of repolarization properties were studied in animal experiments and with com- puter simulations. Refractory periods (RPs) were measured at 36 sites within a 1.0 cm 2 region of the epicardial surface of the canine pulmonary conus during 37 drives in 11 experiments. In each experiment three or four sites along the perimeter of the region bounding the RP test sites were driven. Activation propa- gated uniformly during some and nonuniformly during other drives in the same animals. In general, RPs were distributed uniformly when activation spread uniformly and nonuniformly when activation spread nonuniformly. The authors observed RP differences as large as 16 ms between sites with 2 mm separation during ,drive from some epicardial sites in these normal canine hearts. Indices of nonuniformity of activation and of relative RP values were used to quantify the relation between nonuniformity of activation spread and the spatial distribu- tion of the RP. There was a significant negative correlation between nonuniform- ity of activation and RP indices during the 19 drives in which activation spread nonuniformly. This indicated that RPs were relatively long at sites where activa- tion spread decelerated and relatively short at sites where activation spread accel- erated. 'When nonuniform activation spread was simulated by introducing high- resistance barriers in a model with fixed anisotropic conductivities, there were marked spatial variations in action potential duration. The spatial variations in action potential duration were negatively correlated to acceleration and deceler- ation of activation spread. The major new finding of this study is that the spatial distributions of RPs are markedly affected by activation spread. Since both char- acteristics of activation sequence and nonuniformity of RP distributions have roles in reentrant arrhythmias, the findings suggest that some sites of origin of premature activity may be more arrhythmogenic than others. The findings may also explain why ventricular tachycardia can sometimes be initiated from one but not from other sites in patients undergoing electrophysiologic testing. Key words: anisotropy, computer simulations, nonuniform activation spread, elec- trotonus, repolarization, heart ventricle.
From the Nora Eccles Harrison Cardiovascular Research and Training Institute and the Departments of Internal Medicine and Physiology, University of Utah, Salt Lake City, Utah.
Supported by National Institutes of Health, National Heart, Lung and Blood Institute grants HL-34288 and HL-42873, the Nora Eccles Treadwell Foundation and the Richard A. and Nora Eccles Harrison Fund for Cardiovascular Research, and awards from the Whitaker Foundation and the University of Utah Supercomputer Center.
Reprint requests: Mary Jo Burgess, MD, CVRTI, Building 500, University of Utah, Salt Lake City, UT 84112.
115
116 Journal of Electrocardiology Vol. 27 No. 2 April 1994
The nonuniform anisotropic nature of myocardial structure has marked electrotonic effects on activa- tion spread.l-7 The magnitude of these effects is de- pendent on the myocardial structure and geometric relationship between that structure and the ap- proaching activation wavefronts. 8'9 Our results from whole animal experiments have shown that even in intact normal hearts, drive from some sites results in uniform propagation of activation while drive from other sites results in nonuniform propagation. 1° Nonuniform spread of activation in the canine pul- monary conus was also shown by Frazier et al. 11 al- though they did not emphasize this characteristic of propagation. In computer simulations in which resis- tive barriers, aligned with fiber axes, were distributed throughout two-dimensional s'x°'x2"x3 and three-di- mensional 9 models, nonuniform action potential propagation has been closely tied to the position of barriers and the extent of cellular uncoupling. Propa- gation across fiber axes is markedly affected by "non- uniform anisotropy. ''6"7 The effects of anisotropy on activation spread have also been implicated as a mechanism for reentrant arrhythmias, ~,4,~4-~6 and Allessie et al. ~ have utilized anisotropic spread of ac- tivation to develop an isolated heart model of reen- trant ventricular tachycardia.
In addition, electrotonic effects of activation spread on repolarization properties at a limited number of sites have been demonstrated in whole animal and isolated tissue studies. 5"~°'~7-2x In an earlier report using in situ canine preparations we measured ven- tricular refractory periods (RPs) at single epicardial sites during drive of two ventricular sites. ~° Refrac- tory period differences between the two drives were correlated with the changes in uniformity of propa- gation. Activation sequence-induced differences in the spatial distributions of action potential duration (APD) have been demonstrated in computer simula- tions. ~2 However, there have been no systematic whole animal studies of the effects of activation se- quence on the spatial distribution of repolarization properties.
The role of anisotropy on activation spread and the electrotonic effects of discrete directional conduction velocities on APD suggest that the pattern of activa- tion might affect the spatial distribution of repolariza- tion properties. Slow conduction and nonuniformity of repolarization are both wel l -known factors in reentrant arrhythmias. Therefore, the definition of the effects of activation sequence on the spatial distri- bution of repolarization properties has important clinical implications. The purpose of this study was to determine the circumstances under which activation sequence can affect the spatial distribution of repolar- ization properties and to examine the relation be-
tween the characteristics of activation spread and the spatial distribution of repolarization properties.
Materials and Methods
Animal Preparation
Experiments were performed on 11 mongrel dogs (weight, 15-20 kg). The animals were anesthetized with a bolus intravenous injection of 30 mg/kg pen- tobarbital. A solution of pentobarbital (240 rag/L) in 0.9 % normal saline was slowly infused intravenously to maintain anesthesia. Additional intravenous bo- luses of 3 0 -6 0 mg pentobarbital were administered as needed to maintain deep anesthesia, which was judged by the absence of corneal reflexes. A tracheos- tomy was performed, and the animals were intu- bated. A pump respirator was used to ventilate the animals with room air, and a tidal volume of 10-15 mL/kg was maintained. The chest was opened with a midsternal incision, and the heart was suspended in a pericardial cradle. A bipolar, stainless-steel hook electrode was attached to the right atrial appendage, and the sinus node was crushed. An electrode array consisting of 64 unipolar silver electrodes embedded in a fiat epoxy plaque was sutured to the pulmonary conus. The electrodes were 0.5 m m in diameter and were arranged on a uniform 8 × 8 grid, with 2 mm separation of columns and rows. The electrode plaque was positioned with columns of electrodes approximately parallel to the long axis of the fibers on the epicardial surface. The heart was paced simul- taneously from the right atrium and from an elec- trode on the periphery of the plaque. This was done to decrease the likelihood of retrograde atrial activa- tion during RP measurements. Atrial pacing stimuli were bipolar, 2 ms, constant current pulses. Ventric- ular pacing stimuli were unipolar, cathodal, 2 ms, constant current pulses at twice diastolic threshold. A stainless-steel needle electrode placed subcutane- ously in the right thorax served as the indifferent electrode for unipolar pacing. Basic driving stimuli (S l) were delivered at a cycle length short enough to maintain control of drive. The S 1-S ~ cycle length was 400 ms in seven experiments, 350-380 ms in three experiments, and 280 ms in one experiment. The cycle length was kept constant throughout the course of each experiment. The animals were kept warm by placing them on a heating pad, covering the chest with a piece of plastic and directing a surgi- cal lamp over the chest cavity.
Activation Effects of Spatial RP Distributions • Zubair et al. 117
Data Acquisition
Electrograms were recorded simultaneously from the 64 sites on the electrode array at 1,000 samples/s using a 64-channel :multiplexer acquisition and data processing system. 22 Recordings were referenced to a Wilson's central terminal. The activation t ime of each electrode site was estimated f rom the elec- trograms recorded f rom each site. The t ime of the m i n i m u m derivative of the QRS in each electrogram was taken as the activation t ime at that site.
Experimental Protocol and Refractory Period Measurements
At the beginning of each ,experiment the heart was paced at eight sites along the periphery of the elec- trode array. Activation sequence maps were dis- played on a computer terminal, and drives with uni- form and nonuni form spread of activation were identified. We have previously observed striking dif- ferences in the characteristics of activation spread in the pu lmonary conus of dogs during drive of various sites in this region. ~o In most experiments regions of marked deceleration and acceleration of activation spread were evident during some drives, and the lo- cations of these regions shifted w h e n the drive site was changed. During other drives in the same animal activation spread fairly uniformly. In each experi- ment RPs were measured while the hearts were paced f rom three to four sites on the periphery of the electrode array. Drives associated with uniform and nonuni form activation spread were used whenever possible, but in some experiments activation spread uniformly' during all drives.
Meticulous care was taken to mainta in stable RP measurements . Deep anesthesia was mainta ined throughout the experiments, and the animals were kept warm. Test stimuli were first delivered early in the cardiac cycle and then delayed in 1 ms incre- ments until a propagated response occurred. The test stimulus was then immediately turned off. With this method of measuring the RP, the cycle length re- mained constant for all cycles except the one during which the RP test pulse induced a response. For each drive, $1 was mainta ined for at least 3 minutes before starting RP measurements . This permit ted repolariza- tion properties to stabilize following a change in drive site. Refractory periods were then measured at the 36 central plaque electrode sites. Stimuli for the RP measurements ($2) were unipolar, cathodal, con- stant current, 2 ms pulses at twice diastolic threshold intensity. Diastolic threshold at each test site was de-
termined prior to measuring the RP. The RP at each measuremen t site was taken as the shortest S~-S2 interval that induced a propagated response, minus the activation t ime at that site. Since the activation time at the test site was subtracted f rom Sl-S2, RPs obtained were measures of local excitation at each test site. A body surface lead was used to moni tor responses to the RP test stimuli. In three experiments two complete sets of RP measurements were ob- tained during three drives. This was done to establish the reproducibility of the measurements . In the other eight experiments RPs were measured at all 36 test sites and then the measuremen t at the first test site was repeated. If the measuremen t had changed by more than 2 ms, the RP measurements at all 36 sites were repeated. This was seldom necessary. Once the RP measurements for a given drive were completed, the drive site was changed and the protocol for RP measurements was repeated. It took 35 -45 minutes to complete a set of 36 RP measurements . A total of 37 drives was studied in the 11 experiments.
Map Display and Data Analysis
Isochrone maps of activation times and RPs were constructed f rom data acquired during each drive. The features of these maps were evaluated in terms of uniformity or nonuniformity of isochrone distribu- tions and the locations of regions of nonuniformity. We quantified the spatial distribution of activation t ime using a method we previously reported, lo The theoretic basis and mathemat ic derivation for. the method were presented in detail in that report. Briefly, for each site in the measuremen t grid with position row = i and co lumn = j, we determined the spatial index f f rom the t imes t at neighboring sites.
f(i,j,t) = [t(i,j + 1) + t(i,j - 1)
+ t(i + 1,j) + t(i - 1,j)
(1) - 4 t ( i , j ) ] + 0.707[t(i + 1,j + 1)
+ t ( i + 1 , j - 1) + t ( i - 1,j + l)
+ t(i - 1,j - i) - 4 t ( i , j ) ] .
Here we defined the nonuniformity of activation index (NAI) as NAI = f(i, j, activation time). We also developed an RP index (RPI) to quantify the relative value of the RP at a site with respect to the values at neighboring sites. The calculation was similar to the calculation of NAI, but RP values were substi- tuted for activation time values in equat ion 1, that is, RPI -- f(i, j, RP). At points where neighboring
118 Journal of Electrocardiology Vol. 27 No. 2 April 1994
sites (i - 1, i + 1, j - 1, j + 1) were outside the measurement boundaries we assumed no change in t. This approach was used rather than estimating t values for sites where they were not measured to avoid introducing subjective bias into the analysis. The RPI is an index of the relative duration of the RP at a site with respect to the average RP of neighboring sites. An RPI near zero indicated that the RP at the index site was close to the average of the RPs of the eight neighboring sites. A positive RPI indicated that the RP at the index site was short with respect to the values at neighboring sites. A negative RPI indicated that the RP at the index site was long with respect to the values at neighboring sites.
Correlation coefficients be tween NAI and RPI at each of the 36 RP test sites were calculated for each drive to assess the similarity be tween the spatial dis- tributions of activation t ime and the RP. The t-test was used to establish levels of significance, and P values <.05 were considered significant. In addition, correlation coefficients be tween the m i n i m u m NAI and the RPI at the site of the m i n i m u m NAI and correlation coefficients be tween the m a x i m u m NAI and the RPI at the site of the m a x i m u m NAI were calculated f rom data over all drives in all experi- ments.
Computer Simulations
We performed a set of computer simulations of action potential propagat ion in two idealized models to examine the relationship be tween changes in acti- vation sequence and the spatial distribution of APD. A two-dimensional sheet that measured 14.4 x 14.4 m m was discretized into a ne twork of 201 x 201 excitable elements. Simulations were performed by the numerical solution,
1 [ 1 a2V= 1 a2Vm] (2) Im = ~v" [ ~ l i l ' - - + C~X 2 Rit 0y 2 J
dVm = Cm d--T + Iio~,
with Im the t ransmembrane current density, Sv the membrane surface to volume ratio, Ril the specific intracellular resistance in the longitudinal (x) direc- tion, Rit the specific intracellular resistance in the transverse (y) direction, Vm the t r ansmembrane po- tential, Cm the specific membrane capacitance, and Iion an ionic current source density. For Sv we as- sumed a cable diameter of 4.0 p~m. I~on was repre- sented with a modified Beeler-Reuter model, 23-x5 and identical ion channel kinetics were prescribed at
each node in the models. We assumed no contribu- tions to the electrical current flow from the interstitial or extracellular volume conductors, and represented wavefront propagat ion with a m o n o d o m a i n model. 26 We also assumed that the current was con- fined to a single myocardial layer on the epicardial surface and ignored three-dimensional current flow paths.
The solution technique was close to the one we used in a previous report. 1° Briefly, equation 2 was expressed as a set of difference equations. Finite dif- ference simulations used an alternating direction im- plicit scheme. The temporal step size dt was adjusted f rom dtmin to dtma× after activation had passed through the model by an adaptive approach, which was a variation of the method Of Rush and L a r s e n F With this method, dt for each iteration was predicted f rom the m i n i m u m temporal derivative at any point in the model calculated on the previous iteration. Stimuli were intracellular square Current pulses at twice diastolic threshold intensity. Simulations were performed on a Silicone Graphics Iris Indigo com- puter, and each set of calculations required approxi- mately 5 hours to run to completion.
The parameters we used for the simulations are presented in Table 1. Nodes were equally spaced in both the longitudinal and transverse fiber directions at dx = dy = 72 ~m. With the values we selected for specific intracellular resistances, the discretization ratio relative to the resting longitudinal space con- stant was 0.06 and the discretization ratio relative to the resting transverse space,constant was 0.11. As a consequence, models encompassed 12 resting space constants in the longitudinal direction and 22 resting space constants in the transverse direction. Although we recognize that the selection of parameters that led to different discretization ratios in the longitudi- nal and transverse directions was inconsistent with continuous uniform discretization, 13 reductions in the spatial step sizes resulted in no qualitative differ- ences in the waveforms f rom those described here.
With our models, it was not our intention to faith- fully represent the myocardial structure of the pul- monary conus. Rather, we examined characteristic parameters during action potential propagat ion in a model with a highly uniform anisotropic structure and in a model with a well-defined nonuniform an- isotropic structure. For our "un i fo rm anisotropy model" we selected values for Ril and Rit that were consistent wi th the values for ventricular myocar- d ium reported by Clerc. 3 This resulted in a conduc- t ion velocity that was approximately 2.5 times faster in the longitudinal fiber direction than in the trans- verse fiber direction. There was a uniform activation spread in each direction in this model since the cell-
Activation Effects of Spatial RP Distributions • Zubair et al. 11'9
Table 1. Parameters Used in Computer Simulations
Parameter Units Definition
S,, 5,000 cm - 1 C:m 1.0 /~F/cm 2 dtmin 1.0 p,s dtmax 1.0 Ixs dx 72 p~m RiLI 250 ,O," cm d,/X~ 0.06 dy 72 ~m Ru 900 f~-cm dy/Xt O. 11 Rjt 9,000 ~q-cm
Membrane surface to intracellular volume ratio Specific membrane capacitance Minimum temporal integration step size Maximum temporal integration step size Longitudinal element length Longitudinal intracellular specific resistance Discretization relative to longitudinal space constant Transverse element length Transverse intracellular specific resistance Discretization relative to transverse space constant Transverse intracellular specific resistance for weakly coupled elements
to-cell couplings were identical for all connections aligned with each fiber direction. We performed two simulations with the uni form anisotropy model to represent a change in activation sequence that was similar to the change introduced in the animal exper- iments.
For our "nonun i fo rm anisotropy model" we iden- tified a rectangular region that measured 4 × 8 m m and assigned values for the transverse specific intra- cellular resistance of I0.0 Rit for all connections aligned with the transverse fiber direction in this re- gion. These regional high resistances w e r e intended to represent cellular uncoupling in nonuni form an- isotropic myocardium. We assumed that there would be local deceleration and acceleration of activation spread at the borders of the region, and we examined the changes in APD as a consequence of the imposed structure. The same drives we examined in the uni- form anisotropy model were simulated in the nonun- iform anisotropy model.
In each simulation, the spatial relationship of acti- vation time to APD was analyzed in a way similar to that used for the animal experiments. Activation times were taken as the t ime of m a x i m u m upstroke velocity, and APD was determined as the t ime differ- ence between the t ime of 80% repolarization and the time of m a x i m u m upstroke velocity. An index of the relative duration of APD (APDI) with respect to neighboring APD was calculated as APDI = f (i, j, APD) f rom equation 1. We examined the behavior in the central 1 × 1 cm region of each model to minimize :stimulus and boundary effects and to char- acterize the electrical behavior over a region with the same dimensions as those in the animal experiments.
Results
Measurement Reproducibility
A total of 37 drives was studied in 11 experiments. In three experiments, two complete sets of 36 RP measurements were made during three drives to es-
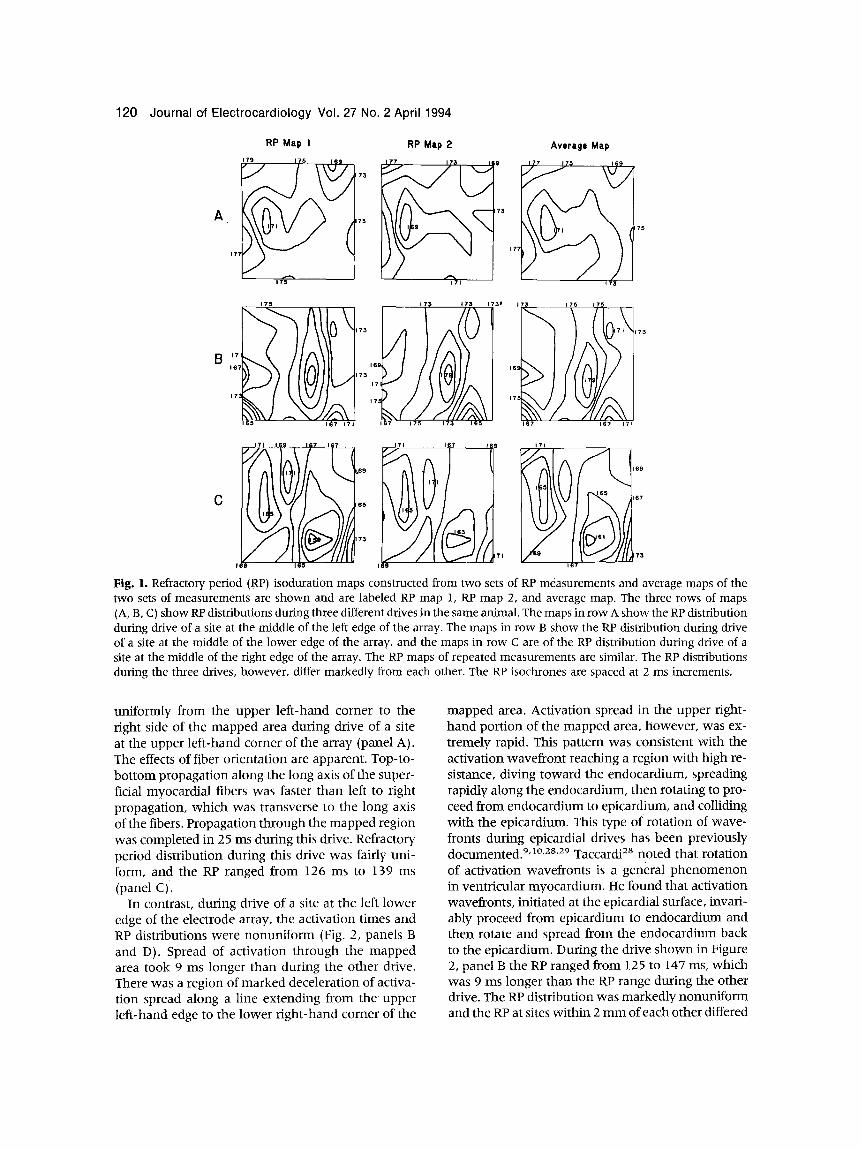
tablish the reproducibility of the measurements . The results o f o n e o f these exper iment s are shown in Fig- ure I. The rows of maps (A, B, C) show data from drives of three different sites. Maps of repeated RP measurements acquired during a given drive are
shown in the left and middle columns and the maps of data averaged f rom the two sets of measurements are shown in the right column. The distributions of repeated RP measurements during a given drive closely resembled each other. The correlations be- tween RP maps 1 and 2 shown in A, B, and C w e r e
0.996, 0.992, and 0.915, respectively. This demon- strates that the RP remained constant during drive of a given site. In contrast, differences in RP distribu- tions Occurred w h e n the drive site was changed. The differences included the locations of the longest and shortest RPs, the regions with the largest differences in RPs, and the magni tude of the differences in RPs. The correlations between the average RP maps for different drives ranged f rom - 0 . I22 to 0.474 in the exper iment illustrated in Figure l.
Comparable results w e r e obtained in the other two experiments in which two complete sets of RP mea- surements!were acquired during each of three drives. Correlation coefficients of sets of duplicate measure- ments ranged between 0.764 and 0.996 and aver- aged .901 + .066. The correlation coefficients of RP distributions during different drives, on the other hand, ranged between - 0.122 and 0.807 and aver- aged 0.322 _+ 0.327. These observations indicate that the effects of activation sequence on RP distributions far exceeded the variability in repeated sets of RP measurements made during the same drive.
Isochrone Maps of Activation Times and Refractory Periods
Maps of activation times and RPs constructed from data acquired during two drives in one experiment are shown in Figure 2. Isochrone maps of activation times are shown in panels A and B and RP isochrone maps are shown in panels C and D. Activation spread
120 Journal of Electrocardiology Vol. 27 No. 2 April 1994
RP Map I RP Map 2 Average Map 179 175 ISS . 137 17~ 11;9 ~ 7 7 175 I ~ )
1 7 5
1 7 7 1 7
I I
175
o / , 169
73
;7 71 1~7 175 I"
173 173W 173 175 175
1~7 171
J71 169 167 167 i71 167 J~9 17i
1 . 6 9 1 6 9
1
• 71 173
165 169 7
Fig. 1. Refractory period (RP) isoduration maps constructed from two sets of RP measurements and average maps of the two sets of measurements are shown and are labeled RP map 1, RP map 2, and average map. The three rows of maps (A, B, C) show RP distributions during three different drives in the same animal. The maps in row A show the RP distribution during drive of a site at the middle of the left edge of the array. The maps in row B show the RP distribution during drive of a site at the middle of the lower edge of the array, and the maps in row C are of the RP distribution during drive of a site at the middle of the right edge of the array. The RP maps of repeated measurements are similar. The RP distributions during the three drives, however, differ markedly from each other. The RP isochrones are spaced at 2 ms increments.
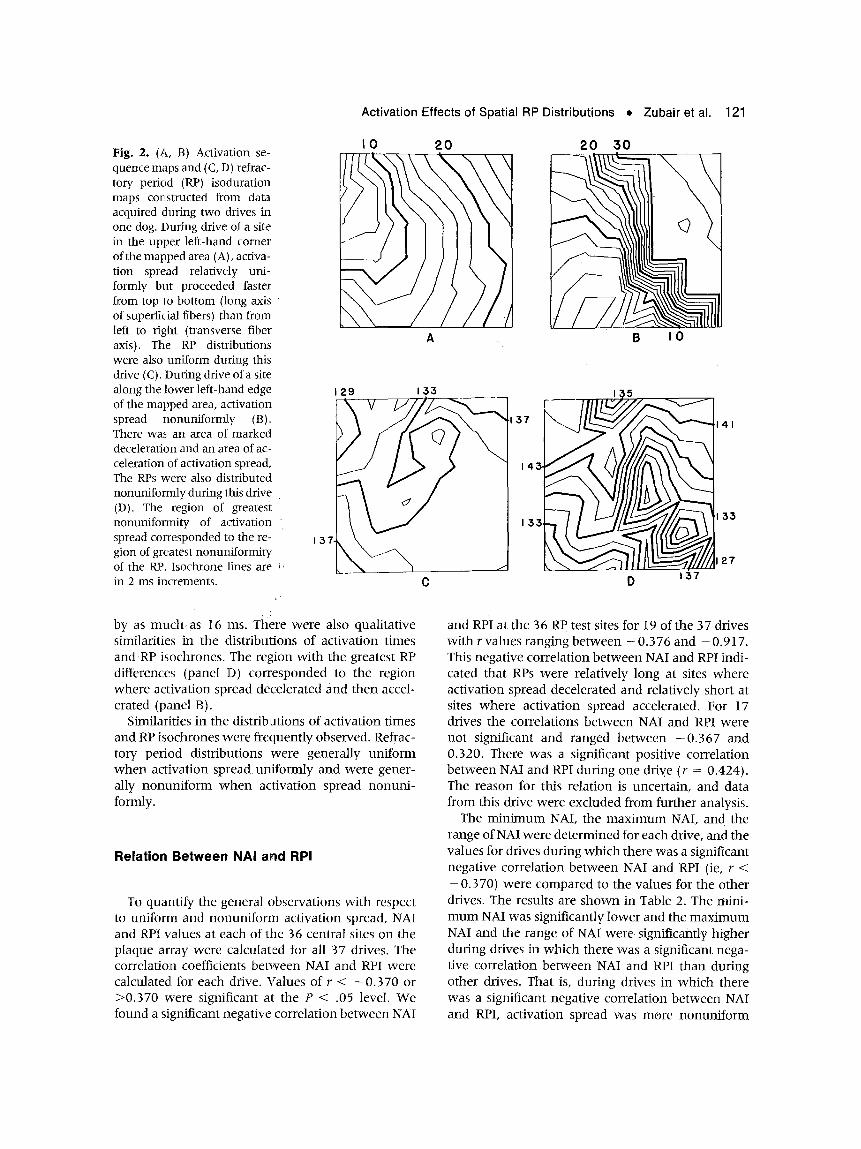
uniformly f rom the upper left-hand corner to the right side of the mapped area during drive of a site at the upper left-hand corner of the array (panel A). The effects of fiber orientation are apparent. Top-to- bo t tom propagat ion along the long axis of the super- ficial myocardial fibers was faster than left to right propagation, which was transverse to the long axis of the fibers. Propagation through the mapped region was completed in 25 ms during this drive. Refractory period distribution during this drive was fairly uni- form, and the RP ranged f rom 126 ms to 139 ms (panel C).
In contrast, during drive of a site at the left lower edge of the electrode array, the activation times and RP distributions were nonuni form (Fig. 2, panels B and D). Spread of activation through the mapped area took 9 ms longer than during the other drive. There was a region of marked deceleration of activa- tion spread along a line extending f rom the upper left-hand edge to the lower r ight-hand corner of the
mapped area. Activation spread in the upper fight- hand port ion of the mapped area, however, was ex- tremely rapid. This pat tern was consistent with the activation wavefront reaching a region with high re- sistance, diving toward the endocardium, spreading rapidly along the endocardium, then rotating to pro- ceed f rom endocard ium to epicardium, and colliding with the epicardium. This type of rotation of wave- fronts during epicardial drives has been previously documented. 9,1°,28,29 Taccardi 2s noted that rotation of activation wavefronts is a general p h e n o m e n o n in ventricular myocardium. He found that activation wavefronts, initiated at the epicardial surface, invari- ably proceed f rom epicardium to endocardium and then rotate and spread f rom the endocardium back to the epicardium. During the drive shown in Figure 2, panel B the RP ranged from i25 to 147 ms, which was 9 ms longer than the RP range during the other drive. The RP distribution was markedly nonuni form and the RP at sites within 2 m m of each other differed
Fig. 2. (A, B) Acfiwttion se- quence maps and (C, D) refrac- tory period (RP) isoduration maps constructed from data acquired during two ,drives in one dog. During drive of a site in the upper left-hand corner of the mapped area (A), activa- tion spread relatiw~ly uni- formly but proceeded faster from top lo bottom (long axis of superficial fibers) than from left to right (transverse fiber axis). The RP distributions were also uniform during this drive (C). During drive of a site along the ]lower left-hand edge of the mapped area, activation spread nonuniform]Ly (B). There was an area of marked deceleration and an area of ac- celeration of activation spread, The RPs were also distributed nonuniformly during this drive (D). The region of greatest nonuniformity of activation ~ spread corresponded to the re- gion of greatest nonuniformity of the RP. Isochrone ]lines are ~, in 2 ms increments.
I 0 2 0
129 133
A ,
Distributions • Zubair et al. 121
2 0 3 0
B I 0
137
143
133 37 I
C
by as mulch as 16 ms. There were also qualitative similarities in the distributions of activation times and RP isochrones. The region with the greatest RP differences (panel D) corresponded to the region where activation spread decelerated and then accel- erated (panel B).
Similarities in the distributions of activation times and RP isochrones were frequently observed. Refrac- tory period distributions were generally uniform w h e n activation spread uniformly and were gener- ally nonuni form w h e n activation spread nonuni- formly.
Relation Between NAI and RPI
To quantify the general observations with respect to uniform and nonuni form activation spread, NAI and RPI values at each of the 36 central sites on the plaque array were calculated for all 37 drives. The correlation coefficients be tween NAI and RPI were calculated for each drive. Values of r < - 0 . 3 7 0 or >0.370 were significant at the P < .05 level. We found a significant negative correlation be tween NAI
D 1:37
and RPi at the 36 RP test sites for 19 of the 37 drives with r values ranging be tween - 0.376 and - 0.917. This negative correlation be tween NAI and RPI indi- cated that RPs were relatively long at sites where activation spread decelerated and relatively short at sites where activation spread accelerated. For 17 drives the correlations be tween NAI and RPI were not significant and ranged be tween - 0 . 3 6 7 and 0.320. There was a significant positive correlation be tween NAI and RPI during one driye (r = 0.424). The reason for this relation is uncertain, and data f rom this drive were excluded f rom further analysis.
The m i n i m u m NAI, the m a x i m u m NAI, and the range of NAI were determined for each drive, and the
values for drives during which there was a significant negative correlation be tween NAI and RPI (ie, r < - 0 . 3 7 0 ) were compared to the values for the other drives. The results are shown in Table 2. The mini- m u m NAI was significantly lower and the m a x i m u m NAI and the range of NAI were significantly higher during drives in which there was a significant nega- tive correlation be tween NAI and RPI than during other drives. That is, during drives in which there was a significant negative correlation be tween NAI and RPI, activation spread was more nonuni form
122 Journal of Electrocardiology Vol. 27 No. 2 Apri4 1994
Table 2. NAI for Drives With Significant r and Insignificant r Between NAI and RPI
r < -0.370 r > -0.370 (n = 19) (n = 17) P
Maximum NAI 33.53 + 1:4.25 17.52 _+ 6.28 <.001" Minimum NAI -34.43 - 17.25 -17.03 __ 6.173 <.001" Range of NAI 67.96 -+ 27.26 34.54 __ 12.49 <.001"
* Column 1 versus column 2. n = number of drives. NAI = nonuniformity of activation index; RI~I = refractory period index.
and there were regions of greate r deceleration and greater acceleration of activation spread than during other drives. This is consistent with nonuniformity of activation spread being a determinant of the mag- nitude of the electrotonic effects of activation spread on repolarization properties. We believe that the lack of a demonstrable correlation be tween NAI and RPI during uniform spread of activation is due in part to the overlap between measurement variability and the low values of NAI and RPI. However, the lack of correlation be tween NAI a n d RPI in this setting is also consistent with the low magni tude of elec- trotonic effe0s ,of Uniform, fast activation spread on repolarization properties.
Relation of Minimum and Maximum NAI to RPI
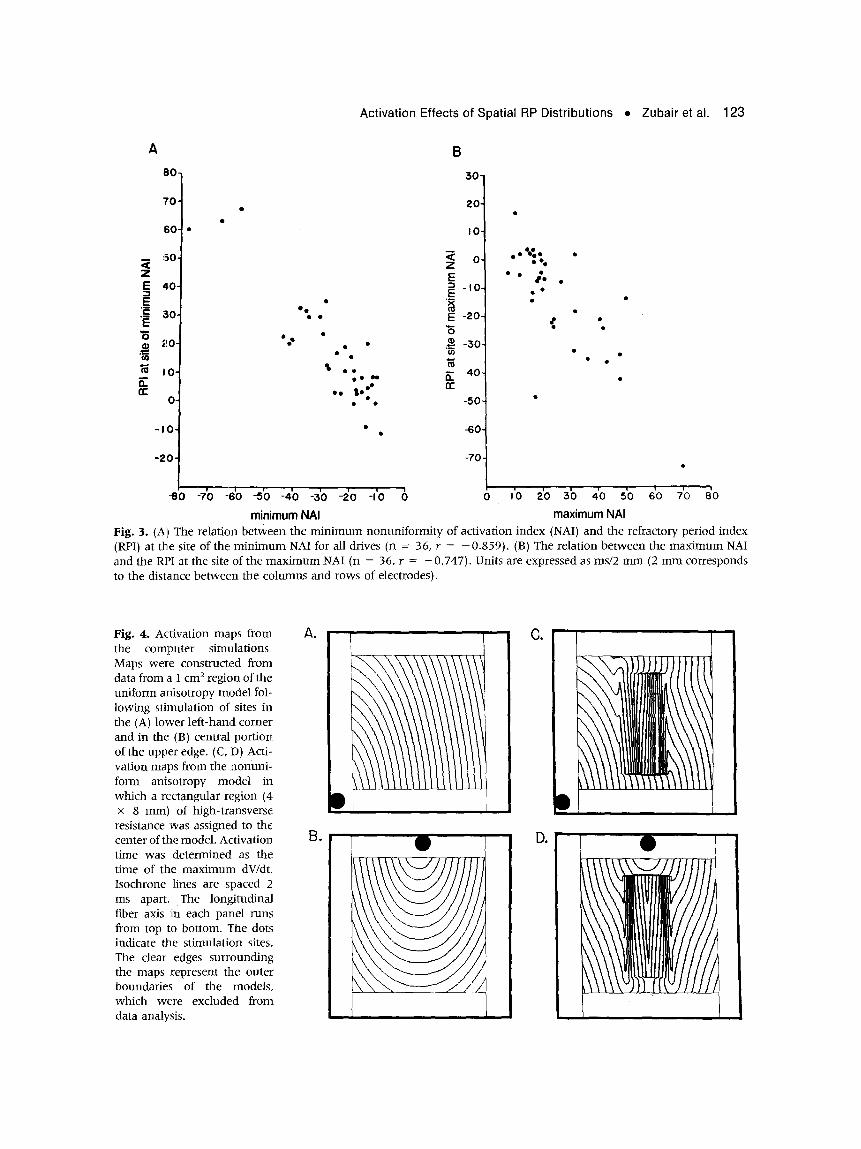
The results of the above analysis and the results of our previous studies indicated that slow conduc- tion 17 and nonuniformity of activatiola spread 1 o have a major effect on the RP. We, therefore, analyzed the relation of the m i n i m u m and m a x i m u m NAI to the RPI at the sites of the m i n i m u m and m a x i m u m NAI during all drives. Graphs of these relations are shown in Figure 3 and include data f rom 36 drives. There was a negative correlation be tween the m i n i m u m NAI and the RPI at the site of the m i n i m u m NAI (r = - 0.859, panel A). This indicated that deceleration of the spread of activation electrotonically prolonged the RP at the site of greatest" deceleration. Similarly, there was a negative correlation be tween the maxi- m u m NAI and the RPI at the site of the m a x i m u m NAI (r = - 0 . 7 4 7 , panel B). This indicated that ac- celeration of activation spread and/or collision of the propagating wavefront wi th the epicardium electro- tonically shortened the RP at the site of greatest accel- eration. This analysis of the relationship of the maxi- m u m and m i n i m u m NAI to the RPI at the sites of the m a x i m u m and m i n i m u m NAI included drives during which there was a significant negative corre- lation between NAI and RPI at all 36 sites and drives during which the correlation~was not significant. This indicates that at the sites of greatest nonuniformity
of activation spread there was apredic table relation be tween NAI and RPI.
Computer Simulations
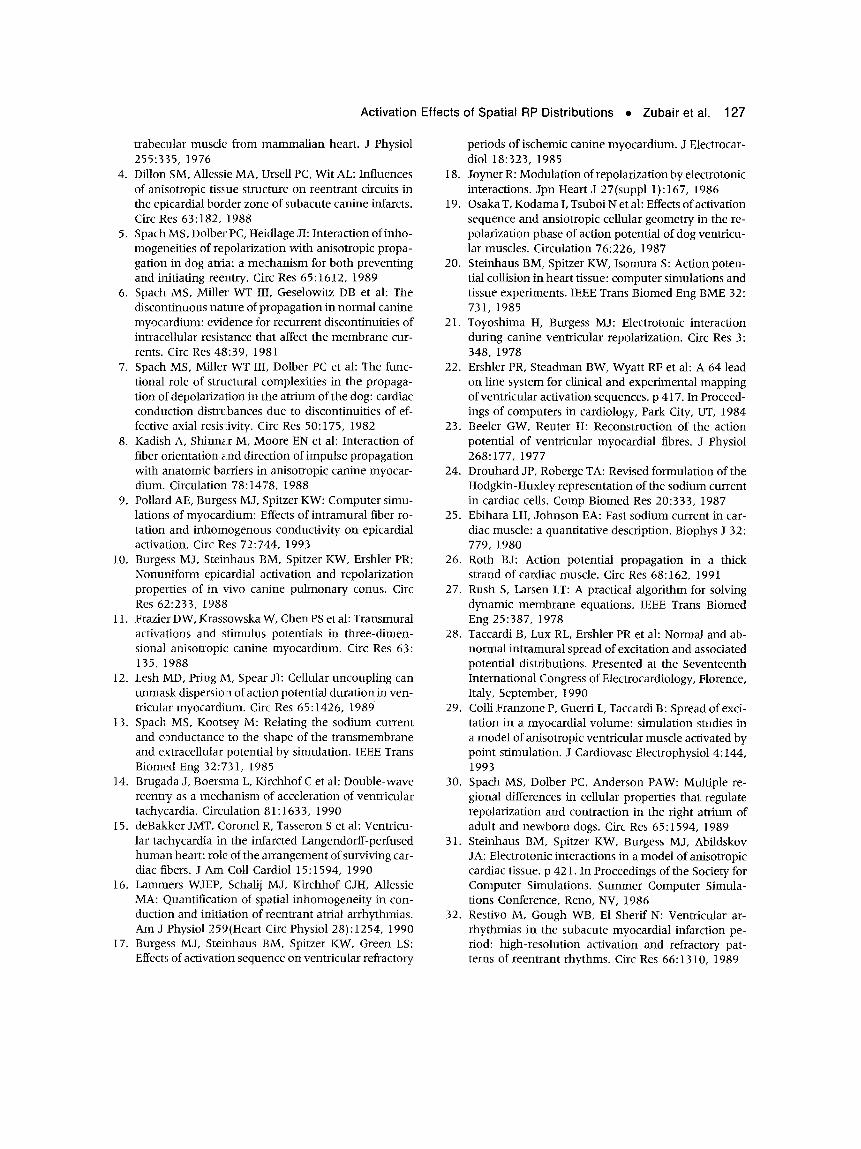
Maps of activation times in the internal 1 x 1 cm region of the models were constructed f rom data acquired during two drives in simulations with the uniform and nonuni form anisotropy models and are shown in Figure 4. The map following a stimulus in the lower left-hand corner of the uniform anisotropy model (panel A) demonstra ted evenly spaced elliptic isochrones throughout most of the map. Activation
!
spread was faster in the longitudinal fiber direction (bot tom to top) than in the transverse fiber direction (left to right). When the drive site was moved t o a central location along the top edge of the model (panel B) activation spread was also uniform. The activation spread following stimulation of the lower r ight-hand corner of the nonuni form anisotropy model (panel C) decelerated and then accelerated as activation spread through the region where high- transverse resistances were assigfled. W h e n we moved the stimulus to a position on the top edge of the model (panel D), activation also spread nonuni- formly at the boundary of the region where high- transverse resistances were assigned and spread more uniformly in other regions. We observed nonuniform activation spread following both drives in the nonun- iform anisotropy model because the region with high-transverse resistance extended over multiple space constants. As a result, depolarization wave- fronts, which approached the region f rom both the longitudinal and transverse fiber directions, were af- fected by the barriers. We recognize that the spatial extent of uncoupling in our nonuni form anisotropy model was m u c h greater than expected in normal myocardium. However, we assigned these properties to the model because our goal for these simulations was to relate nonuni form activation spread (acceler- ation and deceleration) to gradients in APD.
Figure 5 shows the spatial distributions of APD from each of the simulations. When the uniform an- isotropy model was paced f rom the lower left-hand
Ac t i va t i on Ef fects of Spat ia l RP D i s t r i bu t i ons • Zuba i r et al. 123
A
8 0
B
30"
Z E "5
.E
._.q E "6 .==
t r
70.
6 0 •
!50.
40-
,50.
,~!0-
I 0 -
O.
- I 0 -
-20.
•o
Z E ==
gO • ' ~ • • E
• "6
" ; , , , E o • t o ° ` n -
o •
20-
I0.
0-
- I0 -
-20.
-30.
-40-
J50 l
-60-
-70-
O • OQO e, • 0 %
• • O •
6'0 7'0 - 8 0 - z b - 6 ' o - s b - 4 ' o - 3 ' o 4 0 - i ' o 6 o i'o 2'o 3b 4'o 5'o 8'o minimum NAI maximum NAI
Fig. 3. (A) The relation between the min imum nonuniformity of activation index (NAI) and the refractory period index (RPI) at the site of the minimum NAI for all drives (n = 36, r = -0 .859) . (B) The relation between the maximum NAI and the RPI at the site of the maximum NAI (n = 36, r = - 0.747). Units are expressed as ms/2 mm (2 mm corresponds to the distance between the columns and rows of electrodes).
Fig. 4. Activation maps from A. the computer simulations,, Maps were constructed from data from a 1 cm 2 region of the uniform aifisotropy model fol- lowing stimulation of sites in the (A) lower left-hand comer and in the (B) central portion. of the upper edge. (C, D) Acti- vation maps from the nonuni- form anisotropy model in which a rectangular region (4 x 8 ram) of high-transverse resistance 'was assigned to the center of the model. Activation B. time was determined as the time of the maximum dV/dt. Isochrone lines are spaced 2 ms apart. The longitudinal fiber axis m each panel runs from top to bottom. The dots indicate the stimulation sites. The clear edges surrounding the maps represent the outer boundaries of the models, which were excluded from data analysis.
C.
D. O
124 Journal of Electrocardiology Vol. 27 No. 2 April 1994
Fig. 5. Action potential dura- tion (APD) maps from the computer simulations (A-D). Spatial distribution of APD corresponding to the simula- tions presented in Figure 4. Maps were constructed from data from a l cm 2 region of the uniform anisotropy model fol- lowing stimulation of sites in the (A) lower left-hand comer and (B) central portion of the upper edge. Maps were also constructed from data from a 1 cm 2 region of the nonuniform amsotropy model following stimulation of sites in the (C) lower left-hand corner and (D) central portion of the upper edge. The entry point for de- polarization wavefronts are marked with closed circles. Raised contour surfaces show the spatial distribution of APD at sites in the measurement area. Times for APD are in mil- liseconds and are indicated along the vertical axis of each panel.
280-
255
230
B
280 •
255,
230
o f 280 i ~:~
255
J 230 ~ ~ ~ D
280
255
230 J
corner (panel A), APDs were nearly uni form in the central 1 x ,, 1 cm port ion of the model (range, 261-263 ms). The APD values were also nearly uni- form when the stimulus was moved t o ' t he upper central site (panel B) (range, 263 -265 ms). When drives from these two sites were repeated in simula- tions with the nonuni form anisotropy model, marked changes in the spatial distribution of APDs occurred in the region of the model wi th high-trans- verse resistance. Action potential durat ion values in the simulations with the nonuni form anisotropy model ranged f rom 250 to 270 ms following the cor- ner drive (panel C) and f rom 248 to 277 ms following the drive f rom the top edge (panel D).
The APD ranges during both drives in the simula- tions with the nonuni form anisotropy model were markedly larger than the ranges in the simulations with the uniform anisotropy model. These results were consistent with the experimental findings in that electrotonic influences of nonuni form activation sequences on repolarization were associated with nonuniform APD distributions.
Data analysis similar to that used for the experi: mental maps was performed on the results f rom the four simulations. The correlation coefficients beL tween NAI and APDI, determined f rom activation
time and APD values measured at all 25,921 central points in the uni form anisotropy model, were r = - 0 . l l 0 and r = - 0 . 2 7 0 during the two drives. However, the correlation coefficients were r -- - 0.980 and r = - 0.950 during the same two drives in the nonuni form anisotropy model. These results paralleled those of the animal experiments. When activation spread relatively uniformly, the elec- trotonic effects of activation spread on repolarization were small. When activation spread nonuniformly, however , there was a strong negative correlation be- tween deceleration and acceleration of activation spread and APD distributions.
Discussion
Animal Experiments
Both in vivo m'17"21 and in vitro studies 5'~8-'2°'3° of limited numbers of sites and computer simula- tions 1 o, x 5~ 18,10,3 ~ have shown that electrotonic effects of propagat ion of activation alter the RP and APD. We have reported theoretic derivations and experi-
Activation Effects of Spatial RP Distributions • Zubair et al, 125
mental data that indicate that the magnitude of the electrotonic effects of activation on repolarization properties is influenced by conduction velocity and nonuniformity of activation spread. 17 However, the effects of activation spread on the spatial distribution of in vivo repolarizafion properties have not been pre- viously reported. Tihe new finding of this study was that marked changes in the spatial distribution of the RPs occurred when the: pattern of activation spread was altered by moving the drive site. In general, the spatial distribution!; of the RPs were uniform when activation spread uniformly and nonuni form when activation spread nonuniformly. In addition, there were qualitative similarities in the activation time and RP isochrone maps. The most marked gradients in the RPs occurred in regions where spread of activa- tion decelerated and then accelerated. The significant .correlations we found between NAI and RPI during nonuniform activation spread supported the conclu- sions we reached from qualitative evaluation of acti- vation sequence and RP distribution maps. Our find- ings are consistent with rapid uniform activation spread having slight electrotonlc effects on repolari- zation properties and slow nonuni form activation spread having greater electrotonlc effects on repolari- zation properties.
All of the drive sites in these experiments were within 1.7 cm of the RP test sites. This was done because it seemed likely that patterns of epicardial activation initiated from distant sites would resemble each other once activation had spread several centi- meters beyond the initiation site. We measured RPs at only 36 sites because we were concerned that it would be difficult to maintain stable RPs for the time required for more measurements. Nevertheless, our RP measurements had considerable temporal as well as spatial resolution. Colun-ms and rows of test sites were only 2 m m apart, and the test stimuli for RP measurements were incremented in 1 ms steps. Tem- poral resolution of this degree is important for the detection of electrotonically induced effects of activa- tion sequence on repolarization properties.
We took meticulous care to maintain stable condi- tions during RP measurements, and demonstrated that a change in drive site affected RP distribution far more than the wlriability in RP distributions asso- ciated with repeated measurements during the same drive. De.spite the care we took to maintain stable RP measurements, it is possible that gradual changes in repolarization properties occurred over the time course of the experiments and had some effect on the results. However, we believe these possible effects were slight. In addition, the computer simulations, where such changes cannot occur, were consistent with the results of the animal experiments.
Computer Simulations
The results from our computer simulations were in agreement with the data from the experimental animals and supported our hypothesis that the pat- tern of activation spread had significant electrotonic effe.cts on the spatial distribution of repolarization properties. In the models we prescribed identical in- trinsic repolarization properties at every node. All of the variations in APD that we observed during differ- ent drives were secondary to electrotonic influences of activation spread on APD.
In the uniform anisotropy model, where the nodes were well coupled in both the longitudinal and trans- verse fiber directions, there was a poor correlation between NAI and RPI. The only spatial variations in APD that we observed in these simulations were related to the effects of initiation of action potential propagation near the stimulus site and termination of action potential propagation at the model bounda- ries. These effects were largely negated in our analy- sis of the simulations because we compared NAI to APDI in only the 1 cm 2 central region of the model.
In the nonuni form anisotropy model nodes in a region that measured 4 × 8 m m were weakly cou- pled in the transverse fiber direction. The eleetrotonic influences of the spatial variations of activation spread on the spatial distribution of APD were appar- ent in this region, and there was a very strong nega- tive correlation between NAI and APDI in this model.
Our computational results are consistent with the work of Lesh et a1.12 Our simulations, however, add to their findings by demonstrating that cellular un- coupling, in a normal physiologic parameter range, can lead to dispersion of APDs. Lesh et al.'s ~2 simula- tions established intrinsically dispersed APDs with random assignments of slow inward current conduc- tance at different nodes in a two-dimensional mesh. Their models measured 5 m m 2 and were discretized in 100 p~m steps. All points in the model were used for the analysis, including boundary nodes and drive sites. In addition, the major dispersion effects were observed with marked cellular uncoupling at resis- tances of 20,000 f~-cm and higher. The resultant rest: ing space constants were, therefore, smaller than the simulation elements.
By comparison, the physical dimensions in our models were set to correspond to the dimensions of the region examined in the animal experiments. Our models were larger than Lesh et al.'s, 12 1.4 cm 2 com- pared to 5 m m 2, and the analysis was confined to the central 1.0 c m 2 tO minimize initiation site and boundary effects. The internodal spacing in our model was finer than theirs, 72 p~m compared to 100
126 Journal of Electrocardiology Vol. 27 No. 2 April 1994
~m, and this partially reduced discretization errors. We also used normal values for Ril and Rit, with the result that the resting space constants were larger than the simulation elements. With the parameters we used there was a much smaller overall dispersion of APD than Lesh et al. observed, x2 Where there was dispersion of APD in our simulations, however, it was highly correlated spatially with sites of accelera- tion or deceleration of activation spread.
Clinical Implications
Previous studies have documented that tissue an- isotropy plays a role in reentrant arrhyth- mias. 1"4"~4-~6 The emphasis of most studies, how- ever, has been the effect of anisotropy on activation spread. The results of our studies indicate that activa- tion spread through nonuniformly anisotropic tissue has marked effects on the spatial distributions of the RPs, which could also play a role in anisotropic reen- try. Restivo et al. 32 found that 10 ms differences in the RPs between sites that are 1 m m apart were suffi- cient to induce functional block and reentry in dogs with subacute myocardial infarction. We observed RP differences as large as 16 ms between sites with 2 mm separation during some drives, while the RP difference between the same sites was as small as 4 ms during other drives. The striking effects of activa- tion sequence on the spatial distribution of the RPs of normal my0cardium are apparent in the RP maps shown in Figure 2.
The magnitude of the effects of activation spread on the RPs that we observed was greater than that reported by Spach et al. 5'3° They found that altera- tions in the direction of propagation changed APDs by only 0 - 6 ms. Osaka et al. ~9 found 11 ms differ- ences in APDs during longitudinal and transverse propagation. Both Spach et al.'s 5"3° and Osaka et al.'s 19 studies involved isolated tissue preparations rather than intact hearts. As a consequence, only a thin layer of tissue was viable in their preparations, and propagation was confined to the superficial lay- ers. The electrotonic effects of underlying layers of isolated preparations differed from the effects in via- ble three-dimensional preparations. The large three- dimensional mass of electrically active tissue in our intact hearts was probably the cause for greater elec- trotonic effects of activation spread on RPs than the effects reported for isolated two-dimensional prepa- rations. It is also likely that the specific stimulation protocols we used, which resulted in uniform and nonuniform spread of activation, contributed to the large differences in the spatial distributions of the RPs that we found.
We did not assess arrhythmia vulnerability in this study. However, the changes in characteristics of ac- tivation spread and in the spatial distributions of the RPs that we observed during different drives were of an order of magnitude likely to affect inducibility of reentrant arrhythmias. 3x The geometric relation be- tween the nonuniform anisotropic structure of the myocardium and the approaching activation wave- fronts were the likely causes of uniform activation spread with some drives and nonuniform spread with others. Consequently, the magnitude of elec- trotonic effects of activation spread varied during dif- ferent drives and this, in turn, affected the spatial distributions of RPs. Such differences in RP distri- butions during two drives could result in functional block during one but not during another drive. This could in turn enhance or inhibit reentrant arrhyth- mias. Allessie et al. ~ have suggested that the elec- trotonic load at the pivot point between transverse and longitudinal propagation of a reentry wave could contribute to both prolongation of refractoriness and functional block and could affect reentry.
Our findings in normal canine myocardium dem- onstrate that the spatial distributions of RPs are strik- ingly affected by the characteristics of activation spread. Even greater effects would be expected in disease states, such as myocardial infarction, because of the disarray of myocardial structure and intersper- sion of viable myocardial fibers and fibrous tissue. 15 The arrhythmogenic potential of ectopic ventricular complexes has been assessed in terms of frequency of ectopy, coupling interval, and whether or not they are multiform. Our results indicate that the site of origin of ectopy would also affect uniformity of acti- vation spread and RP distributions an d suggest that this could also affect t h e !¢thal potential of ectopic activity. Our findings also provide at least a partial explanation for the clinical observation that reen- trant ventricnlar tachycardias can be induced in pa- tients undergoing electrophysiologic testing during stimulation of some sites but not during stimulation of other sites.
References
1. Allessie MA, Schalij M J, Kirchhof CJHJ et al: Experi- mental electrophysiology and arrhythmogeneity: an- isotropy and ventricular tachycardia. Eur Heart J I0(suppl E):2, 1989
2. Balke CW, Lesh MD et al: Effects of cellular uncoup- ling on conduction in anisotropic canine ventricular myocardium. Circ Res 63:879, I988
3. Clerc L: Directional differences of impulse spread in
Activation Effects of Spatial RP Distributions • Zubair et al. 127
trabecular muscle from mammalian heart. J Physiol 255:335, 1976
4. Dillon SM, Allessie MA, Ursell PC, Wit AL: Influences of anisotropic tissue structure on reentrant circuits in the epicardial border zone of subacnte canine infarcts. Circ Res 63:182, 1988
5, Spach MS, Dolber PC, Heidlage JI: Interaction of inho- mogeneities of repolarization with anisotropic propa- gation in dog atria: a mechanism for both preventing and initiating reentry. Circ Res 65:1612, 1989
6. Spach MS, Miller WT III, Geselowitz DB et al: The discontinuous nature of propagation in normal canine myocardium: evidence for recurrent discontinuities of intracellular resistance that affect the membrane cur- rents. Circ Res 48:39, 1981
7. Spach MS, Miller WT III, Dolber PC et al: The func- tional role of structural complexities in the propaga- tion of depolarization in the atrium of the dog: cardiac conduction distrubances due to discontinuities of ef- fectiwe axial resistivity. Circ Res 50:175, 1982
8. Kadish A, Shinnar M, Moore EN et al: Interaction of fiber orientation and direction of impulse propagation with anatomic barriers in. anisotropic canine myocar- dium. Circulation 78:1478, 1988
9. Pollard AE, Burgess M J, Spitzer KW: Computer simu- lations of myocardium: Effects of intramural fiber ro- tation and inhomogenous conductivity on epicardial activation. Circ Res 72:744, 1993
10. Burgess MJ, Steinhaus BM, Spitzer KW, Ershler PR: Nonuniform epicardial activation and repolarization properties of in vivo canine pulmonary conus. Circ Res 62:233, 1988;
11. Frazier DW, Krassowska W, Chen PS et ah Transmural activations and stimulus potentials in three-dimen- sional anisotropic canine myocardium. Circ Res 63: 135, i{988
12. Lesh MD, Pring M, Spear JI: Cellular uncoupling can unmask dispersion of action potential duration in ven- tricular myocardium. Circ Res 65:1426, 1989
13. Spach MS, Kootsey M: Relating the sodium current and conductance to the shape of the transmembrane and extracellular potential by simulation. IEEE Trans Biomed Eng 32:731, 1985
14. Brugada J, Boersrna L, Kirchhof C et al: Double-wave reentry as a mechanism of acceleration of ventricular tachycardia. Circulation 81:1633, 1990
I5. deBakker JMT, Coronel P, Tasseron Se t ah Ventricu- lar tachycardia in the infarcted Langendorff-perfused human heart: role of the arrangement of surviving car- diac fibers. J Am Coil Ca~rdiol 15:1594, 1990
16. Lammers WJEP, Schalij MJ, Kirchhof CJH, Allessie MA: Quantification of spatial inhomogeneity in con- duction and initiation of reentrant atrial arrhythmias. Am J Physiol 259(Heart Circ Physiol 28):1254, 1990
17. Burgess MJ, Steixthaus BM, Spitzer KW, Green LS: Effects of activation sequence on ventricular refractory
periods of ischemic canine myocardium. J Electrocar- diol 18:323, 1985
19. Osaka T, Kodama I, Tsuboi Net al: Effects of activation sequence and ansiotropic cellular geometry in the re- polarization phase of action potential of dog ventricu- lar muscles. Circulation 76:226, 1987
20. Steinhaus BM, Spitzer KW, Isomura S: Action poten- tial collision in heart tissue: computer simulations and tissue experiments. IEEE Trans Biomed Eng BME 32: 731, 1985
21. Toyoshima H, Burgess M J: Electrotonic interaction during canine ventricular repolarization. Circ Res 3: 348, 1978
22. Ershler PR, Steadman BW, Wyatt RF et al: A 64 lead on line system for clinical and experimental mapping of ventricular activation sequences, p 417. In Proceed- ings of computers in cardiology, Park City, UT, 1984
23. Beeler GW, Renter H: Reconstruction of the action potential of ventricular myocardial fibres. J Physiol 268:177, 1977
24. Drouhard JP, Roberge TA: Revised formulation of the Hodgkin-Huxley representation of the sodium current in cardiac cells. Comp Biomed Res 20:333, 1987
25. Ebihara LH, Johnson EA: Fast sodium current in car- diac muscle: a quantitative description. Biophys J 32: 779, 1980
26. Roth B J: Action potential propagation in a thick strand of cardiac muscle. Circ Res 68:162, 1991
27. Rush S, Larsen LT: A practical algorithm for solving dynamic membrane equations. IEEE Trans Biomed Eng 25:387, 1978
28. Taccardi B, Lux RL, Ershler PR et ah Normal and ab- normal intramural spread of excitation and associated potential distributions. Presented at the Seventeenth International Congress of Electrocardiology, Florence, Italy, September, 1990
29. Colli Franzone P, Guerri L, Taccardi B: Spread of exci- tation in a myocardial volume: simulation studies in a model of anisotropic ventricular muscle activated by point stimulation. J Cardiovasc Electrophysiol 4:144, 1993
30. Spach MS, Dolber PC, Anderson PAW: Multiple re- gional differences in cellular properties that regulate repolarization and contraction in the right atrium of adult and newborn dogs. Circ Res 65:1594, 1989
31. Steinhaus BM, Spitzer KW, Burgess M J, Abildskov JA: Electrotonic interactions in a model of anisotropic cardiac tissue, p 421. In Proceedings of the Society for Computer Simulations. Summer Computer Simula- tions Conference, Reno, NV, 1986
32. Restivo M, Gough WB, E1-Sherif N: Ventricular ar- rhythmias in the subacnte myocardial infarction pe- riod: high-resolution activation and refractory pat- terns of reentrant rhythms. Circ Res 66:131 O, 1989