NUREG/CR-6721 ANL-01/07 Effects of Alloy Chemistry, Cold Work, and Water Chemistry on Corrosion Fatigue and Stress Corrosion Cracking of Nickel Alloys and Welds Argonne National Laboratory U.S. Nuclear Regulatory Commission Office of Nuclear Regulatory Research Washington, DC 20555-0001
Transcript
NUREG/CR-6721 ANL-01/07
Effects of Alloy Chemistry, Cold Work, and WaterChemistry on CorrosionFatigue and StressCorrosion Cracking ofNickel Alloys and Welds
Argonne National Laboratory
U.S. Nuclear Regulatory CommissionOffice of Nuclear Regulatory ResearchWashington, DC 20555-0001
NUREG/CR–6721ANL–01/07
Effects of Alloy Chemistry, Cold Work, andWater Chemistry on Corrosion Fatigue andStress Corrosion Cracking ofNickel Alloys and Welds
Manuscript Completed: March 2001Date Published: 2001
Prepared byO. K. Chopra, W. K. Soppet, and W. J. Shack
Argonne National Laboratory9700 South Cass AvenueArgonne, IL 60439
M. B. McNeil, NRC Project Manager
Prepared for Division of Engineering TechnologyOffice of Nuclear Regulatory ResearchU.S. Nuclear Regulatory CommissionWashington, DC 20555–0001NRC Job Code W6610
UN
ITE
DS
TA
TE
S
NUCLEAR REGULAT
OR
YC
OM
MIS
SIO
N
iii
Effects of Alloy Chemistry, Cold Work, and Water Chemistry on Corrosion Fatigueand Stress Corrosion Cracking of Nickel Alloys and Welds
by
O. K. Chopra, W. K. Soppet, and W. J. Shack
Abstract
Reactor vessel internal components made of nickel–base alloys are susceptible toenvironmentally assisted cracking (EAC). A better understanding of the causes andmechanisms of this cracking may permit less conservative estimates of damage accumulationand requirements on inspection intervals. The objective of this work is to evaluate andcompare the resistance of Alloys 600 and 690 and their welds, such as Alloys 82, 182, 52, and152, to EAC in simulated light water reactor environments. The existing crack growth rate(CGR) data for these alloys under cyclic and constant loads have been evaluated to establishthe effects of alloy chemistry, cold work, and water chemistry. The experimental fatigue CGRsare compared with CGRs that would be expected in air under the same mechanical loadingconditions to obtain a qualitative understanding of the degree and range of conditions forsignificant environmental enhancement in growth rates. The existing stress corrosion cracking(SCC) data on Alloys 600 and 690 and Alloy 82, 182, and 52 welds have been compiled andanalyzed to determine the influence of key parameters on growth rates in simulated PWR andBWR environments. The SCC data for these alloys have been evaluated with correlationsdeveloped by Scott and by Ford and Andresen.
iv
v
Contents
Executive Summary................................................................................................................. ix
Acknowledgments .................................................................................................................... xi
1. Effect of temperature on fatigue CGR of Alloy 600 in air ........................................... 6
2. Effect of rise time on fatigue CGR of Alloy 600 in air ................................................. 6
3. Variation of function C for Alloy 600 with temperature ............................................. 7
4. Variation in product of functions C(T) and S(R) with load ration R at roomtemperature and 289 and 320°C................................................................................. 8
5. Estimated–vs.–experimental values of fatigue crack growth rate of Alloy 600 inair at room temperature and temperatures between 35 and 427°C .......................... 8
6. Variation of function C for Alloy 690 with temperature ............................................. 9
7. Estimated–vs.–experimental values of fatigue crack growth rate of Alloy 690 inair at temperatures between 35 and 380°C ................................................................ 10
8. Experimental values of fatigue crack growth rate of Alloy 182 in air and thoseestimated for Alloy 600 under the same loading conditions ...................................... 11
9. Corrosion fatigue data for Alloy 600 in high–purity water with 300 ppb DO at289°C, >6 ppm DO at 289°C, and >6 ppm DO at 320°C............................................ 14
10. Corrosion fatigue data for Alloy 600 in high–purity water with <10 ppb dissolvedoxygen at 320, 289, and 240°C................................................................................... 15
11. Dependence of CGRs of Alloy 600 at 289 and 320°C on concentration ofdissolved hydrogen in simulated PWR water at load ratio of 0.8 ............................... 16
12. Corrosion fatigue data for Alloy 690 in high–purity water with ≈6000 or 300 ppbdissolved oxygen at 320 and 289°C............................................................................. 17
13. Corrosion fatigue data for Alloy 690 in high–purity water with <10 ppb dissolvedoxygen at 320, 289, and 240°C................................................................................... 18
14. Corrosion fatigue data in simulated PWR water at 243–345°C for Alloys 182,82, and 52.................................................................................................................... 20
15. Corrosion fatigue data for Alloy 182 in high–DO water at 288°C............................... 21
16. Effects of applied stress intensity and cold work on CGRs in Alloy 600 insimulated PWR water at 330°C ................................................................................... 23
17. Effect of temperature on CGRs of Alloy 600 in PWR environment............................. 24
18. Effect of cold work on CGRs in Alloy 600 in simulated PWR water at 340 and350°C............................................................................................................................ 25
19. Effects of applied stress intensity and sulfate additions on CGRs in Alloy 600 inBWR water with NWC at 288°C................................................................................... 26
vii
20. Effect of temperature on crack growth rates of Alloy 600 in high–dissolvedoxygen high–purity water .......................................................................................... 26
21. Effect of applied stress intensity on crack growth rates in Alloy 690 inhigh–purity water at 290°C.......................................................................................... 27
22. Effects of crack orientation relative to the weld dendrites and stress relief onSCC CGRs in Alloy 182 welds in simulated PWR environment.................................. 28
23. Effect of crack orientation relative to weld dendrites on CGRs in Alloy 182 weldsin BWR environment with normal water chemistry.................................................... 29
24. Effect of sulfate addition on CGRs in Alloy 182 welds in BWR environment............. 30
25. Effect of sulfate–bearing NWC and HWC on CGRs in Alloy 182 welds ...................... 30
26. Effect of carbide stabilization parameter on CGRs in Alloy 182 welds in BWRenvironment with normal water chemistry ................................................................. 31
27. Effect of thermal treatment on SCC CGRs in Alloy 182 welds at 288°C in NWCand NWC with 0.1 ppm sulfates.................................................................................. 32
28. Effect of thermal treatment on SCC CGRs in Alloy 182 welds at 275°C in NWC ...... 32
29. SCC susceptibility of Alloy 82 welds in PWR environment at 360°C and BWRNWC with 170–550 ppb DO......................................................................................... 33
30. Effect of applied stress intensity on CGRs in Alloy 600 in simulated PWR orlow–DO water at 290–360°C........................................................................................ 38
31. Effect of applied stress intensity on CGRs in Alloy 600 in high–purity water with≈300 ppb DO at 290 and 320°C.................................................................................. 39
32. Effect of applied stress intensity on CGRs in Alloy 182 weld in high–puritywater with 50 ppb or higher DO at 288°C .................................................................. 40
33. Effect of applied stress intensity on CGRs in Alloy 182 weld in simulated PWRwater at 290–345°C ..................................................................................................... 41
viii
Tables
1. Nominal chemical composition (wt.%) of various nickel alloys .................................. 3
ix
Executive Summary
Reactor vessel internal components made of Ni–base alloys are susceptible toenvironmentally assisted cracking (EAC). A better understanding of the causes andmechanisms of this cracking may permit less conservative estimates of damage accumulationand requirements on inspection intervals. The resistance of high–Ni alloys, e.g., Alloys 600 and690, as well as their welds, i.e., Alloys 82, 182, 52, and 152, to EAC in simulated light waterreactor (LWR) environments has been evaluated. Existing crack growth rate (CGR) data forthese materials under cyclic and constant loads have been analyzed to establish the effects ofalloy chemistry, cold work, and thermal treatment, temperature, water chemistry, load ratio,and applied stress intensity on CGRs.
The fatigue crack growth data in air have been analyzed to develop correlations forestimating the fatigue CGRs of Alloys 600 and 690 as a function of stress intensity factor range∆K, load ratio R, and temperature. The results indicate that in air, the CGRs of these materialsare relatively insensitive to changes in frequency.
For cyclic loads, the experimental CGRs in high–temperature, high–purity water arecompared with CGRs that would be expected in air under the same mechanical loadingconditions to obtain a qualitative understanding of the degree and range of conditions forsignificant environmental enhancement in growth rates. The fatigue CGRs of Alloy 600 areenhanced in high–dissolved–oxygen (DO) water; the environmental enhancement of growthrates does not appear to depend on the material condition. In contrast, environmentalenhancement of CGRs of Alloy 600 in low–DO water seems to depend on material conditionssuch as yield strength and grain boundary coverage of carbides. Material with high yieldstrength and/or low grain boundary coverage of carbides exhibit enhanced CGRs. Correlationshave been developed for estimating the enhancement of CGRs in LWR environments relative tothe CGRs in air under the same loading conditions.
For Alloy 690, the data suggest some enhancements of CGRs in boiling water reactor(BWR) water. Limited data indicate no environmental effects on CGRs in pressurized waterreactor (PWR) water. However, the existing database for Alloy 690 is small and additional testsare needed to verify these results.
The enhancement of fatigue CGRs of high–Ni alloy welds in LWR environments has beendetermined relative to the CGRs that would be expected under the same loading conditions forAlloy 600 in air. Fatigue CGRs of Alloy 82 and 182 welds are enhanced in PWR and BWRenvironments with normal water chemistry (NWC). The results in PWR water show significantscatter, growth rates of welds may be up to a factor of 10 higher than the CGRs predicted forAlloy 600 in air. Hydrogen water chemistry has a beneficial effect on growth rates; CGRs aredecreased by a factor of 5–10 when DO level is decreased from 200 to 10 ppb. The results in aNWC BWR environment show good agreement with the predicted curve for Alloy 600; the datain a PWR environment are higher.
The existing stress corrosion cracking (SCC) data on Ni alloys and welds have beenreviewed to determine the effects of critical parameters such as stress intensity, temperature,material heat treatment, cold work, and water chemistry on CGRs. In general, the SCCsusceptibility of Alloy 82 and 182 welds is greater than that of Alloy 600. Limited data suggest
x
that the temperature dependence of growth rates is similar to that for Alloy 600; CGRs of Alloy82 or 182 welds can be represented by an activation energy of 130 kJ/mole. The SCC datahave been evaluated with the Scott or Ford/Andresen models. Although the conceptual basesunderlying the two models differ significantly, by appropriately choosing the constants in themodels, the predicted CGRs are reasonably consistent with the available data for SCC in LWRenvironments.
xi
Acknowledgments
This work is sponsored by the Office of Nuclear Regulatory Research, U.S. NuclearRegulatory Commission, under Job Code W6610; Program Manager: M. B. McNeil.
xii
1
1 Introduction
High–Ni alloys have experienced general corrosion (tube wall thinning), localizedintergranular attack (IGA), and stress corrosion cracking (SCC) in light water reactors (LWRs).Cracking has occurred in high–Ni alloys, e.g., Alloys 600 and X 750, as well as their welds, e.g.,Alloys 82 and 182, that are used in applications such as instrument nozzles and heaterthermal sleeves in the pressurizer1 and penetrations for control–rod drive mechanisms in thereactor vessel closure heads in the primary system of pressurized water reactors (PWRs),2 andin dissimilar–metal welds between stainless steel (SS) piping and low–alloy steel nozzles, in jetpump hold–down beams,3 and in shroud support access hole covers4 in boiling water reactors(BWRs). In pressurized water reactors (PWRs), cracks in Alloy 600 instrument nozzles andheater thermal sleeves have generally been axial, but circumferential cracks have also beenreported in instrument nozzles at several foreign plants.2 In BWRs, cracking has occurredboth in the base metal and welds, primarily in creviced regions,3,4 Primary–water SCC of Alloy600 steam generator tubes in PWRs at roll transitions and U–bends and in tube plugs5 is awidespread problem that has been studied intensively. Secondary–side IGA6 and axial andcircumferential SCC7 have occurred in Alloy 600 tubes at tube support plates in many steamgenerators. Alloy 690 with a higher Cr content and greater resistance to SCC has beenproposed as an alternate to Alloy 600.
Alloys 600 and 690, in general, undergo differing thermomechanical processing forapplications other than steam generator tubes. Because environmental degradation of thealloys in many cases is very sensitive to processing, further evaluation of SCC is needed. Inaddition, experience strongly suggests that materials that are susceptible to SCC are alsosusceptible to environmental degradation of fatigue life and fatigue–crack growth properties. Aprogram is being conducted at Argonne National Laboratory (ANL) to evaluate the resistance ofAlloys 600 and 690 and their welds to environmentally assisted cracking (EAC) in simulatedLWR coolant environments. Fracture mechanics crack growth rate (CGR) tests are beingconducted on compact–tension specimens of Alloys 600 and 690 in oxygenated and deaeratedwater that contained B, Li, and low concentrations of dissolved H at 289–380°C. Theexperimental details and results from this study are presented elsewhere.8-12
The existing CGR data for Alloys 600 and 690 and their weld metals Alloys 82, 182, 52,and 152, under cyclic and constant loading conditions have been compiled and evaluated toestablish the effects of alloy type, temperature, load ratio R, stress intensity K, and dissolvedoxygen (DO) level. The experimental CGRs under cyclic loading have been compared withCGRs that would be expected in air under the same mechanical loading conditions to obtain aqualitative understanding of the degree and range of conditions that are necessary forsignificant environmental enhancement in growth rates.
2
3
2 Material Characterization
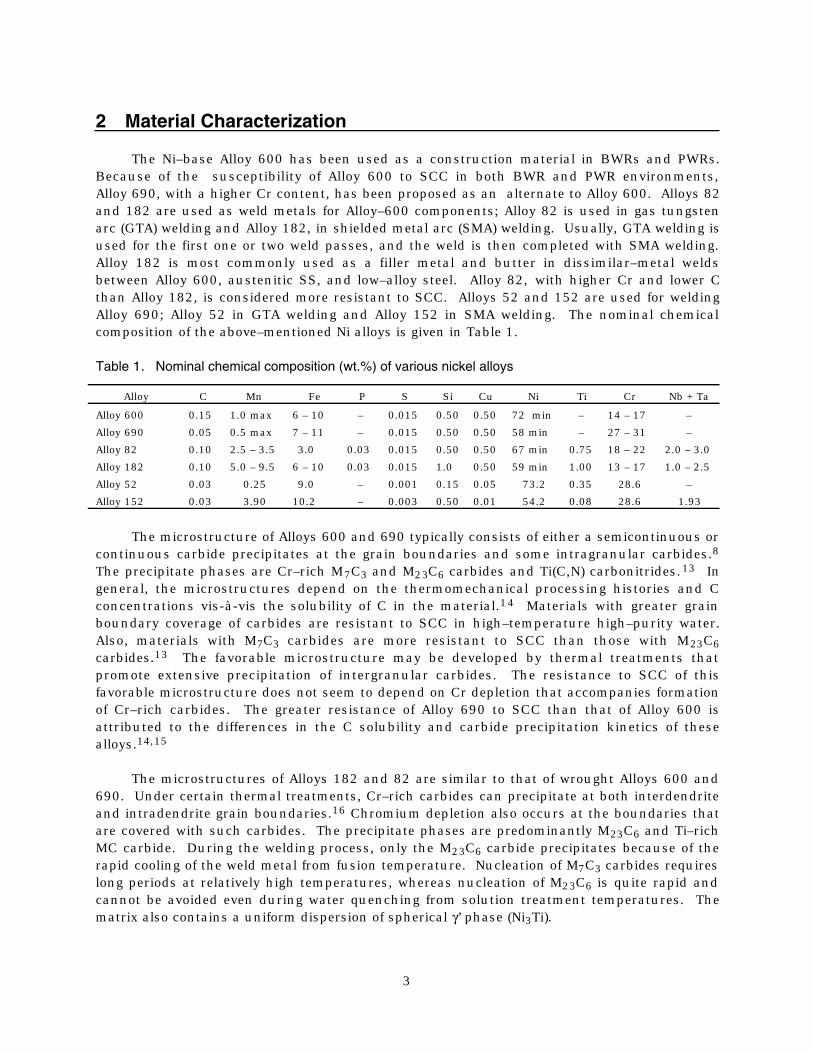
The Ni–base Alloy 600 has been used as a construction material in BWRs and PWRs.Because of the susceptibility of Alloy 600 to SCC in both BWR and PWR environments,Alloy 690, with a higher Cr content, has been proposed as an alternate to Alloy 600. Alloys 82and 182 are used as weld metals for Alloy–600 components; Alloy 82 is used in gas tungstenarc (GTA) welding and Alloy 182, in shielded metal arc (SMA) welding. Usually, GTA welding isused for the first one or two weld passes, and the weld is then completed with SMA welding.Alloy 182 is most commonly used as a filler metal and butter in dissimilar–metal weldsbetween Alloy 600, austenitic SS, and low–alloy steel. Alloy 82, with higher Cr and lower Cthan Alloy 182, is considered more resistant to SCC. Alloys 52 and 152 are used for weldingAlloy 690; Alloy 52 in GTA welding and Alloy 152 in SMA welding. The nominal chemicalcomposition of the above–mentioned Ni alloys is given in Table 1.
Table 1. Nominal chemical composition (wt.%) of various nickel alloys
Alloy C Mn Fe P S Si Cu Ni Ti Cr Nb + Ta
Alloy 600 0.15 1.0 max 6 – 10 – 0.015 0.50 0.50 72 min – 14 – 17 –
Alloy 690 0.05 0.5 max 7 – 11 – 0.015 0.50 0.50 58 min – 27 – 31 –
The microstructure of Alloys 600 and 690 typically consists of either a semicontinuous orcontinuous carbide precipitates at the grain boundaries and some intragranular carbides.8
The precipitate phases are Cr–rich M7C3 and M23C6 carbides and Ti(C,N) carbonitrides.13 Ingeneral, the microstructures depend on the thermomechanical processing histories and Cconcentrations vis-à-vis the solubility of C in the material.14 Materials with greater grainboundary coverage of carbides are resistant to SCC in high–temperature high–purity water.Also, materials with M7C3 carbides are more resistant to SCC than those with M23C6carbides.13 The favorable microstructure may be developed by thermal treatments thatpromote extensive precipitation of intergranular carbides. The resistance to SCC of thisfavorable microstructure does not seem to depend on Cr depletion that accompanies formationof Cr–rich carbides. The greater resistance of Alloy 690 to SCC than that of Alloy 600 isattributed to the differences in the C solubility and carbide precipitation kinetics of thesealloys.14,15
The microstructures of Alloys 182 and 82 are similar to that of wrought Alloys 600 and690. Under certain thermal treatments, Cr–rich carbides can precipitate at both interdendriteand intradendrite grain boundaries.16 Chromium depletion also occurs at the boundaries thatare covered with such carbides. The precipitate phases are predominantly M23C6 and Ti–richMC carbide. During the welding process, only the M23C6 carbide precipitates because of therapid cooling of the weld metal from fusion temperature. Nucleation of M7C3 carbides requireslong periods at relatively high temperatures, whereas nucleation of M23C6 is quite rapid andcannot be avoided even during water quenching from solution treatment temperatures. Thematrix also contains a uniform dispersion of spherical γ’ phase (Ni3Ti).
4
The greater susceptibility of Alloy 182 to SCC than Alloy 82 has been attributed todifferences in Cr depletion observed in the two alloys because of differences in theircomposition. Alloy 182 contains higher concentrations of C and Fe and a lower concentrationof Cr, all of which enhance Cr depletion during carbide precipitation.
For Alloys 600 and 690, the critical compositional variables that may influence EAC ofthese alloys in LWR environments include the concentrations of C, P, and S. For Ni–alloywelds, the critical compositional variables include carbide stabilization parameter N, and theconcentrations of P and S. The parameter N is defined as
N = 0.13 (Nb + 2Ti)/C (1)
where Nb, Ti, and C are the concentrations of the respective elements in wt.%.
5
3 Fatigue Crack Growth Rates in Air
3.1 Alloy 600
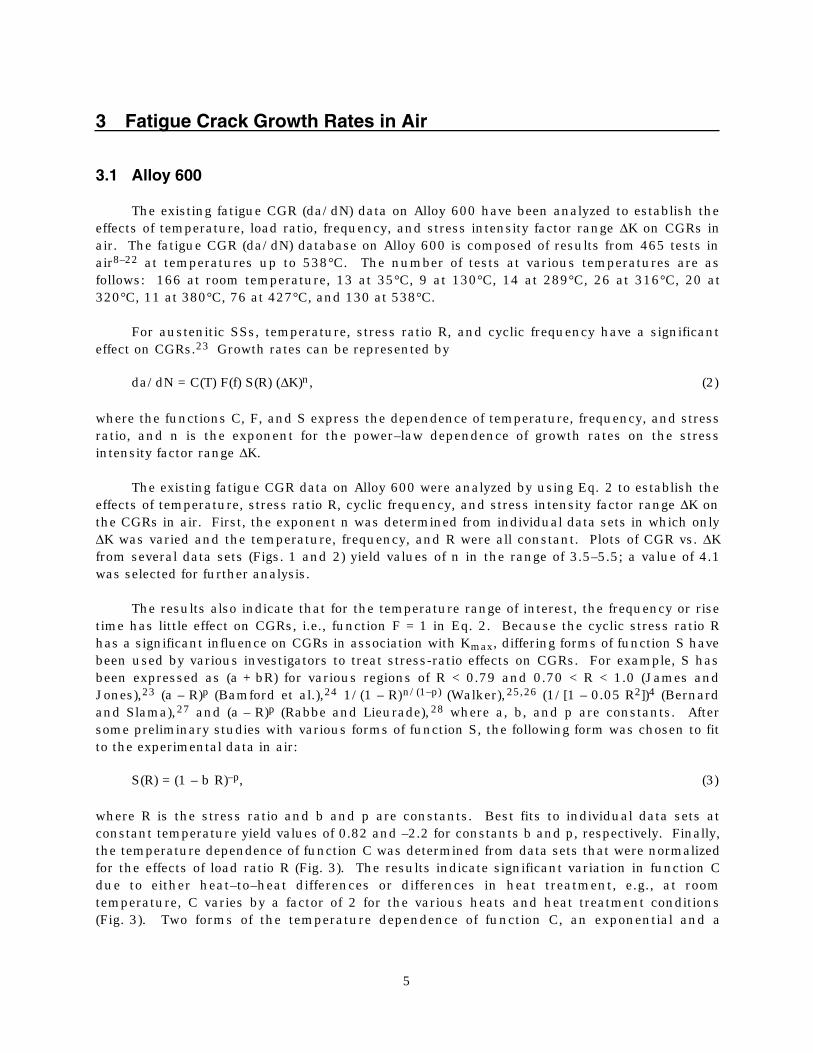
The existing fatigue CGR (da/dN) data on Alloy 600 have been analyzed to establish theeffects of temperature, load ratio, frequency, and stress intensity factor range ∆K on CGRs inair. The fatigue CGR (da/dN) database on Alloy 600 is composed of results from 465 tests inair8–22 at temperatures up to 538°C. The number of tests at various temperatures are asfollows: 166 at room temperature, 13 at 35°C, 9 at 130°C, 14 at 289°C, 26 at 316°C, 20 at320°C, 11 at 380°C, 76 at 427°C, and 130 at 538°C.
For austenitic SSs, temperature, stress ratio R, and cyclic frequency have a significanteffect on CGRs.23 Growth rates can be represented by
da/dN = C(T) F(f) S(R) (∆K)n, (2)
where the functions C, F, and S express the dependence of temperature, frequency, and stressratio, and n is the exponent for the power–law dependence of growth rates on the stressintensity factor range ∆K.
The existing fatigue CGR data on Alloy 600 were analyzed by using Eq. 2 to establish theeffects of temperature, stress ratio R, cyclic frequency, and stress intensity factor range ∆K onthe CGRs in air. First, the exponent n was determined from individual data sets in which only∆K was varied and the temperature, frequency, and R were all constant. Plots of CGR vs. ∆Kfrom several data sets (Figs. 1 and 2) yield values of n in the range of 3.5–5.5; a value of 4.1was selected for further analysis.
The results also indicate that for the temperature range of interest, the frequency or risetime has little effect on CGRs, i.e., function F = 1 in Eq. 2. Because the cyclic stress ratio Rhas a significant influence on CGRs in association with Kmax, differing forms of function S havebeen used by various investigators to treat stress-ratio effects on CGRs. For example, S hasbeen expressed as (a + bR) for various regions of R < 0.79 and 0.70 < R < 1.0 (James andJones),23 (a – R)p (Bamford et al.),24 1/(1 – R)n/(1–p) (Walker),25,26 (1/[1 – 0.05 R2])4 (Bernardand Slama),27 and (a – R)p (Rabbe and Lieurade),28 where a, b, and p are constants. Aftersome preliminary studies with various forms of function S, the following form was chosen to fitto the experimental data in air:
S(R) = (1 – b R)–p, (3)
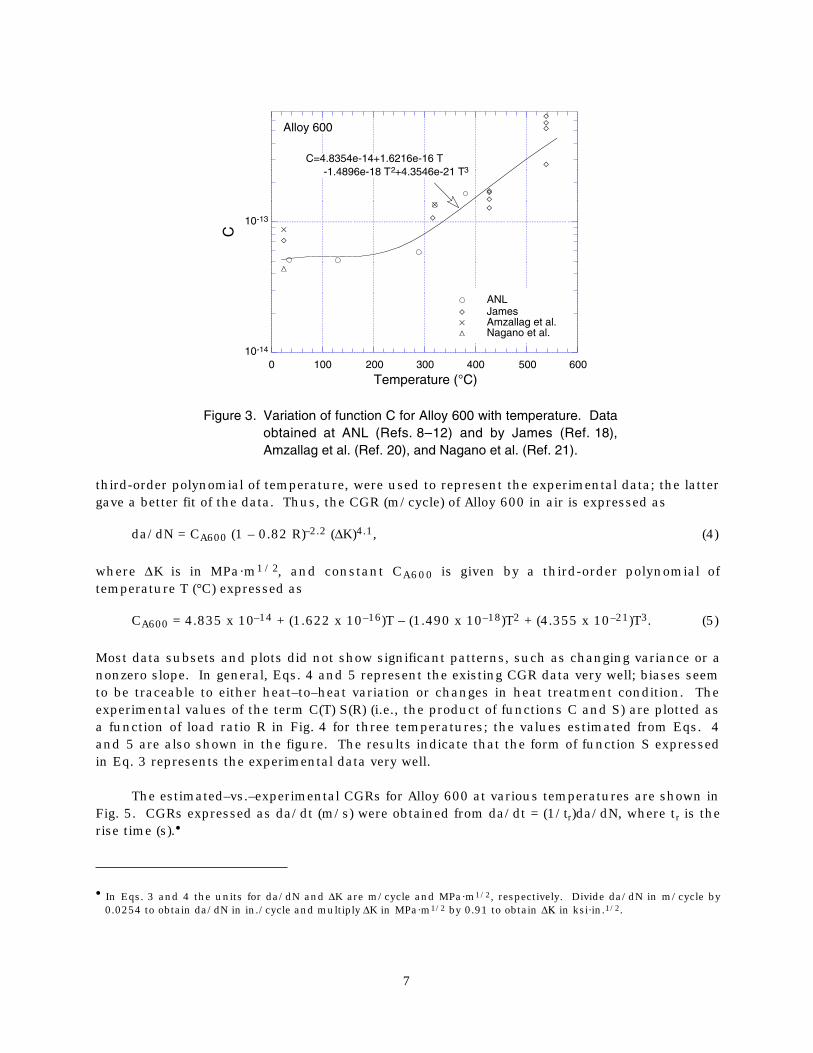
where R is the stress ratio and b and p are constants. Best fits to individual data sets atconstant temperature yield values of 0.82 and –2.2 for constants b and p, respectively. Finally,the temperature dependence of function C was determined from data sets that were normalizedfor the effects of load ratio R (Fig. 3). The results indicate significant variation in function Cdue to either heat–to–heat differences or differences in heat treatment, e.g., at roomtemperature, C varies by a factor of 2 for the various heats and heat treatment conditions(Fig. 3). Two forms of the temperature dependence of function C, an exponential and a
6
10-8
10-7
10-6
6 8 10 30 50
21°C 0.50 s 4.01316°C 0.75 s 5.49427°C 0.75 s 4.34538°C 0.75 s 3.95
Cra
ck G
row
th R
ate
(m/c
ycle
)
∆ K (MPa m1/2 )
Alloy 600AirR = 0.05
Rise Time n
10-9
10-8
10-7
10-6
6 8 10 30 50
21°C 0.05 s 4.11
427°C 0.07 s 3.81C
rack
Gro
wth
Rat
e (m
/cyc
le)
∆ K (MPa m1/2 )
Alloy 600AirR = 0.6
Rise Time n
Figure 1. Effect of temperature on fatigue CGR of Alloy 600 in air. Data at 21°C from Ref. 22 (Was andBallinger) and at higher temperatures from Ref. 18 (James).
10-8
10-7
10-6
6 8 10 30 50
0.05 s 5.480.10 s 4.230.50 s 4.010.05 s 4.48
Cra
ck G
row
th R
ate
(m/c
ycle
)
∆ K (MPa m1/2)
Alloy 600RT AirR = 0.05
Rise Time n
10-8
10-7
10-6
6 8 10 30 50
0.07 s 5.250.75 s 5.04
Cra
ck G
row
th R
ate
(m/c
ycle
)
∆ K (MPa m1/2 )
Alloy 600427°C AirR = 0.05
Rise Time n
Figure 2. Effect of rise time on fatigue CGR of Alloy 600 in air. Data from Ref. 18 (James).
7
10-14
10-13
0 100 200 300 400 500 600
ANLJamesAmzallag et al.Nagano et al.
C
Temperature (°C)
C=4.8354e-14+1.6216e-16 T -1.4896e-18 T2+4.3546e-21 T3
Alloy 600
Figure 3. Variation of function C for Alloy 600 with temperature. Dataobtained at ANL (Refs. 8–12) and by James (Ref. 18),Amzallag et al. (Ref. 20), and Nagano et al. (Ref. 21).
third-order polynomial of temperature, were used to represent the experimental data; the lattergave a better fit of the data. Thus, the CGR (m/cycle) of Alloy 600 in air is expressed as
da/dN = CA600 (1 – 0.82 R)–2.2 (∆K)4.1, (4)
where ∆K is in MPa·m1/2, and constant CA600 is given by a third-order polynomial oftemperature T (°C) expressed as
CA600 = 4.835 x 10⁻¹⁴ + (1.622 x 10⁻¹⁶)T – (1.490 x 10⁻¹⁸)T2 + (4.355 x 10⁻²¹)T3. (5)
Most data subsets and plots did not show significant patterns, such as changing variance or anonzero slope. In general, Eqs. 4 and 5 represent the existing CGR data very well; biases seemto be traceable to either heat–to–heat variation or changes in heat treatment condition. Theexperimental values of the term C(T) S(R) (i.e., the product of functions C and S) are plotted asa function of load ratio R in Fig. 4 for three temperatures; the values estimated from Eqs. 4and 5 are also shown in the figure. The results indicate that the form of function S expressedin Eq. 3 represents the experimental data very well.
The estimated–vs.–experimental CGRs for Alloy 600 at various temperatures are shown inFig. 5. CGRs expressed as da/dt (m/s) were obtained from da/dt = (1/tr)da/dN, where tr is therise time (s).•
• In Eqs. 3 and 4 the units for da/dN and ∆K are m/cycle and MPa·m1/2, respectively. Divide da/dN in m/cycle by0.0254 to obtain da/dN in in./cycle and multiply ∆K in MPa·m1/2 by 0.91 to obtain ∆Κ in ksi·in.1/2.
8
10-14
10-13
10-12
0.0 0.2 0.4 0.6 0.8 1.0
Room Temp.Estimated
C(T
) S
(R)
Load Ratio, R
Alloy 600Air
10-14
10-13
10-12
0.0 0.2 0.4 0.6 0.8 1.0
320°C289°CEstd. 289°CEstd. 320°C
C(T
) S
(R)
Load Ratio, R
Alloy 600Air
(a) (b)
Figure 4. Variation in product of functions C(T) and S(R) with load ration R at (a) roomtemperature and (b) 289 and 320°C
10-11
10-10
10 -9
10 -8
10 -7
10 -6
10 -5
10 -11 10-10 10-9 10-8 10 -7 10 -6 10 -5
21°C
Est
imat
ed C
rack
Gro
wth
Rat
e (m
/cyc
le)
Experimental Crack Growth Rate (m/cycle)
Alloy 600
10-11
10-10
10 -9
10 -8
10 -7
10 -6
10 -5
10 -11 10-10 10-9 10-8 10 -7 10 -6 10 -5
35°C ANL130°C ANL289°C ANL316°C James320°C ANL/ Amzallag et al.380°C ANL427°C James
Est
imat
ed C
rack
Gro
wth
Rat
e (m
/s)
Experimental Crack Growth Rate (m/s)
Alloy 600
(a) (b)
Figure 5. Estimated–vs.–experimental values of fatigue crack growth rate of Alloy 600 in air at(a) room temperature and (b) temperatures between 35 and 427°C. Data obtained atANL (Refs. 8–12) and by James (Ref. 18), EPRI (Ref. 19), and Amzallag et al. (Ref. 20).
9
3.2 Alloy 690
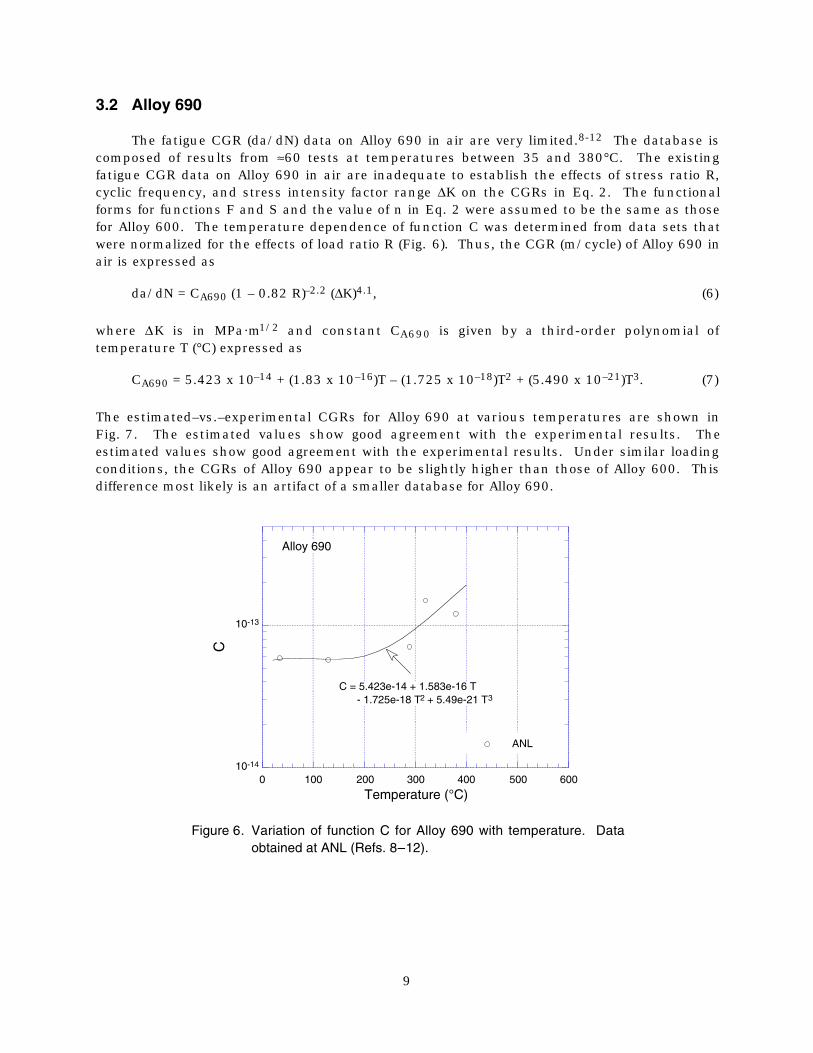
The fatigue CGR (da/dN) data on Alloy 690 in air are very limited.8-12 The database iscomposed of results from ≈60 tests at temperatures between 35 and 380°C. The existingfatigue CGR data on Alloy 690 in air are inadequate to establish the effects of stress ratio R,cyclic frequency, and stress intensity factor range ∆K on the CGRs in Eq. 2. The functionalforms for functions F and S and the value of n in Eq. 2 were assumed to be the same as thosefor Alloy 600. The temperature dependence of function C was determined from data sets thatwere normalized for the effects of load ratio R (Fig. 6). Thus, the CGR (m/cycle) of Alloy 690 inair is expressed as
da/dN = CA690 (1 – 0.82 R)–2.2 (∆K)4.1, (6)
where ∆K is in MPa·m1/2 and constant CA690 is given by a third-order polynomial oftemperature T (°C) expressed as
CA690 = 5.423 x 10⁻¹⁴ + (1.83 x 10⁻¹⁶)T – (1.725 x 10⁻¹⁸)T2 + (5.490 x 10⁻²¹)T3. (7)
The estimated–vs.–experimental CGRs for Alloy 690 at various temperatures are shown inFig. 7. The estimated values show good agreement with the experimental results. Theestimated values show good agreement with the experimental results. Under similar loadingconditions, the CGRs of Alloy 690 appear to be slightly higher than those of Alloy 600. Thisdifference most likely is an artifact of a smaller database for Alloy 690.
10-14
10-13
0 100 200 300 400 500 600
ANL
C
Temperature (°C)
C = 5.423e-14 + 1.583e-16 T - 1.725e-18 T2 + 5.49e-21 T3
Alloy 690
Figure 6. Variation of function C for Alloy 690 with temperature. Dataobtained at ANL (Refs. 8–12).
10
10-11
10-10
10-9
10-8
10-7
10-6
10-5
10-11 10-10 10-9 10-8 10-7 10-6 10-5
35°C130°C289°C320°C380°C
Est
imat
ed C
rack
Gro
wth
Rat
e (m
/s)
Experimental Crack Growth Rate (m/s)
Alloy 690
Figure 7. Estimated–vs.–experimental values of fatigue crack growthrate of Alloy 690 in air at temperatures between 35 and 380°C.Data obtained at ANL (Refs. 8–12).
3.3 Weld Metals
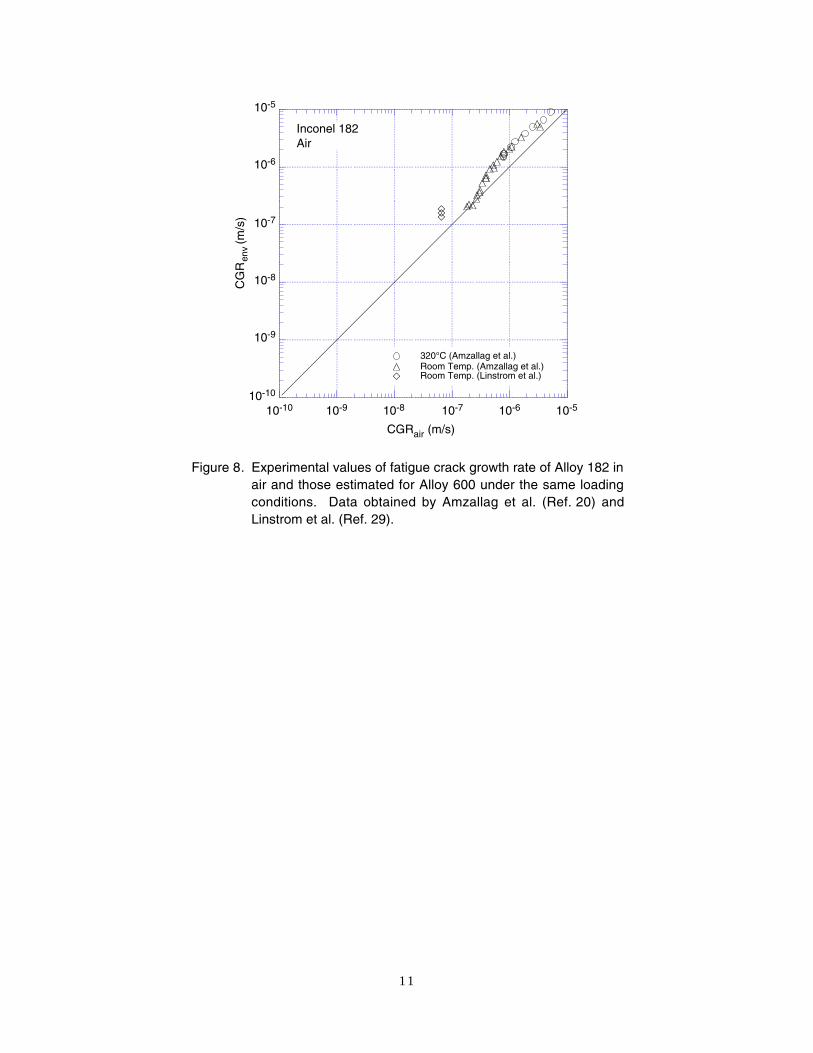
For weld metals, the fatigue CGR (da/dN) database in air is composed of results from ≈35tests on as–welded Alloy 182 tested room temperature and 320°C.20,29 The experimental CGRsfor Alloy 182 and those estimated from Eqs. 4 and 5 for Alloy 600 for the same loadingconditions, are plotted in Fig. 8. The results indicate that under similar loading conditions, thefatigue CGRs of Alloy 182 are a factor of ≈2 higher than those for Alloy 600. The effect oftemperature on growth rates is similar to that for Alloy 600. Fatigue crack growth data forAlloys 82, 52, and 152 in air are not available.
11
10-10
10-9
10-8
10-7
10-6
10-5
10-10 10-9 10-8 10-7 10-6 10-5
320°C (Amzallag et al.)Room Temp. (Amzallag et al.)Room Temp. (Linstrom et al.)
CG
Ren
v (m
/s)
CGRair (m/s)
Inconel 182Air
Figure 8. Experimental values of fatigue crack growth rate of Alloy 182 inair and those estimated for Alloy 600 under the same loadingconditions. Data obtained by Amzallag et al. (Ref. 20) andLinstrom et al. (Ref. 29).
12
13
4 Fatigue Crack Growth in LWR Environments
4.1 Alloy 600
Fatigue crack growth experiments have been performed on Alloy 600 to determine theeffects of temperature, load ratio, stress intensity, material heat treatment, and waterchemistry on CGR. The existing database8–11,19,20,30–36 consists of results of ≈800 tests onseveral heats of Alloy 600 under various heat treatment conditions. The tests were conductedin high–purity water at temperatures between 240 and 325°C; ≈600 tests have been conductedat 289°C. The loading conditions include load ratio R = 0.05–0.95, maximum stress intensityKmax = 10–96 MPa·m1/2, stress intensity factor range ∆K = 1.4–79 MPa·m1/2, and rise timetr = 0.05–800 s. To obtain a qualitative understanding of the degree of enhancement and therange of conditions over which significant environmental enhancement is observed, it is helpfulto plot the observed CGRs against the CGRs that would be expected in air under the sameloading conditions, i.e., the same ∆K, R, and tr.
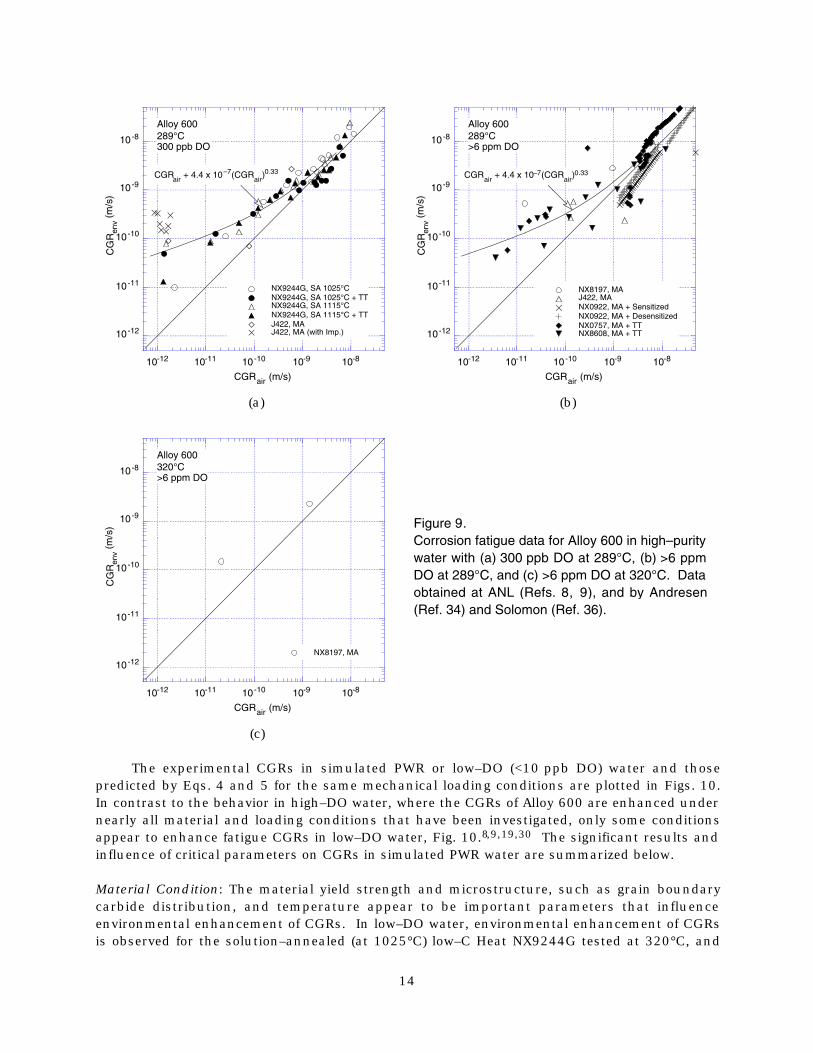
The experimental CGRs in high–DO (≥300 ppb DO) water and those predicted by Eqs. 4and 5 for the same mechanical loading conditions are plotted in Fig. 9.8,9,34,36 The significantresults and influence of critical parameters on CGRs in high–DO water are summarized below.
Water Chemistry: The fatigue CGRs of Alloy 600 are enhanced in high–DO water; see Fig. 9.Growth rates increase slightly when DO level is increased from 300 to 6000 ppb or when15–100 ppb sulfates are added to the water.8
Material Condition: The environmental enhancement of growth rates does not appear to dependon either the C content or heat treatment of the material. For example, the CGRs of a low–Cheat (NX9244G) are comparable to those of high–C heats (e.g., NX8197, NX8844J). The high–Cheats contain continuous (NX8197) or semicontinuous (NX8844J, J422) carbide precipitationat the grain boundaries whereas, because of the low C content (≈0.03%) and relatively highsolution–annealing temperatures (1025 or 1115°C), Heat NX9244G does not containintergranular carbides.9 Also, thermal treatment for 24 h at 600°C has no effect on the CGRsin high–DO water; the growth rates of solution–annealed Heat NX9244G are approximately thesame with or without thermal treatment; see Fig. 9a.9
Mechanical Loading: The results indicate that the effects of environment on growth rates inhigh–DO water are greater under loading conditions that correspond to <1 x 10⁻⁹ m/s CGRs inair; under certain loading conditions the CGRs in high–DO water may be enhanced by nearlytwo orders of magnitude.
Temperature: Limited data suggest that in high–DO water, the growth rates at 320°C arecomparable to those at 289°C. However, nearly all of the fatigue crack growth data on Alloy600 have been obtained at 289°C, and additional tests at 320°C are needed to verify thetemperature dependence of growth rates in high–DO water.
14
10-12
10-11
10-10
10-9
10-8
10-12 10-11 10-10 10-9 10-8
NX9244G, SA 1025°CNX9244G, SA 1025°C + TTNX9244G, SA 1115°CNX9244G, SA 1115°C + TTJ422, MAJ422, MA (with Imp.)
CG
Ren
v (m
/s)
CGRair (m/s)
Alloy 600 289°C300 ppb DO
CGRair + 4.4 x 10⁻⁷(CGRair)0.33
10-12
10-11
10-10
10-9
10-8
10-12 10-11 10-10 10-9 10-8
NX8197, MAJ422, MANX0922, MA + SensitizedNX0922, MA + DesensitizedNX0757, MA + TTNX8608, MA + TT
CG
Ren
v (m
/s)
CGRair (m/s)
Alloy 600 289°C>6 ppm DO
CGRair + 4.4 x 10⁻⁷(CGRair)0.33
(a) (b)
10-12
10-11
10-10
10-9
10-8
10-12 10-11 10-10 10-9 10-8
NX8197, MA
CG
Ren
v (m
/s)
CGRair (m/s)
Alloy 600 320°C>6 ppm DO
Figure 9.Corrosion fatigue data for Alloy 600 in high–puritywater with (a) 300 ppb DO at 289°C, (b) >6 ppmDO at 289°C, and (c) >6 ppm DO at 320°C. Dataobtained at ANL (Refs. 8, 9), and by Andresen(Ref. 34) and Solomon (Ref. 36).
(c)
The experimental CGRs in simulated PWR or low–DO (<10 ppb DO) water and thosepredicted by Eqs. 4 and 5 for the same mechanical loading conditions are plotted in Figs. 10.In contrast to the behavior in high–DO water, where the CGRs of Alloy 600 are enhanced undernearly all material and loading conditions that have been investigated, only some conditionsappear to enhance fatigue CGRs in low–DO water, Fig. 10.8,9,19,30 The significant results andinfluence of critical parameters on CGRs in simulated PWR water are summarized below.
Material Condition: The material yield strength and microstructure, such as grain boundarycarbide distribution, and temperature appear to be important parameters that influenceenvironmental enhancement of CGRs. In low–DO water, environmental enhancement of CGRsis observed for the solution–annealed (at 1025°C) low–C Heat NX9244G tested at 320°C, and
15
for the mill–annealed high–C Heat J422 tested at 289°C, Figs. 10a and b. However, the low–CHeat NX9244G, when solution annealed at 1115°C and tested under the same loadingconditions, shows no effect of environment on growth rates, Fig. 10a. The two solutiontreatments exhibit similar grain boundary carbide distribution but the material that wassolution annealed at 1025°C exhibits higher yield strength than that annealed at 1115°C.9
Materials with poor grain boundary coverage of carbides and high yield strength are known toexhibit high susceptibility to SCC in low–DO PWR environments.37,38 At 289°C, not all high–Cheats show environmental enhancement of CGRs; Heats NX8197 and NX8844J show no effectof environment on growth rates. The enhanced growth rates of Heat J422 may be attributed tothe higher yield strength of the material than that for Heats NX8197 or NX8844J.9
10-12
10-11
10-10
10-9
10-8
10-12 10-11 10-10 10-9 10-8
NX8197, MANX9244G, SA 1025°C + TTNX9244G, SA 1025°CNX9244G, SA 1115°C + TTNX9244G, SA 1115°CNX8844J-26, SA 1038°C
CG
Ren
v (m
/s)
CGRair (m/s)
Alloy 600320°C <10 ppb DO
CGRair + 4.4 x 10⁻⁷(CGRair)0.33
10-12
10-11
10-10
10-9
10-8
10-12 10-11 10-10 10-9 10-8
NX8197, MAJ422, MANX8844J-26, SA 1038°CNX 0922, MA + Sensitized
CG
Ren
v (m
/s)
CGRair (m/s)
Alloy 600 289°C<10 ppb DO
(a) (b)
10-12
10-11
10-10
10-9
10-8
10-12 10-11 10-10 10-9 10-8
NX8844J-26, SA 1038°C8034G-1A, MA
CG
Ren
v (m
/s)
CGRair (m/s)
Alloy 600 240°C<10 ppb DO
Figure 10.Corrosion fatigue data for Alloy 600 in high–puritywater with <10 ppb dissolved oxygen at (a) 320,(b) 289, and (c) 240°C. Data obtained at ANL(Refs. 8, 9), and by Ballinger et al. (Ref. 19) andJames and Mills (Ref. 30).
(c)
16
Temperature: The fatigue CGR data in Fig. 10 suggest that environmental enhancement of CGRis greater at higher temperature. However, the existing data are inadequate to determine theeffect of temperature on the fatigue CGR of Alloy 600 in low–DO water. For example, tests onsusceptible heats of material have either not been conducted at low temperatures or themechanical loading conditions are such that the contributions of environmental effects aremoderate. At ≈240°C, all of the tests have been conducted under loading conditions thatcorrespond to growth rates >1 x 10⁻¹⁰ m/s in air.9,30 For these conditions, the growth rates ofmill–annealed Heat 8034G are enhanced by a factor of ≈2 in low–DO water.30
Dissolved Hydrogen: The dissolved H content in water can influence the nature of corrosionproduct films on Ni alloys, and thereby play a role in the crack growth process. A decrease inthe bulk H content in water leads to an increase in the corrosion potential of the material andthus to increased oxidation of the material and higher CGRs. The effects of dissolved hydrogenin low–DO water on CGRs of Alloy 600 have been investigated.8,39 Studies on hot–worked andmill–annealed Alloy 600 tested in simulated PWR water39 indicate that the CGRs increase by afactor of 1.5 when dissolved H content in water is decreased from 25 to 0 cm3/kg of water.Similar results have also been observed in mill–annealed Alloy 600 (Heat NX8197) tested insimulated PWR water;8 CGRs increase when dissolved H is decreased from 58 to 3 cm3/kg ofwater, Fig. 11. However, the significance of these results on enhanced CGRs in PWRenvironments is not clear; the results for Heat NX8197, shown in Fig. 10, show little or noeffect of environment on CGRs at both 289 and 320°C.
Figure 11.Dependence of CGRs of Alloy 600 at 289and 320°C on concentration of dissolvedhydrogen in simulated PWR water at loadratio of 0.8. Data obtained at ANL (Ref. 8).
Mechanical Loading: In PWR environments, high load ratios, e.g., 0.75 or higher, and lowfrequencies produce intergranular cracking, and low load ratios, e.g., 0.5 and lower, and highfrequencies produce transgranular cracking.39 The differing fracture morphology has beenexplained on the basis of the thermodynamic conditions at the crack tip, i.e., intergranularcracking is enhanced when the crack tip environment contains steam H bubbles.
The existing fatigue crack growth data have been analyzed to develop correlations forestimating the enhancement of CGRs in LWR environments relative to the CGRs in air. Fordand Andresen40,41 argue that there are fundamental reasons to expect that in LWRenvironments, the CGRs of austenitic SSs and Ni alloys should be of the form
17
CGRenv = CGRair + A( ̇εCT )m, (8)
where CGRenv is the CGR in the environment, CGRair is the CGR in air (a relatively inertenvironment), and ̇εCT is the crack tip strain rate. The parameters A and m depend on thematerial and the environment. Shoji42 has argued that under cyclic loading, ̇εCT isproportional to CGRair. In this case, Eq. 8 can be written as
CGRenv = CGRair + A(CGRair)m, (9)
which is a form convenient for comparisons with experimental data and which has been widelyused to correlate CGR data. Fitting the fatigue crack growth data on Alloy 600 in high–puritywater with ≈300 ppb DO to Eq. 9 by minimizing the least–squares error between theexperimental and predicted CGRs gives the values of 4.4 x 10⁻⁷ and 0.33 for A and m,respectively.10 The CGRs in the environment estimated from Eq. 9 and the best–fit values ofconstants A and m are plotted in Fig. 9. The same correlation may also be used to representenvironmental enhancement of CGRs of the susceptible heats of Alloy 600 in low–DO water.
4.2 Alloy 690
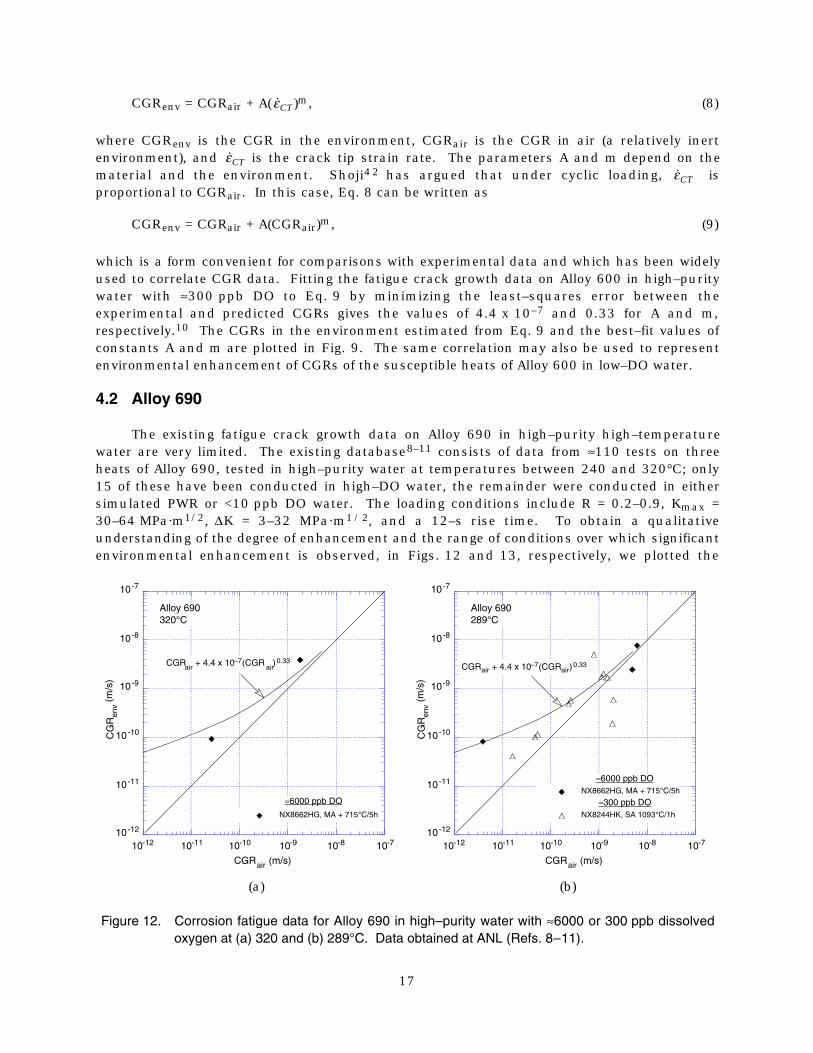
The existing fatigue crack growth data on Alloy 690 in high–purity high–temperaturewater are very limited. The existing database8–11 consists of data from ≈110 tests on threeheats of Alloy 690, tested in high–purity water at temperatures between 240 and 320°C; only15 of these have been conducted in high–DO water, the remainder were conducted in eithersimulated PWR or <10 ppb DO water. The loading conditions include R = 0.2–0.9, Kmax =30–64 MPa·m1/2, ∆K = 3–32 MPa·m1/2, and a 12–s rise time. To obtain a qualitativeunderstanding of the degree of enhancement and the range of conditions over which significantenvironmental enhancement is observed, in Figs. 12 and 13, respectively, we plotted the
10-12
10-11
10-10
10-9
10-8
10-7
10-12 10-11 10-10 10-9 10-8 10-7
NX8662HG, MA + 715°C/5h
CG
Ren
v (m
/s)
CGRair (m/s)
Alloy 690320°C
≈6000 ppb DO
CGRair + 4.4 x 10⁻⁷(CGR air)0.33
10-12
10-11
10-10
10-9
10-8
10-7
10-12 10-11 10-10 10-9 10-8 10-7
NX8662HG, MA + 715°C/5h
NX8244HK, SA 1093°C/1h
CG
Ren
v (m
/s)
CGRair (m/s)
Alloy 690289°C
≈6000 ppb DO
≈300 ppb DO
CGRair + 4.4 x 10⁻⁷(CGRair)0.33
(a) (b)
Figure 12. Corrosion fatigue data for Alloy 690 in high–purity water with ≈6000 or 300 ppb dissolvedoxygen at (a) 320 and (b) 289°C. Data obtained at ANL (Refs. 8–11).
18
experimental CGRs against those predicted by Eqs. 6 and 7 for the same mechanical loadingconditions for high–DO (≥300 ppb DO) water and simulated PWR or low–DO (<10 ppb DO)water.
Limited data indicate some enhancement of growth rates in high–DO (300 ppb or higherDO) water, Fig. 12. Results in high–DO water are bounded by the CGRs estimated from Eq. 9for Alloy 600 in high–DO water. The results at 240–320°C indicate no environmental effects onthe CGRs of Alloy 690 in low–DO (<10 ppb DO) water under the material and loadingconditions investigated, Fig. 13. However, the existing database for Alloy 690 is small andadditional tests are needed to verify these results.
10-12
10-11
10-10
10-9
10-8
10-7
10-12 10-11 10-10 10-9 10-8 10-7
NX8662HG, MA + 715°C/5hNX8625HG, SA + 715°C/5hNX8244HK, SA 1093°C/1hNX8244HK, SA 982°C/1h
CG
Ren
v (m
/s)
CGRair (m/s)
Alloy 690320°C <5 ppb DO
10-12
10-11
10-10
10-9
10-8
10-7
10-12 10-11 10-10 10-9 10-8 10-7
NX8662HG, MA + 715°C/5hNX8625HG, SA + 715°C/5hNX8244HK, SA 1093°C/1hNX8244HK, SA 982°C/1h
CG
Ren
v (m
/s)
CGRair (m/s)
Alloy 690289°C <5 ppb DO
(a) (b)
10-12
10-11
10-10
10-9
10-8
10-7
10-12 10-11 10-10 10-9 10-8 10-7
NX8625HG, SA + 715°C/5h
CG
Ren
v (m
/s)
CGRair (m/s)
Alloy 690240°C <5 ppb DO
Figure 13.Corrosion fatigue data for Alloy 690 in high–puritywater with <10 ppb dissolved oxygen at (a) 320,(b) 289, and (c) 240°C. Data obtained at ANL(Refs. 8–11).
(c)
19
4.3 Weld Metals
The fatigue crack growth data on Ni–alloy welds consists of results of ≈100 tests insimulated PWR environments at temperatures between 243 and 345°C, and ≈10 tests in BWRenvironments at 288°C. The data in PWR water have been obtained from 22 tests on Alloy 182,74 tests on Alloy 82, and 4 tests on Alloy 52.20,29,30,43 The loading conditions for these testsinclude R = 0.1–0.75, Kmax = 20–104 MPa·m1/2, ∆K = 17–93 MPa·m1/2, and rise time =0.5–5000 s. The tests in BWR water were conducted on as–welded Alloy 182 at R = 0.6–0.8,Kmax = 30 MPa·m1/2, ∆K = 6–13 MPa·m1/2, and rise times of 1800 and 4800 s.44
To determine the enhancement of CGRs of the weld metals in simulated PWRenvironments relative to those of Alloy 600 in air, experimental CGRs for the weld metals inwater and those predicted by Eqs. 4 and 5 for Alloy 600 in air under the same mechanicalloading conditions are plotted in the Fig. 14. The CGRs estimated from Eq. 9 for Alloy 600 inhigh–temperature water are also shown in the figure. The significant results are summarizedbelow.
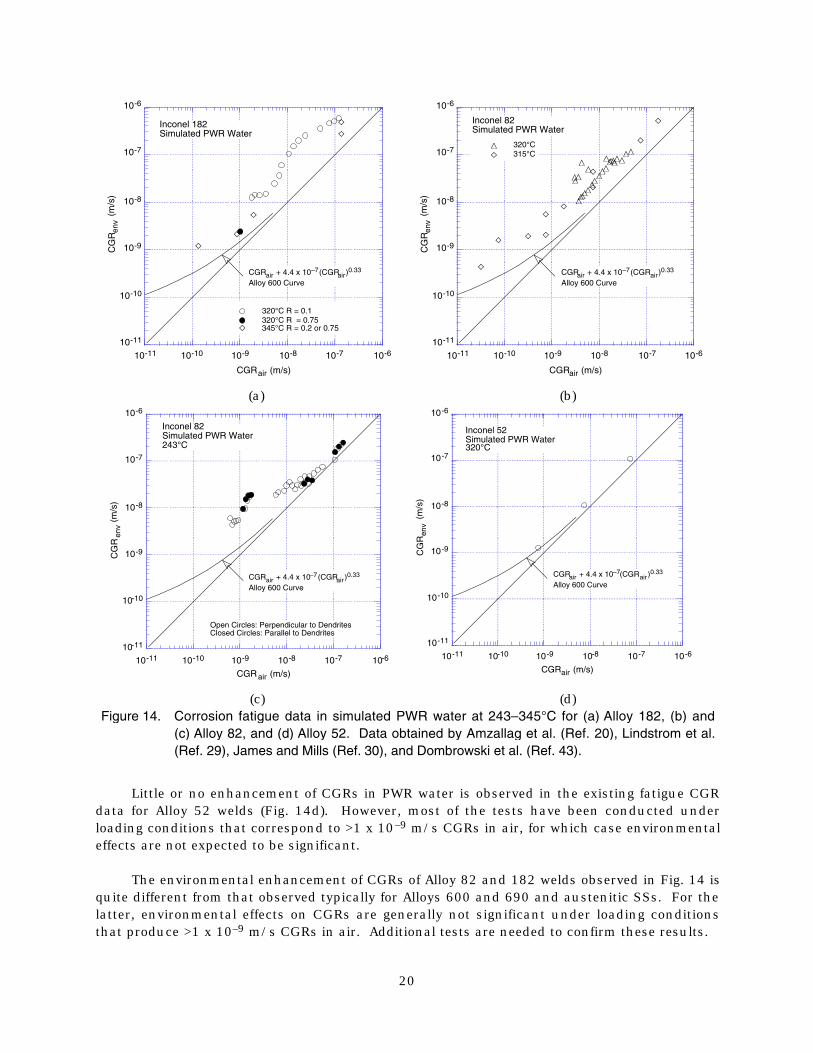
Fatigue CGR data for Alloy 182 and Alloy 82 are shown in Figs. 14a and b. Most of thedata for Ni alloy welds have been obtained under loading conditions that correspond to>1 x 10⁻⁹ m/s CGRs in air. As discussed in Section 4.1, under these loading conditions,environmental enhancement of growth rates would be moderate even in materials that aresusceptible to environmentally enhanced cracking. In PWR water at ≈320°C (Fig. 14a), theCGRs for Alloy 182 welds are up to a factor of 10 higher than the predicted fatigue CGRs ofAlloy 600 in PWR environments. The enhanced growth rates under these loading conditionsare unlikely to be primarily due to the effects of environment; in air, the fatigue CGRs of Alloy182 weld are a factor of 2 greater than those of Alloy 600, see Fig. 8. The chloride content inwater was not found to significantly influence the CGRs of Alloy 182 in PWR water, e.g.,comparable CGRs were obtained when the chloride content was increased from 0.15 to0.5 ppm.20
In PWR water at ≈320°C (Fig. 14b), the CGRs of Alloy 82 welds are generally a factor of ≈4higher than the predicted fatigue CGRs of Alloy 600 in PWR environments; some values are upto a factor of ≈8 higher.20 The large scatter in growth rates has been attributed to variations inthe weld structure. Fatigue crack growth data for Alloy 82 welds in air are not available todetermine whether these enhanced rates are due to the environment alone. Changes infrequency from 1 to 0.00018 Hz did not substantially change the CGRs of Alloy 82 welds.43
The lack of frequency dependence suggests that under the loading conditions that have beeninvestigated, environment exhibits a minor influence on CGRs of Alloy 82 welds, but as notedpreviously, most of the data have been obtained under loading conditions that correspond to>1 x 10⁻⁹ m/s CGRs in air, in which case environmental effects are unlikely to be significant.
Enhancement of growth rates of up to a factor of ≈8 are also observed for Alloy 182 weldsat 243°C.30 At 243°C, growth rates do not appear to be influenced by the orientation of thecrack plane relative to the weld dendrite, e.g., comparable CGRs are observed for specimensoriented parallel or perpendicular to the weld dendrites. These results are in contrast to thestrong influence of crack orientation observed in SCC growth rates of Ni alloy welds in PWRenvironments; as discussed later in Section 5.3, SCC CGRs are significantly greater in adirection parallel to the weld dendrites than in a perpendicular direction.
20
10-11
10-10
10-9
10-8
10-7
10-6
10-11 10-10 10-9 10-8 10-7 10-6
320°C R = 0.1320°C R = 0.75345°C R = 0.2 or 0.75
CG
Ren
v (
m/s
)
CGRair (m/s)
Inconel 182Simulated PWR Water
CGRair + 4.4 x 10⁻⁷(CGRair)0.33
Alloy 600 Curve
10-11
10-10
10-9
10-8
10-7
10-6
10-11 10-10 10-9 10-8 10-7 10-6
320°C315°C
CG
Ren
v (
m/s
)
CGRair (m/s)
Inconel 82Simulated PWR Water
CGRair + 4.4 x 10⁻⁷(CGRair)0.33
Alloy 600 Curve
(a) (b)
10-11
10-10
10-9
10-8
10-7
10-6
10-11 10-10 10-9 10-8 10-7 10-6
CG
Ren
v (m
/s)
CGRair (m/s)
Inconel 82Simulated PWR Water243°C
CGRair + 4.4 x 10⁻⁷(CGRair )0.33
Alloy 600 Curve
Open Circles: Perpendicular to DendritesClosed Circles: Parallel to Dendrites
10-11
10-10
10-9
10-8
10-7
10-6
10-11 10-10 10-9 10-8 10-7 10-6
CG
Ren
v (
m/s
)
CGRair (m/s)
Inconel 52Simulated PWR Water320°C
CGRair + 4.4 x 10⁻⁷(CGRair )0.33
Alloy 600 Curve
(c) (d)Figure 14. Corrosion fatigue data in simulated PWR water at 243–345°C for (a) Alloy 182, (b) and
(c) Alloy 82, and (d) Alloy 52. Data obtained by Amzallag et al. (Ref. 20), Lindstrom et al.(Ref. 29), James and Mills (Ref. 30), and Dombrowski et al. (Ref. 43).
Little or no enhancement of CGRs in PWR water is observed in the existing fatigue CGRdata for Alloy 52 welds (Fig. 14d). However, most of the tests have been conducted underloading conditions that correspond to >1 x 10⁻⁹ m/s CGRs in air, for which case environmentaleffects are not expected to be significant.
The environmental enhancement of CGRs of Alloy 82 and 182 welds observed in Fig. 14 isquite different from that observed typically for Alloys 600 and 690 and austenitic SSs. For thelatter, environmental effects on CGRs are generally not significant under loading conditionsthat produce >1 x 10⁻⁹ m/s CGRs in air. Additional tests are needed to confirm these results.
21
The experimental CGRs of Alloy 182 welds in a BWR environment and those predicted byEqs. 4 and 5 for Alloy 600 in air under the same mechanical loading conditions are plotted inFig. 15. The results indicate enhancement of CGRs in Alloy 182 welds in a normal waterchemistry (NWC) BWR environment. The CGRs estimated from Eq. 9 for Alloy 600 inhigh–temperature water are also shown in the figure. The results for Alloy 182 welds in NWCBWR water show good agreement with the predicted curve for Alloy 600. The CGRs of Alloy182 are greatly decreased at very low levels of DO in water. For example, the CGRs decreasedby a factor of 5–10 when DO level was decreased from 200 to 10 ppb.44, The crack growth,however, does not cease at the low DO levels. A similar benefit was observed when DO levelwas decreased from 700 to 200 ppb.
10-12
10-11
10-10
10-9
10-8
10-12 10-11 10-10 10-9 10-8
7000 ppb200 ppb10 ppb
CG
Ren
v (m
/s)
CGRair (m/s)
Inconel 182289°CHigh–Purity Water
CGRair + 4.4 x 10⁻⁷(CGRair )0.33
Dissolved Oxygen
10-12
10-11
10-10
10-9
10-8
10-12 10-11 10-10 10-9 10-8
N = 5.0
N = 15.4
CG
Ren
v (m
/s)
CGRair (m/s)
Inconel 182289°CHigh–Purity Water
CGRair + 4.4 x 10⁻⁷(CGRair )0.33
Open Symbols: NWCClosed Symbols: HWC (125 ppb DH)
Carbide StabilizationParameter
Figure 15. Corrosion fatigue data for Alloy 182 in high–DO water at 288°C. Data obtained byAndresen (Ref. 44).
22
23
5 Stress Corrosion Cracking
5.1 Alloy 600
Stress corrosion cracking data on Alloy 600 have been obtained on circumferentiallycracked tube specimens,45 notched plate specimens made from flattened tubing,46 doublenotched tubular specimens,47 constant displacement specimens such as wedge-open–loaded ordouble cantilever beam,37,48,49 and compact tension specimens.11,38,49,50 Tests have beenconducted on several heats of Alloy 600 in simulated PWR environments with <10 ppb DO or inhigh-purity water with 200–300 ppb DO under several heat treatment conditions. Testtemperatures ranged from 290 to 360°C for low–DO water and 200 to 320°C for high–DO water.
The results indicate that Alloy 600 is susceptible to SCC in simulated PWR environments.Under most of the loading and environmental conditions that have been investigated, the crackgrowth from SCC is predominantly intergranular. The significant results and influence ofcritical parameters on growth rates in simulated PWR water or low–DO water are summarizedbelow.
Stress Intensity: The results indicate a strong dependence of stress intensity on CGRs up to≈25 MPa·m1/2; by increasing the stress intensity from ≈5 to ≈25 MPa·m1/2, the growth ratescan increase from 1 x 10–11 to 1 x 10⁻⁹ m/s. The CGRs are relatively insensitive to stressintensity at values >25 MPa·m1/2; see Fig. 16. The threshold value of stress intensity for SCCin low–DO water may be in the range of 5–10 MPa·m1/2.46
10-12
10-11
10-10
10-9
10-8
0 20 40 60 80 100
MAMA + 5% CW
MA Tube Rolled Flat
Exp
erim
enta
l CG
R (
m/s
)
Stress Intensity K (MPa·m1/2)
Alloy 600PWR Environment 330°C
Three Point Bend
Tubular Specimen
Figure 16.Effects of applied stress intensity and coldwork on CGRs in Alloy 600 in simulatedPWR water at 330°C. Data obtained byCassagne and Gelpi (Ref. 47), Lott et al.(Ref. 45), and Rebak et al. (Ref. 46).
24
Temperature: CGRs increase with temperature between 290 and 360°C. The effects oftemperature on SCC growth rates are best characterized by an activation energy of130 kJ/mole; actual values for individual data sets range from 100 to 180 kJ/mole.37,38,47,49
Cold work does not seem to influence the activation energy for SCC growth rates, at least in thetemperature range of 290–360°C; see Fig. 17.37,47,49
10-12
10-11
10-10
10-9
1.5 1.6 1.7 1.8
MA + 5% Cold WorkMA Tube
Exp
erim
enta
l CG
R (
m/s
)
Reciprocal Temperature 1000/T (K)
Alloy 600Simulated PWR Water
130 kJ/mole
Figure 17.Effect of temperature on CGRs of Alloy 600in PWR environment. Data obtained byCassagne and Gelpi (Ref. 47).
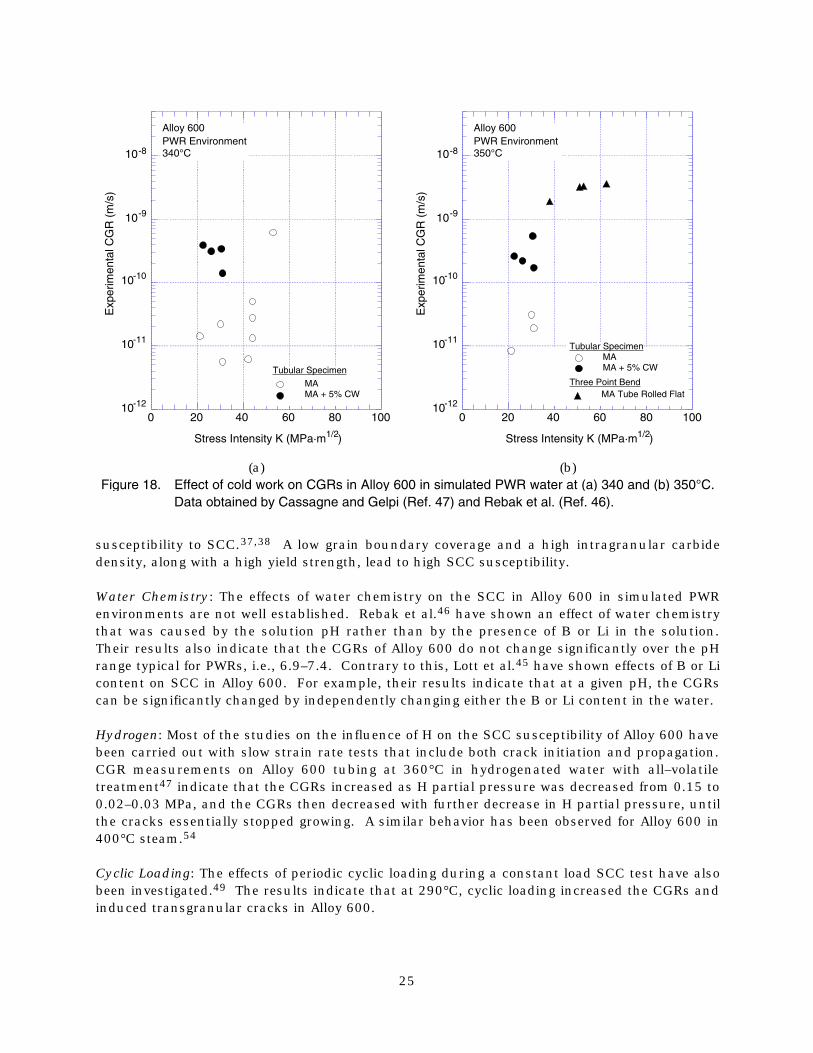
Cold Work: Several studies have established the effect of cold work on the susceptibility ofAlloy 600 to intergranular SCC in low–DO PWR environments.37,46,47,49 Moderate amounts ofcold work are more detrimental than severe amounts of cold work. For example, CGRs areenhanced by one order of magnitude from only 5% cold work, Fig. 18; further amounts of coldwork lead to only moderate enhancement in CGR. Because cold work increases the yieldstrength of the material, an effect similar to that of cold work on CGRs is also observed for yieldstrength on CGRs;37,49 CGRs are increased with an increase in yield stress. However, theindividual effect of an increase in yield stress due to microstructural changes or from coldwork, on the growth rates is not well established.
The influence of cold work on SCC growth rates is attributable to its effect on dislocationdensity and the deformation behavior ahead of the crack tip. The SCC susceptibility ofFe–Cr–Ni alloys has been correlated with the dislocation arrangements in the material.51 Forexample, planar dislocation structures lead to transgranular SCC, whereas intergranular SCCis observed in materials with high stacking fault energy, e.g., Ni–base alloys. Bruemmershowed that a mill–annealed and 5% cold–worked Alloy 600 contained higher dislocationdensity near the grain boundary than in the grains.52 The greater susceptibility of thecold–worked Alloy 600 has been explained by localized plastic deformation at the grainboundaries, preventing relaxation at the crack tip.
Microstructure: The effects of the various metallurgical parameters on the SCC of Alloy 600 arenot well known because these parameters are not independent.53 In general, materials withextensive grain boundary coverage with fine carbides and a low yield strength exhibit low
25
10-12
10-11
10-10
10-9
10-8
0 20 40 60 80 100
MAMA + 5% CW
Exp
erim
enta
l CG
R (
m/s
)
Stress Intensity K (MPa·m1/2)
Alloy 600PWR Environment 340°C
Tubular Specimen
10-12
10-11
10-10
10-9
10-8
0 20 40 60 80 100
MAMA + 5% CW
MA Tube Rolled Flat
Exp
erim
enta
l CG
R (
m/s
)
Stress Intensity K (MPa·m1/2)
Alloy 600PWR Environment 350°C
Three Point Bend
Tubular Specimen
(a) (b)Figure 18. Effect of cold work on CGRs in Alloy 600 in simulated PWR water at (a) 340 and (b) 350°C.
Data obtained by Cassagne and Gelpi (Ref. 47) and Rebak et al. (Ref. 46).
susceptibility to SCC.37,38 A low grain boundary coverage and a high intragranular carbidedensity, along with a high yield strength, lead to high SCC susceptibility.
Water Chemistry: The effects of water chemistry on the SCC in Alloy 600 in simulated PWRenvironments are not well established. Rebak et al.46 have shown an effect of water chemistrythat was caused by the solution pH rather than by the presence of B or Li in the solution.Their results also indicate that the CGRs of Alloy 600 do not change significantly over the pHrange typical for PWRs, i.e., 6.9–7.4. Contrary to this, Lott et al.45 have shown effects of B or Licontent on SCC in Alloy 600. For example, their results indicate that at a given pH, the CGRscan be significantly changed by independently changing either the B or Li content in the water.
Hydrogen: Most of the studies on the influence of H on the SCC susceptibility of Alloy 600 havebeen carried out with slow strain rate tests that include both crack initiation and propagation.CGR measurements on Alloy 600 tubing at 360°C in hydrogenated water with all–volatiletreatment47 indicate that the CGRs increased as H partial pressure was decreased from 0.15 to0.02–0.03 MPa, and the CGRs then decreased with further decrease in H partial pressure, untilthe cracks essentially stopped growing. A similar behavior has been observed for Alloy 600 in400°C steam.54
Cyclic Loading: The effects of periodic cyclic loading during a constant load SCC test have alsobeen investigated.49 The results indicate that at 290°C, cyclic loading increased the CGRs andinduced transgranular cracks in Alloy 600.
26
The results indicate a dependence of stress intensity on CGR in high–DO water similar tothat observed for Alloy 600 in simulated PWR or low–DO water. Sulfate addition to the water,enhanced CGRs of Alloy 600; see Fig. 19.11,50 Also, limited data suggest that moderateamounts of cold work enhance CGRs. However, because all of the tests in high–DO water havebeen obtained at 320°C or lower, the CGRs in high–DO water show little or no effect oftemperature in the range of 200–320°C, Fig. 20.11 SCC studies on Alloy 600 in simulated BWRenvironments50 indicate that in NWC, cracking is enhanced in high–C alloys by heattreatments that lead to the formation of Cr carbides at the grain boundaries, or in alloys that
Figure 19.Effects of applied stress intensity and sulfateadditions on CGRs in Alloy 600 in BWRwater with NWC at 288°C. Data obtained atANL (Ref. 11) and by Ljungberg et al.(Ref. 50).
10-11
10-10
10-9
1.4 1.6 1.8 2.0 2.2 2.4
K = 27.3 MPa m1/2, Hot WorkedK = 28.1 MPa m1/2, SA 872°CK = 26.6 MPa m1/2, SA 1038°C
Exp
erim
enta
l CG
R (
m/s
)
Reciprocal Temperature 1000/T (K)
Alloy 600 (Heat NX8844)High–Purity Water ≈300 ppb DO
Figure 20.Effect of temperature on crack growth ratesof Alloy 600 in high–dissolved oxygenhigh–purity water. Data obtained at ANL(Ref. 11).
27
contain high concentrations of P and S. Hydrogen water chemistry decreased CGRs inAlloy 600, particularly in materials low in P and S.50
5.2 Alloy 690
The relevant SCC crack growth data on Alloy 690 are very limited.11 The results shownin Fig. 21 for simulated BWR environments indicate little dependence of stress intensity onCGRs; the rates range between ≈2 x 10–12 and 6 x 10–12 m/s. Also, the addition of sulfatesexerted no effect on the growth rates of Alloy 690.11 However, these values may be below thesensitivity of the crack length monitoring system.
10-12
10-11
10-10
10-9
0 20 40 60 80 100
300 ppb DO300 ppb DO + Impurities
Exp
erim
enta
l CG
R (
m/s
)
Stress Intensity, K (MPa·m1/2)
Alloy 690 (Heat NX8244HK)290°C
Figure 21.Effect of applied stress intensity on crackgrowth rates in Alloy 690 in high–purity waterat 290°C. Data obtained at ANL (Ref. 11).
The fracture resistance of Ni alloys and their welds has been investigated by conductingfracture toughness J–R curve tests at 24–338°C in deionized water with <20 ppb DO anddissolved H levels of 125–200 cm3/kg of water.55,56 The results indicate that Alloy 690exhibits excellent fracture toughness in air and high–temperature water (>93°C). However, theapparent fracture toughness of Alloy 690 is dramatically reduced in 54°C water under slowrising loads; the fracture toughness JIC and tearing modulus are reduced by one to two ordersof magnitude. The reductions have been attributed to a H–induced intergranular crackingmechanism. Hydrogen from the water reduces grain boundary cohesive strength and promotesplanar slip, which localizes strain concentrations along the grain boundaries. In othersystems, such decreases in apparent fracture toughness in slow rising load tests have beenassociated with susceptibility to SCC.
5.3 Weld Metals
The SCC database on Alloy 82 and 182 welds reviewed in this paper consists of results of≈250 tests on Alloy 182 and ≈12 tests on Alloy 82 in simulated PWR and BWR environments.Approximately one–fifth of the data on Alloy 182 have been obtained in simulated PWRwater;29,38,57 the remainder, in simulated BWR water.44,50,58–62 The data in simulated PWR
28
water have been obtained primarily on as–welded material tested at 290–345°C and maximumstress intensity Kmax in the range of 13–49 MPa·m1/2. In these tests, the crack orientation wasgenerally parallel to the weld dendrites. The data in simulated BWR water have been obtainedon both as–welded material and material with differing thermal treatments, tested at 288°Cand maximum stress intensity Kmax in the range of 12–67 MPa·m1/2. The data on Alloy 82 inthis review have been obtained on as–welded material; four tests were performed at 275°C inBWR water with NWC,58 and eight at 360°C in low–DO water with 150 cm3 H/kg of water.55
The results indicate that Alloy 182 welds are susceptible to SCC in simulated PWRenvironments. The data exhibit significant scatter, which is probably associated with theirregular crack fronts that are often observed on Alloy 182 welds. The CGRs reported in all ofthe studies represent the maximum values obtained from the maximum crack length measuredanywhere along the crack front. The average CGRs are a factor of ≈2 lower than the maximumvalues.57 The significant results and influence of critical parameters on growth rates of Alloy182 welds in simulated PWR water are summarized below.
Material Condition: The results indicate a significant effect of crack orientation on CGRs. Crackgrowth along the weld dendrites occurs at a rate ≈5 times faster than the rate obtained whenthe crack is growing across the dendrites; see Fig, 22.57 In these tests in a PWR environment,a stress relief heat treatment at 610°C for 6 h appears to have a beneficial effect on CGRs inlow–C welds, most likely because the stress relief treatment increases the grain boundarycoverage of carbides in low–C welds.38
10-12
10-11
10-10
10-9
10-8
0 20 40 60 80 100
320°C Parallel325°C Parallel325°C Perpendicular
Exp
erim
enta
l CG
R (
m/s
)
Stress Intensity K (MPa·m1/2)
Inconel 182PWR Environment 325°C
Crack Plane Relative to Weld Dendrites
10-12
10-11
10-10
10-9
10-8
0 20 40 60 80 100
As WeldedStress Relieved
Exp
erim
enta
l CG
R (
m/s
)
Stress Intensity K (MPa·m1/2)
Inconel 182PWR Environment 330°C
(a) (b)Figure 22. Effects of (a) crack orientation relative to the weld dendrites and (b) stress relief on SCC
CGRs in Alloy 182 welds in simulated PWR environment. Data obtained by Bamford et al.(Ref. 57) and Cassagne et al. (Ref. 38).
29
Mechanical Loading: The effects of applied maximum stress intensity on CGRs in Alloy 182 in aPWR environment follow the trends observed for Alloy 600. However, the existing database forAlloy 182 is very small and additional tests on various material conditions and a wide range ofapplied stress intensities are needed to verify these results.57
Temperature: The limited data suggest that the temperature dependence of growth rates issimilar to that observed for Alloy 600; the variation in CGRs of Alloy 182 welds withtemperature can be represented by an activation energy of 130 kJ/mole.38,57
Alloy 182 welds are also susceptible to SCC in BWR environments with NWC (typically≈200 ppb DO and <10 ppb dissolved H). In general, the SCC susceptibility of Alloy 182 welds isgreater than that of Alloy 600.44,50,58–62 The significant results and influence of criticalparameters on growth rates of Alloy 182 welds in simulated BWR water are summarized below.
Crack Orientation: Similar to the behavior in low–DO PWR environments, cracking in high–DOBWR environments is also much faster parallel to the weld dendrites than in a directionperpendicular to the dendrites, see Fig. 23. The large difference in CGRs between the twodirections in the weld metal has been attributed to the difference in segregation of P and Sduring cooling from the fusion temperature; the carbide precipitation is expected to be similaron both dendrite boundaries and intradendrite grain boundaries.
10-12
10-11
10-10
10-9
10-8
0 20 40 60 80 100
N = 5.0N = 15.4
N = 15.4
Exp
erim
enta
l CG
R (
m/s
)
Stress Intensity K (MPa·m1/2)
Inconel 182288°C Normal Water Chemistry + Sulfates
Crack PlaneOpen Symbols: Parallel to DendritesClosed Symbols: Perpendicular to Dendrite
Sulfates 25 ppb
Sulfates 100 ppb
Figure 23.Effect of crack orientation relative to welddendrites on CGRs in Alloy 182 welds inBWR environment with normal waterchemistry. Data obtained by Ljungberg et al.(Ref. 50).
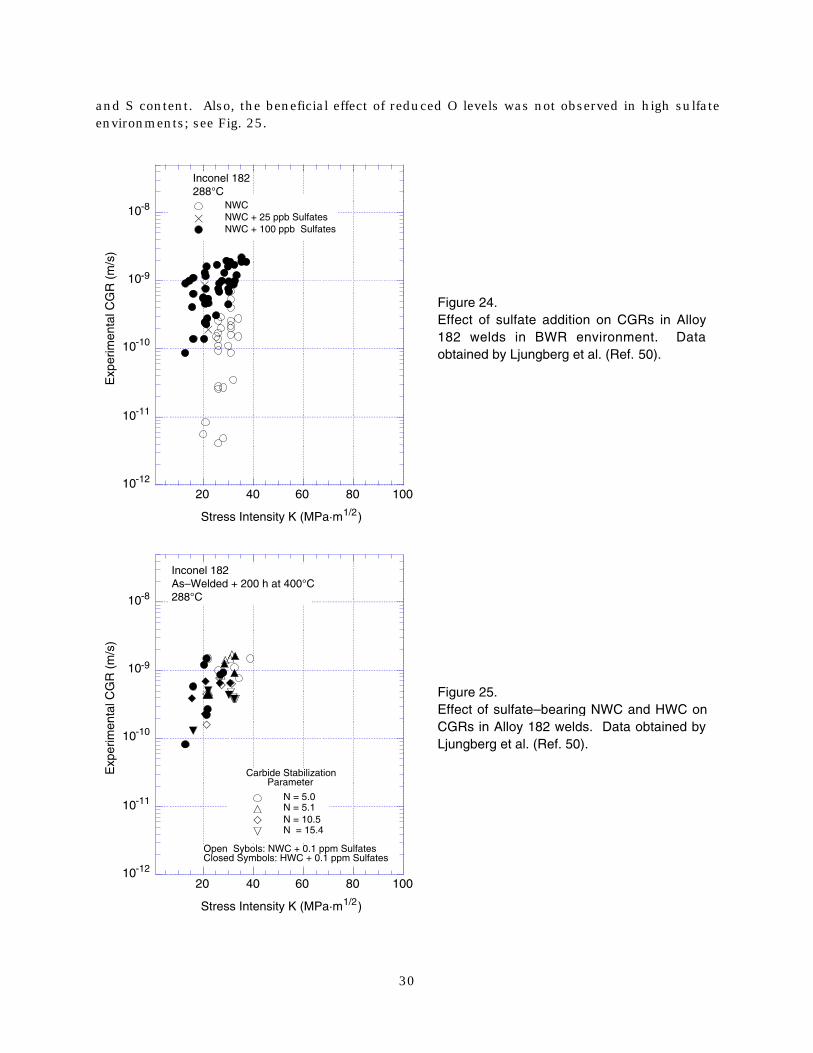
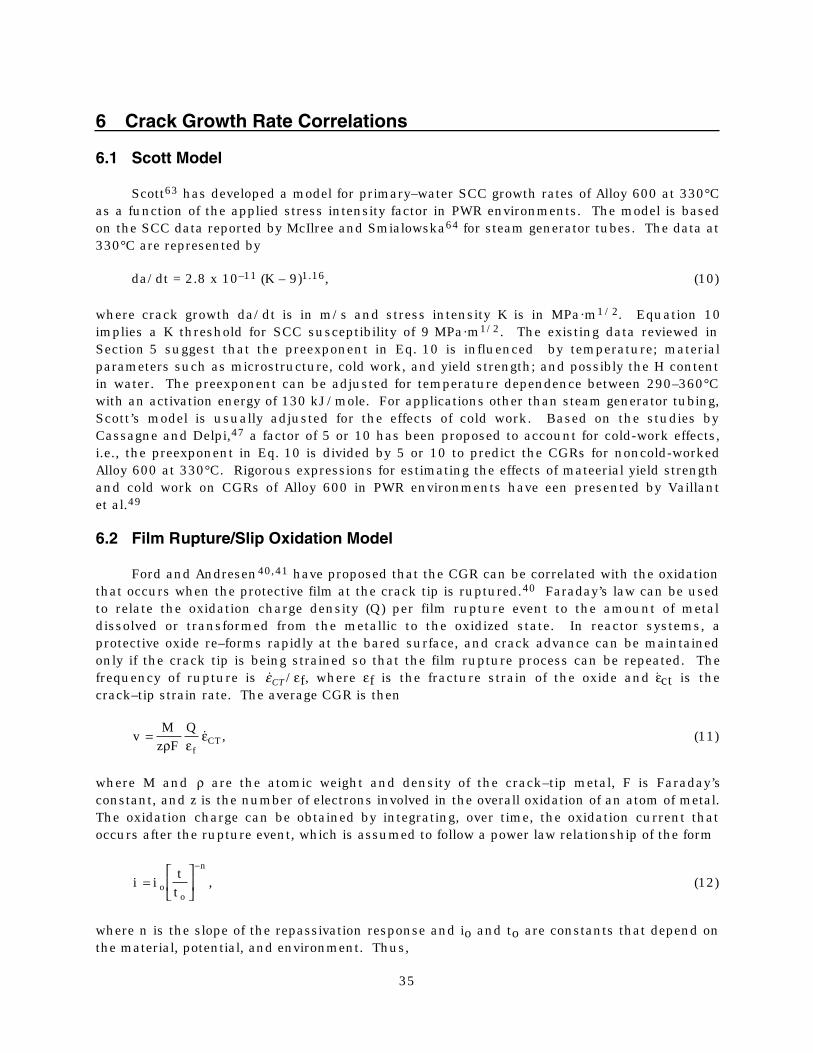
Water Chemistry: Sulfate addtions in oxygenated environments enhanced CGRs of Alloy 182welds. For example, addition of 100 ppb sulfate to NWC increased the CGRs of Alloy 182 weldsby one order of magnitude; see Fig. 24. Hydrogen water chemistry (HWC) (typically <5 ppb DOand ≈125 ppb dissolved H) decreased the CGRs of Alloy 182 welds; the measured CGRs in Alloy182 welds were 1 x 10–12 m/s.50 The beneficial effect of HWC was larger for welds with low P
30
and S content. Also, the beneficial effect of reduced O levels was not observed in high sulfateenvironments; see Fig. 25.
10-12
10-11
10-10
10-9
10-8
20 40 60 80 100
NWCNWC + 25 ppb SulfatesNWC + 100 ppb Sulfates
Exp
erim
enta
l CG
R (
m/s
)
Stress Intensity K (MPa·m1/2)
Inconel 182288°C
Figure 24.Effect of sulfate addition on CGRs in Alloy182 welds in BWR environment. Dataobtained by Ljungberg et al. (Ref. 50).
Figure 25.Effect of sulfate–bearing NWC and HWC onCGRs in Alloy 182 welds. Data obtained byLjungberg et al. (Ref. 50).
31
Material Condition: In BWR environments with NWC, CGRs on Alloy 182 welds are enhanced byhigh concentrations of P and S in the welds; the difference in CGRs is not observed insulfate–bearing NWC environments.50 The carbide stabilization parameter N has little or noinfluence on susceptibility of Alloy 182 welds to SCC in BWR environments.50,58 Welds with Nparameters in the range of 5–15 exhibit comparable CGRs in NWC BWR environments, seeFig. 26. The results suggest a weak dependence of growth rates on N; low degree of carbidestabilization enhances cracking. The differences among CGRs in Fig. 26 have been attributedto differing concentrations of P and S in the weld metal rather than to parameter N.
10-12
10-11
10-10
10-9
10-8
0 20 40 60 80 100
N = 5.0 Low S & PN = 5.1 High S & PN = 12.9 N = 10.5 High P & SN = 15.4 Low P & S
Exp
erim
enta
l CG
R (
m/s
)
Stress Intensity K (MPa·m1/2)
Inconel 182 As Welded + 200 h at 400°C Air CooledNWC (200 ppb DO + 10 ppb DH)288°C
Carbide StabilizationParameter
Figure 26.Effect of carbide stabilization parameter onCGRs in Alloy 182 welds in BWRenvironment with normal water chemistry.Data obtained by Ljungberg et al. (Ref. 50).
The effect of thermal treatment on SCC susceptibility of Alloy 182 welds is not well known.Ljungberg et al.50 observed little or no effect of thermal treatment on SCC CGRs of as–weldedAlloy 182; see Fig. 27. They investigated the effects of severe weld sensitization, i. e., 24 h at600°C and air cooled; low–temperature sensitization, i. e., 200 h at 400°C and air cooled; andheat treatment to simulate material conditions of safe–end welds, i.e., 8 h at 620°C and furnacecooled + 200 h at 400°C and air cooled. Jenssen et al.58 observed a beneficial effect of apostweld heat treatment of 8 h at 620°C + 200 h at 400°C, on SCC susceptibility of Alloy 182welds; see Fig. 28. The benefit of heat treatment was related to possible transformation ofM23C6 carbides to M7C3 carbides or to relaxation of weld stresses. Andresen44 reported anincrease in cracking susceptibility of Alloy 182 weld heat treated for 24 h at 620°C + 200 h at400°C.
32
10-12
10-11
10-10
10-9
10-8
0 20 40 60 80 100
As WeldedSevere Weld Sensitization24 h at 600°C Air CoolLow–Temp. Sensitization200 h at 400°C Air Cool600°C/8h + 400°C/200h
Exp
erim
enta
l CG
R (
m/s
)
Stress Intensity K (MPa·m1/2)
Inconel 182NWC (200 ppb DO + 10 ppb DH)288°C
10-12
10-11
10-10
10-9
10-8
0 20 40 60 80 100
As WeldedSevere Weld Sensitization24 h at 600flC Air CoolLow–Temp. Sensitization200 h at 400°C Air Cool
Exp
erim
enta
l CG
R (
m/s
)
Stress Intensity K (MPa·m1/2)
Inconel 182NWC + 100 ppb Sulfates288°C
(a) (b)Figure 27. Effect of thermal treatment on SCC CGRs in Alloy 182 welds at 288°C in (a) NWC and
(b) NWC with 0.1 ppm sulfates. Data obtained by Ljungberg et al. (Ref. 50).
10-12
10-11
10-10
10-9
10-8
0 20 40 60 80 100
N = 7.6N = 14.5
Exp
erim
enta
l CG
R (
m/s
)
Stress Intensity K (MPa·m1/2)
Inconel 182NWC (170 – 550 ppb DO)275°CClosed Symbols: As WeldedOpen Symbols: AW + 620°C/8 or 24h + 400°C/200h
Carbide StabilizationParameter
Figure 28.Effect of thermal treatment on SCC CGRs inAlloy 182 welds at 275°C in NWC. Dataobtained by Jenssen et al. (Ref. 58).
33
The SCC crack growth data on Alloy 82 and 52 welds are very limited. The CGRs of Alloy82 welds in a PWR environment with relatively high dissolved H (150 cm3/kg of water) at360°C55 are shown in Fig. 29a; the CGRs of Alloy 82 in PWR water with 30 cm3/kg dissolved Hat 345°C29 are also shown in the figure for comparison. The results for Alloy 82 showsignificant scatter, possibly associated with local variations in microstructure, cold work, andresidual stresses in the welds. In PWR water, fracture mode in these welds is predominantlyintergranular cracking with a very uneven crack front; unbroken ligaments are often observedfar behind the advancing crack front. The results also indicate no influence of the direction ofcrack propagation, e.g., growth rates in a direction longitudinal to the welding direction arecomparable to those in a transverse direction. However, both of these orientations shared acommon crack plane.
In the same study on SCC susceptibility of Alloy 82 and 52 welds in PWR water with150 cm3/kg dissolved H, SCC was not observed in any of the ten Alloy 52 weld specimens.55
These results suggest that the resistance of Alloy 52 to SCC in PWR water is superior to that ofAlloy 82.
The SCC susceptibility of Alloy 82 and 182 welds at 275°C in BWR environment withNWC is shown in Fig 29b.
10-12
10-11
10-10
10-9
10-8
0 20 40 60 80 100
Inconel 182PWR Environment345°C
Exp
erim
enta
l CG
R (
m/s
)
Stress Intensity K (MPa·m1/2)
Inconel 82360°CPWR Water with150 cc/kg Hydrogen
Open Symbols: TransverseClosed Symbols: Longitudinal
Crack Propagation Relative to Welding Direction
10-12
10-11
10-10
10-9
10-8
0 20 40 60 80 100
Inconel 82Inconel 182
Exp
erim
enta
l CG
R (
m/s
)
Stress Intensity K (MPa·m1/2)
Inconel Welds275°CBWR NWC (170–550 ppb DO)
(a) (b)Figure 29. SCC susceptibility of Alloy 82 welds in (a) PWR environment at 360°C and (b) BWR NWC
with 170–550 ppb DO. Data obtained by Brown and Mills (Ref. 55), Lindstrom et al.(Ref. 29), and Jenssen et al. (Ref. 58).
34
The fracture resistance of Alloy 82 and 52 welds have been investigated by conductingfracture toughness J–R curve tests at 24–338°C in deionized water with <20 ppb DO anddissolved H levels of 125–200 cm3/kg of water.55,56 The results indicate that these weldsexhibit high fracture toughness in air and high–temperature water (>93°C). However, theapparent fracture toughness of both materials is dramatically reduced at temperatures below149°C, particularly in 54°C water, under slow rising loads. The apparent fracture toughnessJIC and tearing modulus are reduced by one to two orders of magnitude. The reduction hasbeen attributed to a H–induced intergranular cracking mechanism. Hydrogen from the waterreduces grain boundary cohesive strength and promotes planar slip, which localizes strainconcentrations along the grain boundaries. As noted previously, in other systems suchdecreases in apparent fracture toughness in slow rising load tests have been associated withsusceptibility to SCC.
35
6 Crack Growth Rate Correlations
6.1 Scott Model
Scott63 has developed a model for primary–water SCC growth rates of Alloy 600 at 330°Cas a function of the applied stress intensity factor in PWR environments. The model is basedon the SCC data reported by McIlree and Smialowska64 for steam generator tubes. The data at330°C are represented by
da/dt = 2.8 x 10⁻¹¹ (K – 9)1.16, (10)
where crack growth da/dt is in m/s and stress intensity K is in MPa·m1/2. Equation 10implies a K threshold for SCC susceptibility of 9 MPa·m1/2. The existing data reviewed inSection 5 suggest that the preexponent in Eq. 10 is influenced by temperature; materialparameters such as microstructure, cold work, and yield strength; and possibly the H contentin water. The preexponent can be adjusted for temperature dependence between 290–360°Cwith an activation energy of 130 kJ/mole. For applications other than steam generator tubing,Scott’s model is usually adjusted for the effects of cold work. Based on the studies byCassagne and Delpi,47 a factor of 5 or 10 has been proposed to account for cold-work effects,i.e., the preexponent in Eq. 10 is divided by 5 or 10 to predict the CGRs for noncold-workedAlloy 600 at 330°C. Rigorous expressions for estimating the effects of mateerial yield strengthand cold work on CGRs of Alloy 600 in PWR environments have een presented by Vaillantet al.49
6.2 Film Rupture/Slip Oxidation Model
Ford and Andresen40,41 have proposed that the CGR can be correlated with the oxidationthat occurs when the protective film at the crack tip is ruptured.40 Faraday’s law can be usedto relate the oxidation charge density (Q) per film rupture event to the amount of metaldissolved or transformed from the metallic to the oxidized state. In reactor systems, aprotective oxide re–forms rapidly at the bared surface, and crack advance can be maintainedonly if the crack tip is being strained so that the film rupture process can be repeated. Thefrequency of rupture is ̇εCT/εf, where εf is the fracture strain of the oxide and ε⋅ ct is thecrack–tip strain rate. The average CGR is then
v
Mz F
Q
fCT=
ρ εε̇ , (11)
where M and ρ are the atomic weight and density of the crack–tip metal, F is Faraday’sconstant, and z is the number of electrons involved in the overall oxidation of an atom of metal.The oxidation charge can be obtained by integrating, over time, the oxidation current thatoccurs after the rupture event, which is assumed to follow a power law relationship of the form
i i
tto
o
n
=
−
, (12)
where n is the slope of the repassivation response and io and to are constants that depend onthe material, potential, and environment. Thus,
36
vM
z Fi t
nf no o
n
fn CT
nCT
n=− ( )
( ) = ( )( )ρ ε
ε ε( )
˙ ˙1
. (13)
To use Eq. 13 to obtain quantitative predictions of CGR, Ford and Andresen40,41 haveaddressed two primary parameters: the crack–tip strain rate ̇εCT , which represents mechanicalaspects such as load, frequency, R, crack depth, and crack geometry, etc.; and n, whichcharacterizes the relationship between the crack–tip water chemistry and material chemistryand their effect on repassivation rates. For SS tested under constant load or near constantload, the crack–tip strain rate is expressed as
˙ .εCT x K= ( )−4 1 10 14 4 , (14)
where K is in MPa·m1/2. The function f n( )and n depend on material and water chemistry. Foraustenitic SSs,
f n x n( ) = ( )−7 8 10 3 3 6.
. . (15)
Thus, the average CGR is given as
v x n x K
n= ( )[ ] ( )[ ]− −7 8 10 4 1 103 3 6 14 4
. .. . (16)
For SSs, Ford/Andresen give values for n in terms of environmental conditions and materialsensitization.40,41 In applications to Ni alloys, n has simply been used as a fitting parameterand the numerical coefficient for f(n) is assumed to be temperature dependent, with anactivation energy of 130 kJ/mole.
6.3 Hydrogen–Assisted Cracking
A thermodynamic model for H assisted cracking has been proposed for EAC of Alloy 600in PWR water.39 The model is based on the assumption that the crack tip environmentconsists of steam H bubbles; i.e., similar to the environment for tests in H–doped superheatedsteam. Hydrogen is produced by anodic dissolution and hydrolysis reactions inside the crack.The nascent H atoms adsorbed on the metal surface can either diffuse into the bulk material orrecombine to form molecular H. Within the metal, H can react with C to form methane, leadingto intergranular H–assisted cracking postulated by Shen and Shewmon.65 Hydrogen may alsolead to intergranular cracking by fracture mechanisms such as H–related phase change,H–assisted local plasticity, or effects of H on the cohesive energy.
According to the model, the CGR of Alloy 600 is assumed to depend on H diffusion intothe metal ahead of the crack tip along the grain boundaries. This process is influenced by theformation of steam H bubbles at the crack tip and by the partial pressure of gaseous H at thecrack tip. The existence of gaseous H and water vapor have been demonstrated bythermodynamic calculations, experimental results, and field data.39 The prerequisites for theprocess are: the potential difference between the metal and solution at the crack tip must below for formation of hydrogen; a corresponding positive current must pass, due to an anodicreaction (metal oxidation), to account for the charge balance in the system; H evolution mustbe extensive to exceed the solubility limit in water; and diffusion of molecular H away from thecrack tip must be slow to maintain H concentrations at the crack tip at the solubility limit.
37
Examples of experimental observations that provide support for this model are presentedbelow.
The significant result in support of this model is that the CGRs of Ni alloys in PWRenvironment often depend on loading history. For example, a fatigue test on Alloy 600 in PWRwater at 320°C, load ratio R = 0.9, and frequency f = 0.05 Hz, yielded a CGR of0.5 x 10–10 m/s. CGR under the same conditions was significantly higher, 3.5 x 10⁻¹⁰ m/s,after the load ratio was decreased to 0.5 and then increased to 0.75, and back to 0.9. Thefracture mode was transgranular during the initial stage and intergranular during the finalstage. The difference in the growth rates has been explained on the basis of H production. Ifthere is not enough new bare fracture surface to enable sufficient H production, the CGR willremain slow, thus retaining slow H production. Whereas, in the final stage, enough new barefracture surface had been produced in the test periods with R = 0.5 or 0.75 to form a crack tipenvironment with high H production.
Another example is the increase in CGRs of Alloy 600 in PWR water with a decrease inthe H content of the water. As discussed above, a decrease in the bulk H content leads to anincrease in corrosion potential of the bulk material and thus in increased anodic reaction, i.e.,oxidation of the metal. This in turn must be compensated by H evolution at the crack front.
6.4 Comparisons with Experimental Data
6.4.1 Alloys 600 and 690
The existing SCC data on Alloy 600 in PWR environments have been compared with theScott63 and Ford/Andresen40,41 models. For PWR environments, the crack rate data at 330°Cwere initially fit to the models and the values at other temperatures were determined by usingan activation energy of 130 kJ/mole. The effect of applied stress intensity on CGRs (da/dt) forvarious heats and heat treatment conditions of Alloy 600 tested in simulated PWR water orlow–DO high–purity water at temperatures between 290 and 360°C are shown in Fig. 30. Thepredicted curves, based on the Scott model63 for steam generator tubes and noncold–workedmaterial, and those based on the Ford/Andresen model for n values of 0.5 and 0.7 are alsoshown in the plots. For noncold–worked material, the predictions of Scott’s model for steamgenerator tubes were lowered by a factor of 10. The upper and lower curves provide estimatesof the range of CGRs that could occur, depending on material conditions. The conditions thatlead to high SCC susceptibility in low–DO water include cold work, low grain boundarycoverage of carbides, and high tensile strength.
The upper curves for either the Scott or Ford/Andresen models bound most of the data,even for materials with high susceptibility. The Ford/Andresen curve may be overlyconservative for stress intensities >50 MPa·m1/2; for high K values, the Ford/Andresen curvemay be replaced by a plateau that represents a constant growth rate. The lower curve for theScott model may be nonconservative for K values >50 MPa·m1/2, e.g., at 330°C, the data(shown as open circles in Fig. 30) for solution–annealed material fall above the predicted curveat high stress intensities.
The effect of applied stress intensity on CGRs of several heats of Alloy 600 tested inhigh–DO (200 ppb or higher DO) high–purity water at 290 and 320°C are shown in Fig. 31.Although the Scott model was developed for PWR conditions, it is included in the figures for
38
10-12
10-11
10-10
10-9
10-8
0 20 40 60 80 100
Compact TensionDouble Cantilever Beam
Exp
erim
enta
l CG
R (
m/s
)
Stress Intensity K (MPa·m1/2)
Alloy 600PWR Environment 290°C
10-12
10-11
10-10
10-9
10-8
0 20 40 60 80 100
320°C325°C
325°C
Exp
erim
enta
l CG
R (
m/s
)
Stress Intensity K (MPa·m1/2)
Alloy 600PWR Environment 320°C
Double Cantilever Beam
Compact Tension
Hot Forged + TT
10-12
10-11
10-10
10-9
10-8
0 20 40 60 80 100
SA
MAMA + 5% CW
MA Tube Rolled Flat
Exp
erim
enta
l CG
R (
m/s
)
Stress Intensity K (MPa·m1/2)
Alloy 600PWR Environment 330°C
Three Point Bend
Tubular Specimen
Compact Tension
10-12
10-11
10-10
10-9
10-8
0 20 40 60 80 100
MAMA + 5% CW
Exp
erim
enta
l CG
R (
m/s
)
Stress Intensity K (MPa·m1/2)
Alloy 600PWR Environment 340°C
Tubular Specimen
Figure 30. Effect of applied stress intensity on CGRs in Alloy 600 in simulated PWR or low–DO waterat 290–360°C. Two sets of upper and lower curves represent CGRs predicted from Scottmodel, shown as solid lines for cold–worked and noncold–worked material; andFord/Andresen model, shown as chain dot line for n = 0.5 and 0.7.
39
10-12
10-11
10-10
10-9
10-8
0 20 40 60 80 100
Hot Forged + TT
MAMA + 5% CW
MA Tube Rolled Flat
Exp
erim
enta
l CG
R (
m/s
)
Stress Intensity K (MPa·m1/2)
Alloy 600PWR Environment 350°C
Three Point Bend
Tubular Specimen
Wedge-Open Loaded
10-12
10-11
10-10
10-9
10-8
0 20 40 60 80 100
Hot Forged + TT
MAMA + 5% CW
Exp
erim
enta
l CG
R (
m/s
)
Stress Intensity K (MPa·m1/2)
Alloy 600PWR Environment 360°C
Tubular Specimen
Wedge-Open Loaded
Figure 30 (Continued)
10-12
10-11
10-10
10-9
10-8
0 20 40 60 80 100
Solution Annealed20% Hot WorkedHot Worked + TT
Exp
erim
enta
l CG
R (
m/s
)
Stress Intensity K (MPa·m1/2)
Alloy 600High DO Environment290°C
Open Symbols: ≈300 ppb DOClosed Symbols: ≈300 ppb DO + impurities
10-12
10-11
10-10
10-9
10-8
0 20 40 60 80 100
Solution Annealed20% Hot Worked
Exp
erim
enta
l CG
R (
m/s
)
Stress Intensity K (MPa·m1/2)
Alloy 600High DO Environment320°C
Open Symbols: ≈300 ppb DOClosed Symbols: ≈300 ppb DO + impurities
Figure 31. Effect of applied stress intensity on CGRs in Alloy 600 in high–purity water with≈300 ppb DO at 290 and 320°C. Two sets of upper and lower curves represent CGRspredicted from Scott model, shown as solid lines for cold–worked and noncold–workedmaterial; and Ford/Andresen model, shown as chain dot line for n = 0.5 and 0.7.
40
comparison purposes. Agreement with the data at 290°C is reasonable. Using the value of theactivation energy developed for PWR environments, the models predict a much strongerdependence on temperature than is observed in the data, although the data are limited.
6.4.2 Ni Alloy Welds
The existing SCC data on Ni alloy welds in BWR and PWR environments have beencompared with the Scott63 and Ford/Andresen40,41 models. The effect of applied stressintensity on CGRs (da/dt) of Alloy 182 welds at 288°C in BWR water (i.e., 50 ppb or higher DO)with or without sulfate additions are shown in Fig. 32. The predicted curves at 290°C, basedon the Scott model for cold–worked Alloy 600 and Ford/Andresen model with n = 0.5, do notadequately represent the results for Alloy 182 welds in BWR environments. The experimentaldata for high–DO water without sulfate additions are up to a factor of 5 higher than thepredicted curve, and those with sulfate additions are up to a factor 10 higher.
The effect of applied stress intensity on CGRs of Alloy 182 welds in simulated PWR waterwater at temperatures between 290 and 345°C are shown in Fig. 33. In PWR environment,nearly all of the limited data for Alloy 182 welds are bounded by the Scott model forcold–worked material and the Ford/Andresen model for n = 0.5.
10-12
10-11
10-10
10-9
10-8
20 40 60 80 100
>1500 ppb DO50–250 ppb DO50–100 ppb DO + Sulfates
Exp
erim
enta
l CG
R (
m/s
)
Stress Intensity K (MPa·m1/2)
Inconel 182288°C
290°C
290°C Curvex 5
10-12
10-11
10-10
10-9
10-8
20 40 60 80 100
NWCNWC + 25 ppb SulfatesNWC + 100 ppb Sulfates
Exp
erim
enta
l CG
R (
m/s
)
Stress Intensity K (MPa·m1/2)
Inconel 182288°C
290°C
290°C Curvex 5
Figure 32. Effect of applied stress intensity on CGRs in Alloy 182 weld in high–purity water with50 ppb or higher DO at 288°C. Predicted CGRs from Scott model for cold–workedmaterial are shown as solid lines and from Ford/Andresen model, as chain dot line.Data obtained by Itow et al. (Refs. 59 and 60) and Ljungberg et al. (Ref. 50).
41
10-12
10-11
10-10
10-9
10-8
0 20 40 60 80 100
As WeldedScott's ModelFord/Andresen Modeln = 0.5
Exp
erim
enta
l CG
R (
m/s
)
Stress Intensity K (MPa·m1/2)
Inconel 182PWR Environment 345°C
10-12
10-11
10-10
10-9
10-8
0 20 40 60 80 100
As WeldedStress RelievedScott's ModelFord/Andresen Modeln = 0.5
As WeldedStress RelievedScott's ModelFord/Andresen Model n = 0.5
Exp
erim
enta
l CG
R (
m/s
)
Stress Intensity K (MPa·m1/2)
Inconel 182PWR Environment 290°C
Figure 33. Effect of applied stress intensity on CGRs in Alloy 182 weld in simulated PWR water at290–345°C. Predicted CGRs from Scott model for cold–worked material are shown assolid lines, and from Ford/Andresen model as chain dot line.
42
43
7 Summary
The resistance of Alloys 600 and 690 and their welds, i.e., Alloys 82, 812, 52, and 152, toEAC in simulated LWR environments has been evaluated. Existing CGR data for thesematerials under cyclic and constant loads have been analyzed to establish the effects of alloychemistry, material heat treatment, cold work, temperature, load ratio R, stress intensity K,and DO level. The fatigue crack growth data in air have been analyzed to develop correlationsfor estimating the fatigue CGRs of Alloys 600 and 690 as a function of stress intensity range∆K, load ratio R, and temperature. The results indicate that in air, the CGRs of these materialsare relatively insensitive to changes in frequency.
For cyclic loads, the experimental CGRs in high–temperature, high–purity water arecompared with CGRs that would be expected in air under the same mechanical loadingconditions to obtain a qualitative understanding of the degree and range of conditions forsignificant environmental enhancement in growth rates. The fatigue CGRs of Alloy 600 areenhanced in high–DO water; the environmental enhancement of growth rates does not appearto depend on either the C content or heat treatment of the material. Also, in high–DO water,the CGRs at 320°C are comparable to those at 289°C. In contrast to the behavior in high–DOwater, environmental enhancement of CGRs of Alloy 600 in low–DO water seems to depend onmaterial conditions such as yield strength and grain boundary coverage of carbides. Materialwith high yield strength and/or low grain boundary coverage of carbides exhibit enhancedCGRs. Correlations have been developed for estimating the enhancement of CGRs of Alloy 600in LWR environments relative to the CGRs in air under the same loading conditions.
For Alloy 690, the data suggest some enhancement of CGRs in high–DO water, i.e.,≈300 ppb DO. Limited data indicate no environmental effects on CGRs in low–DO water, i.e.,water with <10 ppb DO. However, the existing database for Alloy 690 is small, and additionaltests are needed to verify these results.
The enhancement of fatigue CGRs of Alloy 182 welds in LWR environments has beendetermined relative to the CGRs of Alloy 600 in air. Fatigue CGRs of Alloy 82 and 182 weldsare enhanced in PWR water. The results show significant scatter; growth rates of welds may beup to a factor of 10 higher than the predicted CGRs of Alloy 600 in air. Baseline CGRs of Nialloy welds in an air environment are not available; CGRs of Alloy 82 are a factor of 2 higherthan those of Alloy 600. The data in a PWR environment indicate little or no effect of frequencyon the CGRs of Alloy 82. The lack of frequency dependence suggests only minor influence ofenvironment on growth rates. Also, most of the data have been obtained under loadingconditions that correspond to >1 x 10– 9 m/s CGRs in air; under these conditions,environmental enhancement of growth rates is expected to be moderate. The existing data forAlloy 52 weld indicate little or no enhancement of CGRs in a PWR environment.
In a BWR environment with NWC, the CGRs of Alloy 182 weld are enhanced relative tothose of Alloy 600 in air. The results show good agreement with the predicted curve forAlloy 600. Hydrogen water chemistry has a beneficial effect on growth rates; CGRs aredecreased by a factor of 5–10 when DO level is decreased from 200 to 10 ppb.
The existing SCC data on Alloys 600 and 690 and Alloy 82, 182, and 52 welds have beenreviewed to determine the effects of critical parameters such as stress intensity, temperature,
44
material heat treatment, cold work, and water chemistry on CGRs. In general, the SCCsusceptibility of Alloy 82 and 182 welds is greater than that of Alloy 600. However, limiteddata suggest that the temperature dependence of growth rates is similar to that for Alloy 600;CGRs of both can be represented by an activation energy of 130 kJ/mole. The SCC growthrates of welds exhibit significant scatter because of irregularities of the crack front. Mostinvestigations have reported the maximum CGRs obtained from the maximum crack lengthmasured anywhere along the crack front. The average CGRs are a factor of ≈2 lower than themaximum values.
The SCC data have been compared with correlations developed from the Scott orFord/Andresen models. Although the conceptual bases underlying the two models differsignificantly, by appropriately choosing the constants in the models, the predicted CGRs fromthe correlations are reasonably consistent with the available data for SCC in LWRenvironments.
45
References
1. USNRC Information Notice No. 90–10, Primary Water Stress Corrosion Cracking (PWSCC)of Inconel 600, Feb. 1990.
2. USNRC Generic Letter 97-01, Degradation of Control Rod Drive Mechanism and OtherVessel Closure Head Penetrations, Apr. 1, 1997; USNRC Information Notice No. 96–11,Ingress of Demineralizer Resins Increases Potential for Stress Corrosion Cracking of ControlRod Drive Mechanism Penetrations, Feb. 1996; INPO Document SER 20–93, IntergranularStress Corrosion Cracking of Control Rod Drive Mechanism Penetrations, Sept. 1993.
4. USNRC Information Notice 92–57, Radial Cracking of Shroud Support Access Hole CoverWelds, Aug. 1992.
5. USNRC Information Notice No. 90–49, Stress Corrosion Cracking in PWR Steam GeneratorTubes, Aug. 1990; Notice No. 91–43, Recent Incidents Involving Rapid Increases inPrimary–to–Secondary Leak Rate, July 1991; Notice No. 92–80, Operation with SteamGenerator Tubes Seriously Degraded, Dec. 1992; Notice No. 94–05, Potential Failure ofSteam Generator Tubes with Kinetically Welded Sleeves, Jan. 1994.
6. USNRC Information Notice No. 89–33, Potential Failure of Westinghouse Steam GeneratorTube Mechanical Plugs, March 1989; Notice No. 89–65, Potential for Stress CorrosionCracking in Steam Generator Tube Plugs Supplied by Babcock and Wilcox, Sept. 1989;Notice No. 94–87, Unanticipated Crack in a Particular Heat of Alloy 600 Used forWestinghouse Mechanical Plugs for Steam Generator Tubes, Dec. 1994.
7. USNRC Information Notice No. 91–67, Problems with the Reliable Detection ofIntergranular Attack (IGA) of Steam Generator Tubing, Oct. 1991.
8. W. E. Ruther, W. K. Soppet, and T. F. Kassner, Corrosion Fatigue of Alloys 600 and 690 insimulated LWR Environments, NUREG/CR–6383, ANL–95/37 (April 1996).
9. W. E. Ruther, W. K. Soppet, and T. F. Kassner, Environmentally Assisted Cracking ofAlloys 600 and 690 in Simulated LWR Water, in Environmentally Assisted Cracking inLight Water Reactors, Semiannual Report, July 1997–December 1997, NUREG/CR–4667Vol. 25, ANL–98/18, pp. 42–75 (Sept. 1998).
10. W. E. Ruther, W. K. Soppet, T. F. Kassner, and W. J. Shack, Environmentally AssistedCracking of Alloys 600 and 690 in Simulated LWR Water, in Environmentally AssistedCracking in Light Water Reactors, Semiannual Report, January 1998–July 1998,NUREG/CR–4667 Vol. 26, ANL–98/18, pp. 25–32 (March 1999).
11. W. E. Ruther, W. K. Soppet, T. F. Kassner, and W. J. Shack, Environmentally AssistedCracking of Alloys 600 and 690 in Simulated LWR Water, in Environmentally AssistedCracking in Light Water Reactors, Semiannual Report, July 1998–December 1998,NUREG/CR–4667 Vol. 27, ANL–99/11, pp. 45-54 (October 1999).
46
12. W. K. Soppet, O. K. Chopra, and W. J. Shack, Environmentally Assisted Cracking of Alloys600 and 690 in Simulated LWR Water, in Environmentally Assisted Cracking in LightWater Reactors, Semiannual Report, July 1999–December 1999, NUREG/CR–4667Vol. 29, ANL–00/23, pp. 39-45 (November 2000).
13. G. L. Webb and M. G. Burke, Stress Corrosion Cracking Behavior of Ally 600 inHigh–Temperature Water, in Proc. of the 7th Intl. Symp. on Environmental Degradation ofMaterials in Nuclear Power Systems-Water Reactors, NACE International, Houston, TX,pp. 41–55 (1995).
14. J. M. Server, J. R. Crum, and W. L. Mankins, Carbide Precipitation and the Effect ofThermal Treatments on the SCC Behavior of Inconel Alloy 690, in Proc. of the Third Intl.Symp. on Environmental Degradation of Materials in Nuclear Power Systems-WaterReactors, The Metallurgical Society, Warrendale, PA, pp. 581–586 (1987).
15. D. A. Mertz, P. T. Duda, P. N. Pica, and G. L. Spahr, Role of Microstructure in CausticStress Corrosion Cracking of Alloy 690, in Proc. of the 7th Intl. Symp. on EnvironmentalDegradation of Materials in Nuclear Power Systems-Water Reactors, NACE International,Houston, TX, pp. 477–494 (1995).
16. C. L. Briant and E. L. Hall, The Microstructural Causes of Intergranular Corrosion of Alloys82 and 182, Corrosion, 43, pp. 539–548 (1987).
17. G. Kharshafdjian, and A. H. Park, PVRC Alloy 600 Fatigue Growth Rate Module, CD-ROMFile DADN600.XLS (September 1999).
18. L. A. James, Fatigue Crack Propagation Behavior of Inconel 600, Int. J. Pres. Vessels andPiping, Vol. 5, pp. 241–259 (1977).
19. R. G. Ballinger, R. M. Latanision, W. C. Moshier, and R. M. Pelloux, The Effects of HeatTreatment and Environment on Corrosion Fatigue, Volume 2: Alloy 600, EPRI TR-102436(May 1993).
20. C. Amzallag, G. Baudry, and J. L. Bernard, Effects of PWR Environment on the FatigueCrack Growth of Different Stainless Steels and Inconel Type Alloy, Proc. IAEA-SpecialistsMeeting on Subcritical Crack Growth, NUREG/CP–0044, Vol. 1, pp. 263–294 (1983).
21. H. Nagano, K. Tokimasa, K. Tanaka, and H. Tsuge, Evaluation of SCC Resistance of Alloy600 in High Temperature Pressurized Water Environments by the High–Stress–Ratio CyclicCrack Growth Tests, ISIJ Intl., 28, p. 338 (1988).
22. G. S. Was and R. G. Ballinger, Hydrogen Induced Cracking under Cyclic Loading of NickelBase Alloys Used for PWR Steam Generator Tubing, Third Semi-Annual Progress Report,NP4613, Research Project 1166-3, EPRI (1980).
23. L. A. James and D. P. Jones, Fatigue Crack Growth Rates for Austenitic Stainless Steel inAir, in Predictive Capabilities in Environmentally Assisted Cracking, PVP Vol. 99, TheAmerican Society of Mechanical Engineers, New York, pp. 363–414 (1985).
47
24. W. H. Bamford, P. K. Liaw, and E. D. Eason, A Review of Corrosion Fatigue Crack GrowthBehavior for Pressure Vessel Steels in Light Water Environments, in Fatigue, Degradation,and Fracture – 1990, W. H. Bamford, et al., eds., PVP Vol. 195, MPC Vol. 30, TheAmerican Society of Mechanical Engineers, pp. 1–12 (1990).
25. E. K. Walker, The Effect of Stress Ratio during Crack Propagation and Fatigue for 2024–T3and 7075–T6, in The Effects of Environments and Complex Load History on Fatigue Life,STP 462, American Society for Testing and Materials, Philadelphia, pp. 1–14 (1970).
26. E. K. Walker, An Effective Strain Concept for Crack Propagation and Fatigue Life withSpecific Applications to Biaxial Stress Fatigue, in Proc. Air Force Conference on Fatigueand Fracture of Aircraft Structures and Materials, H. A. Wood, et al., eds., ReportAAFFDL–TR–70–144, Air Force Flight Dynamics Laboratory, pp. 25–233 (Sept. 1970).
27. J. L. Bernard and G. S. Slama, Fatigue Crack Growth in Air Environment at 300°C forStainless Steels, Nucl. Technol., 59 (1), 136–147 (1982).
28. P. Rabbe and H. P. Lieurade, Etude a l’Aide de la Mecanique de la Rupture de la VitesseFissuration en Fatigue d’une Gamme Etendue d’Aciers, Memoires Scientificiques RevueMetallurgie, 69 (9), 606–621 (1972).
29. R. Lindstrom, P. Lidar, and J. Lagerstrom, Crack Growth of Alloy 182 in Simulated PrimarySide PWR Environment, in Proc. of the 8th Intl. Symp. on Environmental Degradation ofMaterials in Nuclear Power Systems-Water Reactors, S. M. Bruemmer, ed., AmericanNuclear Society, La Grange Park, IL, pp. 422–429 (1997).
30. L. A. James and W. J. Mills, Fatigue–Crack Propagation Behavior of Wrought Alloy 600 andWeld–Deposited EN82H in an Elevated Temperature Aqueous Environment, in ServiceExperience, Structural Integrity, Severe Accident, and Erosion in Nuclear and FossilPlants, PVP Vol. 303, The American Society of Mechanical Engineers, pp. 21–36 (1995).
31. C. K. Sheeks, W. C. Moshier, R. G. Ballinger, R. M. Latanision, and R. M. N. Pelloux,Fatigue Crack Growth of Alloys X-750 and 600 In Simulated PWR and BWR Environments,in Intl. Symp. on Environmental Degradation of Materials in Nuclear Power Systems-Water Reactors, NACE, pp. 701–726 (1984).
32. N. Konda, K. Toyama, K. Yamanaka, and K. Tokimasa, Environmental Effects on the CrackGrowth Properties of Alloy 600, Sumitomo Metal Industries, Ltd. R & D Division, 1-3Fusocho, Amagasaki 660, Japan (October 1991).
33. H. Nagano, K. Tokimasa, K. Tanaka, and H. Tsuge, Evaluation of SCC Resistance of Alloy600 in High Temperature Pressurized Water Environments by the High Stress Ratio CyclicCrack Growth Tests, ISIJ Intl. (1988).
34. P. L. Andresen, Fracture Mechanics Data and Monitoring of Environmental Cracking ofNickel–Base Alloys in High–Temperature Water, Corrosion, 47, pp. 917–938 (1991).
35. G. Nakao, H. Yamasaki, and S. Kimura, Fatigue Crack Growth Behavior of Inconel 600Alloys in Oxygenated High Temperature Pure Water, cited in Ref. 34 (1985).
48
36. H. D. Solomon, Summary of In 600 Metallurgical Studies, Report SRD–81–034, GE CRD,Schenectady, NY (April 1981).
37. R. Magdowski, F. Vaillant, C. Amzallag, and M. O. Speidel, Stress Corrosion Crack GrowthRates of Alloy 600 in Simulated PWR Coolant, in Proc. of the 8th Intl. Symp. onEnvironmental Degradation of Materials in Nuclear Power Systems-Water Reactors, S. M.Bruemmer, ed., American Nuclear Society, La Grange Park, IL, pp. 333-338 (1997).
38. T. Cassagne, D. Caron, J. Daret, and Y. Lefevre, Stress Corrosion Crack Growth RateMeasurements in Alloys 600 and 182 in Primary Loops Under Constant Load, in Proc. ofthe Ninth Intl. Symp. on Environmental Degradation of Materials in Nuclear PowerSystems-Water Reactors, F. P. Ford, S. M. Bruemmer, and G. S. Was, eds., The Minerals,Metals, and Materials Society, Warrendale, PA, pp. 217-224 (1999).
39. J. Lagerstrom, U. Ehrnsten, T. Saario, and H. Hanninen, Model for EnvironmentallyAsisted Cracking of Alloy 600 in PWR Primary Water, in Proc. of the 8th Intl. Symp. onEnvironmental Degradation of Materials in Nuclear Power Systems-Water Reactors, S. M.Bruemmer, ed., American Nuclear Society, La Grange Park, IL, pp. 349–356 (1997).
40. F. P. Ford, Quantitative Prediction of Environmentally Assisted Cracking, Corrosion, 52,pp. 375–395 (1997).
41. F. P. Ford, D. F. Taylor, P. L. Andresen, and R. Ballinger, Corrosion-Assisted Cracking ofStainless and Low-alloy Steels, EPRI NP-5064, Electric Power Research Institute, PaloAlto, CA (Feb. 1987).
42. T. Shoji, Quantitative Prediction of Environmentally Assisted Cracking Based on Crack TipStrain Rate, Proc. Conf. on Predictive Capabilities in Environmentally–Assisted Cracking,R. Rungta, ed., PVP Vol. 99, American Society of Mechanical Engineers,New York, pp. 127-142 (1985).
43. M. J. Psaila–Dombrowski, C. S. Wade, J. M. Sarver, W. A. Van Der Sluys, and P. E.Doherty, Evaluation of Weld Metals 82, 152, 52, and Alloy 690 Stress Corrosion Crackingand Corrosion Fatigue Susceptibility, in Proc. of the 8th Intl. Symp. on EnvironmentalDegradation of Materials in Nuclear Power Systems-Water Reactors, S. M. Bruemmer, ed.,American Nuclear Society, La Grange Park, IL, pp. 412–421 (1997).
44. P. L. Andresen, Observation and Prediction of the Effects of Water Chemistry andMechanics on Environmentally Assisted Cracking of Inconels 182 Weld Metal and 600,Corrosion, 44, 376–385 (1988).
45. R. G. Lott, R. J. Jacko, and R. E. Gold, Primary Water Stress Corrosion Crack GrowthRates in Alloy 600 Steam Generator Tubing, in Proc. of the 5th Intl. Symp. onEnvironmental Degradation of Materials in Nuclear Power Systems-Water Reactors,American Nuclear Society, La Grange Park, IL, pp. 525-532 (1991).
49
46. R. B. Rebak., A. R. McIlree, and Szklarska-Smialowska, Effects of pH and Stress Intensityon Crack Growth Rate in Alloy 600 in Lithiated + Borated Water at High Temperatures, inProc. of the 5th Intl. Symp. on Environmental Degradation of Materials in Nuclear PowerSystems-Water Reactors, American Nuclear Society, La Grange Park, IL, pp. 511-517(1991).
47. T. Cassagne, and A. Gelpi, Crack Growth Rate Measurements on Alloy 600 SteamGenerator Tubing in Primary and Hydrogenated AVT Water, in Proc. of the Sixth Intl.Symp. on Environmental Degradation of Materials in Nuclear Power Systems-WaterReactors, R. E. Gold and E. P. Simonen, eds., The Minerals, Metals, and MaterialsSociety, Warrendale, PA, pp. 679-685 (1993).
48. C. Pichon, D. Buisine, C. Faidy, A. Gelpi, and M. Vaindirlis, Phenimenon Analysis ofStress Corrosion Cracking in the Vessel Head Penetrations of French PWR’s, in Proc. of the7th Intl. Symp. on Environmental Degradation of Materials in Nuclear Power Systems-Water Reactors, NACE International, Houston, TX, pp. 1-10 (1995).
49. F. Vaillant, C. Amzallag, and J. Champredonde, Crack Growth Rate Measurements of Alloy600 Vessel Head Penetrations, in Proc. of the 8th Intl. Symp. on EnvironmentalDegradation of Materials in Nuclear Power Systems-Water Reactors, S. M. Bruemmer, ed.,American Nuclear Society, La Grange Park, IL, pp. 357-365 (1997).
50. L. G. Ljungberg and M. Stigenberg, Stress Corrosion Cracking propagation in Low-StrengthNickel-Base Alloys in Simulated BWR Environments, in Proc. of the 8th Intl. Symp. onEnvironmental Degradation of Materials in Nuclear Power Systems-Water Reactors, S. M.Bruemmer, ed., American Nuclear Society, La Grange Park, IL, pp. 704-711 (1997).
51. R. M. Latanision and R. W. Staehle, Stress Corrosion Cracking of Iron–Nickel–ChromiumAlloys, in Proc. of Conf. on Fundamental Aspects of Stress Corrosion Cracking, R. W.Staehle, A. J. Forty, and D. Van Rooyen, eds., NACE, Houston, TX (1969).
52. S. M. Bruemmer, L. A. Charlot, and C. H. Henager, Microstructure and MicrodeformationEffects on IGSCC of Alloy 600, Corrosion, 44, 782 (1988).
53. Foster, J. P., Bamford, W. H., and Pathania, R. S., 1997, Effect of Materials Variables onAlloy 600 Crack Growth Rates, in Proc. of the 8th Intl. Symp. on EnvironmentalDegradation of Materials in Nuclear Power Systems-Water Reactors, S. M. Bruemmer, ed.,American Nuclear Society, La Grange Park, IL, pp. 340–348.
54. G. Economy, R. J. Jacko, and F. W. Pement, IGSCC Behavior of Alloy 600 in Water orSteam Tests above 360°C, Corrosion, 43, 727–734 (1987).
55. C. M. Brown and W. J. Mills, Effect of Water on Mechanical Properties and Stress CorrosionBehavior of Alloy 600, Alloy 690, EN82H Welds, and EN52 Welds, Corrosion, 55 (2),173–186 (1999).
56. C. M. Brown and W. J. Mills, Fracture Behavior of Nickel–Based Alloys in Water, in Proc. ofthe Ninth Intl. Symp. on Environmental Degradation of Materials in Nuclear PowerSystems-Water Reactors, F. P. Ford, S. M. Bruemmer, and G. S. Was, eds., The Minerals,Metals, and Materials Society, Warrendale, PA, pp. 1–8 (1999).
50
57. W. H. Bamford, J. P. Foster, and R. S. Pathania, An Investigation of Alloy 182 StressCorrosion Cracking in Simulated PWR Environment, in Proc. of the Ninth Intl. Symp. onEnvironmental Degradation of Materials in Nuclear Power Systems-Water Reactors, F. P.Ford, S. M. Bruemmer, and G. S. Was, eds., The Minerals, Metals, and Materials Society,Warrendale, PA, pp. 279–294 (1999).
58. A. Jenssen, U. Morin, B. Bengtsson, and C. Jansson, Crack Propagation in StainlessSteels and Nickel Base Alloys in a Commercial Operating BWR, in Proc. of the 7th Intl.Symp. on Environmental Degradation of Materials in Nuclear Power Systems-WaterReactors, NACE International, Houston, TX, pp. 553–562 (1995).
59. M. Itow, Y. Abe, A. Sudo, and T. Kaneko, Crack Growth Rates of Alloy 182 in HighTemperature Water, in Proc. of the 7th Intl. Symp. on Environmental Degradation ofMaterials in Nuclear Power Systems-Water Reactors, NACE International, Houston, TX,pp. 541–552 (1995).
60. M. Itow, Y. Abe, S. Hida, H. Sakamoto, K. Takamori, and S. Suzuki, The Effect ofCorrosion Potential on Alloy 182 Crack Growth Rate in High Temperature Water, in Proc. ofthe 8th Intl. Symp. on Environmental Degradation of Materials in Nuclear PowerSystems-Water Reactors, S. M. Bruemmer, ed., American Nuclear Society, La GrangePark, IL, pp. 712-721 (1997).
61. L. G. Ljungberg, Stress Corrosion Cracking of Alloys 600 and 182 in BWR Environments –Interim Report, EPRI TR–100658, Electric Power Research Institute (1992).
62. L. G. Ljungberg, M. Stigenberg, K. Gott, U. Morin, J. L. Nelson, B. Bengtsson, andC. Jansson, Propagation of Stress Corrosion Cracking in Weld Structures of the Nickel–BaseAlloy 182, in Proc. of the Intl. Symp. on Plant Aging and Life Predictions of CorrodibleStructures, pp. 911–920 (1995).
63. P. Scott, An Analysis of Primary Water Stress Corrosion Cracking in PWR SteamGenerators, Proc. of the Specialists Meeting on Operating Experience with SteamGenerators, Brussels, Belgium, pp. 5–6 (1991).
64. A. R. McIlree, R. B. Rebak, and S. Smialowska, Relationship of Stress Intensity to CrackGrowth Rate of Alloy 600 in Primary Water, in Proc. Intl. Symp. Fontevraud II, Vol. 1, 261(1990).
65. C. H. Shen and P. G. Shewmon, IGSCC A Mechanism for Hydrogen–Induced IntergranularStress Corrosion Cracking in Alloy 600, Met. Trans., 21A, 1261–1271 (1990).
1. REPORT NUMBER (Assigned by NRC. Add Vol., Supp., Rev., and Addendum Numbers, if any.)
NRC FORM 335(2–89)NRCM 1102,3201, 3202
U. S. NUCLEAR REGULATORY COMMISSION
BIBLIOGRAPHIC DATA SHEET(See instructions on the reverse)
2. TITLE AND SUBTITLE
NUREG/CR–6721ANL–01/07
3. DATE REPORT PUBLISHED
MONTH YEAR
March 2001
4. FIN OR GRANT NUMBER
Effects of Alloy Chemistry, Cold Work and Water Chemistry on Corrosion Fatigue and StressCorrosion Cracking of Nickel Alloys and Welds
W66105. AUTHOR(S) 6. TYPE OF REPORT
Technical7. PERIOD COVERED (Inclusive Dates)
O. K. Chopra, W. K. Soppet,, and W. J. Shack
8. PERFORMING ORGANIZATION – NAME AND ADDRESS (If NRC, provide Division, Office or Region, U.S. Nuclear Regulatory Commission, and mailing address; if contractor,provide name and mailing address.)
Argonne National Laboratory9700 South Cass AvenueArgonne, IL 60439
9. SPONSORING ORGANIZATION – NAME AND ADDRESS (If NRC, type “Same as above”: if contractor, provide NRC Division, Office or Region, U.S. Nuclear RegulatoryCommission, and mailing address.)
Division of Engineering TechnologyOffice of Nuclear Regulatory ResearchU.S. Nuclear Regulatory CommissionWashington, DC 20555–0001
10. SUPPLEMENTARY NOTES
M. B. McNeil, NRC Project Manager
11. ABSTRACT (200 words or less)
Reactor vessel internal components made of nickel–base alloys are susceptible to environmentally assisted cracking (EAC). Abetter understanding of the causes and mechanisms of this cracking may permit less conservative estimates of damageaccumulation and requirements on inspection intervals. The objective of this work is to evaluate and compare the resistance ofAlloys 600 and 690 and their welds, such as Alloys 82, 182, 52, and 152, to EAC in simulated light water reactor environments.The existing crack growth rate (CGR) data for these alloys under cyclic and constant loads have been evaluated to establish theeffects of alloy chemistry, cold work, and water chemistry. The experimental fatigue CGRs are compared with CGRs that would beexpected in air under the same mechanical loading conditions to obtain a qualitative understanding of the degree and range ofconditions for significant environmental enhancement in growth rates. The existing stress corrosion cracking (SCC) data on Alloys600 and 690 and Alloy 82, 182, and 52 welds have been compiled and analyzed to determine the influence of key parameters ongrowth rates in simulated PWR and BWR environments. The SCC data for these alloys have been evaluated with correlationsdeveloped by Scott and by Ford and Andresen.
12. KEY WORDS/DESCRIPTORS (List words or phrases that will assist researchers in locating this report.) 13. AVAILABILITY STATEMENT