13 Effects of Anomalous Propagation Conditions on Weather Radar Observations Joan Bech 1 , Adolfo Magaldi 2 , Bernat Codina 1 and Jeroni Lorente 1 1 Dep. Astronomy and Meteorology, University of Barcelona 2 Institute of Space Sciences, Spanish National Research Council (CSIC), Bellatera Spain 1. Introduction The effect of atmospheric propagation on radar observations is an important topic both for radar application developers and end-users of radar products, particularly of weather radar systems. An excellent review of this subject is given by Patterson (2008), and most general books about weather radars have a chapter on the topic –see for example Battan (1973), Collier (1996), Doviak and Zrnic (2006), Rinehart (2001) or Sauvageot (1991). In this chapter our objective is to provide an overview of the effects of anomalous propagation conditions on weather radar observations, based mostly on studies performed by the authors during the last decade, summarizing results from recent publications, presentations, or unpublished material. We believe this chapter may be useful as an introductory text for graduate students, or researchers and practitioners dealing with this topic. Throughout the text a spherical symmetric atmosphere is assumed and the focus is on the occurrence of ground and sea clutter and subsequent problems for weather radar applications. Other related topics such as long-path, over-the-horizon propagation and detection of radar targets (either clutter or weather systems) at long ranges is not considered here; however readers should be aware of the potential problems these phenomena may have as range aliasing may cause these echoes appear nearer than they are – for more details see the discussion about second trip echoes by Zrnic, this volume. Despite the motivation and results shown here are focused on ground-based weather radar systems (typically X, C or S band radars, i.e. cm-radars), a large part of these results are applicable to other types of radar, in fact also to micro-wave links or, in general terms, for propagation of electromagnetic waves in the atmosphere. As discussed in detail below, the main effect of anomalous propagation on weather radar observation is a lower height of the observed echoes than expected in normal conditions. This may imply an increase of ground clutter or, for radars operating near the coast, an increase of sea clutter, which will be hardly corrected by the standard Doppler filtering, affecting inevitably precipitation estimates. This chapter is organized as follows. Section 2 introduces the fundamental concepts of refractivity and modified refractivity and the various propagation conditions associated with refractivity profiles. Section 3 presents some results on propagation condition variability, and Section 4 focuses specifically upon the impact of that variability on radar beam blockage www.intechopen.com
Transcript
13
Effects of Anomalous Propagation Conditions on Weather Radar Observations
Joan Bech1, Adolfo Magaldi2, Bernat Codina1 and Jeroni Lorente1 1Dep. Astronomy and Meteorology, University of Barcelona
2Institute of Space Sciences, Spanish National Research Council (CSIC), Bellatera Spain
1. Introduction
The effect of atmospheric propagation on radar observations is an important topic both for radar application developers and end-users of radar products, particularly of weather radar systems. An excellent review of this subject is given by Patterson (2008), and most general books about weather radars have a chapter on the topic –see for example Battan (1973), Collier (1996), Doviak and Zrnic (2006), Rinehart (2001) or Sauvageot (1991).
In this chapter our objective is to provide an overview of the effects of anomalous propagation conditions on weather radar observations, based mostly on studies performed by the authors during the last decade, summarizing results from recent publications, presentations, or unpublished material. We believe this chapter may be useful as an introductory text for graduate students, or researchers and practitioners dealing with this topic. Throughout the text a spherical symmetric atmosphere is assumed and the focus is on the occurrence of ground and sea clutter and subsequent problems for weather radar applications. Other related topics such as long-path, over-the-horizon propagation and detection of radar targets (either clutter or weather systems) at long ranges is not considered here; however readers should be aware of the potential problems these phenomena may have as range aliasing may cause these echoes appear nearer than they are – for more details see the discussion about second trip echoes by Zrnic, this volume.
Despite the motivation and results shown here are focused on ground-based weather radar systems (typically X, C or S band radars, i.e. cm-radars), a large part of these results are applicable to other types of radar, in fact also to micro-wave links or, in general terms, for propagation of electromagnetic waves in the atmosphere. As discussed in detail below, the main effect of anomalous propagation on weather radar observation is a lower height of the observed echoes than expected in normal conditions. This may imply an increase of ground clutter or, for radars operating near the coast, an increase of sea clutter, which will be hardly corrected by the standard Doppler filtering, affecting inevitably precipitation estimates.
This chapter is organized as follows. Section 2 introduces the fundamental concepts of refractivity and modified refractivity and the various propagation conditions associated with refractivity profiles. Section 3 presents some results on propagation condition variability, and Section 4 focuses specifically upon the impact of that variability on radar beam blockage
www.intechopen.com
Doppler Radar Observations – Weather Radar, Wind Profiler, Ionospheric Radar, and Other Advanced Applications
308
corrections and subsequent precipitation estimates. Section 5 deals with the topic of propagation conditions forecasting and Section 6 presents a method to correct the effects of intense anomalous propagation conditions on weather radar precipitation estimates using satellite observations. Finally Section 7 provides a summary and concluding remarks.
2. Weather radar beam propagation conditions
This section presents qualitatively the different propagation regimes affecting the radar beam refraction. By radar beam we mean the energy emitted (and received) by the radar, limited by the half-power (3 dB) antenna main lobe (see Zrnic, this volume, for more details). In the vacuum, as in any media with constant index of refraction, a radar beam follows a straight trajectory. But in the atmosphere the index of refraction changes and therefore the variation of the air refractive index plays a key role when characterizing the propagation conditions of a radar beam in the troposphere, i.e. the lowest part of the atmosphere. In particular, the vertical profiles of the air temperature, moisture and pressure are mostly responsible for the way the radar energy will propagate in a given air layer. A number of assumptions on these vertical profiles are usually made, assuming the so-called "standard” or normal propagation conditions which are associated with the average state of the atmosphere accepted as the most representative, as discussed below. Under those conditions, the radar beam bends downward with a radius of curvature greater than that of the Earth surface. Consequently, the net effect is an increase of the height of the centre of the beam with respect to the ground as the distance from the radar increases (in Section 4 the equation for the radar beam height is given).
However, due to the inherent variability of the atmosphere, it is a well-known fact that propagation conditions may differ, sometimes significantly, from those considered standard resulting in anomalous propagation (AP). As illustrated schematically in Fig. 1, subrefraction causes the radar beam to bend less than usual, and therefore follows a higher trajectory than in normal conditions. Super refraction of a weather radar beam produces more bending towards the ground surface than expected for standard conditions and therefore increases and intensifies ground clutter echoes (AP or anaprop echoes). An extreme case of superrefraction, known as ducting, occurs when the beam has a curvature smaller than that of the Earth surface.
Fig. 1. Radar beam propagation conditions (adapted from US NOAA National Weather Service, introductory radar tutorial, “Doppler radar beams”, http://www.srh.noaa.gov/jetstream/doppler/beam_max.htm ).
www.intechopen.com
Effects of Anomalous Propagation Conditions on Weather Radar Observations
309
Note that the term AP literally means “anomalous propagation” but AP echoes are associated with superrefraction and ducting, not to subrefraction. The occurrence of AP echoes may be particularly negative for automated quantitative precipitation estimates (QPE) such as those required for operational weather surveillance and hydrological flood warning. On the other hand, it should be noted that ducting may occur not only in the lowest air layer (surface ducting) as represented in Fig. 1d, but also on an elevated layer above which there is normal refraction. In that case, the duct (known as elevated duct), may trap the radar energy for a long distance without producing evident signs – AP echoes.
Figure 2 illustrates the effect of AP echoes on weather radar observations. It shows two radar reflectivity Plan Position Indicator (PPI) images recorded by the weather radar of the Meteorological Service of Catalonia located in Vallirana (41º22’N, 1º52’E, about 20 km west of Barcelona). The PPIs were obtained in two different days, one with normal propagation conditions, and the other under superrefraction conditions; none on those images show real precipitation, only ground and sea clutter. To see more clearly the change in AP echoes no Doppler filtering was applied to these images. In Fig. 2b arrows indicate some of the new or intensified AP echoes, either ground clutter (southernmost arrow pointing to the coast, or easternmost arrow pointing to the small island of Minorca), or sea clutter (around the centre of the image). PPI images corresponding to Fig. 2b where Doppler filtering was applied reduced largely AP ground clutter but not sea clutter, or other moving targets such as wind turbines, which may yield spurious hourly accumulations exceeding 50 mm.
Fig. 2. Radar reflectivity base PPI images (0.6º) with no Doppler filtering showing ground and sea clutter on a normal propagation day (a) and a superrefractive day (b). Arrows indicate new or more intense AP echoes.
Despite the fact that AP echoes may be detected and cleaned with several techniques, this does not prevent that radar observations may be affected because of the difference between their real height and that expected assuming standard conditions. If this difference is important enough for a given application, any procedure which requires a precise knowledge of the echo altitude may be potentially affected by AP. For example, if radar data (either echo intensity or Doppler winds) are to be assimilated in a NWP model or if the radar echo intensity is corrected for beam blockage due to mountain sheltering (Bech et al., 2003), the effect may be relevant.
www.intechopen.com
Doppler Radar Observations – Weather Radar, Wind Profiler, Ionospheric Radar, and Other Advanced Applications
310
2.1 Refractivity N
As anomalous propagation is due to relatively small variations of the air refractive index n, the magnitude known as refractivity N, defined as one million times n-1, is commonly used in anaprop studies. As shown by Bean and Dutton (1968), or more recently in ITU (2003), N can be written as:
6 77.6 4810( 1)10
eN n p
T T
, (1)
where T is the air temperature (K), p atmospheric pressure (hPa), and e is the water vapour pressure (hPa). According to ITU (2003), this expression may be used for all radio frequencies; for frequencies up to 100 GHz, the error is less than 0.5%. This formula takes into account only air gases and does not consider liquid water content (usually with negligible effects), or free electron density (important for high atmospheric altitudes, typically above 60 km).
Note that N is a dimensionless magnitude, though quite often the term “N units” is employed. N is sometimes considered the sum of two different terms of (1): the dry term, Nd, which depends only on p and T, and the wet term, Nw, which is also function of e, i.e. is related to moisture content. Typical values of N of air at ground level are within the range 250 to 450.
2.2 Modified refractivity M
A magnitude related to N is the modified refractivity M, which is defined as:
610z
M Nr , (2)
where z is altitude and r is the radius of the Earth, expressed in meters (m). Modified refractivity is very useful to characterize propagation conditions as for constant M the curvature of the ray path is that of the Earth's surface and, therefore, when there are negative M vertical gradients the ray path may be bent towards the surface and then radio waves get trapped like in a wave guide (ducting). Based on M gradients, Johnson et al. (1999) suggested the use of a ducting index, with positive values proportional to the probability of occurrence of ducting.
2.3 Propagation conditions
Propagation characteristics may vary largely, depending for instance on the type of air mass (Gossard, 1977). When characterizing the radio propagation environment it is usual to consider the vertical refractivity gradient (VRG) of the air of the first kilometre above ground level to estimate propagation effects such as ducting, surface reflection and multipath on terrestrial line-of-sight links. However, the effect on weather radar beam refraction not only depends on the refractivity gradient of a layer but also on the angle of incidence between the beam and the trapping layer considered or the frequency of the electromagnetic wave (ITU, 2003). In the following paragraph, specific VRG values are given for the propagation conditions described earlier qualitatively.
www.intechopen.com
Effects of Anomalous Propagation Conditions on Weather Radar Observations
311
For weather radar applications, if the vertical refractivity gradient of the first kilometre (VRG) of the atmosphere is around –1/4r (i.e. –39 N units km-1 or 118 M units km-1, where r is the Earth’s radius) then standard propagation will occur for any angle of incidence (Doviak and Zrnic, 2006). An increase in VRG bends the radar beam more slowly than normal (subrefraction) and reduces the microwave radar horizon. With regard to ground clutter echoes, subrefraction implies a decrease in their frequency and intensity. On the other hand, a decrease in VRG generates the opposite effect, bending the beam faster than normal (super refraction) for the interval between (typically) –78.7 km-1 and –157 km-1 (the threshold to distinguish between standard propagation and superrefraction varies in the literature around 80 km-1). Trapping, or ducting, the most extreme case of anomalous propagation, occurs for values lower than –157 km-1, and in this case the microwave energy may travel for long distances before intercepting ground targets producing anomalous propagation (i.e., anaprop or AP) echoes. In fact the exact threshold for ducting depends on the precise local value of the Earth radius, which means that it is not a constant value (for example varies with latitude) – see Table 1 for a summary of ranges of refractivity and modified refractivity gradients for different propagation conditions. As a reference, the two examples of radar images shown in Fig. 2 were recorded with VRGs of –43 and –112 km-1.
Table 1. Effects upon propagation under different ranges of dN/dZ and dM/dZ (adapted from Bech et al. 2007a).
On the other hand, a careful analysis of the fluctuation of target reflectivity may be a way to monitor variations in atmospheric conditions (changes in moisture content, etc.) as shown by Fabry et al. (1997). Subsequent research from that work triggered new interest in the analysis and characterization of refractivity profiles near ground level – see for example Park & Fabry (2011).
Superrefraction and ducting in particular, is usually associated with temperature inversions or sharp water vapour vertical gradients. During cloudless nights, radiation cooling over land favours the formation of ducts which disappear as soon as the sun heats the soil surface destroying the temperature inversion. This process may be sometimes clearly observed in the daily evolution of clutter echoes, as reported by Moszkowicz et al. (1994) and others.
3. Propapagation condition variability
As radiosoundings have been traditionally the only source of upper air information available on a routine basis, they have been used for years to calculate long term averages of propagation conditions –see, for example, Gossard (1977) or Low and Huddak (1997)–. Since 1997, radiosonde observations have been made in Barcelona to support the operations of the regional government's Subdirectorate of Air Quality and Meteorology, which later became the Meteorological Service of Catalonia.
www.intechopen.com
Doppler Radar Observations – Weather Radar, Wind Profiler, Ionospheric Radar, and Other Advanced Applications
312
Results presented below were derived from observations collected from Vaisala RS-80 sondes (from 41.38ºN, 2.12ºE and 98 m asl) which sampled every 10 s providing much higher vertical resolution than the usual standard operational radiosounding observations. This allowed better characterization of the air refractive index variability and the detection of thinner super refractive layers that may not be detected by standard radiosounding observations but may have significant effects in the propagation of the radar beam. Most results presented in this and the next section, are based on data collected between 1997 and 2002, at 00 and 12 UTC in Barcelona (Bech et al., 1998, 2000, 2002). From the original 2485 radiosoundings available, 86% passed the quality control process (based both in data format and content analysis, adapted from Météo-France, 1997).
3.1 Surface refractivity
Surface refractivity is an important factor in radiometeorology; it appears in the refractivity exponential model and is one of the terms used in the standard computation of the VRG (ITU, 2003). Table 2 shows Barcelona Ns statistics.
Table 2. Ns statistics for Barcelona calculated from 00Z and 12Z data.
www.intechopen.com
Effects of Anomalous Propagation Conditions on Weather Radar Observations
313
It may be noted that nocturnal Ns values were lower than noon values (about 5 N units in the monthly means) and also the existence of a marked seasonal pattern with a peak in August and a minimum in December. This yearly cycle may be explained by examining the behaviour of the magnitudes considered in the computation of refractivity and also by considering separately the dry and wet terms (Fig. 3).
Fig. 3. Evolution of surface refractivity (Ns) and the wet (Nw) and dry terms (Nd) over Barcelona (Bech, 2003).
Monthly variations of these magnitudes show different behaviours. While the temperature follows a very clear seasonal pattern (highs in summer and lows in winter, as expected), in the case of the pressure it is much weaker (approximately winter maxima and summer minima). The humidity, changing constantly throughout the year, exhibits no apparent pattern. These behaviours are reflected in the evolution of Nd and Nw. The first one, proportional to pT-1, is nearly constant with maxima in summer and minima in winter; the second, proportional to eT-2, is much more variable (because of e) but maxima and minima are swapped with respect to Nd (because of T-2). Therefore, Nw, which represents about 30% of N, contributes mostly to its variation: at short scale, it adds variability and also, at monthly scale, modulates the summer maximum and winter minimum cycle which is slightly compensated by the opposite cycle shown by Nd.
Surface refractivity distributions in Barcelona are shown in Fig. 4, exhibiting larger variations at 12 UTC (aprox. 265 – 385) than at 00 UTC.
Fig. 4. Surface refractivity distributions at 00 and 12 UTC in Barcelona.
www.intechopen.com
Doppler Radar Observations – Weather Radar, Wind Profiler, Ionospheric Radar, and Other Advanced Applications
314
3.2 Vertical refractivity gradient
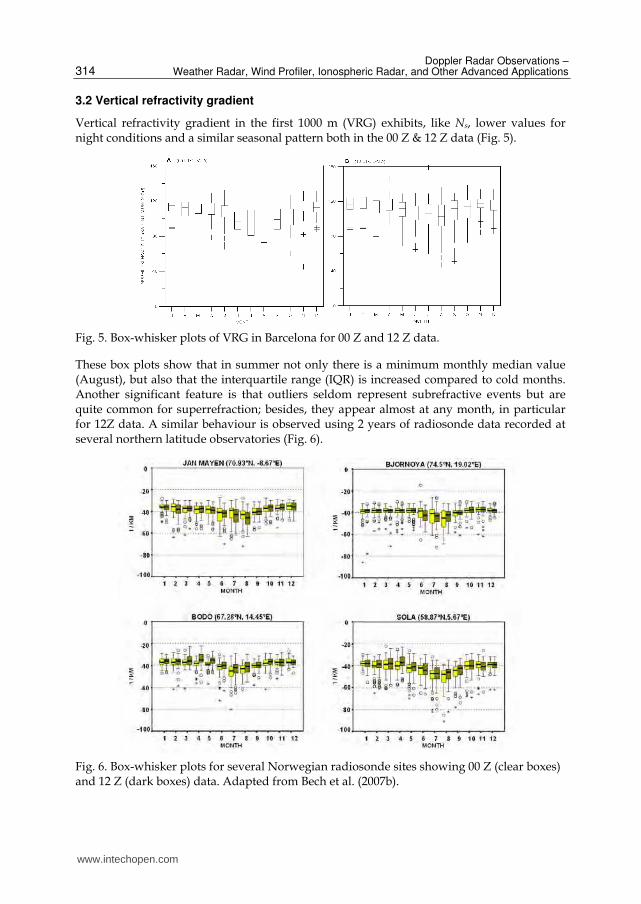
Vertical refractivity gradient in the first 1000 m (VRG) exhibits, like Ns, lower values for night conditions and a similar seasonal pattern both in the 00 Z & 12 Z data (Fig. 5).
Fig. 5. Box-whisker plots of VRG in Barcelona for 00 Z and 12 Z data.
These box plots show that in summer not only there is a minimum monthly median value (August), but also that the interquartile range (IQR) is increased compared to cold months. Another significant feature is that outliers seldom represent subrefractive events but are quite common for superrefraction; besides, they appear almost at any month, in particular for 12Z data. A similar behaviour is observed using 2 years of radiosonde data recorded at several northern latitude observatories (Fig. 6).
Fig. 6. Box-whisker plots for several Norwegian radiosonde sites showing 00 Z (clear boxes) and 12 Z (dark boxes) data. Adapted from Bech et al. (2007b).
www.intechopen.com
Effects of Anomalous Propagation Conditions on Weather Radar Observations
315
The yearly minima of VRG, below –80 km–1 sometimes reaching –120 km–1 (maximum superrefraction), at the end of the warm season is also appreciated in the VRG time series plot of Barcelona shown in Fig. 7.
Fig. 7. Time series plot of VRG (N units km-1) for the period 2000-2006 in Barcelona.
The seasonal pattern noted in Barcelona is already indicated in the VRG World Wide maps prepared by the International Telecommunications Union (ITU, 2003). In particular, in August, an area of maximum superrefraction affects the Western Mediterranean region, comparable in intensity to the maximum above the SW Pacific coast of N. America, and somewhat weaker than the Arabian Peninsula –where the world maximum is located for that month–. Using the Historical Electromagnetic Propagation Condition Data Base from the US Naval Systems Ocean Center (Patterson, 1987) a comparison with ten radiosonde stations located in the area was performed. Median monthly values allowed to check similar patterns both in Ns and VRG. A related study was carried out recently by Lopez (2009) using global analysis data from the European Centre for Medium-range Weather Forecasts (ECMWF) to assess the occurrence of superrefraction, or with a similar approach, but at a local scale, by Mentes and Kaymaz (2007) in Turkey, or Mesnard and Sauvageot (2010) in France.
The frequency and cumulative probability distributions for Barcelona VRG are shown in Fig 8. A similar unimodal left skewed pattern, with stepper slopes for higher VRG values (tending to super refraction), is shown for both 00 and 12 Z data. However, modal values are very near the nominal standard propagation value of -40 N units/km (-49 N units/km at night and -42 N/km units at noon).
Fig. 8. Frequency and cumulative probability distributions for the Barcelona VRG.
www.intechopen.com
Doppler Radar Observations – Weather Radar, Wind Profiler, Ionospheric Radar, and Other Advanced Applications
316
The relationship between surface refractivity and the vertical refractivity gradient for the first kilometre was investigated during the sixties for data collected in the UK (Lane, 1961) and the US (Bean and Dutton, 1968). In both cases a high correlation was found for monthly averages of both magnitudes. For the data set collected in Barcelona, a correlation of 0.9745 was found.
3.3 Anaprop echo variability
Quality control procedures for QPE have traditionally dealt with anaprop and, in general, clutter echoes (see, for example, Anderson et al., 1997; Archibald, 2000; da Silveira and Holt, 1997; Fulton et al., 1998; Joss and Lee, 1995; Kitchen et al., 1994; Sánchez-Diezma et al., 2001, Steiner and Smith, 2002; Szturc et al., in this volume; and Villarini and Krajewski, 2010, among others).
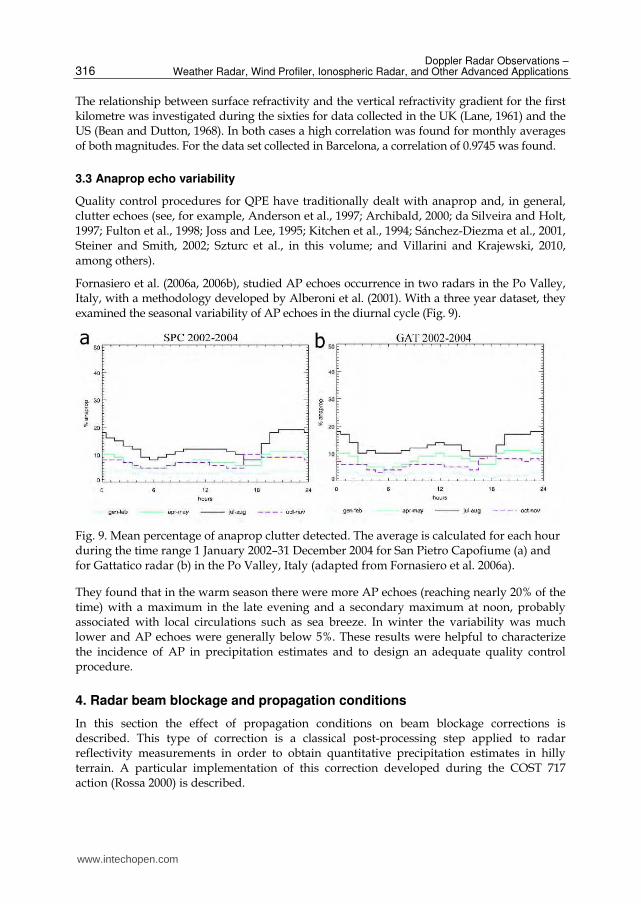
Fornasiero et al. (2006a, 2006b), studied AP echoes occurrence in two radars in the Po Valley, Italy, with a methodology developed by Alberoni et al. (2001). With a three year dataset, they examined the seasonal variability of AP echoes in the diurnal cycle (Fig. 9).
Fig. 9. Mean percentage of anaprop clutter detected. The average is calculated for each hour during the time range 1 January 2002–31 December 2004 for San Pietro Capofiume (a) and for Gattatico radar (b) in the Po Valley, Italy (adapted from Fornasiero et al. 2006a).
They found that in the warm season there were more AP echoes (reaching nearly 20% of the time) with a maximum in the late evening and a secondary maximum at noon, probably associated with local circulations such as sea breeze. In winter the variability was much lower and AP echoes were generally below 5%. These results were helpful to characterize the incidence of AP in precipitation estimates and to design an adequate quality control procedure.
4. Radar beam blockage and propagation conditions
In this section the effect of propagation conditions on beam blockage corrections is described. This type of correction is a classical post-processing step applied to radar reflectivity measurements in order to obtain quantitative precipitation estimates in hilly terrain. A particular implementation of this correction developed during the COST 717 action (Rossa 2000) is described.
www.intechopen.com
Effects of Anomalous Propagation Conditions on Weather Radar Observations
317
4.1 Radar beam blockage
Weather radars installed in complex orographic areas may suffer from partial or total beam blockage caused by surrounding mountains. This effect can restrict seriously the use of the lowest antenna elevation angles which typically provide the most useful information for precipitation estimation at ground level – see for example Joss and Waldvogel (1990), Sauvageot (1994), Collier (1996), or Smith (1998) among others. Therefore, in hilly terrain, beam blockage correction schemes are needed to minimize the effect of topography if quantitative precipitation estimations (QPE) are required. Such corrections are usually included in operational QPE procedures as can be seen in, for example, Crochet (2009), Harrold et al. (1974), Kitchen et al. (1994), Joss and Lee (1995), or Fulton et al. (1998) and may be combined with correction techniques based in the analysis of the 3-D echo structure (Krajewski and Vignal, 2001; or Steiner and Smith, 2002).
The idea that assuming normal propagation conditions for radar observations may not always be a good choice and the use of local climatological refractive data for a specific radar site was already proposed, for example, in the COST 73 Project (Newsome, 1992) and, in a different context, evaluated by Pittman (1999) to improve radar height measurements. In this section the effect of changing the radar beam propagation conditions upon an ordinary single polarization reflectivity blockage correction is described – note that polarimetric radars allow other type of corrections (Giangrande and Ryzhkov 2005; Lang et al. 2009). A simplified interception function is proposed to simulate beam blockage and particular results for the Vallirana weather radar, located at 650 m above sea level near Barcelona (NE Spain) in a complex orography zone are obtained considering real atmospheric propagation conditions.
4.2 Beam blockage simulation
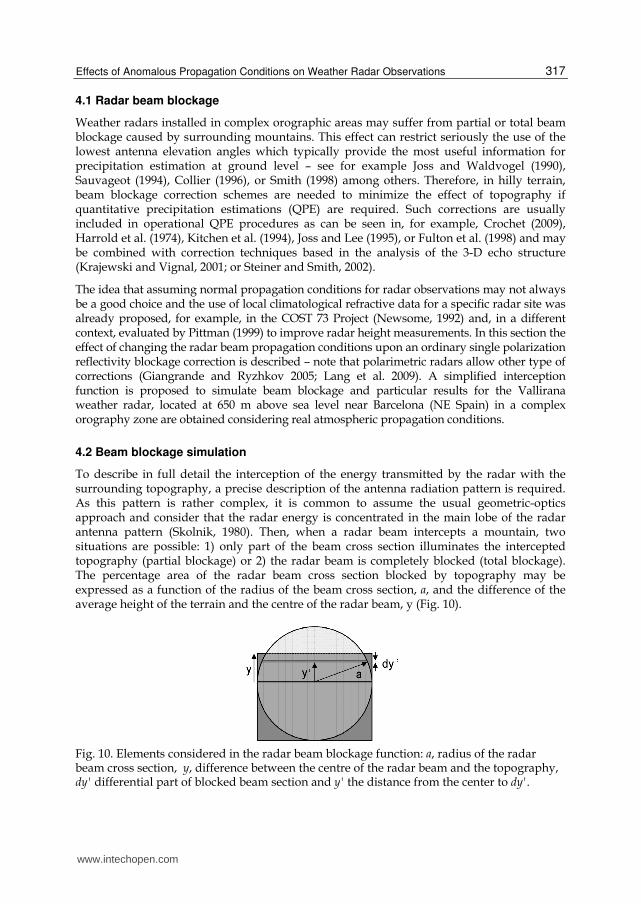
To describe in full detail the interception of the energy transmitted by the radar with the surrounding topography, a precise description of the antenna radiation pattern is required. As this pattern is rather complex, it is common to assume the usual geometric-optics approach and consider that the radar energy is concentrated in the main lobe of the radar antenna pattern (Skolnik, 1980). Then, when a radar beam intercepts a mountain, two situations are possible: 1) only part of the beam cross section illuminates the intercepted topography (partial blockage) or 2) the radar beam is completely blocked (total blockage). The percentage area of the radar beam cross section blocked by topography may be expressed as a function of the radius of the beam cross section, a, and the difference of the average height of the terrain and the centre of the radar beam, y (Fig. 10).
Fig. 10. Elements considered in the radar beam blockage function: a, radius of the radar beam cross section, y, difference between the centre of the radar beam and the topography, dy' differential part of blocked beam section and y' the distance from the center to dy'.
www.intechopen.com
Doppler Radar Observations – Weather Radar, Wind Profiler, Ionospheric Radar, and Other Advanced Applications
318
22 2 2
2
arcsin2
y ay a y a
aP BBa
. (3)
Depending on the relative position of the beam height respect to topography, y may be either positive or negative. According to these definitions, partial beam blockage occurs when –a < y < a, total beam blockage means that y ≥ a, and finally, y ≤ –a implies there is no blockage at all. Using the notation introduced above, it can be seen that integrating dy’ partial beam blockage, PBB, may be written as an analytical expression (Bech et al. 2003):
On the other hand, the height of the centre of the radar beam, h, is given at a distance r by the expression (see, for example, Doviak and Zrnic, 2006):
22
02 sine e eh r k R r k R k R H , (4)
where R is the Earth's radius, ke is the ratio between R and the equivalent Earth's radius, θ the antenna elevation angle and H0 the antenna height. Information about atmospheric propagation conditions is contained in ke, which may be written in terms of the refractivity gradient as:
1
1ek
dNR
dh
(5)
The usual value for ke in the first kilometre of the troposphere, assuming the normal VRG value of 40 km-1, is approximately 4/3. Substituting (5) and (4) in (3), an expression of the beam blockage in terms of the propagation conditions is obtained (Bech et al. 2003).
Three clutter targets (MNT, LML and MNY), which presented partial beam blockage under normal propagation conditions, were chosen to examine the effects of changing the VRG. The Vallirana radar (41 22' 28'' N, 1 52' 52'' E) is a C band Doppler system with a 1.3 º beam width antenna at 3 dB. The targets chosen are normally used to check the radar antenna alignment on a routine basis and are located within the region of interest of radar QPE.
The targets were located at different ranges, had different heights and showed different degrees of blockage, in order to be representative of the topography surrounding the radar. They are located in the so called Pre-coastal Range sharing a similar propagation environment and comparable to that obtained by the Barcelona radiosonde. For example the area considered is usually influenced by a marked sea-breeze circulation pattern, just like the city of Barcelona (Redaño et al., 1991).
4.3 Beam blockage correction
To evaluate the effects of anomalous propagation, the partial beam blocking correction scheme used in the NEXRAD Precipitation Processing System has been considered. This scheme (Fulton et. al, 1998) is applied to radar beams partially shielded. In particular, this type of beam blockage correction is applied to radar pixels (or radar bins) whose shielding ranges between 10% and 60% and it consists of modifying radar equivalent reflectivity
www.intechopen.com
Effects of Anomalous Propagation Conditions on Weather Radar Observations
319
factor measurements by adding 1 to 4 dB depending on the degree of occultation. The correction is also applied to all pixels further out in range of the same blocked radar ray, neglecting diffraction below shadow boundary. The correction depends only on the percentage of beam cross section shielded and, in the description provided by Fulton et al. (1998), no specific mention is made about which part of the beam is shielded. This approach allows consideration of a simple interception function, as the one proposed in the previous section, assuming that the correction additive factors contain considerations about interception details such as the beam power distribution. This beam blockage procedure is used with other corrections such as a test on the vertical echo continuity and a sectorized hybrid scan (Shedd et al., 1991). Other approaches to this question with different degrees of sophistication have been used in the past (see for example Delrieu et al. 1995, Gabella and Perona 1998, Michelson et al. 2000, Park et al. 2009). All of them have in common the assumption of standard propagation conditions of the radar beam.
4.4 Refractivity gradient vs beam blockage
The radar beam blockage under a particular VRG can be simulated considering both the observed propagation conditions and the interception function described in the previous sections. This may be achieved by assuming an homogeneous VRG for the whole radar beam and calculating the associated beam blockage for each selected target for a given initial antenna elevation angle.
In Fig. 11 a set of beam blockages vs VRG plots is shown for different antenna elevation angles. The refractivity gradient values considered contain the observed extreme VRG values (–119 km-1 and –15 km-1) and are also extended to include pure subrefraction (0 km-1) and almost ducting conditions (–156 km-1) to illustrate their effects. These extreme cases seem realistic taking into account the presence of thin ducting layers that may have high VRG embedded in others with lower VRG and considering the fact that the bending of the ray path is an additive process throughout the whole layer crossed by the radar beam.
Fig. 11. Simulated beam blockage vs vertical refractivity gradient for targets MNT, (circle), LML (square) and MNY (triangle) at different antenna elevation angles.
As expected, as the antenna angle increases, beam blockage is reduced. For example, for an antenna elevation of 0.7 º a relatively high beam blockage rate is expected as the lowest part of the main lobe in a 1.3º beam width antenna is pointing to the surrounding hills,
www.intechopen.com
Doppler Radar Observations – Weather Radar, Wind Profiler, Ionospheric Radar, and Other Advanced Applications
320
producing values of blockage ranging mostly between 30% and 80%. On the other hand, the 1.3º elevation beam blockage values are mostly below 20% and for some targets are always null (no blockage at all) except for the most super refractive situations.
In Fig. 12, target MNT, shows moderate (around 40%) to low (10%) rate of beam blockage, respectively (similar results were obtained for LML). On the other hand, we found that the most distant target, MNY, intercepted the radar beam mostly between 8% and 14%. The range of variations in the beam blockage observed in the above mentioned histograms oscillates from 8% (LML) and 10% (MNT) to 18% (MNY). From the cumulative probability plots obtained it may be noted that MNT and LML show single classes representing more than 50% while a more smoothed distribution is found for MNY.
Fig. 12. Simulated beam blockage frequency and cumulative probability distributions (left) and the corresponding correction histograms (right) for 1º antenna elevation for target MNT.
The corresponding correction histogram is also shown. Should the beam blockage correction have been a continuous function, where for a particular value of blockage a different correction factor would be applied, then the spread of the beam blockage histograms would have been reflected in the spread of the correction histograms. However, this is not the case for the particular type of correction considered where only four different correction values are possible depending on the beam blockage. Therefore, a big variability in the beam blockage occurrence does not necessarily produce the same variability in the blockage correction. An additional conclusion of this analysis (Bech et al. 2003) was that errors in beam blockage corrections derived from propagation variability were comparable to antenna pointing errors of 0.1º, which is a typical value for operational systems. This confirms the need for hardware calibration control and monitoring, particularly if quantitative precipitation estimates are required.
4.5 Improved quantitative precipitation estimates
The methodology proposed in the previous section to simulate the radar beam blockage by topography has been implemented to derive correction factors which were applied to improve precipitation estimates. For example Fornasiero et al. (2006b) performed corrections in different events, calculating specific corrections assuming both standard and non-standard propagation conditions and finding some improvement with the corrections. In Bech et al. (2007b, 2010a) results reported were carried out in the framework of the COST-731 action (Rossa et al. 2010) using the so-called BPM model (which implements the blockage function presented above. Larger data sets were considered for blockage corrections under standard
www.intechopen.com
Effects of Anomalous Propagation Conditions on Weather Radar Observations
321
conditions and individual ducting events were examined in detail. Here we illustrate some of the results obtained assuming standard propagation conditions.
Figure 13 shows details of Bømlo radar (59.5ºN, 5.1ºE) from the Norwegian Meteorological Service (met.no). A panorama from the radar site shows some of the hills which block the radar coverage (three of them are numbered). One year of precipitation, illustrating the blocked areas is also shown, as well as the correction factors computed with the BPM model. The improvement in the bias, defined here as 10 times the decimal logarithm of the ratio of gauge to radar derived precipitation amounts, is shown in Table 3. At all ranges the correction reduced the bias.
Fig. 13. a). Southern view from the Bømlo radar in Norway; three of the surrounding hills are numbered and indicated on the other panels. b). One year of radar precipitation estimates, illustrating clearly the blocked sectors with less (or no) precipitation. c). Modelled blockage with the BPM system. Figure courtesy of Dr. Uta Gjertsen (met.no).
Table 3. Bias (dB) of uncorrected and blockage-corrected (bold) radar estimates from the Bømlo radar for 2004 grouped in different ranges. Sample size is in parentheses. Adapted from Bech et al. (2007b).
www.intechopen.com
Doppler Radar Observations – Weather Radar, Wind Profiler, Ionospheric Radar, and Other Advanced Applications
322
5. Radar propagation condition forecasting
This section deals with anomalous propagation forecasting using mesoscale numerical weather prediction models. It is illustrated with several examples, discussing capabilities and limitations found in this application.
5.1 VRG forecasts
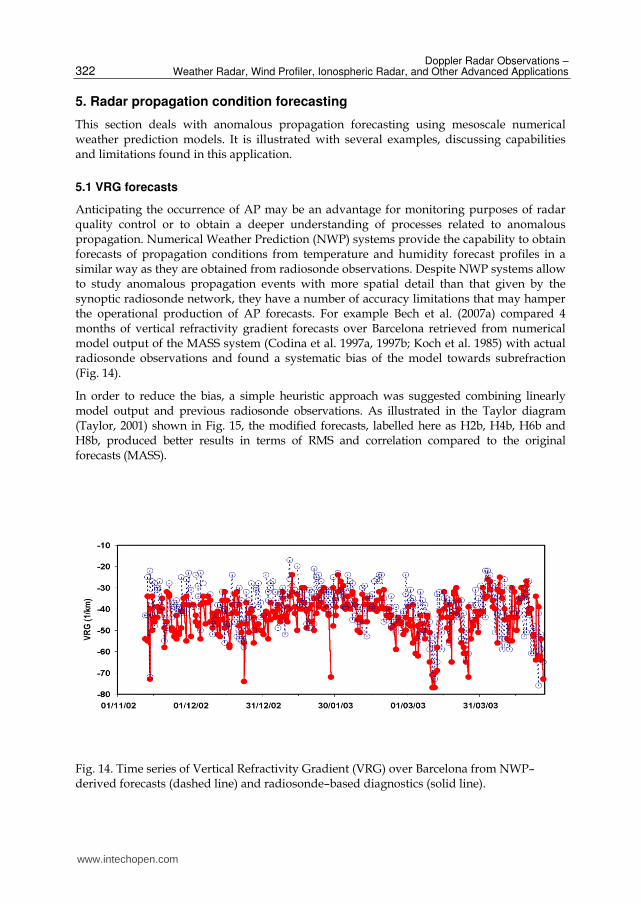
Anticipating the occurrence of AP may be an advantage for monitoring purposes of radar quality control or to obtain a deeper understanding of processes related to anomalous propagation. Numerical Weather Prediction (NWP) systems provide the capability to obtain forecasts of propagation conditions from temperature and humidity forecast profiles in a similar way as they are obtained from radiosonde observations. Despite NWP systems allow to study anomalous propagation events with more spatial detail than that given by the synoptic radiosonde network, they have a number of accuracy limitations that may hamper the operational production of AP forecasts. For example Bech et al. (2007a) compared 4 months of vertical refractivity gradient forecasts over Barcelona retrieved from numerical model output of the MASS system (Codina et al. 1997a, 1997b; Koch et al. 1985) with actual radiosonde observations and found a systematic bias of the model towards subrefraction (Fig. 14).
In order to reduce the bias, a simple heuristic approach was suggested combining linearly model output and previous radiosonde observations. As illustrated in the Taylor diagram (Taylor, 2001) shown in Fig. 15, the modified forecasts, labelled here as H2b, H4b, H6b and H8b, produced better results in terms of RMS and correlation compared to the original forecasts (MASS).
Fig. 14. Time series of Vertical Refractivity Gradient (VRG) over Barcelona from NWP–derived forecasts (dashed line) and radiosonde–based diagnostics (solid line).
www.intechopen.com
Effects of Anomalous Propagation Conditions on Weather Radar Observations
323
Fig. 15. Taylor Diagram of Vertical Refractivity Gradient VRG radiosonde observations (RAOB), original MASS forecasts, persistence of the observations and modified forecasts.
5.2 AP case studies
A number of anomalous propagation case studies examined with an electromagnetic propagation model with different degrees of sophistication and NWP data or simply with a radiosonde profile can be found in the literature, covering different geographic areas, such as Burk and Thompson (1997) in California, Atkinson et al (2001) over the Persian Gulf, or Bebbington et al. (2007) in the Mediterranean. Applications of this type of modelling tool include radar coverage computation (Haase et al. 2006), or even correction of improvement of radar data in NWP assimilation systems (Haase et al. 2007).
Fig. 16 shows an example of AP case study for the Røst radar (met.no), where NWP data provided by the HIRLAM system provided better results, even 24 h forecasts, than actual radiosonde data, which in this case was not representative of the radar coverage environment. In Bech et al. (2007b) this and two other case studies were discussed, highlighting the quality of HIRLAM forecasts for examining and anticipating AP cases with the BPM model.
www.intechopen.com
Doppler Radar Observations – Weather Radar, Wind Profiler, Ionospheric Radar, and Other Advanced Applications
324
Fig. 16. Lowest unblocked radar coverage (top row) and beam blockage (middle) computed with radiosonde data (left column) and NWP-derived profiles (right column). The bottom panel shows actual radar observations, 6 July 2005 00 UTC (Røst radar, met.no). Adapted from Bech et al. (2007a).
6. Detection and correction of AP echoes with satellite data
Several studies have been reported regarding the use of satellite images to detect AP echoes, based on the simple approach of removing echoes in cloudless conditions. However, in practice this procedure is not as straight forward as might seem and requires substantial fine tuning to obtain a reasonable balance between false alarms and detection, particularly in
www.intechopen.com
Effects of Anomalous Propagation Conditions on Weather Radar Observations
325
cloudy, and most importantly, rainy conditions. Some correction procedures to remove non-precipitating echoes rely only on radar data (e.g. Berenguer et al. 2006, Sánchez-Diezma et al. 2001, Steiner & Smith, 2002) but others consider as well the use of satellite observations – see for example Michelson and Sunhede (2004), Bøvith et al. (2006) or Magaldi et al. (2009). In any case, quantitative applications of radar data such as thunderstorm tracking (Rigo et al., 2010), precipitation estimates (Trapero et al. 2009), or radar-based precipitation forecasts (Atencia et al., 2010), or even qualitative use of radar images by a non-specialized audience (as discussed in Bech et al. 2010b), clearly require the use of proper clutter filtering, particularly considering anomalous propagation.
6.1 Methodology
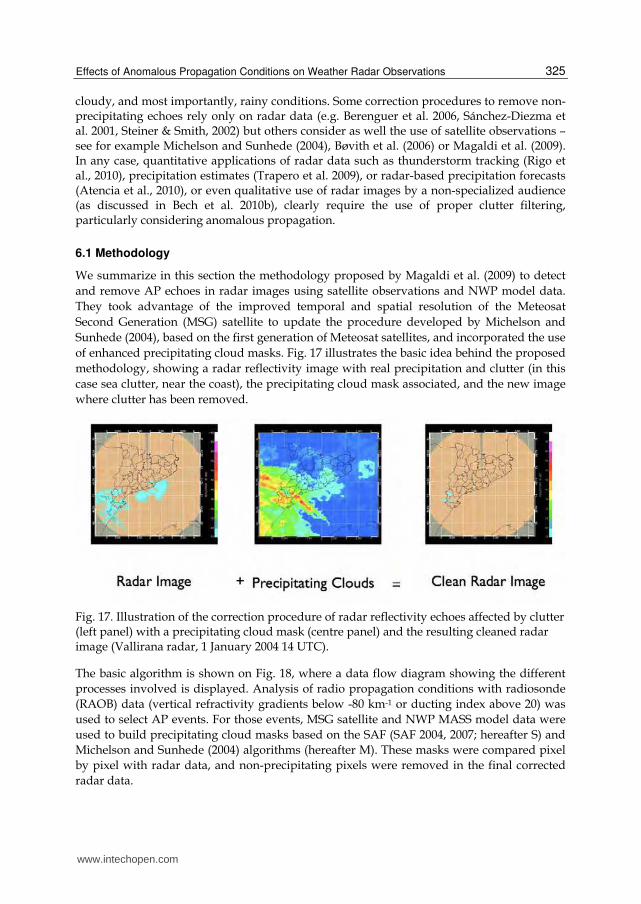
We summarize in this section the methodology proposed by Magaldi et al. (2009) to detect and remove AP echoes in radar images using satellite observations and NWP model data. They took advantage of the improved temporal and spatial resolution of the Meteosat Second Generation (MSG) satellite to update the procedure developed by Michelson and Sunhede (2004), based on the first generation of Meteosat satellites, and incorporated the use of enhanced precipitating cloud masks. Fig. 17 illustrates the basic idea behind the proposed methodology, showing a radar reflectivity image with real precipitation and clutter (in this case sea clutter, near the coast), the precipitating cloud mask associated, and the new image where clutter has been removed.
Fig. 17. Illustration of the correction procedure of radar reflectivity echoes affected by clutter (left panel) with a precipitating cloud mask (centre panel) and the resulting cleaned radar image (Vallirana radar, 1 January 2004 14 UTC).
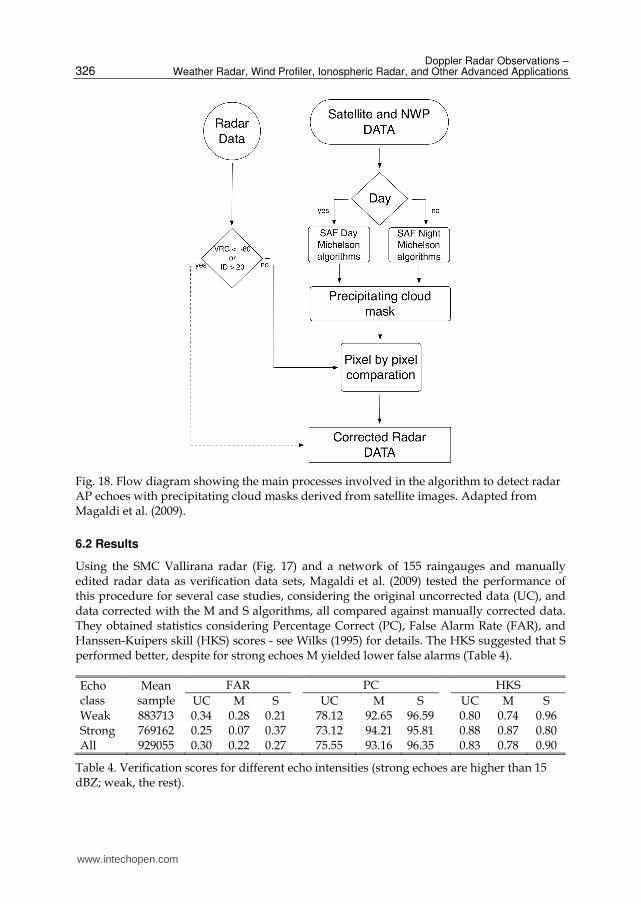
The basic algorithm is shown on Fig. 18, where a data flow diagram showing the different processes involved is displayed. Analysis of radio propagation conditions with radiosonde (RAOB) data (vertical refractivity gradients below -80 km-1 or ducting index above 20) was used to select AP events. For those events, MSG satellite and NWP MASS model data were used to build precipitating cloud masks based on the SAF (SAF 2004, 2007; hereafter S) and Michelson and Sunhede (2004) algorithms (hereafter M). These masks were compared pixel by pixel with radar data, and non-precipitating pixels were removed in the final corrected radar data.
www.intechopen.com
Doppler Radar Observations – Weather Radar, Wind Profiler, Ionospheric Radar, and Other Advanced Applications
326
Fig. 18. Flow diagram showing the main processes involved in the algorithm to detect radar AP echoes with precipitating cloud masks derived from satellite images. Adapted from Magaldi et al. (2009).
6.2 Results
Using the SMC Vallirana radar (Fig. 17) and a network of 155 raingauges and manually edited radar data as verification data sets, Magaldi et al. (2009) tested the performance of this procedure for several case studies, considering the original uncorrected data (UC), and data corrected with the M and S algorithms, all compared against manually corrected data. They obtained statistics considering Percentage Correct (PC), False Alarm Rate (FAR), and Hanssen-Kuipers skill (HKS) scores - see Wilks (1995) for details. The HKS suggested that S performed better, despite for strong echoes M yielded lower false alarms (Table 4).
Table 4. Verification scores for different echo intensities (strong echoes are higher than 15 dBZ; weak, the rest).
www.intechopen.com
Effects of Anomalous Propagation Conditions on Weather Radar Observations
327
A larger data set of six months (January to July 2007) using the SMC Vallirana radar provided additional insight to the performance of this correction technique of AP echoes. It also allowed to evaluate the performance of the technique applied by Bøvith et al. (2006) which made use of cloud type information (SAF, 2011) as precipitating echo mask. A parallax correction (Vicente et al., 2002) was introduced in the mask in order to improve the matching between the two data types and, as seen in Table 5, substantial changes were found for some of the cloud types.
Cloud typePrecipitation frequency(%)
01.- Cloud free land 0.30
02.- Cloud free sea 0.40
03.- Snow/ice land 0.40
06.- Very low Cu. 0.60
08.- Low St. 3.48
10.- Medium St. 16.38
12.-High & opaque St. 30.85
14.- Very High & opaque St. 32.76
15.- Thin Ci. 0.99
16.-Moderate thick Ci. 1.68
17. Ci. above lower cloud 6.62
19.- Fractional cloud 0.63
20.-Holes 0.85
Cloud typePrecipitation frequency(%)
01.- Cloud free land 0.64
02.- Cloud free sea 0.62
03.- Snow/ice land 0.41
06.- Very low Cu. 0.77
08.- Low St. 3.60
10.- Medium St. 15.30
12.-High & opaque St. 29.18
14.- Very High & opaque St. 31.90
15.- Thin Ci. 0.79
16.-Moderate thick Ci. 1.53
17. Ci. above lower cloud 6.80
19.- Fractional cloud 1.40
20.-Holes 0.00
CorrectedUncorrected
Table 5. Precipitation frequency for Cloud type product using the parallax corrected (left) and uncorrected products (right), both generated using six months of SMC radar data (January-July 2007).
7. Final remarks
In this chapter, an overview of the effects of radio propagation conditions upon radar observations has been given. Though we have focused in ground-based weather radar systems, many of the concepts presented apply as well to other types of radar and applications. Particular emphasis has been given to aspects with potential impact on radar quantitative precipitation estimates, considering beam blockage corrections or anomalous propagation echoes detection and removal. These items should be considered in quality control for weather radars, particularly those operating in complex topography environments and located near the coast where anomalous propagation may affect dramatically radar observations.
8. Acknowledgments
Part of the results presented here were obtained by the authors in research projects made in collaboration with a number of individuals including Uta Gjertsen (formerly at met.no and now at the Norwegian Defence Research Establishment, Norway), Günther Haase and Anke
www.intechopen.com
Doppler Radar Observations – Weather Radar, Wind Profiler, Ionospheric Radar, and Other Advanced Applications
328
Toss (Swedish Meteorological and Hydrological Institute, SMHI, Sweden), Pier Paolo Alberoni and Anna Fornasiero (ARPA, Italy), and David Bebbington (Essex University, UK). Weather radar observations, and radiosonde and surface automated observations data were provided by ARPA, SMHI, met.no and the Meteorological Service of Catalonia (SMC). This chapter was produced in the framework of the ProFEWS project (CGL2010-15892) and the Hymex project (Hymex.es CGL2010-11757-E).
9. References
Alberoni, P. P.; Anderson, T.; Mezzasalma, P.; Michelson, D. B. & Nanni, S. (2001). Use of the vertical reflectivity profile for identification of anomalous propagation, Meteorological Applications, Vol. 8, pp. 257–266
Anderson, T.; Alberoni, P. P.; Mezzalsama, P.; Michelson, D. & Nanni, S. (1997). Anomalous propagation identification from terrain and sea waves using vertical reflectivity profile analysis, Proceedings of 28th International Conference On Radar Meteorology, pp. 93-94, American Meteorologial Society, Austin, Texas, USA
Archibald, E. (2000). Enhanced clutter processing for the UK weather radar network. Physics and Chemistry of the Earth. Part B-Hydrology, Oceans and Atmosphere, Vol. 25, No.10-12, pp. 823-828
Atencia, A.; Rigo, T.; Sairouni, A.; Moré, J.; Bech, J.; Vilaclara, E.; Cunillera, J.; Llasat, M.C. & Garrote, L. (2010). Improving QPF by blending techniques at the Meteorological Service of Catalonia. Natural Hazards and Earth System Science, Vol.10, No.7, pp. 1443-1455
Atkinson, B.W.; Li, J.G. & Plant, R.S. (2001). Numerical modelling of the propagation environment in the atmospheric boundary layer over the Persian Gulf. Journal of Applied Meteorology, Vol.40, pp. 586–603
Battan, L. J. (1973). Radar Observation of the atmosphere. University of Chicago Press, Chicago, USA, 324 pp.
Bean, B. R. & Dutton, E. J. (1968). Radio meteorology. 435 pp., Dover Publications, New York USA
Bebbington, D.; Rae, S.; Bech, J.; Codina B. & Picanyol, M. (2007). Modelling of weather radar echoes from anomalous propagation using a hybrid parabolic equation method and NWP model data. Natural Hazards and Earth System Science, Vol.7, No.3, pp. 391-398
Bech, J. (2003). Observational analysis and numerical modelling of weather radar anomalous propagation echoes. PhD Thesis, ISBN 8468854506, University of Barcelona, Barcelona, Spain
Bech, J.; Bebbington, D.; Codina, B., Sairouni, A. & Lorente, J. (1998). Evaluation of atmospheric anomalous propagation conditions: an application for weather radars. EUROPTO Conference on Remote Sensing for Agriculture, Ecosystems, and Hydrology. SPIE Vol. 3499, pp. 111-115, Barcelona, Spain.
Bech, J.; Codina, B. & Lorente, J. (2007a). Forecasting weather radar propagation conditions. Meteorology and Atmospheric Physics, Vol.96, No.3-4, pp. 229-243
Effects of Anomalous Propagation Conditions on Weather Radar Observations
329
Bech, J.; Codina, B.; Lorente, J. & Bebbington, D. (2003). The sensitivity of single polarization weather radar beam blockage correction to variability in the vertical refractivity gradient. Journal of Atmospheric and Oceanic Technology, Vol. 20, No.6, pp. 845-855
Bech, J.; Gjertsen, U. & Haase, G. (2007b). Modelling weather radar beam propagation and topographical blockage at northern high latitudes. Quarterly Journal of the Royal Meteorological Society, Vol.133, No.626, pp. 1191–1204
Bech, J.; Gjertsen, U. & Haase, G. (2010a). Reply to comment of J.I. Dahl on DOI: 10.1002/qj.98. Quarterly Journal of the Royal Meteorological Society, Vol.136, No.648, pp. 817–818
Bech, J.; Molina, T.; Vilaclara, E. & Lorente, J. (2010b). Improving TV weather broadcasts with technological advancements. Meteorological Applications, Vol.17, No.2, pp. 142-148
Bech, J.; Sairouni, A.; Codina, B.; Lorente, J. & Bebbington, D. (2000). Weather radar anaprop conditions at a Mediterranean coastal site. Physics and Chemistry of the Earth. Part B-Hydrology, Oceans and Atmosphere, Vol.25, No.10-12, pp. 829-832
Berenguer, M.; Sempere-Torres, D.; Corral, D. & Sánchez-Diezma, R. (2006). A Fuzzy Logic Technique for Identifying Nonprecipitating Echoes in Radar Scans. Journal of Atmospheric and Oceanic Technology, Vol.23, No.9, pp. 1157-1180
Burk, S.D. & Thompson, W.T. (1997). Mesoscale modelling of summertime refractive conditions in the southern California bight. Journal of Applied Meteorology, Vol. 36, pp. 22-31
Codina, B.; Aran, M.; Young, S. & Redaño, A. (1997a). Prediction of a mesoscale convective system over Catalonia (Northeastern Spain) with a nested numerical model. Meteorology and Atmospheric Physics, Vol.62, pp. 9-22
Codina, B.; Sairouni, A.; Bech, J. & Redaño, A. (1997b). Operational application of a nested mesoscale numerical model in Catalonia (Meteo'96 Project). Proceedings of the INM/WMO International Symposium of Cyclones and Hazardous Weather in the Mediterranean, pp. 657-667, ISBN 84-7632-329-8, Palma de Mallorca, Spain
Collier, C.G. (1996). Applications of Weather Radar Systems. A Guide to Uses of Radar Data in Meteorology and Hydrology. pp 390, 2d ed. John Wiley & Sons., ISBN 0471960136, Chichester, UK
Crochet, P. (2009) Enhancing radar estimates of precipitation over complex terrain using information derived from an orographic precipitation model. Journal of Hydrology, 377:3-4, 417-433
da Silveira, R. B. & Holt, A.R. (1997). A neural network application to discriminate between clutter and precipitation using polarisation information as feature space. Proceedings of the 28th Internat. Conf. on Radar Meteor., pp. 57-58, Amer. Meteor. Soc., Austin, Texas
Delrieu, G.; Creutin, J.D. & Andrieu, H. (1995). Simulation of radar mountain returns using a digitized terrain model. Journal of Atmospheric and Oceanic Technology, Vol.12, pp.
Doviak, R.J. & Zrnic, D.S. (2006). Doppler radar and weather observations, 2nd edition. Academic Press, ISBN 0122214226, London, UK
Fabry, F.; Frush, C.; Zawadki, I. & Kilambi, A. (1997). On the extraction of near-surface index of refraction using radar phase measurements from ground targets. Journal of Atmospheric and Oceanic Technology, Vol.14, No.4, pp. 978-897
www.intechopen.com
Doppler Radar Observations – Weather Radar, Wind Profiler, Ionospheric Radar, and Other Advanced Applications
330
Fornasiero, A.; Alberoni, P.P. & Bech, J. (2006a). Statistical analysis and modelling of weather radar beam propagation conditions in the Po Valley (Italy). Natural Hazards and Earth System Science, Vol.6, No.2, pp. 303-314
Fornasiero, A.; Bech, J. & Alberoni, P.P. (2006b). Enhanced radar precipitation estimates using a combined clutter and beam blockage correction technique. Natural Hazards and Earth System Science, Vol.6, No.5, pp. 697-710
Fulton, R.A.; Breidenbach, J.P.; Seo, D.; Miller, D. & O'Bannon, T. (1998). The WSR-88D Rainfall Algorithm. Weather and Forecasting, Vol.13, No.2, 377-395
Gabella, M. & Perona, G. (1998). Simulation of the orographic influence on weather radar using a geometric-optics approach. Journal of Atmospheric and Oceanic Technology, Vol.15, No.6, pp. 1486-1495
Giangrande, S.E. & Ryzhkov, A.V. (2005). Calibration of Dual-Polarization Radar in the Presence of Partial Beam Blockage. Journal of Atmospheric and Oceanic Technology, Vol.22, No.8, pp. 1156-1166
Gossard, E.E. (1977). Refractive index variance and its height distribution in different air masses. Radio Science, Vol. 12, No.1, pp. 89-105
Haase, G.; Bech, J.; Wattrelot, E.; Gjertsen, U.; Jurasek, M. (2007). Towards the assimilation of radar reflectivities: improving the observation operator by applying beam blockage information, 33rd Conference on Radar Meteorology, AMS, Cairns, Australia.
Haase, G.; Gjertsen, U.; Bech, J.; Granström, Å. (2006). Assessment of potential radar locations using a beam propagation model. 4th European Conf. Radar Meteorol. Hydrol., Barcelona, Spain
Harrold, T.; English, E. & Nicholass, C. (1974). The accuracy of radar-derived rainfall measurements in hilly terrain. Quarterly Journal of the Royal Meteorological Society, Vol. 100, No.425, pp. 331-350
ITU (2003). ITU-R P.453-9 Recommendation, The Radio Refractive Index: Its Formula and Refractivity data, ITU Radiocommunication Assembly, ITU-R P-Series, 2003)
Johnson, C.; Harrison, D. & Golding, B. (1999). Use of atmospheric profile information in the identification of anaprop in weather radar images. Observation Based Products Technical Report No. 17, Forecasting Systems, UK Meteorological Office, 30 pp. [Available from the National Meteorological Library, London Road, Bracknell, RG12, 2SZ, UK]
Joss, J. & Lee, R. (1995). The application of radar-gauge comparisons to operational precipitation profile corrections. Journal of Applied Meteorology, Vol.4, No.12, pp. 2612-2630
Joss, J. & Waldvogel, A. (1990). Precipitation measurement and hydrology, a review. In: Radar in Meteorology, D. Atlas (Ed.), Chapter 29a, pp. 577-606. American Meteorological Society, Boston, USA
Kitchen, M.; Brown, R. & Davies, A.G. (1994). Real-time correction of weather radar data for the effects of bright band, range and orographic growth in widespread precipitation. Quarterly Journal of the Royal Meteorological Society, Vol.120, No.519, pp. 1231-1254
Koch, S.E.; Skillman, W.C.; Kocin, P.J.; Wetzel, P.J.; Brill, K.F.; Keyser, D.A. & McCumber, M.C. (1985). Synoptic scale forecast skill and systematic errors in the MASS 2.0 model. Monthly Weather Review, Vol.113, No. 10, pp. 1714-1737
Krajewski, W. F. & Vignal, B. (2001). Evaluation of anomalous propagation echo detection in WSR-88D Data: a large sample case study. Journal of Atmospheric and Oceanic Technology, Vol. 18, No.5, pp. 807-814
www.intechopen.com
Effects of Anomalous Propagation Conditions on Weather Radar Observations
331
Lane, J.A (1961). The radio refractive index gradient over the British Isles. Journal of Atmospheric and Terrestrial Physics, Vol.21, No.2-3, pp. 157-166
Lang, T.J.; Nesbitt, S.W. & Carey, L.D. (2009). On the Correction of Partial Beam Blockage in Polarimetric Radar Data. Journal of Atmospheric and Oceanic Technology, Vol.26, No.5, pp. 943-957
Lopez, P. (2009). A 5-yr 40-km-Resolution Global Climatology of Superrefraction for Ground-Based Weather Radars. Journal of Applied Meteorology and Climatology, Vol. 48, pp. 89–110
Low, T.B. & Hudak, D.R. (1997). Development of Air Mass Climatology Analysis for the Determination of Characteristic Marine Atmospheres. Part I: North Atlantic. Theoretical and Applied Climatology, Vol.57, No.3-4, pp. 135-153
Magaldi, A.V.; Bech, J. & Lorente, J. (2009). A multisource scheme based on NWP and MSG data to correct non-precipitating weather radar echoes. Meteorology and Atmospheric Physics, Vol.105, No.3-4, pp. 121-132
Mentes, Ş., & Kaymaz, Z. (2007). Investigation of Surface Duct Conditions over Istanbul, Turkey. Journal of Applied Meteorology and Climatology, Vol. 46, pp. 318–337
Mesnard, F., Sauvageot, H. (2010). Climatology of Anomalous Propagation Radar Echoes in a Coastal Area. Journal of Applied Meteorology and Climatology, Vol. 49, pp. 2285–230
Météo-France (1997). Quality control on GTS data at Météo-France. Météo-France, Service Centrale d'Exploitation de la Météorologie. 42, Av. Coriolis, 31057 Toulouse Cedex 1, France
Michelson, D. B.; Andersson, T.; Koistinnen, J.; Collier, C. G.; Riedl, J.; Szturc, J. ; Gjertsen, U.; Nielsen, A. & Overgaard, S. (2000). BALTEX radar data centre products and their methodologies. RMK 90. Swedish Meteorological and Hydrological Institute, Norrköpping, Sweden
Michelson, D.B. & Sunhede, D. (2004). Spurious weather radar echo identification and removal using multisource temperature information. Meteorological Applications, Vol.11, pp. 1–14
Moszkowicz, S.; Ciach, G.J. & Krajewski, W.F. (1994). Statistical detection of anomalous propagation in radar reflectivity patterns. Journal of Atmospheric and Oceanic Technology, Vol.11, No.4, pp. 1026-1034
Newsome, D.H. (1992). Weather Radar Networking COST Project 73 Final Report. Kluwer Academic Publishers, Dordrecht, Netherlands, 254 pp., ISBN 0792319397
Park, S. & Fabry, F. (2011). Estimation of Near-Ground Propagation Conditions Using Radar Ground Echo Coverage. Journal of Atmospheric and Oceanic Technology, Vol.28, No.2, pp. 165-180
Park, S.; Jung, S.; Lee, J. & Kim, K. (2009) Correction of Radar Reflectivity over Beam Blocking Area by Accumulated Radar Reflectivity. Journal of Korea Water Resources Association, Vol.42, No.8, pp. 607-617
Patterson, W.L. (2008). The Propagation Factor, Fp, in the radar equation, In: Radar Handbook, 3rd edition, M. Skolnik (Ed.), Ch. 26, ISBN 0071485473. McGraw Hill, New York, USA.
Pittman, T.S. (1999). A climatology-based model for long-term prediction of radar beam refraction. Master’s Thesis, 184 pp., US Air Force Institute of Technology, USA
Redaño, A.; Cruz, J. & Lorente, J. (1991). Main features of sea breeze in Barcelona. Meteorology and Atmospheric Physics, Vol.46, No.3-4, pp. 175-179
Rigo, T.; Pineda, N. & Bech, J. (2010). Analysis of warm season thunderstorms using an object-oriented tracking method based on radar and total lightning data. Natural Hazards and Earth System Science, Vol.10, No.9, pp. 1881-1893
www.intechopen.com
Doppler Radar Observations – Weather Radar, Wind Profiler, Ionospheric Radar, and Other Advanced Applications
332
Rinehart, R. (2001). Radar for Meteorologists. 3rd edition. Rinehart Publications, ISBN 0-9658002-0-2, 428 pp., P.O. Box 30800, MO, USA
Rossa, A.; Haase, G; Keil, C.; Alberoni,P.P; Ballard, S.; Bech, J.; Germann, U.; Pfeifer, M. & Salonen, K. (2010). Propagation of uncertainty from observing systems into NWP. Atmospheric Science Letters, Vol.11, No.2, pp. 145-152
Rossa, A.M. (2000). The COST 717 action: use of radar observations in hydrological and NWP models. Physics and Chemistry of the Earth. Part B-Hydrology, Oceans and Atmosphere, Vol.25, No.10-12, pp. 1221–1224
SAF (2004) Software user manual for PGE04 of the NWCSAF/MSG: scientific part. EUMETSAT Satellite Application Facility to Nowcasting and Very Short Range Forecasting, 31 pp
SAF (2007) Validation report for ‘‘Precipitating Clouds’’ (PC-PGE04 v1.4). EUMETSAT Satellite Application Facility to Nowcasting and Very Short Range Forecasting, 29 pp
SAF (2011) Algorithm Theoretical Basis Document for “Cloud Products” (CMa-PGE01v3.1, CT-PGE02 v2.1 & CTTH-PGE03 v2.2). EUMETSAT Satellite Application Facility to Nowcasting and Very Short Range Forecasting, 87 pp
Sánchez-Diezma, R.; Sempere-Torres, D.; Delrieu, G. & Zawadki, I. (2001). An improved methodology for ground clutter substitution based on a pre-classification of precipitation types. Proceedings of the 30th Internat. Conf. on Radar Meteor., pp. 271-273, Amer. Meteor. Soc., Münich, Germany
Sauvageot, H. (1991). Radar Meteorology, Artech House, ISBN 978-0-89006-318-7, 366 pp., London, UK
Sauvageot, H. (1994). Rainfall measurement by radar: a review. Atmospheric Research, Vol.35, No.1 , pp. 27-54
Shedd, R.; Smith, J. & Walton, M. (1991). Sectorized hybrid scan strategy of the NEXRAD precipitation-processing system. In Hydrological Applications of Weather Radar, I. Cluckie & C. Collier, Eds., pp. 151-159, ISBN 0134414780, Ellis Horwood Limited, New York, USA
Skolnik, M. (1980). Introduction to radar systems. 581 pp., ISBN 0070665729, McGraw-Hill, New York, USA
Smith, P.L., Jr. (1998). On the minimum useful elevation angle for weather surveillance radar scans. Journal of Atmospheric Oceanic Technology, Vol.15, No.3 , pp. 841-843
Steiner, M. & Smith, J.A. (2002). Use of three-dimensional reflectivity structure for automated detection and removal of non-precipitating echoes in radar data. Journal of Atmospheric and Oceanic Technology, Vol.19, No.5, pp. 673-686
Taylor, K.E. (2001). Summarizing multiple aspects of model performance in single diagram. Journal of Geophysical Research, Vol. 106, D7, pp. 7183-7192.
Trapero, L.; Bech, J.; Rigo, T.; Pineda, N. & Forcadell, D. (2009). Uncertainty of precipitation estimates in convective events by the Meteorological Service of Catalonia radar network. Atmospheric Research, Vol. 93, No.1-3, pp. 408-418
Vicente, G.; Davenport, J C. & Scofield, R. A. (2002). The role of orographic and parallax corrections on real time high resolution satellite rainfall rate distribution. International Journal of Remote Sensing, Vol.23, pp.221–230
Villarini, G. & Krajewski, W.F. (2010). Review of the Different Sources of Uncertainty in Single Polarization Radar-Based Estimates of Rainfall. Surveys in Geophysics, Vol.31, No.1, pp. 107-129, ISBN 0169-3298
Wilks, D.S. (1995). Statistical Methods in the Atmospheric Sciences. Academic Press, ISBN , 467 pp., London, UK
www.intechopen.com
Doppler Radar Observations - Weather Radar, Wind Profiler,Ionospheric Radar, and Other Advanced ApplicationsEdited by Dr. Joan Bech
ISBN 978-953-51-0496-4Hard cover, 470 pagesPublisher InTechPublished online 05, April, 2012Published in print edition April, 2012
InTech ChinaUnit 405, Office Block, Hotel Equatorial Shanghai No.65, Yan An Road (West), Shanghai, 200040, China
Phone: +86-21-62489820 Fax: +86-21-62489821
Doppler radar systems have been instrumental to improve our understanding and monitoring capabilities ofphenomena taking place in the low, middle, and upper atmosphere. Weather radars, wind profilers, andincoherent and coherent scatter radars implementing Doppler techniques are now used routinely both inresearch and operational applications by scientists and practitioners. This book brings together a collection ofeighteen essays by international leading authors devoted to different applications of ground based Dopplerradars. Topics covered include, among others, severe weather surveillance, precipitation estimation andnowcasting, wind and turbulence retrievals, ionospheric radar and volcanological applications of Doppler radar.The book is ideally suited for graduate students looking for an introduction to the field or professionalsintending to refresh or update their knowledge on Doppler radar applications.
How to referenceIn order to correctly reference this scholarly work, feel free to copy and paste the following:
Joan Bech, Adolfo Magaldi, Bernat Codina and Jeroni Lorente (2012). Effects of Anomalous PropagationConditions on Weather Radar Observations, Doppler Radar Observations - Weather Radar, Wind Profiler,Ionospheric Radar, and Other Advanced Applications, Dr. Joan Bech (Ed.), ISBN: 978-953-51-0496-4, InTech,Available from: http://www.intechopen.com/books/doppler-radar-observations-weather-radar-wind-profiler-ionospheric-radar-and-other-advanced-applications/effects-of-anomalous-propagation-conditions-on-weather-radar-observations