Ph.D. Dissertation 2011 Effects of antagonists of luteinizing hormone- and growth hormone-releasing hormone on experimental benign prostatic hyperplasia and prostate cancer Ferenc G. Rick, M.D. Department of Anatomy University of Pécs, School of Medicine Pécs, Hungary Department of Pathology University of Miami, Miller School of Medicine Miami, Florida, USA Head of Postgraduate Education: László Lénárd, M.D., Ph.D., D.Sc. Program leader: Valér Csernus, M.D., Ph.D., D.Sc. Mentors: Magdolna Kovács, M.D., Ph.D., D.Sc. Zoltán Rékási, M.D., Ph.D. Advisors: Andrew V. Schally, Ph.D., M.D.hc(Multi), D.Sc.hc Norman L. Block, M.D., F.A.C.S., D.A.B.U.
Transcript
Ph.D. Dissertation
2011
Effects of antagonists of luteinizing hormone- and growth
hormone-releasing hormone on experimental benign prostatic
hyperplasia and prostate cancer
Ferenc G. Rick, M.D.
Department of Anatomy
University of Pécs, School of Medicine
Pécs, Hungary
Department of Pathology
University of Miami, Miller School of Medicine
Miami, Florida, USA
Head of Postgraduate Education: László Lénárd, M.D., Ph.D., D.Sc.
Program leader: Valér Csernus, M.D., Ph.D., D.Sc.
Mentors: Magdolna Kovács, M.D., Ph.D., D.Sc.
Zoltán Rékási, M.D., Ph.D.
Advisors: Andrew V. Schally, Ph.D., M.D.hc(Multi), D.Sc.hc
Norman L. Block, M.D., F.A.C.S., D.A.B.U.
2
Ferenc G. Rick, M.D.
Effects of antagonists of luteinizing hormone- and growth hormone relasing hormone on
experimental benign prostatic hyperplasia and prostate cancer
Mentors:
Magdolna Kovacs, M.D., Ph.D., D.Sc., Professor
and
Zoltan Rekasi, M.D., Ph.D., Professor
Department of Anatomy
University of Pecs, School of Medicine
Pecs, Hungary
Advisors:
Andrew V. Schally, Ph.D., M.D.hc (Multi), D.Sc., Professor
and
Norman L. Block, M.D., F.A.C.S., D.A.B.U., Professor
Department of Pathology, Divisions of Hematology/Oncology and Endocrinology,
Department of Medicine
University of Miami, Miller School of Medicine
Veterans Affairs Medical Center and South Florida Veterans Affairs Foundation for Research
and Education
Miami, Florida, United States of America
The work described in this thesis was supported by the Medical Research Service of the
Veterans Affairs Department, Departments of Pathology, and Medicine, Division of
Hematology/Oncology of the Miller Medical School, University of Miami and
AEterna/Zentaris GmbH through South Florida Veterans Affairs Foundation for Research
and Education (all to A.V.S.), the L. Austin Weeks Endowment for Urologic Research
(N.L.B.), and the Hungarian National Sciences Foundation Grant OTKA K068452 (Z.R.).
factor families (e.g. TGF-β1 and TGF-β2), and angiogenic factors (e.g. VEGF-A) and downstream
effector molecules as well as a variety of interleukins (e.g. IL-2, IL-4, IL-8 and IL-17) that, working
together, could lead to abnormal stromal and epithelial cell growth within the transition zone of the
prostate (21,43).
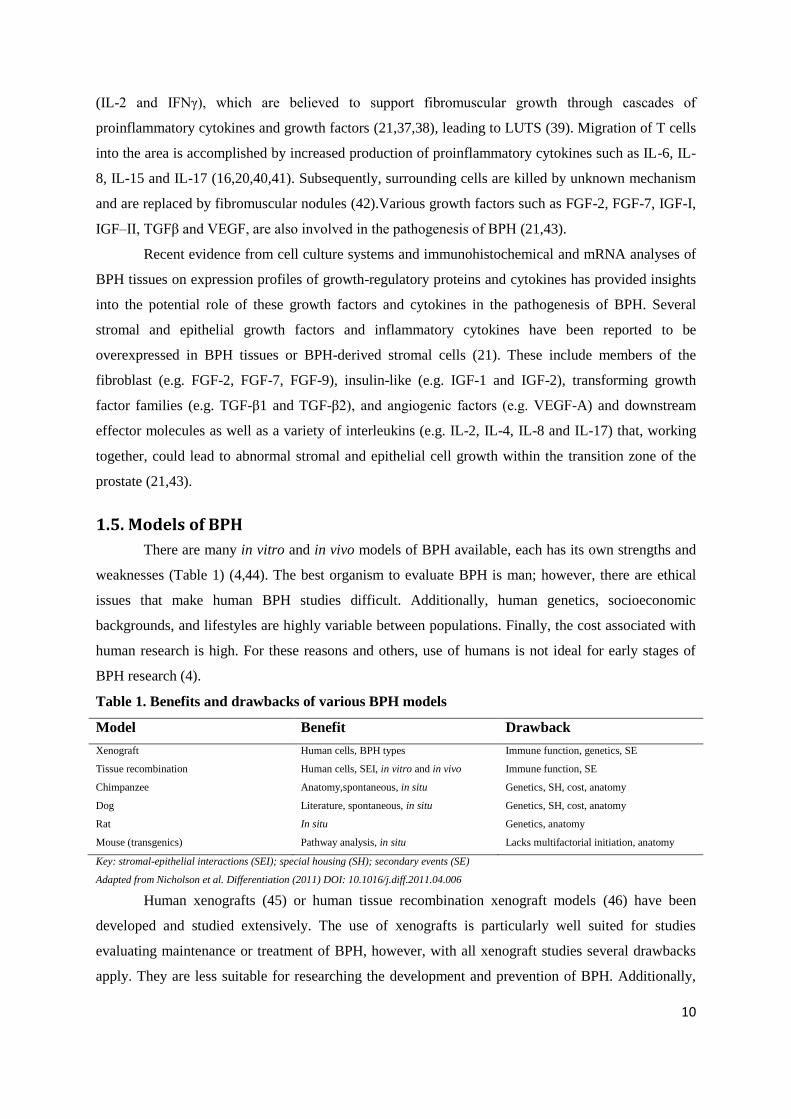
1.5. Models of BPH
There are many in vitro and in vivo models of BPH available, each has its own strengths and
weaknesses (Table 1) (4,44). The best organism to evaluate BPH is man; however, there are ethical
issues that make human BPH studies difficult. Additionally, human genetics, socioeconomic
backgrounds, and lifestyles are highly variable between populations. Finally, the cost associated with
human research is high. For these reasons and others, use of humans is not ideal for early stages of
BPH research (4).
Table 1. Benefits and drawbacks of various BPH models
Model Benefit Drawback
Xenograft Human cells, BPH types Immune function, genetics, SE
Tissue recombination Human cells, SEI, in vitro and in vivo Immune function, SE
Chimpanzee Anatomy,spontaneous, in situ Genetics, SH, cost, anatomy
Dog Literature, spontaneous, in situ Genetics, SH, cost, anatomy
Rat In situ Genetics, anatomy
Mouse (transgenics) Pathway analysis, in situ Lacks multifactorial initiation, anatomy
Key: stromal-epithelial interactions (SEI); special housing (SH); secondary events (SE)
Adapted from Nicholson et al. Differentiation (2011) DOI: 10.1016/j.diff.2011.04.006
Human xenografts (45) or human tissue recombination xenograft models (46) have been
developed and studied extensively. The use of xenografts is particularly well suited for studies
evaluating maintenance or treatment of BPH, however, with all xenograft studies several drawbacks
apply. They are less suitable for researching the development and prevention of BPH. Additionally,
11
use of immunocompromised mouse or rat hosts make xenograft studies less appealing for evaluating
BPH in the context of an intact immune system. Lastly, although no animal model can evaluate LUTS
directly, analysis of secondary complications due to BPH (e.g. BOO) is not possible with xenograft
models.Tissue recombination, a technique that utilizes epithelia and stroma from various species or
organs, has successfully been used for the study of a wide range of normal and pathogenic states
(4,47). In this regard, Barclay and colleagues utilized tissue recombination methods using benign
human prostatic epithelial cells (BPH-1 cell line (48)) and human stroma from BPH or normal
prostates (46). In those experiments it was found that BPH stroma significantly increased epithelial
proliferation relative to control normal stroma, but importantly, malignant transformation did not
occur in the BPH tissue recombinants (48). These data are consistent with the important growth
promoting role of stroma in BPH. There are distinct advantages of utilizing tissue recombination
technology in BPH research. First, human cells can be employed; second, cells are commonly grown
in culture first and then recombined and grown in mouse hosts. While the cells are in culture it is
possible to manipulate gene expression (e.g. use of shRNA or forced expression of gene of interest)
and hence evaluate its consequences, such as growth and differentiation. Furthermore, in vitro
experiments can be inexpensively performed as proof of principle prior to in vivo experiments. Lastly,
tissue recombination is especially useful in evaluation of stromal–epithelial interactions, which are
likely to play a central role in the manifestation and maintenance of BPH.
Models where spontaneous BPH occur are highly desirable because they likely recapitulate
the underlying pathophysiology of human disease. The only animals other than man that develop
spontaneous BPH are dogs (4,44) and nonhuman primates such as chimpanzees (49). The logistics
and costs of carrying out such experiments with these species are typically high, and as such they are
used less frequently. Another limitation of spontaneous models is a lack of genetic manipulation,
which restricts the use of these models for key mechanistic questions.
Like man, dogs and rodents have hormone responsive prostates making them particularly
important in BPH research. The administration of androgens and estrogens to recreate a hormonal
environment similar to men as they age, reliably produces prostatic growth in dogs (50) and Wistar,
Brown Norway and Sprague-Dawley rats (44,51). Key research utilizing these models have
significantly moved the field of BPH research forward although prostate anatomy in dogs and rats
differs significantly from the human prostate. In particular, these prostates may grow outwardly and
away from the prostatic urethra, making prostatic growth less likely to cause obstruction and affect
urine flow, a key feature of human BPH. As such, BOO due to BPH has not been sufficiently
described in these models. Possibly the biggest obstacle to the utilization of many BPH models is the
lack of genetic manipulation. The ability to alter the genetics of cells, tissues, and whole organisms
has greatly advanced the scientific understanding of molecular mechanisms in developmental biology,
cancer, and many other disciplines. Although transgenic rats and dogs are possible (4), they are
12
unlikely to surpass the mouse in availability of genetically altered pathways. Further complications
with the usage of dog and rat hormone induction models are the associated cost and special housing
needed for these studies. Certainly many aspects of dog and rat models, as with all models, have and
will continue to move the field of BPH research forward; however, new genetically tractable models
of BPH with putative „„LUTS‟‟ are needed.
The best genetically workable organism for BPH and BOO research is the mouse, in which
gain and loss of function are easily regulated. In general, mouse models for BPH have been poorly
received due to their prostatic anatomy which is similar to the rat; therefore, the challenges of
modeling human BPH are similar to those encountered with rats and dogs. The prostatic lobes of the
mouse, although hormonally responsive, grow outwardly from the urethra into the abdominal cavity.
Thus, it is intuitive that regardless of prostate size, it may be impossible for BPH related BOO and
subsequent „„LUTS‟‟ to occur. There are several BPH transgenic mouse models (4), however, it
should be recognized that effects of one gene on the induction of multi-factorial disease(s) such as
BPH are likely only to enhance the knowledge of the particular pathway or process evaluated.
1.6. Therapy of BPH
A number of treatment options exist for the care of men with clinical sympthoms due to an
enlarged prostate. The standard of care for BPH is treatment with α-blockers, 5α-reductase inhibitors
(e.g. finasteride), surgery, or a combination there of (1). Drugs that block α-1 adrenergic receptors are
effective in BPH mainly by blocking sympathetically mediated contraction of prostatic smooth
muscle, relieving BOO, and leading to improved urine flow. α-1 adrenergic receptors are present
throughout the smooth muscle of the male urinary tract, and at the level of the spinal cord, ganglia and
nerve terminals, and therefore, are likely to have a wide spectrum of favorable effects on these extra-
prostatic sites (Nitti, 2005). While α-blockers are effective at improving LUTS for many patients, they
do not affect prostate growth and therefore do not decrease the risk of BPH complications such as
acute urinary retention and the need for surgical intervention (52). Hormonal treatment of BPH with
5α-reductase inhibitors blocks the conversion of testosterone to DHT, shrinks the prostate and results
in improved urinary flow rates, underscoring the well-known dependence of BPH on DHT. The gold-
standard surgical treatment for BPH is transurethral resection of the prostate (TURP) which relieves
obstruction by removing BPH nodules in the transition zone; however, a variety of minimally invasive
surgical approaches exist (7). Some patients do not respond well to these standards of care and it is
difficult to predict which patients will respond to a particular treatment. Furthermore, the efficacy and
acceptability of other hormonal treatments, such as antiandrogens or LHRH agonists, is low and can
be associated with side-effects of androgen ablation, such as hot flushes, decrease of potency and
libido and negative effects on bone and other tissues (53). Thus, there remains a need for advances
13
and improvements in treatment and prevention of BPH and LUTS based on a better understanding of
their pathophysiology.
1.7. LHRH antagonists and BPH
LHRH antagonists inhibit the reproductive system through competition with endogenous
LHRH for binding to pituitary LHRH-Rs, thus avoiding the undesirable stimulation and possible
disease flare that precedes the receptor desensitization observed with the agonists (Figure 2) (53).
Cetrorelix, originally developed in our laboratory in the late 1980‟s (54), is a highly potent LHRH
antagonist that induces an immediate inhibition of the pituitary-gonadal axis (Figure 2). Several
clinical studies have shown that therapy with low doses of this LHRH antagonist caused a marked and
long-lasting improvement in LUTS, with no impairment of gonadal function in men with
symptomatic BPH (55-58). During a long-term follow-up of >1 year after discontinuation of
cetrorelix, most patients continued to show a progressive improvement in urinary symptoms, sexual
function, a reduction in the IPSS, and an increase in urinary peak flow rate, with only a slight
reduction in prostate volume (56). In recent studies, during treatment there was a dose-dependent
transient suppression of serum testosterone concentrations, but the levels remained above castration
values. After 2 weeks the serum values returned to baseline (57). In experimental studies in rats, low
doses of cetrorelix, similar to those used in clinical studies, caused only a partial suppression of the
pituitary-gonadal axis and a transient suppression of serum LH and testosterone levels (59). In clinical
studies, the therapeutic effect of cetrorelix appears to be independent of testosterone suppression (55-
58). However, contradictory results of treatment with cetrorelix have been reported, which showed no
difference with placebo (60). Russo et al showed that LHRH antagonist ganirelix counteracts
experimental detrusor overactivity in female rats (60). This suggests that LHRH-R regulates bladder
function and supports reports of beneficial effects of LHRH receptor blockade in LUTS patients. The
improvement in LUTS also could be due to a direct inhibitory effect of cetrorelix on the prostate
through prostatic LHRH-Rs in combination with suppression of inflammatory cytokines, growth
factors and their receptors (61).Cetrorelix was also shown to inhibit the growth of human prostatic
and other cancers xenografted into nude mice with suppression of growth factors EGF and IGF-2 and
EGF receptor (62-64). A recent report demonstrated that apoptosis in primary cultures from prostate
cancer was induced by LHRH antagonist cetrorelix mediated by extrinsic pathway involving p53
phosphorylation (65).
A recent study from our laboratory has shown that in vitro cetrorelix can directly inhibit the
proliferation rate of the human BPH-1 prostate epithelial cell line by counteracting growth factors like
IGF-I and -II and FGF-2, and downregulating the LHRH receptor and α-adrenergic receptors, as well
as transcription factors (66).
14
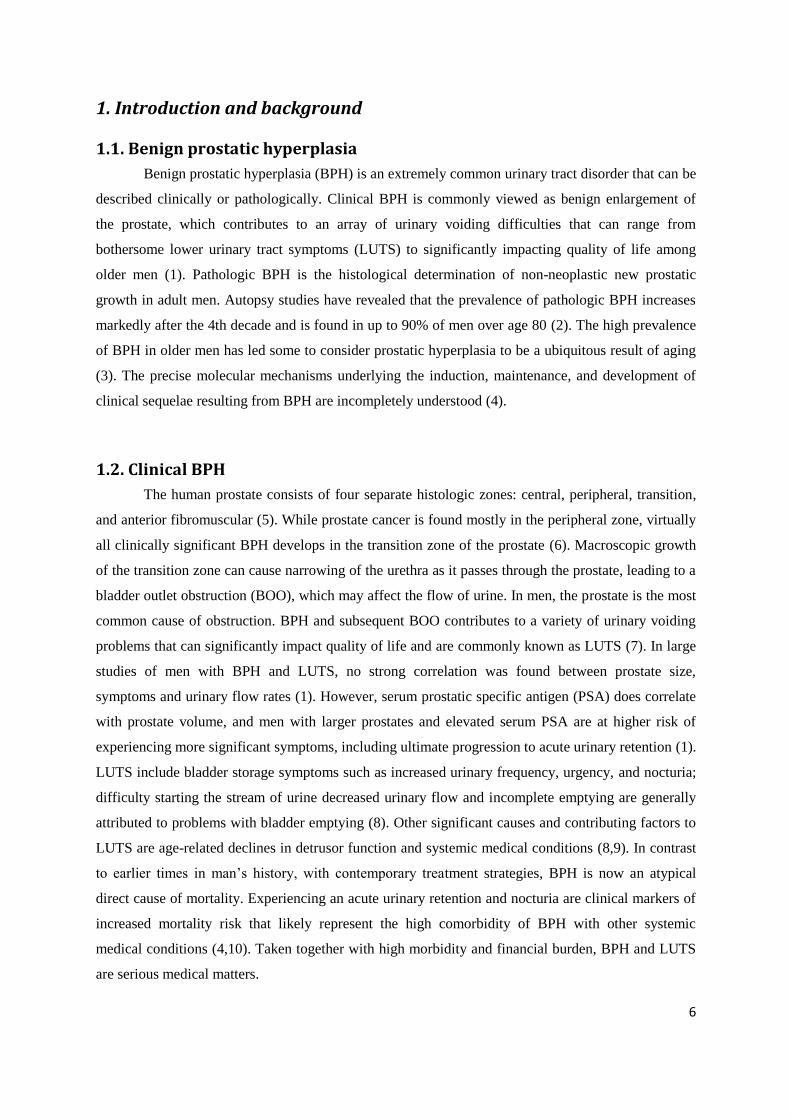
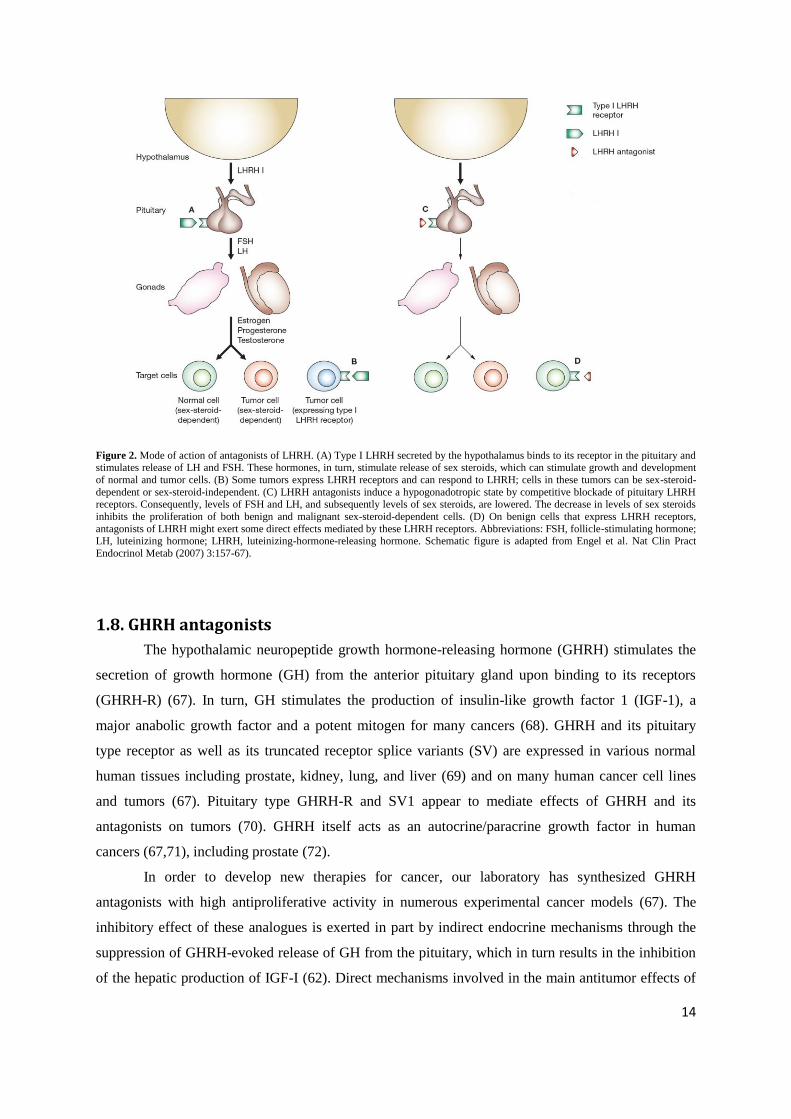
Figure 2. Mode of action of antagonists of LHRH. (A) Type I LHRH secreted by the hypothalamus binds to its receptor in the pituitary and stimulates release of LH and FSH. These hormones, in turn, stimulate release of sex steroids, which can stimulate growth and development
of normal and tumor cells. (B) Some tumors express LHRH receptors and can respond to LHRH; cells in these tumors can be sex-steroid-
dependent or sex-steroid-independent. (C) LHRH antagonists induce a hypogonadotropic state by competitive blockade of pituitary LHRH receptors. Consequently, levels of FSH and LH, and subsequently levels of sex steroids, are lowered. The decrease in levels of sex steroids
inhibits the proliferation of both benign and malignant sex-steroid-dependent cells. (D) On benign cells that express LHRH receptors,
antagonists of LHRH might exert some direct effects mediated by these LHRH receptors. Abbreviations: FSH, follicle-stimulating hormone; LH, luteinizing hormone; LHRH, luteinizing-hormone-releasing hormone. Schematic figure is adapted from Engel et al. Nat Clin Pract
Endocrinol Metab (2007) 3:157-67).
1.8. GHRH antagonists
The hypothalamic neuropeptide growth hormone-releasing hormone (GHRH) stimulates the
secretion of growth hormone (GH) from the anterior pituitary gland upon binding to its receptors
(GHRH-R) (67). In turn, GH stimulates the production of insulin-like growth factor 1 (IGF-1), a
major anabolic growth factor and a potent mitogen for many cancers (68). GHRH and its pituitary
type receptor as well as its truncated receptor splice variants (SV) are expressed in various normal
human tissues including prostate, kidney, lung, and liver (69) and on many human cancer cell lines
and tumors (67). Pituitary type GHRH-R and SV1 appear to mediate effects of GHRH and its
antagonists on tumors (70). GHRH itself acts as an autocrine/paracrine growth factor in human
cancers (67,71), including prostate (72).
In order to develop new therapies for cancer, our laboratory has synthesized GHRH
antagonists with high antiproliferative activity in numerous experimental cancer models (67). The
inhibitory effect of these analogues is exerted in part by indirect endocrine mechanisms through the
suppression of GHRH-evoked release of GH from the pituitary, which in turn results in the inhibition
of the hepatic production of IGF-I (62). Direct mechanisms involved in the main antitumor effects of
15
GHRH antagonists appear to be based on blocking the action of autocrine GHRH on tumors and
inhibition of autocrine IGF-1/2 (62,67). GHRH antagonists inhibit the growth of androgen-
independent human prostatic cancers and also numerous other cancers xenografted into nude mice and
also indicate that GHRH antagonists reduce generation of reactive oxygen species (75), which cause
damage to prostatic stroma and epithelium (16).
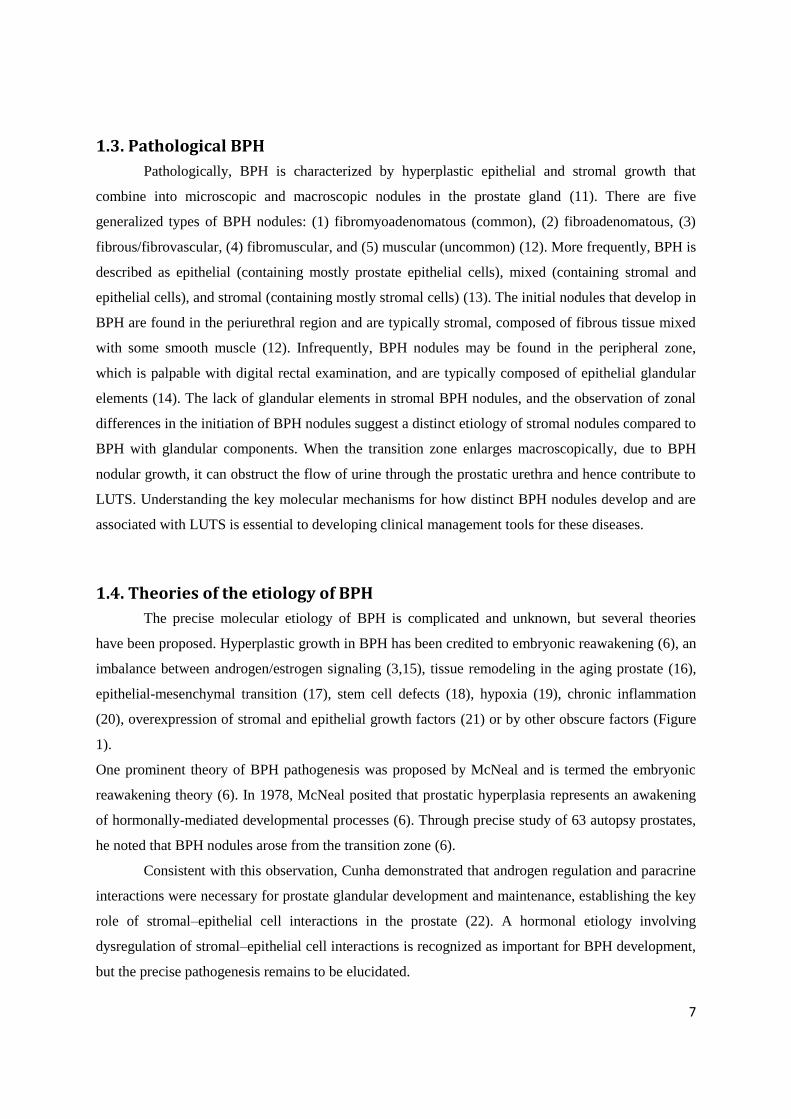
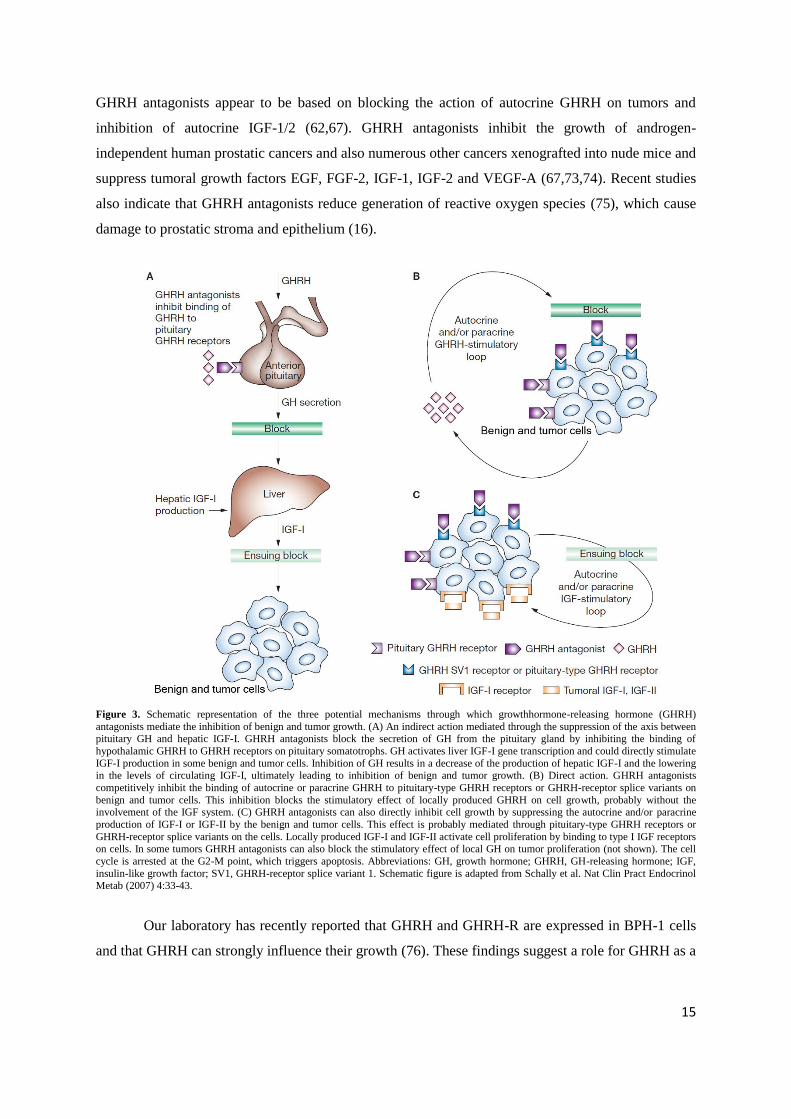
Figure 3. Schematic representation of the three potential mechanisms through which growthhormone-releasing hormone (GHRH)
antagonists mediate the inhibition of benign and tumor growth. (A) An indirect action mediated through the suppression of the axis between pituitary GH and hepatic IGF-I. GHRH antagonists block the secretion of GH from the pituitary gland by inhibiting the binding of
hypothalamic GHRH to GHRH receptors on pituitary somatotrophs. GH activates liver IGF-I gene transcription and could directly stimulate
IGF-I production in some benign and tumor cells. Inhibition of GH results in a decrease of the production of hepatic IGF-I and the lowering in the levels of circulating IGF-I, ultimately leading to inhibition of benign and tumor growth. (B) Direct action. GHRH antagonists
competitively inhibit the binding of autocrine or paracrine GHRH to pituitary-type GHRH receptors or GHRH-receptor splice variants on
benign and tumor cells. This inhibition blocks the stimulatory effect of locally produced GHRH on cell growth, probably without the involvement of the IGF system. (C) GHRH antagonists can also directly inhibit cell growth by suppressing the autocrine and/or paracrine
production of IGF-I or IGF-II by the benign and tumor cells. This effect is probably mediated through pituitary-type GHRH receptors or
GHRH-receptor splice variants on the cells. Locally produced IGF-I and IGF-II activate cell proliferation by binding to type I IGF receptors
on cells. In some tumors GHRH antagonists can also block the stimulatory effect of local GH on tumor proliferation (not shown). The cell
cycle is arrested at the G2-M point, which triggers apoptosis. Abbreviations: GH, growth hormone; GHRH, GH-releasing hormone; IGF,
insulin-like growth factor; SV1, GHRH-receptor splice variant 1. Schematic figure is adapted from Schally et al. Nat Clin Pract Endocrinol Metab (2007) 4:33-43.
Our laboratory has recently reported that GHRH and GHRH-R are expressed in BPH-1 cells
and that GHRH can strongly influence their growth (76). These findings suggest a role for GHRH as a
16
locally acting growth factor in BPH and support the merit of further work on the development of
GHRH antagonists for the therapy of BPH.
1.9. Prostate cancer
Prostate cancer is the most common noncutaneous malignant tumour in men (77,78).
Androgen-dependent prostate cancer constitutes ~70% of all cases of prostate neoplasms (77). The
suppression of androgenic activity with surgical orchiectomy or agonists of luteinizing hormone-
releasing hormone is considered the most adequate first line treatment for advanced prostate cancer.
However, hormonal therapy is successful in only 70% to 80% of cases and the median duration of
response is usually only 12 to 24 months (78). Currently the management of metastatic prostate
cancer remains a complex and difficult problem because there is no curative treatment. The
chemotherapy with docetaxel based combination can lead to significant improvement in survival time.
However, median survival does not exceed 20 months from the start of chemotherapy (79). Therefore,
there is a great need for new and better therapies.
1.9.1. GHRH antagonists and prostate cancer
On the basis of recent advances in the understanding of the role of neuropeptides and growth
factors in the progression of prostate carcinoma and other cancers (77,80), we have developed
antagonists of GHRH for the treatment of various cancers including prostate cancer (77,78,81-84).
GHRH antagonists inhibit the growth of various human tumours xenografted into nude mice,
including androgen-independent prostate cancers (77,81,82,84,85) mainly by direct effects on cancer
cells (73,85-88), although indirect effects mediated by the inhibition of the endocrine pituitary
GH/hepatic IGF-I axis also occur (81,84,86). The direct effects of GHRH antagonists on cancer cells
are mediated through pGHRH-R and splice variants (SV) of the pituitary type of GHRH receptors,
which are present on human prostate cancer specimens and on cell lines (69,70,72,73,81,82,87,89,90).
In addition to blocking GHRH receptors, antagonists of GHRH also inhibit the tumoral expression of
IGF-I and II. These effects contribute to their antiproliferative mechanism (81,82). A decrease of
VEGF, FGF, IGF-I and II protein levels and their mRNA expression, and a downregulation of EGF
receptors was found after treatment of experimental androgen-independent prostate cancers with
GHRH antagonists (73,87,88,91).
Although early GHRH antagonists such as MZ-4-71 or MZ-5-156 significantly inhibited the
growth of PC-3 and DU-145 human androgen-independent prostate cancers in vivo (91,92), they were
deemed unsuitable for clinical development, as they required high doses and frequent administration
(2 x 20 µg/day in nude mice), due to the lack of sufficient potency, protracted activity, and chemical
and enzymatic stability. Subsequently, our laboratory developed more potent and longer acting
GHRH antagonists, in order to reduce the doses necessary for human therapy and to make the
potential clinical use of GHRH antagonists technically and economically feasible (67,84,85). One of
17
the most potent GHRH antagonists prepared to date is MZ-J-7-138, which was developed by using a
number of design criteria, including: (1) replacement of the enzymatically vulnerable Arg and Lys
residues present in native GHRH peptide by enzymatically stable alternative residues while also
preserving the subnanomolar binding affinities of the analogs to GHRH receptors; (2) replacement of
the Asn and Met residues, prone to chemical hydrolysis, by other amino acids; (3) incorporation of a
fatty acyl moiety into the molecule in order to enhance its binding to serum albumin, this strategy
being employed to reduce the blood clearance due to enzymatic degradation and renal filtration of
peptide drugs (67,84,93).
1.9.2. Role of p53 and p21 in prostate cancer
The tumor suppressor gene p53 is mutated in about half of all human cancers (94,95). p53
appears to play an important role in sensing and repairing DNA damage, inhibiting the cell cycle to
allow DNA repair, and inducing apoptosis to eliminate severely damaged cells (96). The multifunctional
p53 protein, which can act as a transcriptional activator or repressor, is induced by DNA damage, and
interacts with proteins involved in DNA replication and repair (96). Mutant p53 (mt-p53) is
preferentially expressed in hormone-refractory and metastatic prostate cancer (97-99). A poor response
to chemotherapy is clearly associated with mutations in the p53 gene (94). Mt-p53 may have lost the
tumor-suppressive functions and acquired additional, new oncogenic “gain-of-function” activities
including transactivation of oncogenic targets such as c-myc, anti-apoptotic gene BAG-1, growth-
promoting genes such as asparagine synthetase and hTERT, and the multi-drug resistance gp180
protein (MDR1) (100-102). The down-regulation of mt-p53 expression by siRNA in various cancer
lines containing endogenous mt-p53 results in a reduction of tumor malignancy (100) and decreases
cellular colony growth due to the induction of apoptosis (95). Overexpressed mt-p53 in tumor cells
may be a suitable therapeutic target for pharmacological interventions aimed at suppressing its
expression in vivo (95,102). The expression of wt-p53 in tumors can be also targeted by new
experimental therapies aimed to restore or upregulate it (103). Thus, it was shown that the expression
of functional wt-p53 protein increased apoptosis and suppressed the growth of human prostate cancer
cells (97,104).
The cyclin-dependent kinase (CDK) inhibitor p21 is involved in p53-mediated growth arrest
and has been identified as a key factor for the regulation of cell growth (105). Recent studies also
indicate to an important anti-apoptotic and pro-survival role of p21 in various cancers including
prostatic, colorectal, breast as well as in renal cell carcinomas and melanomas (106-109). Thus a
reduction in p21 protein levels by an antisense method sensitized the MDA-PCa-2b and LNCaP
prostate cancer cell lines to apoptosis induced by growth factor deprivation and the DNA-damaging
agent doxorubicin (106). p21 appears to play a key role in cellular resistance and escape mechanisms
18
of tumors during treatment with anti-cancer agents including gamma-radiation, doxorubicin, cisplatin,
paclitaxel and tamoxifen (106-112).
An increased expression of p21 was found to be associated with androgen independent prostate
cancer (113). In clinical studies, p21 expression was identified as an indicator of poor survival in
prostate cancer patients (114-116).
In an experimental model of benign prostatic hyperplasia (BPH), GHRH antagonists caused
up-regulation of wt-p53 (117); while in small cell lung carcinomas GHRH antagonists inhibited mt-
p53 levels (118). Consequently, we investigated the effect of GHRH antagonist MZ-J-7-138 on
apoptotic mechanisms including p53, and p21 and growth in human experimental prostate cancers
such as androgen independent PC-3 and DU-145 lines expressing mutant p53 and androgen sensitive
2.1.1. To show presence of GHRH-R and LHRH-R on rat prostates
2.1.2. To investigate effects of:
LHRH antagonist cetrorelix
GHRH antagonists JMR-132, MIA-313 and MIA-459
combination of LHRH antagonist cetrorelix and GHRH antagonist JMR-132on androgen-
induced model of BPH
2.1.3. To explore mechanisms of action of antagonists of LHRH and GHRH, and their combination in
experimental BPH
2.2. Human prostate cancer xenograft studies
2.2.1. To investigate the minimum effective dose and dose-response relationship of potent GHRH
antagonist MZ-J-7-138 for the treatment of androgen-independent PC-3 prostate cancer in vivo
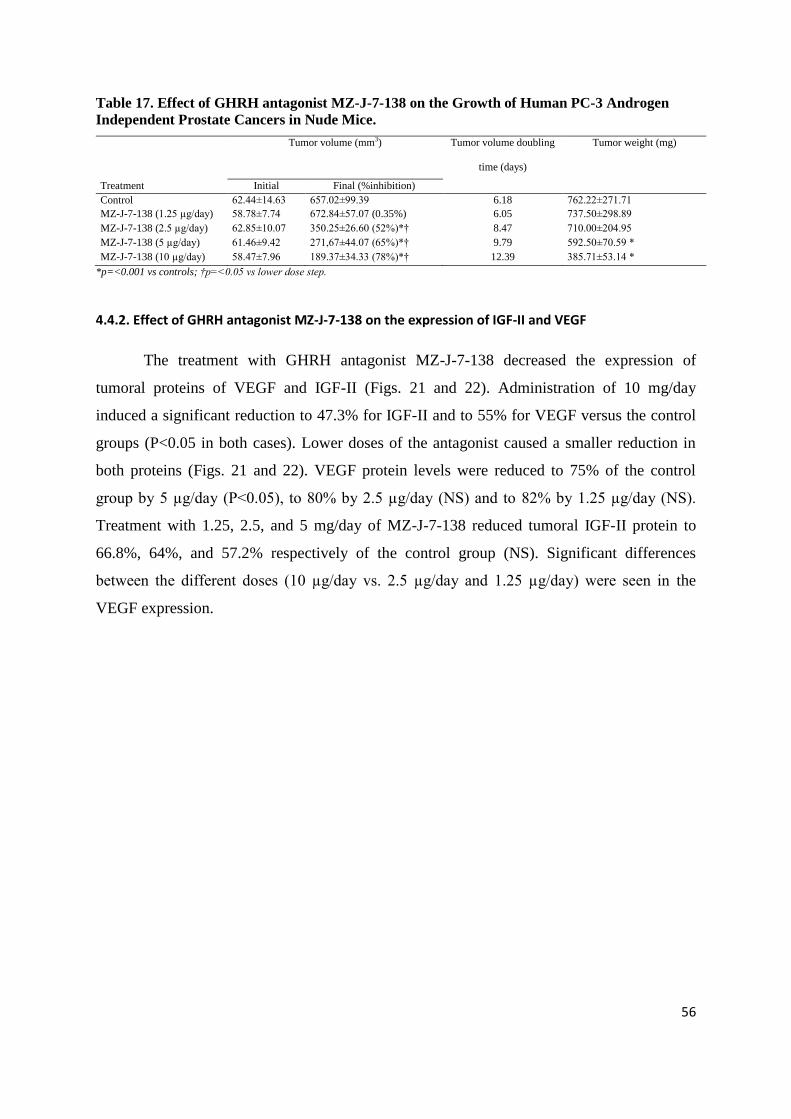
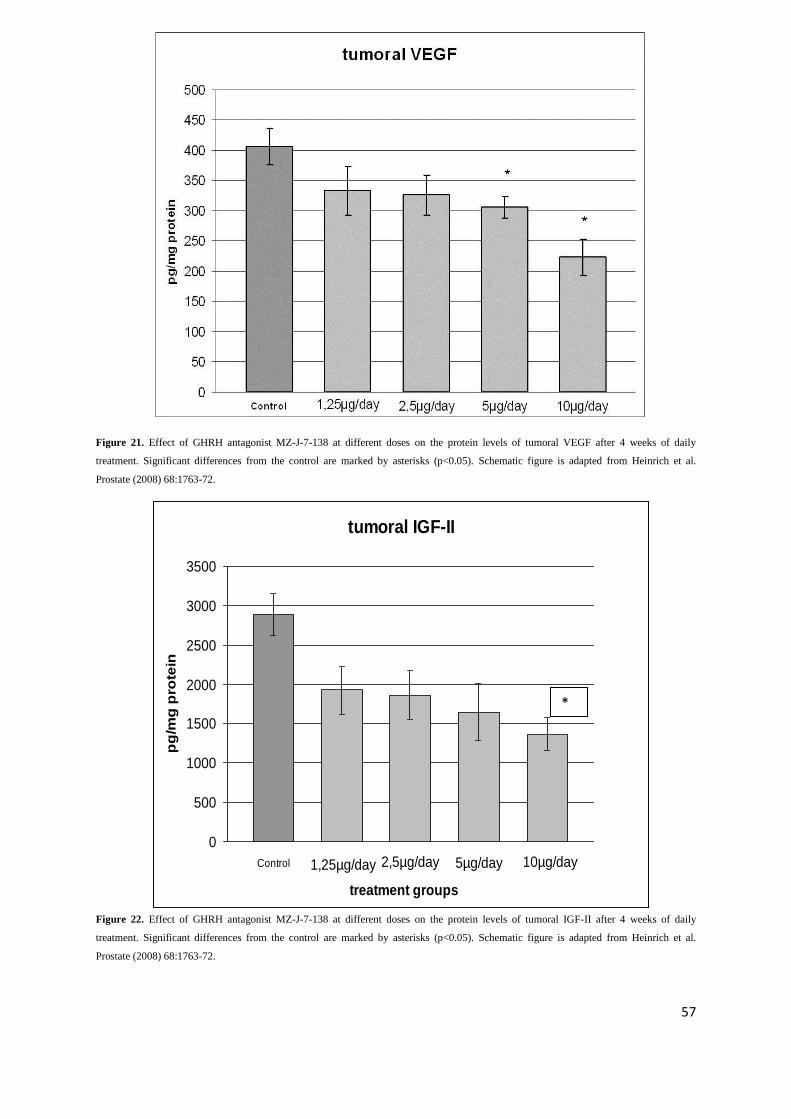
2.2.2. To assess effect of GHRH antagonist MZ-J-7-138 on tumoral IGF-II and VEGF in PC-3
xenografts in view of evidence from earlier studies that tumor inhibition by GHRH antagonists affects
multiple tumoral growth factors and their signaling
2.2.3. To investigate inhibitory effects of GHRH antagonist MZ-J-7-138 on growth of androgen
independent human experimental prostate cancer DU-145 and androgen sensitive MDA-PCa-2b
2.2.4. To evaluate the effect of GHRH antagonist MZ-J-7-138 on apoptotic mechanisms including
p53, and p21 in human experimental prostate cancer xenografts such as androgen independent PC-3
and DU-145 lines expressing mutant p53 and androgen sensitive MDA-PCa-2b line expressing wilde
type p53
20
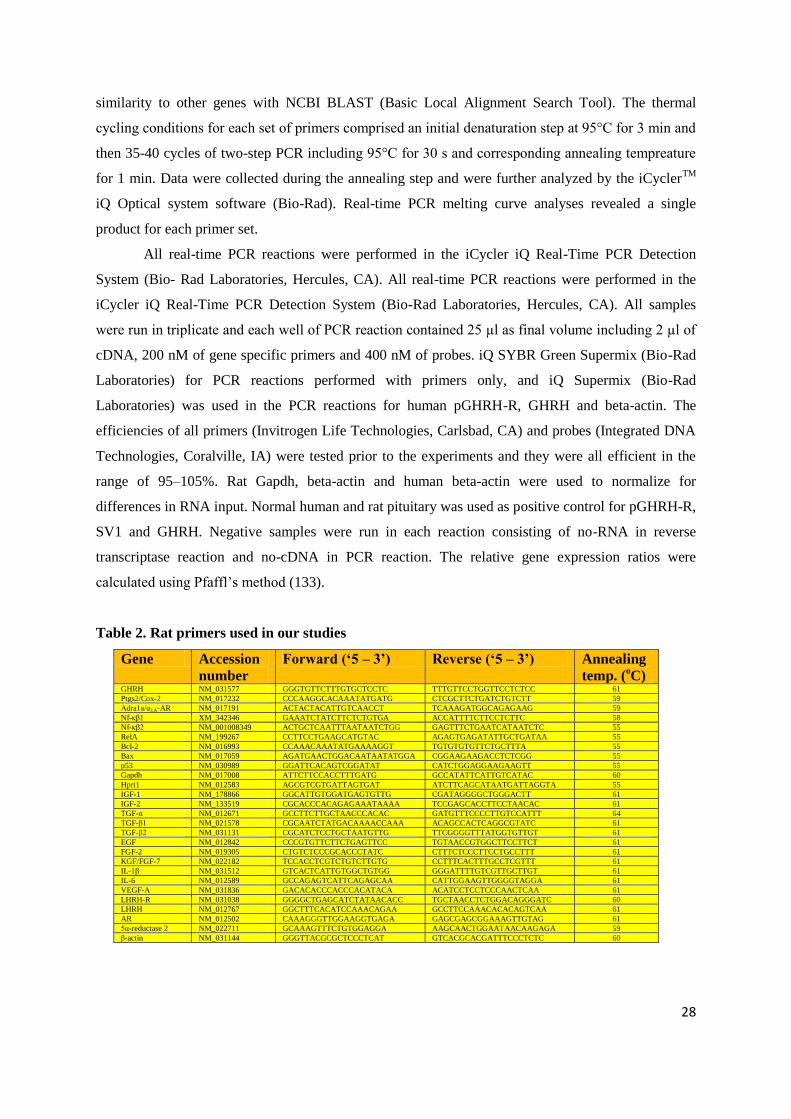
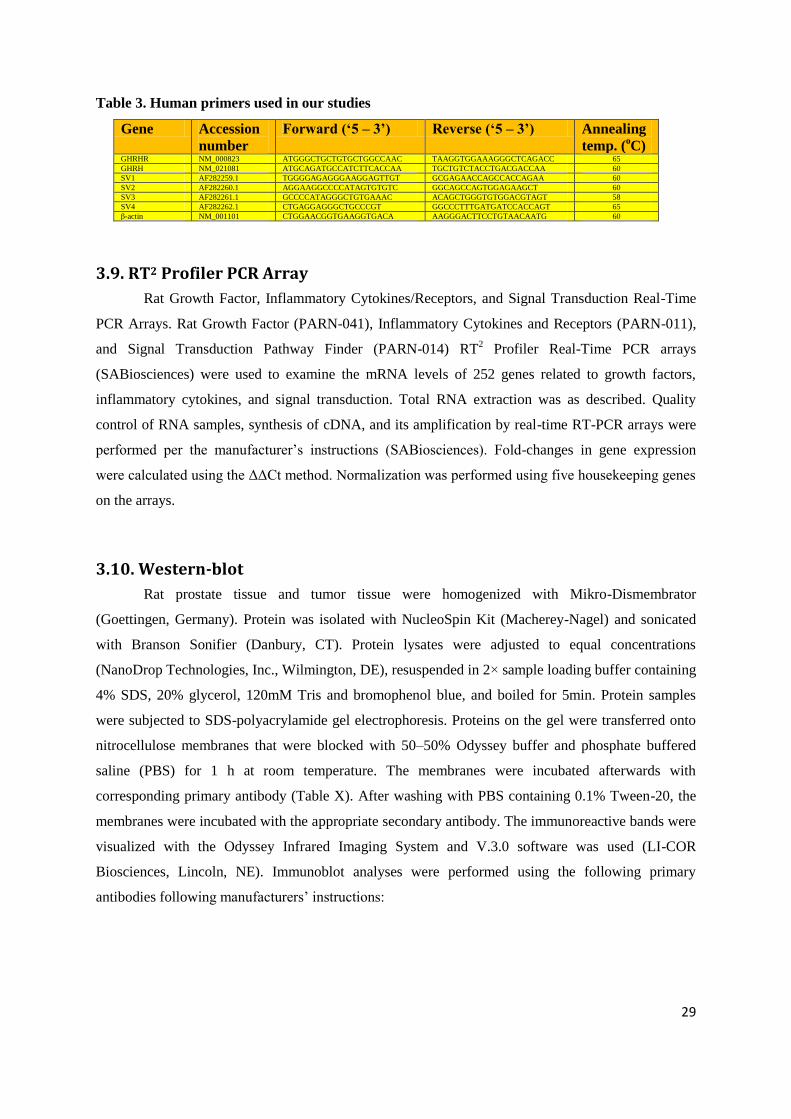
3. Materials and methods
3.1. Peptides and reagents
The GHRH antagonists JMR-132, MIA-313, MIA-459 and MZ-J-7-138 were synthesized by
solid-phase methodology using Boc-chemistry as described (119). Antagonist JMR-132 had the
sequence [PhAc0-Tyr
1, D-Arg
2, Cpa
6, Ala
8, Har
9, Tyr(Me)
10, His
11, Abu
15, His
20, Nle
27, D-Arg
28,
Har29
]hGH-RH(1-29)NH2, MIA-313 [(Ac-Amc)0-Tyr
1, D-Arg
2, Cpa
6, Ala
8, Har
9, Tyr(Me)
10, His
11,
Orn12
, Abu15
, His20
, Nle27
, D-Arg28
, Har29
, Agm30
]hGH-RH(1-30), MIA-459 [(PhAc-Ada)0-Tyr
1, D-
Arg2, Cpa
6, Ala
8, Har
9,Tyr (Me)
10, His
11, Orn
12, Abu
15, His
20, Orn
21, Nle
27, D-Arg
28, Har
29] hGH-
RH(1-29)NH2, and MZ-J-7-138 [CH3-(CH2)6-CO-Tyr1,DArg
2, Cpa
6,Ala
8,His
9,
Tyr(Et)10
,His11
,Orn12
,Abu15
, His20
, Orn21
,Nle27
, D-Arg28
, Har29
]hGHRH(1–29)NH2,where Abu is α-
aminobutyryl, Ac is acetyl, Acm is 8-aminocaprylyl, Ada is 12-aminododecanoyl, Agm is agmatine
(1-amino-4-guanidino-butane), Cpa is 4-chloro-Phe, Har is homoarginine, Nle is norleucine, Orn is
ornithine, PhAc is phenylacetyl, Tyr(Et) is O-ethyltyrosine and Tyr(Me) is O-methyl-Tyr. JMR-132
and MIA-459 with amidated carboxy termini were prepared on p-methylbenzhydrylamine resin (0.5–
0.9 mmol/g). For the synthesis of MIA-313 with C-terminal Agm, Boc-Agm-SPA-p-
methylbenzhydrylamine resin (30 mmol/g; California Peptide Research) was used as the starting
material. After completion of the synthesis and removal of the N-α-Boc–protecting group from Tyr1,
the resin-bound JMR-132, MIA-313, MIA-459, and MZ-J-7-138 peptides were acylated with PhAc,
Ac-Amc, PhAc-Ada, and octanoic acid, respectively. Final deprotection and cleavage of the peptides
from the resin with anhydrous hydrogen fluoride, as well as their purification and analysis by
semipreparative and analytical HPLC and mass spectra, were done as described previously (120).
The LHRH antagonist Cetrorelix ([Ac-D-Nal(2)1,D-Phe(4Cl)
2,D-Pal(3)
3,D-Cit
6,D-Ala
10]-
LHRH) originally synthesized in our laboratory by solid-phase methods (54) was made by Aeterna-
Zentaris (Frankfurt-on-Main, Germany) as Cetrorelix acetate (D20761). For in vitro experiments,
Cetrorelix acetate was dissolved in 0.1% DMSO and diluted in media. For in vivo experiments we
used a depot formulation of Cetrorelix pamoate (D20762), also provided by Aeterna-Zentaris,
containing Cetrorelix peptide-base and pamoic acid in a molar ratio of 2:1, respectively. For the
injection, Cetrorelix pamoate was dissolved in distilled water at a final concentration of 15 mg/ml in
5% mannitol. This depot preparation can be injected every 21–30 days. Aliquots of this suspension
(3mg/0.2ml) were injected s.c. giving an estimated daily release of 100μg/day of Cetrorelix for 30
days.
The peptides were lyophilized and stored in desiccator, and the stability and purity of the long
stored compounds were checked by HPLC before the experiments.
In our rat BPH model, testosterone enanthate (TE) (Watson Pharmaceuticals), corn oil vehicle
(Sigma-Aldrich), and 5α-reductase 2 (5AR2) inhibitor finasteride (Sigma-Aldrich) were used. For
21
daily injection, GHRH antagonists and finasteride were dissolved in 0.1% DMSO in 10% aqueous
propylene glycol solution.
3.2 Animals
In our BPH studies adult male Wistar rats (Charles River Laboratories) weighing 250-400 g
were used. Rats were allowed standard laboratory diet and tap water ad libitum. All rats remained
healthy throughout the experiments.
For xenograft studies, approximately 5–6 weeks old male athymic (Ncr nu/nu) nude mice
were obtained from the National Cancer Institute (Frederick Cancer Research and Develkopment
Center, Frederick, MD), housed in sterile cages under laminar flow hoods and fed autoclaved chow
and water ad libitum.
Rodents were housed in a climate-controlled (22 ± 2 °C, 50 ± 10% humidity), environment
with a 12-h light/dark cycle (light on from 06-18 h). All experiments were conducted in accordance
with the principles and procedures outlined in the National Institutes of Health Guide for the Care and
Use of Laboratory Animals. The protocol of the animal experiments was reviewed and approved by
the Institutional Animal Care and Use Committee (IACUC). Body weights were determined weekly.
3.3. In vivo experimental models
3.3.1. Testosterone-induced model of BPH
It is well known that enlargement of the prostate occurs in the presence of androgens (121) and that
anabolic steroids increase prostatic volume and reduce urine flow, leading to increased urinary
frequency (122). Maggi et al. described a model in male rats wherein BPH was produced by repeated
injections of testosterone (51). The model described by Maggi et al. has been adapted for several
studies (123-126). Given that the mechanism of prostate growth is complex and heterogeneous in
different species and the testosterone-induced models of BPH show an epithelial hyperplasia
(126,127), the androgen-induced models of BPH have limitations. These include the fact that
inflammation was not described as a main characteristic, but rather was incidental (126).
Alonso-Magdalena‟s description of human BPH as predominantly of epithelial origin (17) and the fact
that in our preliminary studies we found that our target receptors GHRH-R and LHRH-R are
exclusively expressed in the rat prostatic epithelium supports the rationale for using a testosterone-
induced model of BPH with predominant epithelial hyperplasia based on the reports of Maggi et al.
(51) and Scolnik et al. (126).
22
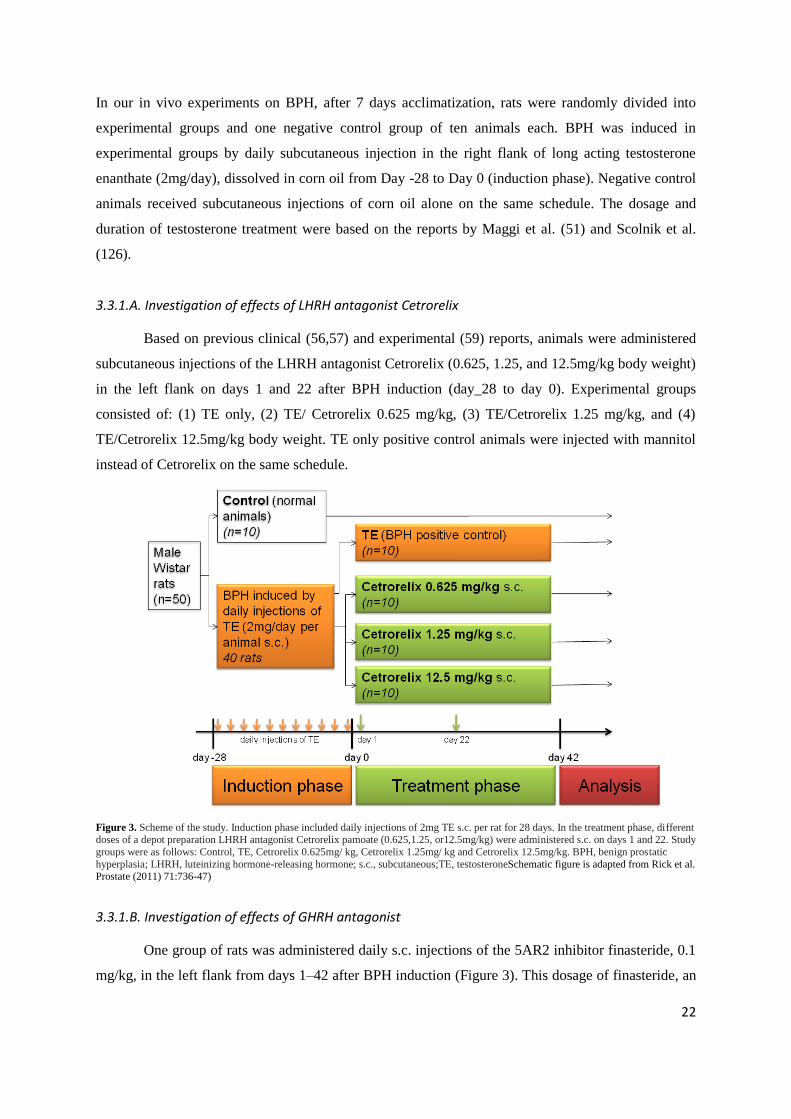
In our in vivo experiments on BPH, after 7 days acclimatization, rats were randomly divided into
experimental groups and one negative control group of ten animals each. BPH was induced in
experimental groups by daily subcutaneous injection in the right flank of long acting testosterone
enanthate (2mg/day), dissolved in corn oil from Day -28 to Day 0 (induction phase). Negative control
animals received subcutaneous injections of corn oil alone on the same schedule. The dosage and
duration of testosterone treatment were based on the reports by Maggi et al. (51) and Scolnik et al.
(126).
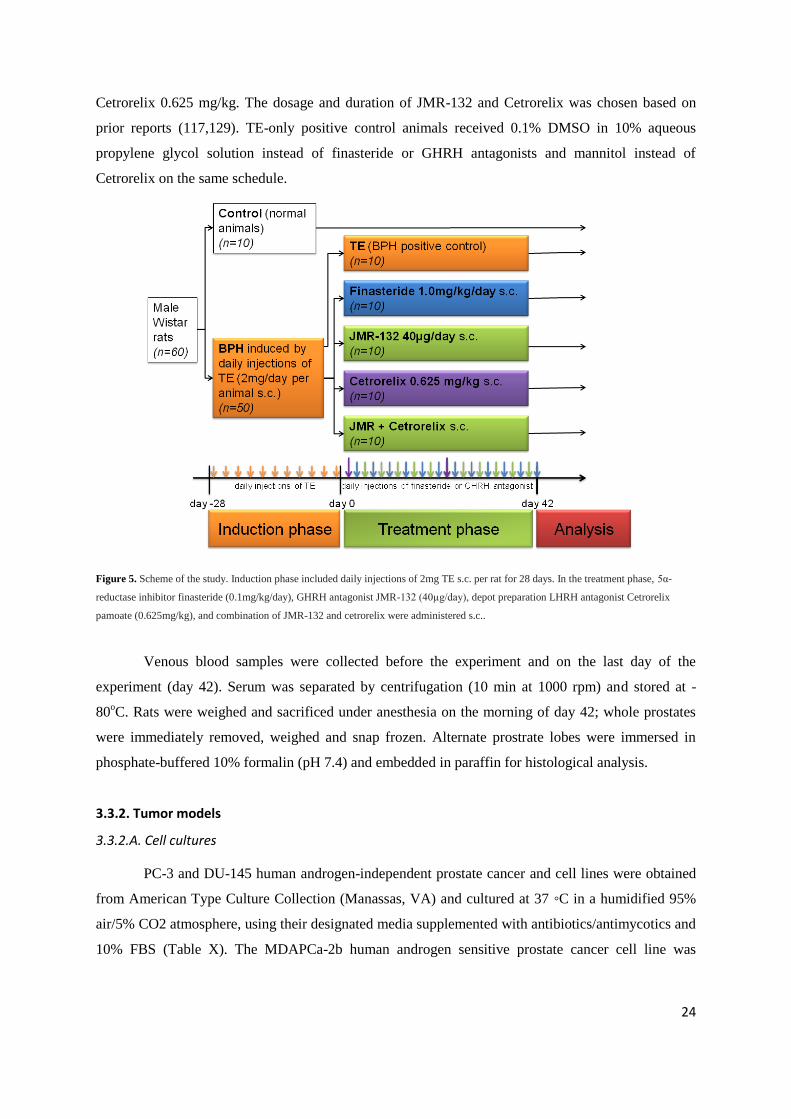
3.3.1.A. Investigation of effects of LHRH antagonist Cetrorelix
Based on previous clinical (56,57) and experimental (59) reports, animals were administered
subcutaneous injections of the LHRH antagonist Cetrorelix (0.625, 1.25, and 12.5mg/kg body weight)
in the left flank on days 1 and 22 after BPH induction (day_28 to day 0). Experimental groups
consisted of: (1) TE only, (2) TE/ Cetrorelix 0.625 mg/kg, (3) TE/Cetrorelix 1.25 mg/kg, and (4)
TE/Cetrorelix 12.5mg/kg body weight. TE only positive control animals were injected with mannitol
instead of Cetrorelix on the same schedule.
Figure 3. Scheme of the study. Induction phase included daily injections of 2mg TE s.c. per rat for 28 days. In the treatment phase, different doses of a depot preparation LHRH antagonist Cetrorelix pamoate (0.625,1.25, or12.5mg/kg) were administered s.c. on days 1 and 22. Study
groups were as follows: Control, TE, Cetrorelix 0.625mg/ kg, Cetrorelix 1.25mg/ kg and Cetrorelix 12.5mg/kg. BPH, benign prostatic
hyperplasia; LHRH, luteinizing hormone-releasing hormone; s.c., subcutaneous;TE, testosteroneSchematic figure is adapted from Rick et al. Prostate (2011) 71:736-47)
3.3.1.B. Investigation of effects of GHRH antagonist
One group of rats was administered daily s.c. injections of the 5AR2 inhibitor finasteride, 0.1
mg/kg, in the left flank from days 1–42 after BPH induction (Figure 3). This dosage of finasteride, an
23
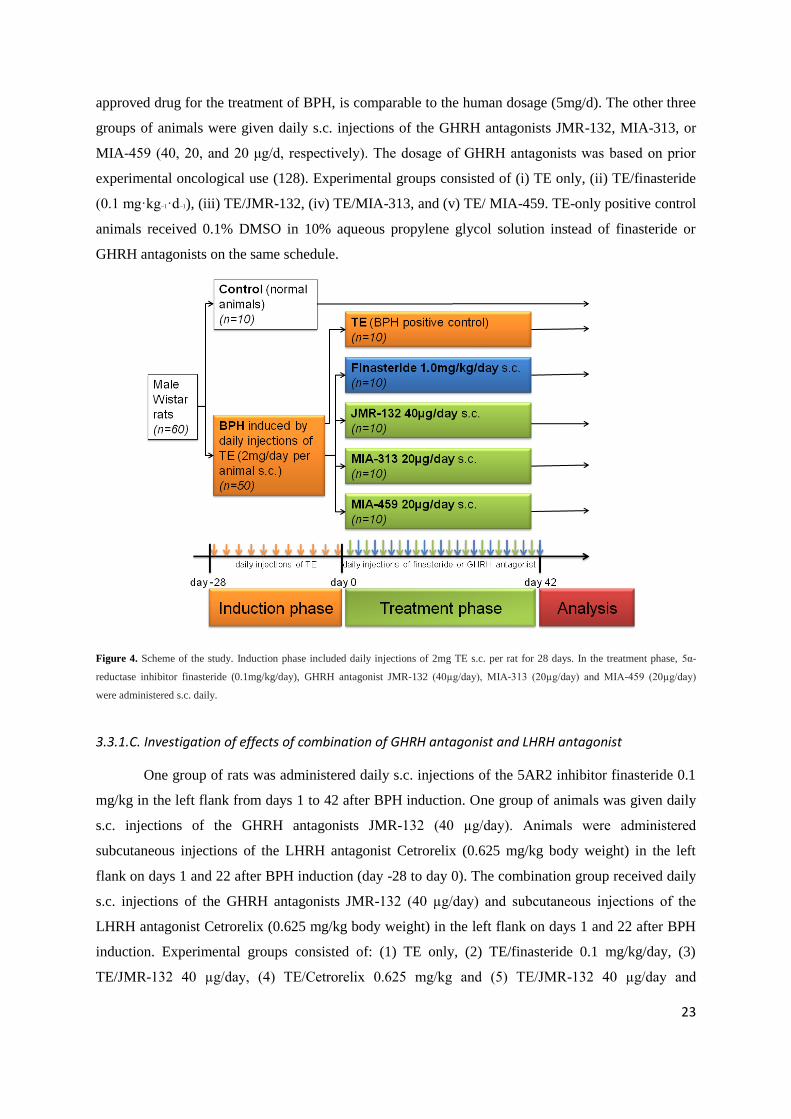
approved drug for the treatment of BPH, is comparable to the human dosage (5mg/d). The other three
groups of animals were given daily s.c. injections of the GHRH antagonists JMR-132, MIA-313, or
MIA-459 (40, 20, and 20 μg/d, respectively). The dosage of GHRH antagonists was based on prior
experimental oncological use (128). Experimental groups consisted of (i) TE only, (ii) TE/finasteride
(0.1 mg·kg−1·d−1), (iii) TE/JMR-132, (iv) TE/MIA-313, and (v) TE/ MIA-459. TE-only positive control
animals received 0.1% DMSO in 10% aqueous propylene glycol solution instead of finasteride or
GHRH antagonists on the same schedule.
Figure 4. Scheme of the study. Induction phase included daily injections of 2mg TE s.c. per rat for 28 days. In the treatment phase, 5α-
† p<0.05, ‡ p<0.01 and p<0.001 as compared to Control, * p<0.05, ***p<0.01 as compared to TE. Statistical analysis was performed
by one-way ANOVA, followed by Bonferroni t-test.
Figure 6. Effect of TE and treatment with LHRH antagonist Cetrorelix at doses of 0.625, 1.25 and 12.5 mg/kg on relative prostate weight,
evaluated 42 days after the start of treatment with Cetrorelix. Statistical analysis was performed by one-way ANOVA, followed by
Bonferroni t-test. Significant differences are marked by asterisks (*p<0.05 and ***p<0.001). CTR = negative control; CET = Cetrorelix;
ANOVA = analysis of variance. Schematic figure is adapted from Rick et al. Prostate (2011) 71:736-47.
33
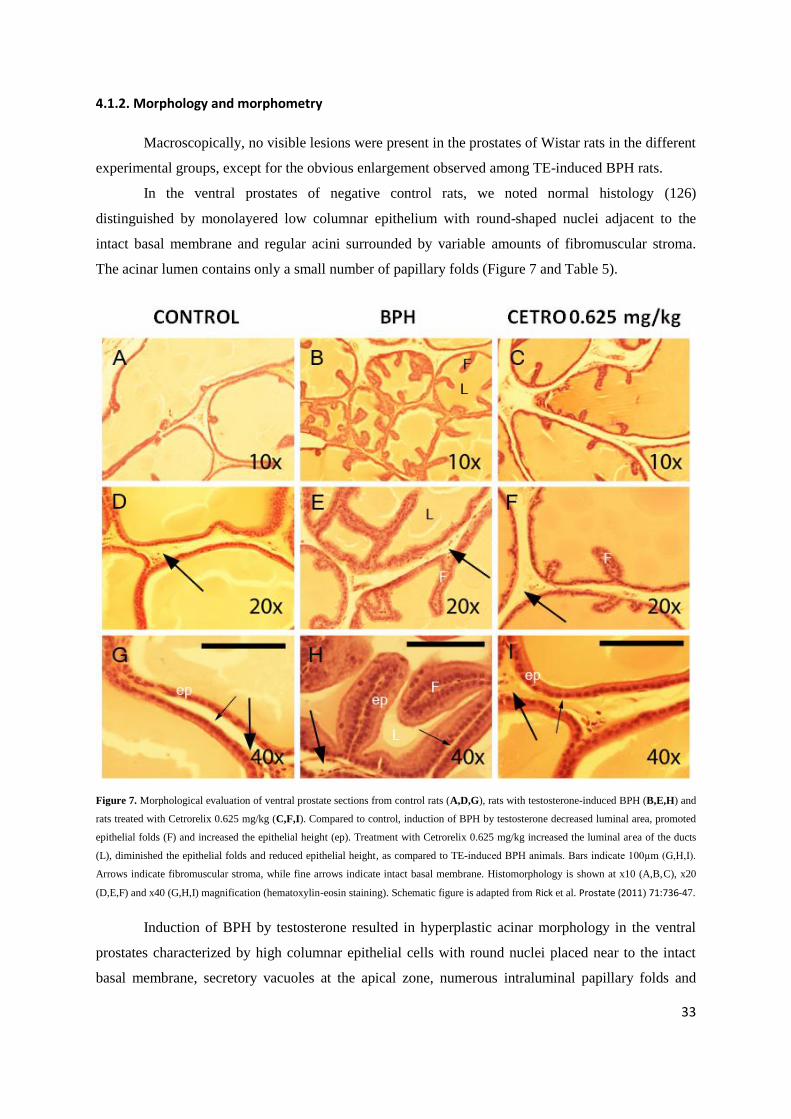
4.1.2. Morphology and morphometry
Macroscopically, no visible lesions were present in the prostates of Wistar rats in the different
experimental groups, except for the obvious enlargement observed among TE-induced BPH rats.
In the ventral prostates of negative control rats, we noted normal histology (126)
distinguished by monolayered low columnar epithelium with round-shaped nuclei adjacent to the
intact basal membrane and regular acini surrounded by variable amounts of fibromuscular stroma.
The acinar lumen contains only a small number of papillary folds (Figure 7 and Table 5).
Figure 7. Morphological evaluation of ventral prostate sections from control rats (A,D,G), rats with testosterone-induced BPH (B,E,H) and
rats treated with Cetrorelix 0.625 mg/kg (C,F,I). Compared to control, induction of BPH by testosterone decreased luminal area, promoted
epithelial folds (F) and increased the epithelial height (ep). Treatment with Cetrorelix 0.625 mg/kg increased the luminal area of the ducts
(L), diminished the epithelial folds and reduced epithelial height, as compared to TE-induced BPH animals. Bars indicate 100µm (G,H,I).
Arrows indicate fibromuscular stroma, while fine arrows indicate intact basal membrane. Histomorphology is shown at x10 (A,B,C), x20
(D,E,F) and x40 (G,H,I) magnification (hematoxylin-eosin staining). Schematic figure is adapted from Rick et al. Prostate (2011) 71:736-47.
Induction of BPH by testosterone resulted in hyperplastic acinar morphology in the ventral
prostates characterized by high columnar epithelial cells with round nuclei placed near to the intact
basal membrane, secretory vacuoles at the apical zone, numerous intraluminal papillary folds and
34
variable amounts of stroma (Figure 7). These changes in acinar morphology after treatment with
testosterone correspond to the observations of Scolnik et al. (126). We also found a 75% increase in
the epithelial cell height compared to control (Table 5).
After treatment with Cetrorelix 0.625 mg/kg, the ventral prostatic acinar morphology showed
characteristics similar to that of normal rats (Figure 7). The acini were lined with low columnar
epithelium with round basal nuclei. The acinar lumina had only a small degree of infolding. Cetrorelix
0.625 mg/kg significantly decreased the epithelial height by 36% compared to TE-induced BPH
controls (Table 5). The amount of fibromuscular stroma was seemingly not affected by treatment with
Cetrorelix at a low dose.
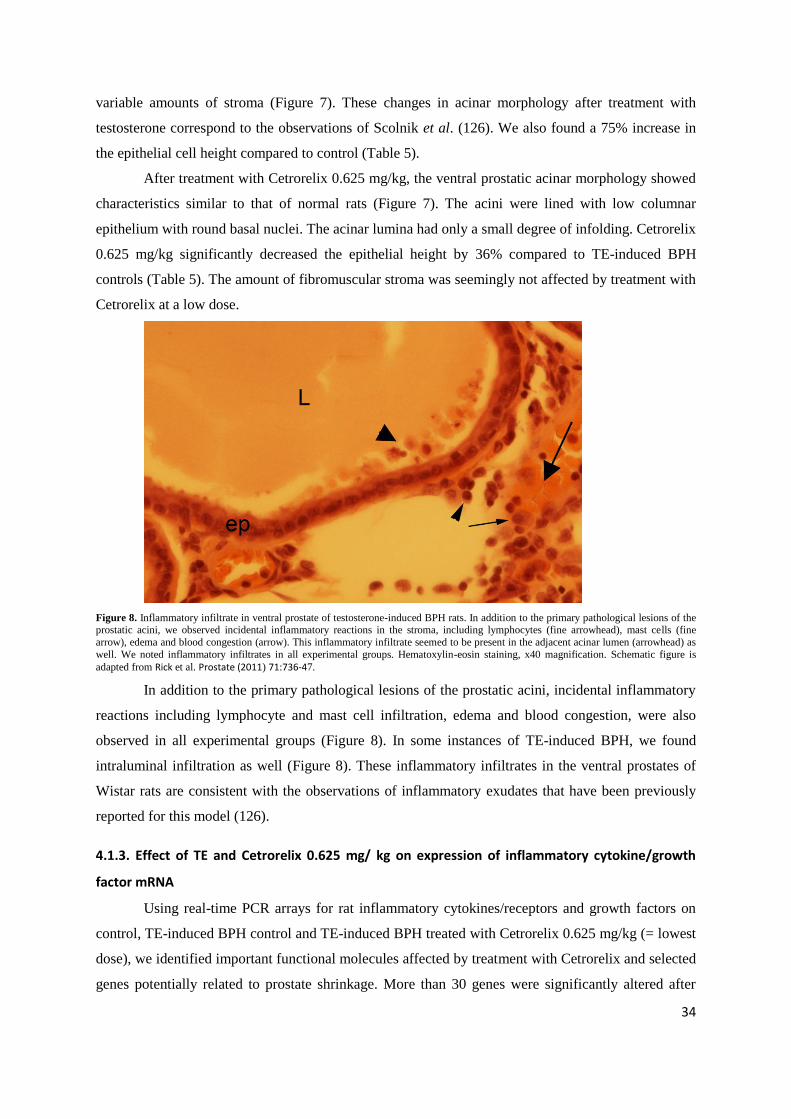
Figure 8. Inflammatory infiltrate in ventral prostate of testosterone-induced BPH rats. In addition to the primary pathological lesions of the prostatic acini, we observed incidental inflammatory reactions in the stroma, including lymphocytes (fine arrowhead), mast cells (fine
arrow), edema and blood congestion (arrow). This inflammatory infiltrate seemed to be present in the adjacent acinar lumen (arrowhead) as
well. We noted inflammatory infiltrates in all experimental groups. Hematoxylin-eosin staining, x40 magnification. Schematic figure is
adapted from Rick et al. Prostate (2011) 71:736-47.
In addition to the primary pathological lesions of the prostatic acini, incidental inflammatory
reactions including lymphocyte and mast cell infiltration, edema and blood congestion, were also
observed in all experimental groups (Figure 8). In some instances of TE-induced BPH, we found
intraluminal infiltration as well (Figure 8). These inflammatory infiltrates in the ventral prostates of
Wistar rats are consistent with the observations of inflammatory exudates that have been previously
reported for this model (126).
4.1.3. Effect of TE and Cetrorelix 0.625 mg/ kg on expression of inflammatory cytokine/growth
factor mRNA
Using real-time PCR arrays for rat inflammatory cytokines/receptors and growth factors on
control, TE-induced BPH control and TE-induced BPH treated with Cetrorelix 0.625 mg/kg (= lowest
dose), we identified important functional molecules affected by treatment with Cetrorelix and selected
genes potentially related to prostate shrinkage. More than 30 genes were significantly altered after
35
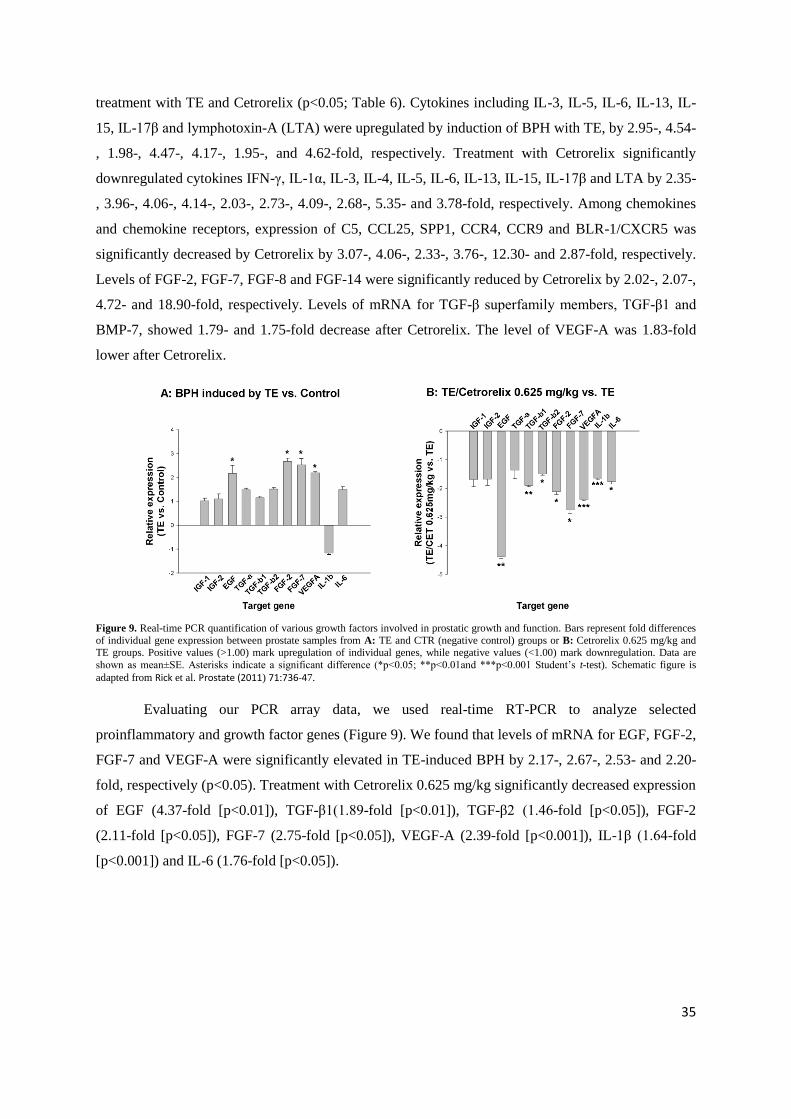
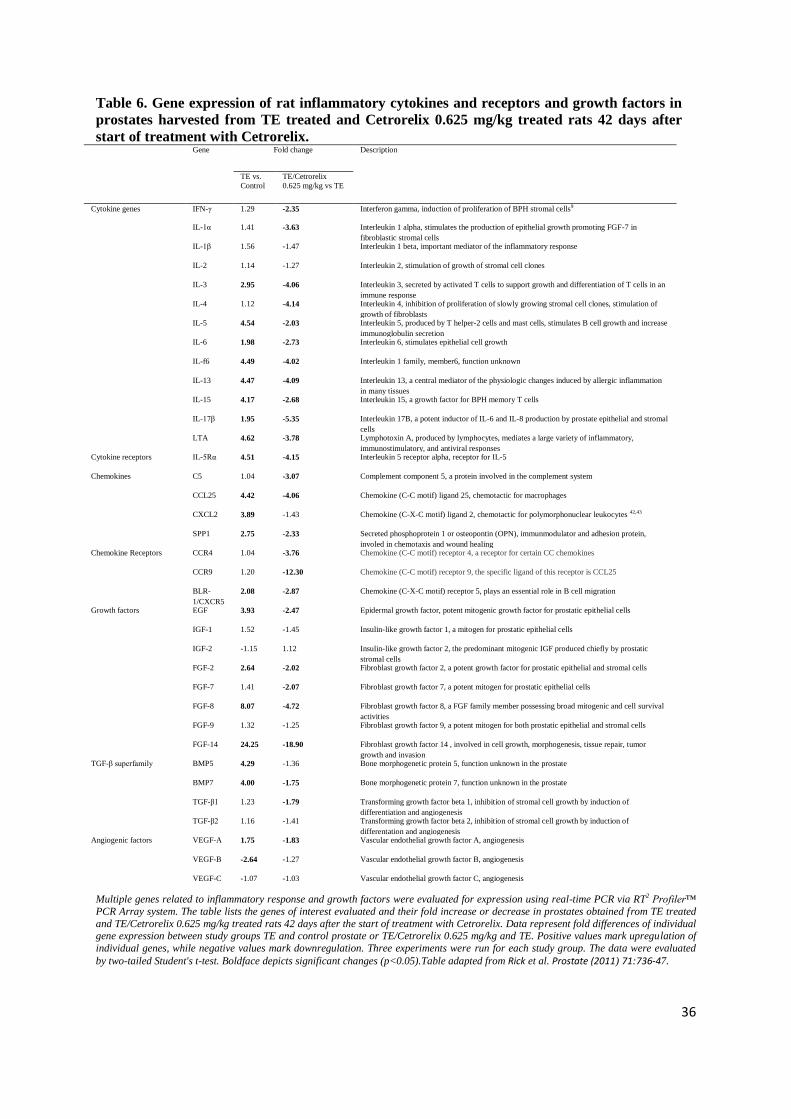
treatment with TE and Cetrorelix (p<0.05; Table 6). Cytokines including IL-3, IL-5, IL-6, IL-13, IL-
15, IL-17β and lymphotoxin-A (LTA) were upregulated by induction of BPH with TE, by 2.95-, 4.54-
, 1.98-, 4.47-, 4.17-, 1.95-, and 4.62-fold, respectively. Treatment with Cetrorelix significantly
downregulated cytokines IFN-γ, IL-1α, IL-3, IL-4, IL-5, IL-6, IL-13, IL-15, IL-17β and LTA by 2.35-
, 3.96-, 4.06-, 4.14-, 2.03-, 2.73-, 4.09-, 2.68-, 5.35- and 3.78-fold, respectively. Among chemokines
and chemokine receptors, expression of C5, CCL25, SPP1, CCR4, CCR9 and BLR-1/CXCR5 was
significantly decreased by Cetrorelix by 3.07-, 4.06-, 2.33-, 3.76-, 12.30- and 2.87-fold, respectively.
Levels of FGF-2, FGF-7, FGF-8 and FGF-14 were significantly reduced by Cetrorelix by 2.02-, 2.07-,
4.72- and 18.90-fold, respectively. Levels of mRNA for TGF-β superfamily members, TGF-β1 and
BMP-7, showed 1.79- and 1.75-fold decrease after Cetrorelix. The level of VEGF-A was 1.83-fold
lower after Cetrorelix.
Figure 9. Real-time PCR quantification of various growth factors involved in prostatic growth and function. Bars represent fold differences
of individual gene expression between prostate samples from A: TE and CTR (negative control) groups or B: Cetrorelix 0.625 mg/kg and TE groups. Positive values (>1.00) mark upregulation of individual genes, while negative values (<1.00) mark downregulation. Data are
shown as mean±SE. Asterisks indicate a significant difference (*p<0.05; **p<0.01and ***p<0.001 Student‟s t-test). Schematic figure is
adapted from Rick et al. Prostate (2011) 71:736-47.
Evaluating our PCR array data, we used real-time RT-PCR to analyze selected
proinflammatory and growth factor genes (Figure 9). We found that levels of mRNA for EGF, FGF-2,
FGF-7 and VEGF-A were significantly elevated in TE-induced BPH by 2.17-, 2.67-, 2.53- and 2.20-
Multiple genes related to inflammatory response and growth factors were evaluated for expression using real-time PCR via RT2 Profiler™
PCR Array system. The table lists the genes of interest evaluated and their fold increase or decrease in prostates obtained from TE treated
and TE/Cetrorelix 0.625 mg/kg treated rats 42 days after the start of treatment with Cetrorelix. Data represent fold differences of individual gene expression between study groups TE and control prostate or TE/Cetrorelix 0.625 mg/kg and TE. Positive values mark upregulation of
individual genes, while negative values mark downregulation. Three experiments were run for each study group. The data were evaluated
by two-tailed Student's t-test. Boldface depicts significant changes (p<0.05).Table adapted from Rick et al. Prostate (2011) 71:736-47.
37
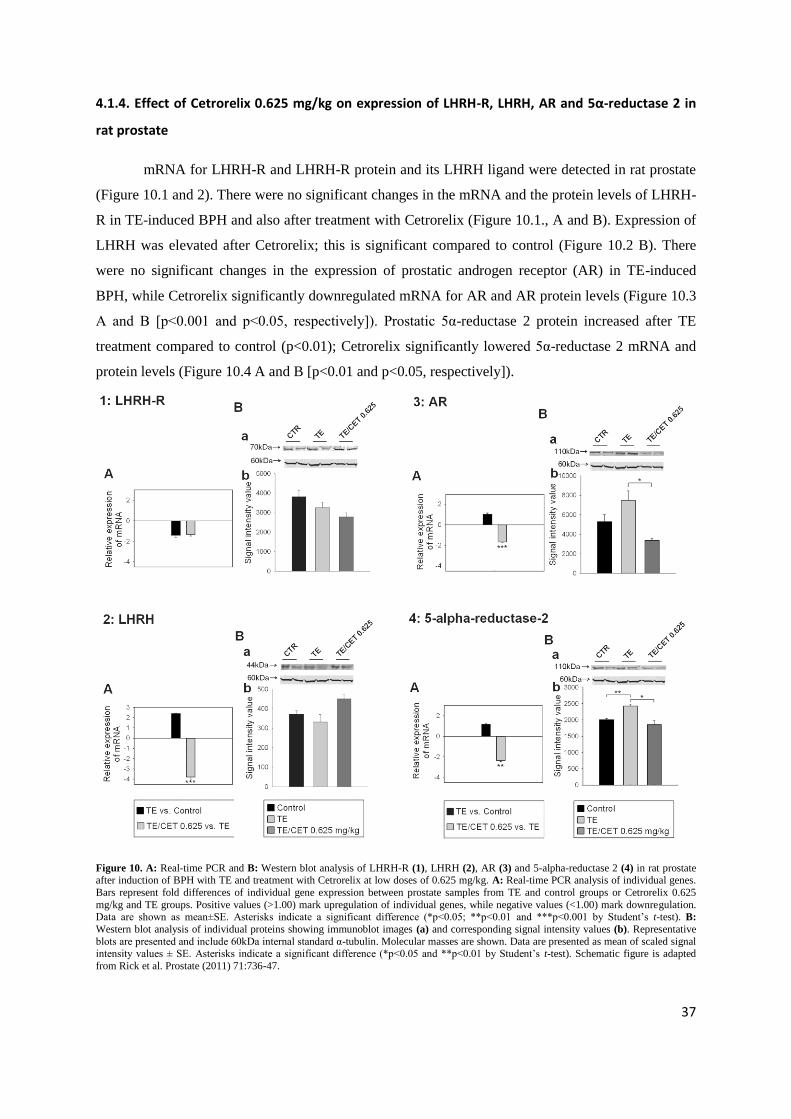
4.1.4. Effect of Cetrorelix 0.625 mg/kg on expression of LHRH-R, LHRH, AR and 5α-reductase 2 in
rat prostate
mRNA for LHRH-R and LHRH-R protein and its LHRH ligand were detected in rat prostate
(Figure 10.1 and 2). There were no significant changes in the mRNA and the protein levels of LHRH-
R in TE-induced BPH and also after treatment with Cetrorelix (Figure 10.1., A and B). Expression of
LHRH was elevated after Cetrorelix; this is significant compared to control (Figure 10.2 B). There
were no significant changes in the expression of prostatic androgen receptor (AR) in TE-induced
BPH, while Cetrorelix significantly downregulated mRNA for AR and AR protein levels (Figure 10.3
A and B [p<0.001 and p<0.05, respectively]). Prostatic 5α-reductase 2 protein increased after TE
treatment compared to control (p<0.01); Cetrorelix significantly lowered 5α-reductase 2 mRNA and
protein levels (Figure 10.4 A and B [p<0.01 and p<0.05, respectively]).
Figure 10. A: Real-time PCR and B: Western blot analysis of LHRH-R (1), LHRH (2), AR (3) and 5-alpha-reductase 2 (4) in rat prostate after induction of BPH with TE and treatment with Cetrorelix at low doses of 0.625 mg/kg. A: Real-time PCR analysis of individual genes.
Bars represent fold differences of individual gene expression between prostate samples from TE and control groups or Cetrorelix 0.625
mg/kg and TE groups. Positive values (>1.00) mark upregulation of individual genes, while negative values (<1.00) mark downregulation. Data are shown as mean±SE. Asterisks indicate a significant difference (*p<0.05; **p<0.01 and ***p<0.001 by Student‟s t-test). B:
Western blot analysis of individual proteins showing immunoblot images (a) and corresponding signal intensity values (b). Representative
blots are presented and include 60kDa internal standard α-tubulin. Molecular masses are shown. Data are presented as mean of scaled signal intensity values ± SE. Asterisks indicate a significant difference (*p<0.05 and **p<0.01 by Student‟s t-test). Schematic figure is adapted
from Rick et al. Prostate (2011) 71:736-47.
38
4.1.5. Binding assay for LHRH receptors in rat prostate
Receptor analyses revealed a single class of high affinity binding sites for LHRH in rat
prostate with dissociation constant [Kd] of 0.82±0.12 nM) and a mean Bmax (maximal receptor binding
capacity) value of 143.0±3.81 fmol/mg membrane protein. Non- significant changes were found in Kd
or Bmax values in TE-induced BPH. Bmax for LHRH was significantly (p<0.01) reduced to 68.9±8.28
fmol/mg membrane protein after Cetrorelix (12.5 mg/kg), compared with control; but Kd remained
unchanged.
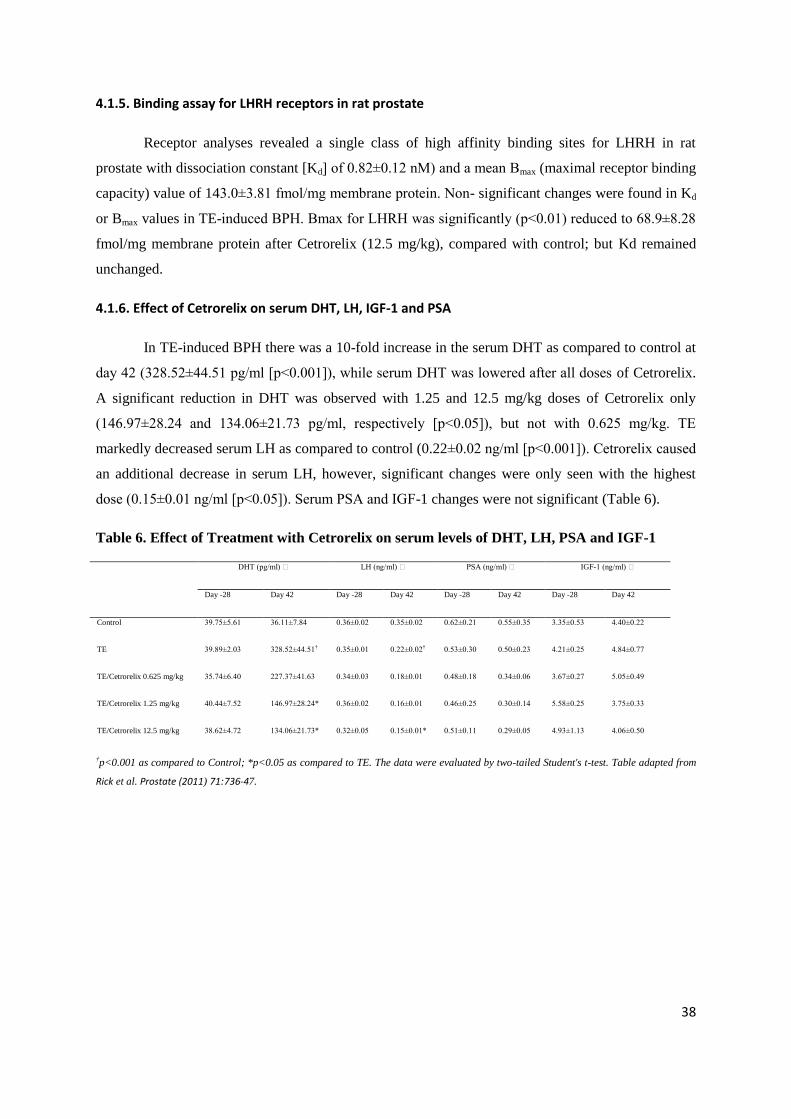
4.1.6. Effect of Cetrorelix on serum DHT, LH, IGF-1 and PSA
In TE-induced BPH there was a 10-fold increase in the serum DHT as compared to control at
day 42 (328.52±44.51 pg/ml [p<0.001]), while serum DHT was lowered after all doses of Cetrorelix.
A significant reduction in DHT was observed with 1.25 and 12.5 mg/kg doses of Cetrorelix only
(146.97±28.24 and 134.06±21.73 pg/ml, respectively [p<0.05]), but not with 0.625 mg/kg. TE
markedly decreased serum LH as compared to control (0.22±0.02 ng/ml [p<0.001]). Cetrorelix caused
an additional decrease in serum LH, however, significant changes were only seen with the highest
dose (0.15±0.01 ng/ml [p<0.05]). Serum PSA and IGF-1 changes were not significant (Table 6).
Table 6. Effect of Treatment with Cetrorelix on serum levels of DHT, LH, PSA and IGF-1
DHT (pg/ml) LH (ng/ml) PSA (ng/ml) IGF-1 (ng/ml)
Day -28 Day 42 Day -28 Day 42 Day -28 Day 42 Day -28 Day 42
Control 39.75±5.61 36.11±7.84 0.36±0.02 0.35±0.02 0.62±0.21 0.55±0.35 3.35±0.53 4.40±0.22
TE 39.89±2.03 328.52±44.51† 0.35±0.01 0.22±0.02† 0.53±0.30 0.50±0.23 4.21±0.25 4.84±0.77
†p<0.001 as compared to Control; *p<0.05 as compared to TE. The data were evaluated by two-tailed Student's t-test. Table adapted from
Rick et al. Prostate (2011) 71:736-47.
39
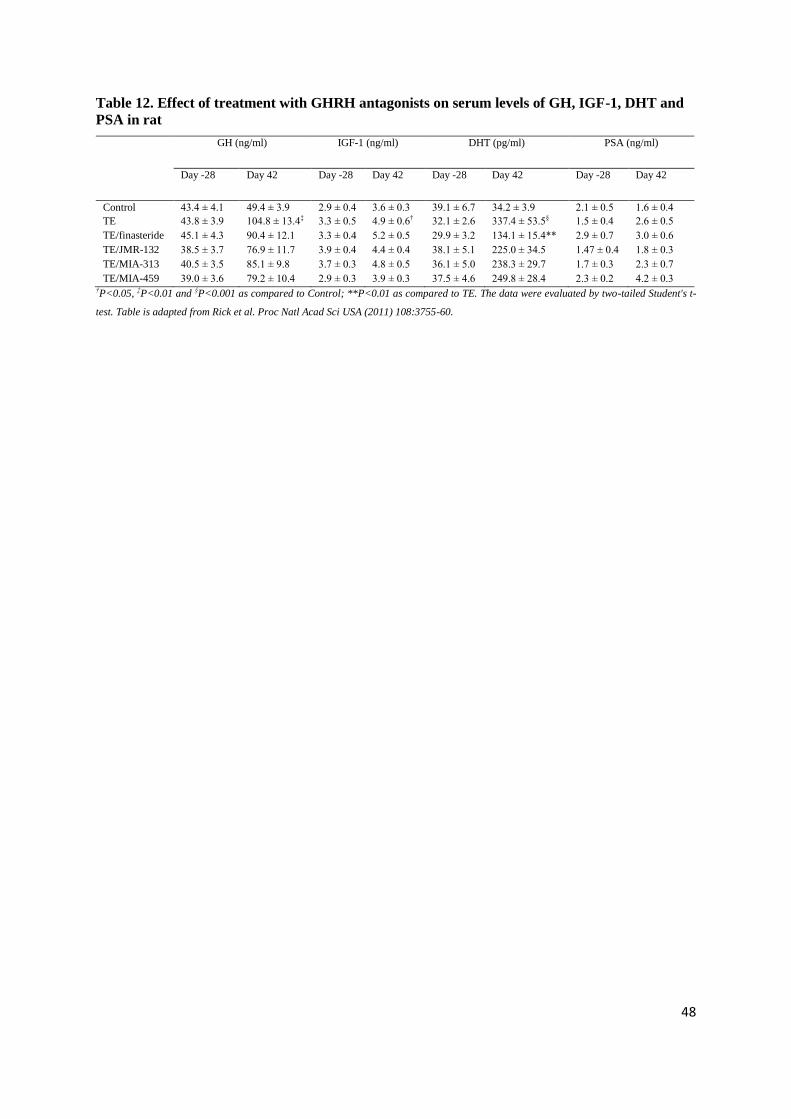
4.2. Effects of GHRH antagonists on experimental benign prostatic
hyperplasia (Study 2)
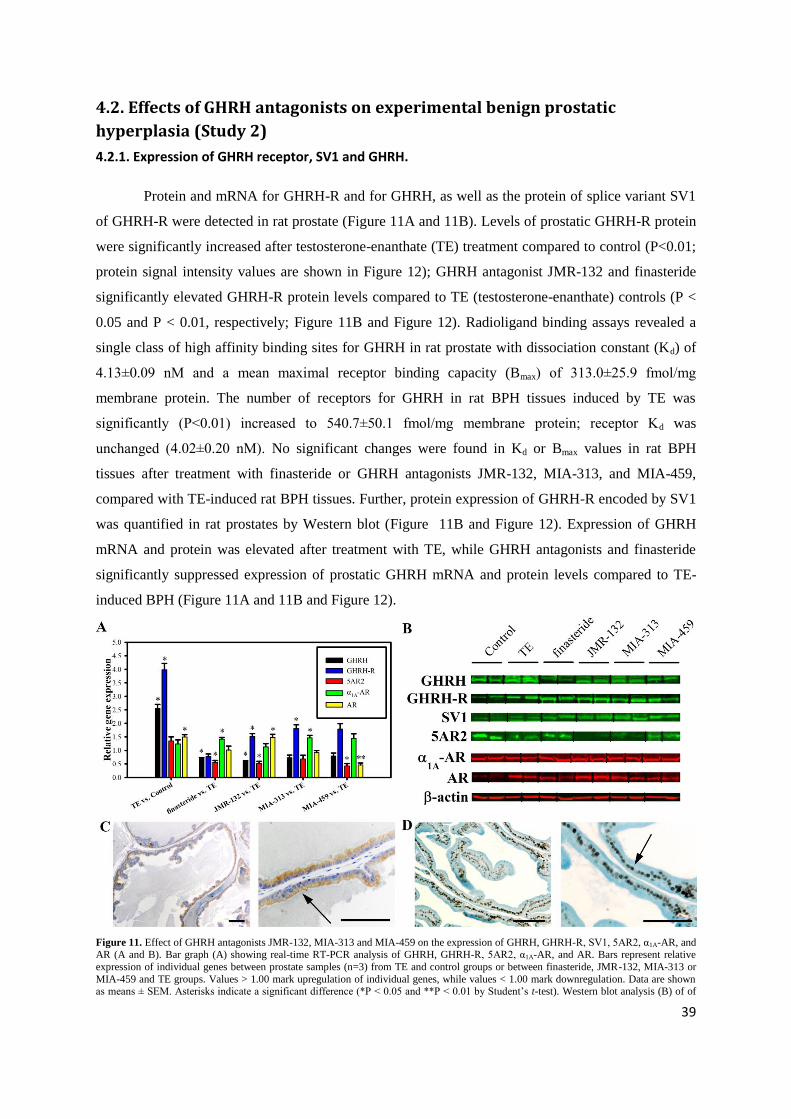
4.2.1. Expression of GHRH receptor, SV1 and GHRH.
Protein and mRNA for GHRH-R and for GHRH, as well as the protein of splice variant SV1
of GHRH-R were detected in rat prostate (Figure 11A and 11B). Levels of prostatic GHRH-R protein
were significantly increased after testosterone-enanthate (TE) treatment compared to control (P<0.01;
protein signal intensity values are shown in Figure 12); GHRH antagonist JMR-132 and finasteride
significantly elevated GHRH-R protein levels compared to TE (testosterone-enanthate) controls (P <
0.05 and P < 0.01, respectively; Figure 11B and Figure 12). Radioligand binding assays revealed a
single class of high affinity binding sites for GHRH in rat prostate with dissociation constant (Kd) of
4.13±0.09 nM and a mean maximal receptor binding capacity (Bmax) of 313.0±25.9 fmol/mg
membrane protein. The number of receptors for GHRH in rat BPH tissues induced by TE was
significantly (P<0.01) increased to 540.7±50.1 fmol/mg membrane protein; receptor Kd was
unchanged (4.02±0.20 nM). No significant changes were found in Kd or Bmax values in rat BPH
tissues after treatment with finasteride or GHRH antagonists JMR-132, MIA-313, and MIA-459,
compared with TE-induced rat BPH tissues. Further, protein expression of GHRH-R encoded by SV1
was quantified in rat prostates by Western blot (Figure 11B and Figure 12). Expression of GHRH
mRNA and protein was elevated after treatment with TE, while GHRH antagonists and finasteride
significantly suppressed expression of prostatic GHRH mRNA and protein levels compared to TE-
induced BPH (Figure 11A and 11B and Figure 12).
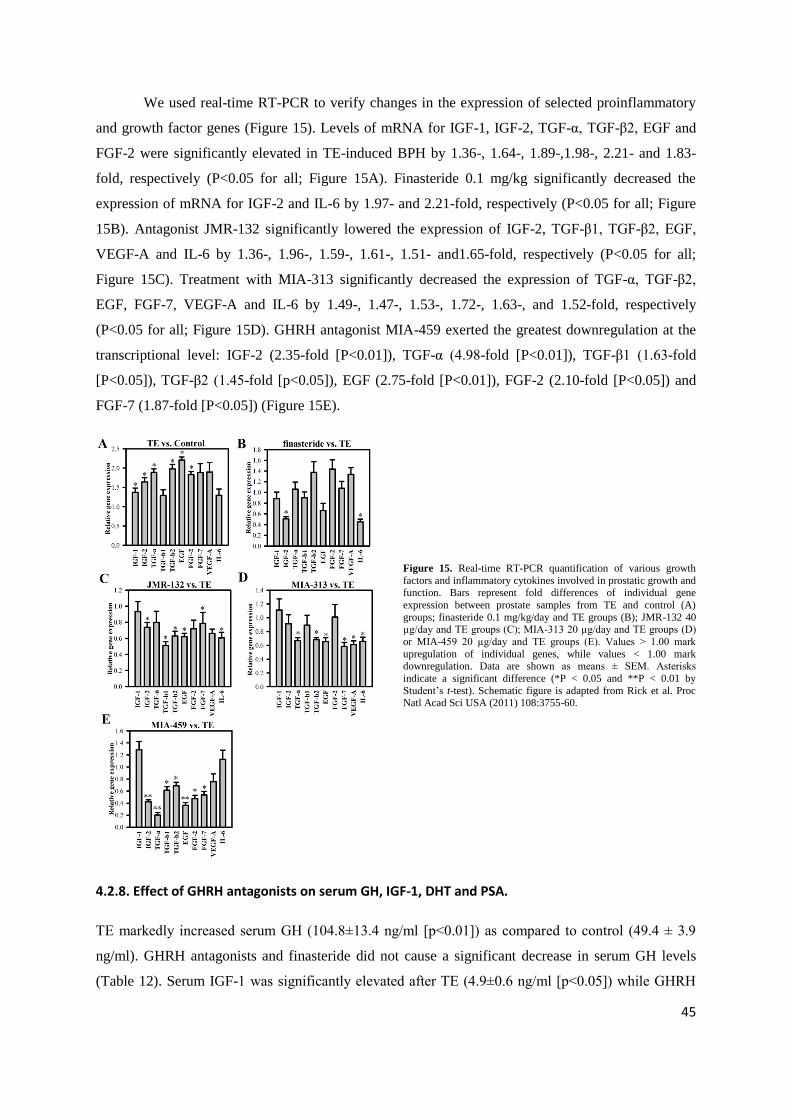
Figure 11. Effect of GHRH antagonists JMR-132, MIA-313 and MIA-459 on the expression of GHRH, GHRH-R, SV1, 5AR2, α1A-AR, and AR (A and B). Bar graph (A) showing real-time RT-PCR analysis of GHRH, GHRH-R, 5AR2, α1A-AR, and AR. Bars represent relative
expression of individual genes between prostate samples (n=3) from TE and control groups or between finasteride, JMR-132, MIA-313 or
MIA-459 and TE groups. Values > 1.00 mark upregulation of individual genes, while values < 1.00 mark downregulation. Data are shown as means ± SEM. Asterisks indicate a significant difference (*P < 0.05 and **P < 0.01 by Student‟s t-test). Western blot analysis (B) of of
40
GHRH, GHRH-R, SV1, 5AR2, α1A-AR, and AR. Representative blots of three independent experiments are presented and include internal
standard β-actin; corresponding signal intensity values are shown in Fig. S1A. Grouping of representative bands for each experimental
group was digitally performed. Expression of GHRH receptors(C) in representative ventral prostate of control rats was confined to the
cytoplasm and luminal membrane of prostatic acinar cells (Arrow). Localization of GHRH receptors are shown in 10X (Left) and 40X
(Right) magnification (Scale bars: 50µm). Androgen receptors (D) in representative ventral prostates of control rats were localized in the in the nuclei of prostatic acinar cells (Arrow), as shown by 20X (Left) and 40X (Right) magnification (Scale bars: 50µm). Schematic figure is
adapted from Rick et al. Proc Natl Acad Sci USA (2011) 108:3755-60.
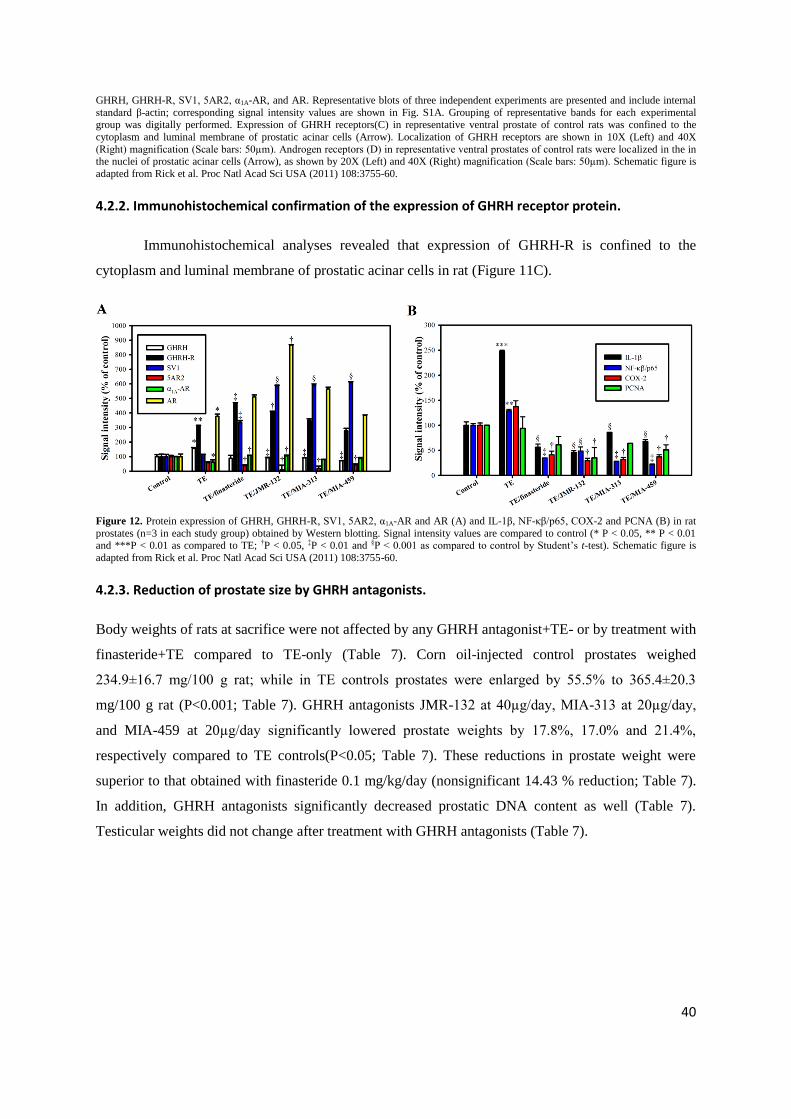
4.2.2. Immunohistochemical confirmation of the expression of GHRH receptor protein.
Immunohistochemical analyses revealed that expression of GHRH-R is confined to the
cytoplasm and luminal membrane of prostatic acinar cells in rat (Figure 11C).
Figure 12. Protein expression of GHRH, GHRH-R, SV1, 5AR2, α1A-AR and AR (A) and IL-1β, NF-κβ/p65, COX-2 and PCNA (B) in rat
prostates (n=3 in each study group) obtained by Western blotting. Signal intensity values are compared to control (* P < 0.05, ** P < 0.01 and ***P < 0.01 as compared to TE; †P < 0.05, ‡P < 0.01 and §P < 0.001 as compared to control by Student‟s t-test). Schematic figure is
adapted from Rick et al. Proc Natl Acad Sci USA (2011) 108:3755-60.
4.2.3. Reduction of prostate size by GHRH antagonists.
Body weights of rats at sacrifice were not affected by any GHRH antagonist+TE- or by treatment with
finasteride+TE compared to TE-only (Table 7). Corn oil-injected control prostates weighed
234.9±16.7 mg/100 g rat; while in TE controls prostates were enlarged by 55.5% to 365.4±20.3
mg/100 g rat (P<0.001; Table 7). GHRH antagonists JMR-132 at 40µg/day, MIA-313 at 20µg/day,
and MIA-459 at 20µg/day significantly lowered prostate weights by 17.8%, 17.0% and 21.4%,
respectively compared to TE controls(P<0.05; Table 7). These reductions in prostate weight were
superior to that obtained with finasteride 0.1 mg/kg/day (nonsignificant 14.43 % reduction; Table 7).
In addition, GHRH antagonists significantly decreased prostatic DNA content as well (Table 7).
Testicular weights did not change after treatment with GHRH antagonists (Table 7).
41
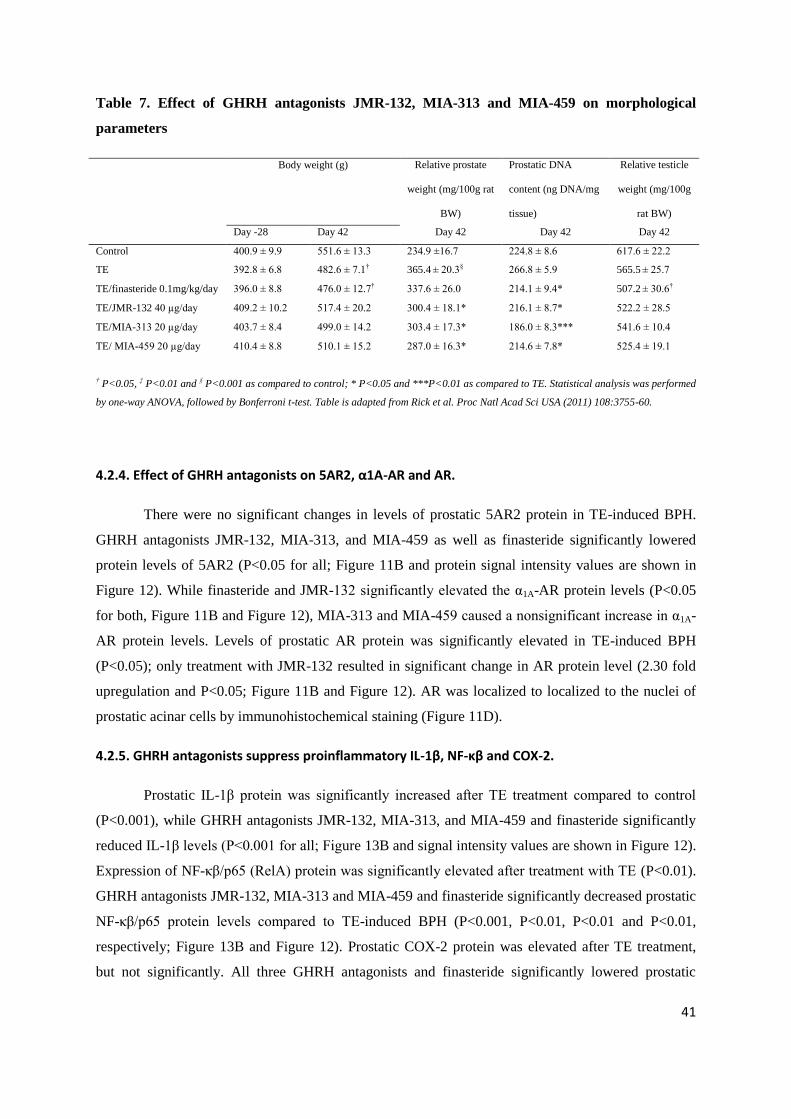
Table 7. Effect of GHRH antagonists JMR-132, MIA-313 and MIA-459 on morphological
† P<0.05, ‡ P<0.01 and § P<0.001 as compared to control; * P<0.05 and ***P<0.01 as compared to TE. Statistical analysis was performed
by one-way ANOVA, followed by Bonferroni t-test. Table is adapted from Rick et al. Proc Natl Acad Sci USA (2011) 108:3755-60.
4.2.4. Effect of GHRH antagonists on 5AR2, α1A-AR and AR.
There were no significant changes in levels of prostatic 5AR2 protein in TE-induced BPH.
GHRH antagonists JMR-132, MIA-313, and MIA-459 as well as finasteride significantly lowered
protein levels of 5AR2 (P<0.05 for all; Figure 11B and protein signal intensity values are shown in
Figure 12). While finasteride and JMR-132 significantly elevated the α1A-AR protein levels (P<0.05
for both, Figure 11B and Figure 12), MIA-313 and MIA-459 caused a nonsignificant increase in α1A-
AR protein levels. Levels of prostatic AR protein was significantly elevated in TE-induced BPH
(P<0.05); only treatment with JMR-132 resulted in significant change in AR protein level (2.30 fold
upregulation and P<0.05; Figure 11B and Figure 12). AR was localized to localized to the nuclei of
prostatic acinar cells by immunohistochemical staining (Figure 11D).
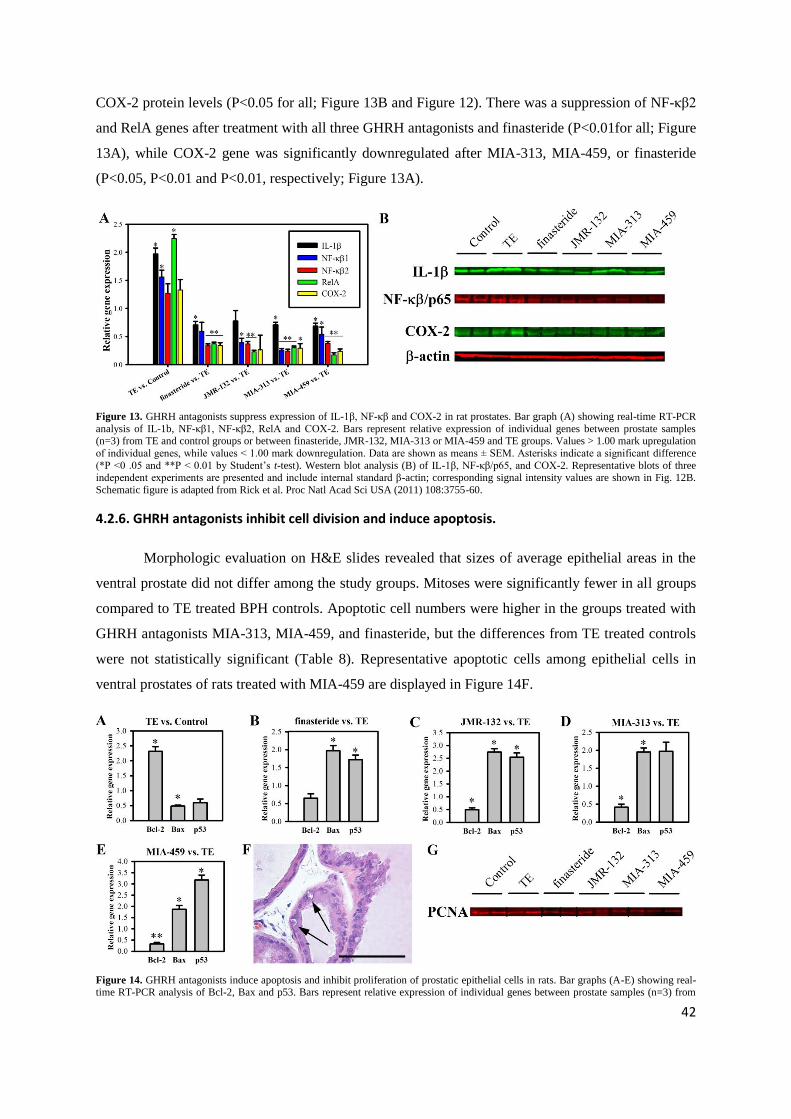
4.2.5. GHRH antagonists suppress proinflammatory IL-1β, NF-κβ and COX-2.
Prostatic IL-1β protein was significantly increased after TE treatment compared to control
(P<0.001), while GHRH antagonists JMR-132, MIA-313, and MIA-459 and finasteride significantly
reduced IL-1β levels (P<0.001 for all; Figure 13B and signal intensity values are shown in Figure 12).
Expression of NF-κβ/p65 (RelA) protein was significantly elevated after treatment with TE (P<0.01).
GHRH antagonists JMR-132, MIA-313 and MIA-459 and finasteride significantly decreased prostatic
NF-κβ/p65 protein levels compared to TE-induced BPH (P<0.001, P<0.01, P<0.01 and P<0.01,
respectively; Figure 13B and Figure 12). Prostatic COX-2 protein was elevated after TE treatment,
but not significantly. All three GHRH antagonists and finasteride significantly lowered prostatic
42
COX-2 protein levels (P<0.05 for all; Figure 13B and Figure 12). There was a suppression of NF-κβ2
and RelA genes after treatment with all three GHRH antagonists and finasteride (P<0.01for all; Figure
13A), while COX-2 gene was significantly downregulated after MIA-313, MIA-459, or finasteride
(P<0.05, P<0.01 and P<0.01, respectively; Figure 13A).
Figure 13. GHRH antagonists suppress expression of IL-1β, NF-κβ and COX-2 in rat prostates. Bar graph (A) showing real-time RT-PCR
analysis of IL-1b, NF-κβ1, NF-κβ2, RelA and COX-2. Bars represent relative expression of individual genes between prostate samples (n=3) from TE and control groups or between finasteride, JMR-132, MIA-313 or MIA-459 and TE groups. Values > 1.00 mark upregulation
of individual genes, while values < 1.00 mark downregulation. Data are shown as means ± SEM. Asterisks indicate a significant difference
(*P <0 .05 and **P < 0.01 by Student‟s t-test). Western blot analysis (B) of IL-1β, NF-κβ/p65, and COX-2. Representative blots of three independent experiments are presented and include internal standard β-actin; corresponding signal intensity values are shown in Fig. 12B.
Schematic figure is adapted from Rick et al. Proc Natl Acad Sci USA (2011) 108:3755-60.
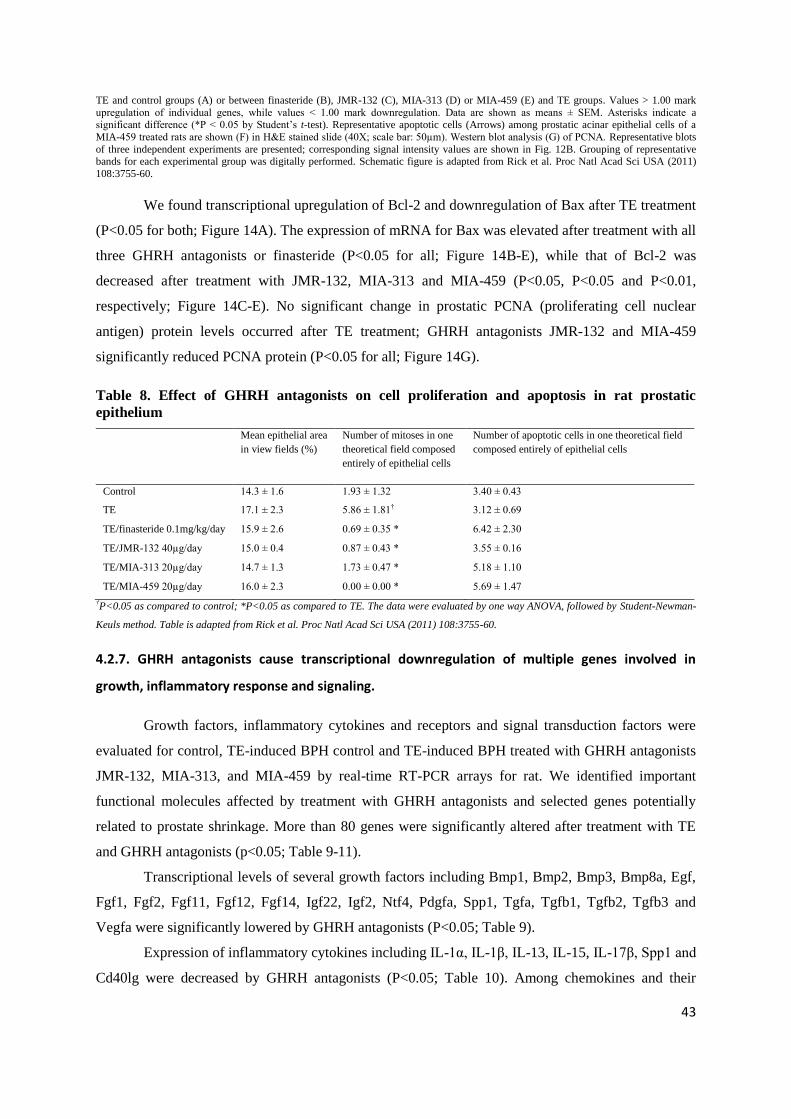
4.2.6. GHRH antagonists inhibit cell division and induce apoptosis.
Morphologic evaluation on H&E slides revealed that sizes of average epithelial areas in the
ventral prostate did not differ among the study groups. Mitoses were significantly fewer in all groups
compared to TE treated BPH controls. Apoptotic cell numbers were higher in the groups treated with
GHRH antagonists MIA-313, MIA-459, and finasteride, but the differences from TE treated controls
were not statistically significant (Table 8). Representative apoptotic cells among epithelial cells in
ventral prostates of rats treated with MIA-459 are displayed in Figure 14F.
Figure 14. GHRH antagonists induce apoptosis and inhibit proliferation of prostatic epithelial cells in rats. Bar graphs (A-E) showing real-time RT-PCR analysis of Bcl-2, Bax and p53. Bars represent relative expression of individual genes between prostate samples (n=3) from
43
TE and control groups (A) or between finasteride (B), JMR-132 (C), MIA-313 (D) or MIA-459 (E) and TE groups. Values > 1.00 mark
upregulation of individual genes, while values < 1.00 mark downregulation. Data are shown as means ± SEM. Asterisks indicate a
significant difference (*P < 0.05 by Student‟s t-test). Representative apoptotic cells (Arrows) among prostatic acinar epithelial cells of a
MIA-459 treated rats are shown (F) in H&E stained slide (40X; scale bar: 50µm). Western blot analysis (G) of PCNA. Representative blots
of three independent experiments are presented; corresponding signal intensity values are shown in Fig. 12B. Grouping of representative bands for each experimental group was digitally performed. Schematic figure is adapted from Rick et al. Proc Natl Acad Sci USA (2011)
108:3755-60.
We found transcriptional upregulation of Bcl-2 and downregulation of Bax after TE treatment
(P<0.05 for both; Figure 14A). The expression of mRNA for Bax was elevated after treatment with all
three GHRH antagonists or finasteride (P<0.05 for all; Figure 14B-E), while that of Bcl-2 was
decreased after treatment with JMR-132, MIA-313 and MIA-459 (P<0.05, P<0.05 and P<0.01,
respectively; Figure 14C-E). No significant change in prostatic PCNA (proliferating cell nuclear
antigen) protein levels occurred after TE treatment; GHRH antagonists JMR-132 and MIA-459
significantly reduced PCNA protein (P<0.05 for all; Figure 14G).
Table 8. Effect of GHRH antagonists on cell proliferation and apoptosis in rat prostatic
epithelium
Mean epithelial area
in view fields (%)
Number of mitoses in one
theoretical field composed
entirely of epithelial cells
Number of apoptotic cells in one theoretical field
39.0 ± 3.6 79.2 ± 10.4 2.9 ± 0.3 3.9 ± 0.3 37.5 ± 4.6 249.8 ± 28.4 2.3 ± 0.2 4.2 ± 0.3 †P<0.05, ‡P<0.01 and §P<0.001 as compared to Control; **P<0.01 as compared to TE. The data were evaluated by two-tailed Student's t-
test. Table is adapted from Rick et al. Proc Natl Acad Sci USA (2011) 108:3755-60.
49
4.3. Effects of combination of antagonist of LHRH with antagonist of GHRH
on experimental benign prostatic hyperplasia (Study 3).
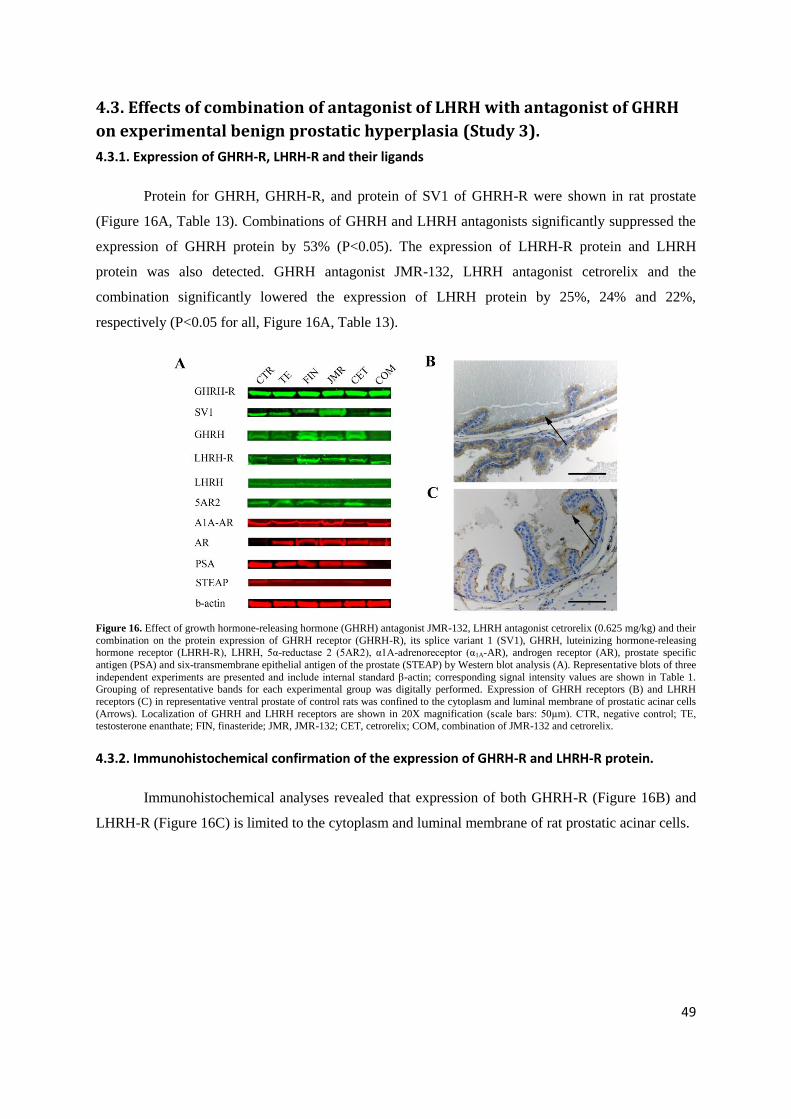
4.3.1. Expression of GHRH-R, LHRH-R and their ligands
Protein for GHRH, GHRH-R, and protein of SV1 of GHRH-R were shown in rat prostate
(Figure 16A, Table 13). Combinations of GHRH and LHRH antagonists significantly suppressed the
expression of GHRH protein by 53% (P<0.05). The expression of LHRH-R protein and LHRH
protein was also detected. GHRH antagonist JMR-132, LHRH antagonist cetrorelix and the
combination significantly lowered the expression of LHRH protein by 25%, 24% and 22%,
respectively (P<0.05 for all, Figure 16A, Table 13).
Figure 16. Effect of growth hormone-releasing hormone (GHRH) antagonist JMR-132, LHRH antagonist cetrorelix (0.625 mg/kg) and their
combination on the protein expression of GHRH receptor (GHRH-R), its splice variant 1 (SV1), GHRH, luteinizing hormone-releasing hormone receptor (LHRH-R), LHRH, 5α-reductase 2 (5AR2), α1A-adrenoreceptor (α1A-AR), androgen receptor (AR), prostate specific
antigen (PSA) and six-transmembrane epithelial antigen of the prostate (STEAP) by Western blot analysis (A). Representative blots of three
independent experiments are presented and include internal standard β-actin; corresponding signal intensity values are shown in Table 1. Grouping of representative bands for each experimental group was digitally performed. Expression of GHRH receptors (B) and LHRH
receptors (C) in representative ventral prostate of control rats was confined to the cytoplasm and luminal membrane of prostatic acinar cells
(Arrows). Localization of GHRH and LHRH receptors are shown in 20X magnification (scale bars: 50µm). CTR, negative control; TE, testosterone enanthate; FIN, finasteride; JMR, JMR-132; CET, cetrorelix; COM, combination of JMR-132 and cetrorelix.
4.3.2. Immunohistochemical confirmation of the expression of GHRH-R and LHRH-R protein.
Immunohistochemical analyses revealed that expression of both GHRH-R (Figure 16B) and
LHRH-R (Figure 16C) is limited to the cytoplasm and luminal membrane of rat prostatic acinar cells.
50
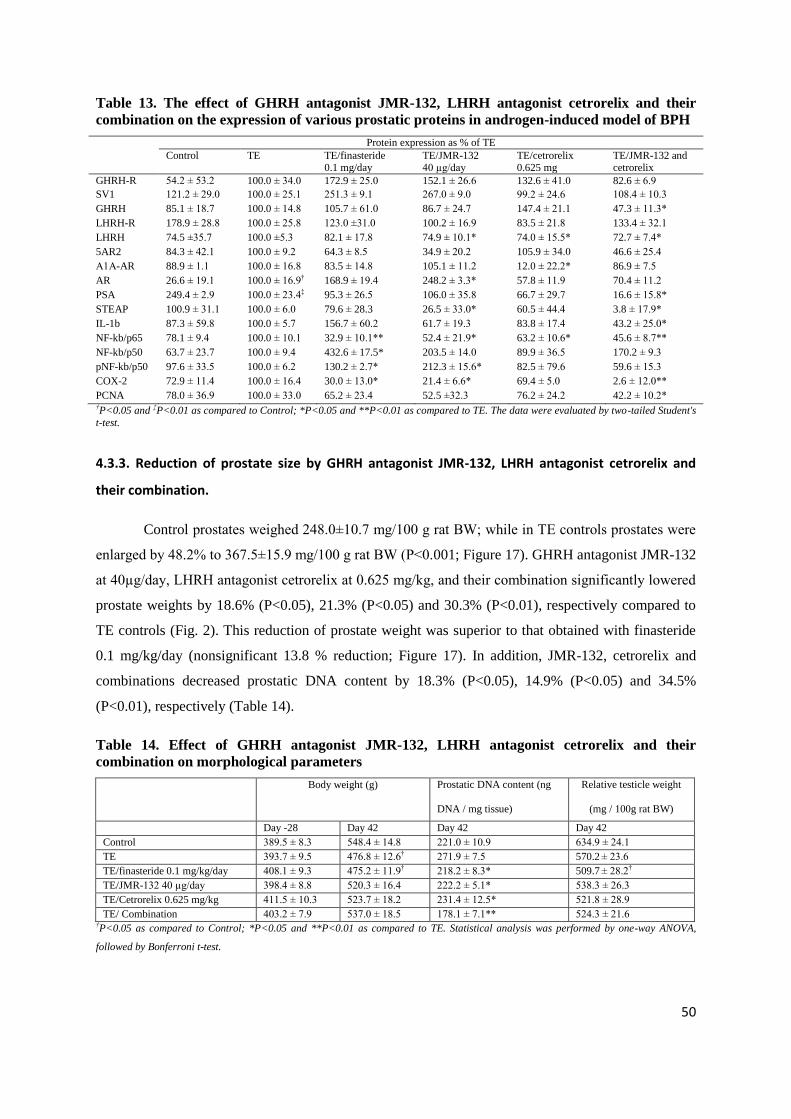
Table 13. The effect of GHRH antagonist JMR-132, LHRH antagonist cetrorelix and their
combination on the expression of various prostatic proteins in androgen-induced model of BPH
PCNA 78.0 ± 36.9 100.0 ± 33.0 65.2 ± 23.4 52.5 ±32.3 76.2 ± 24.2 42.2 ± 10.2* †P<0.05 and ‡P<0.01 as compared to Control; *P<0.05 and **P<0.01 as compared to TE. The data were evaluated by two-tailed Student's
t-test.
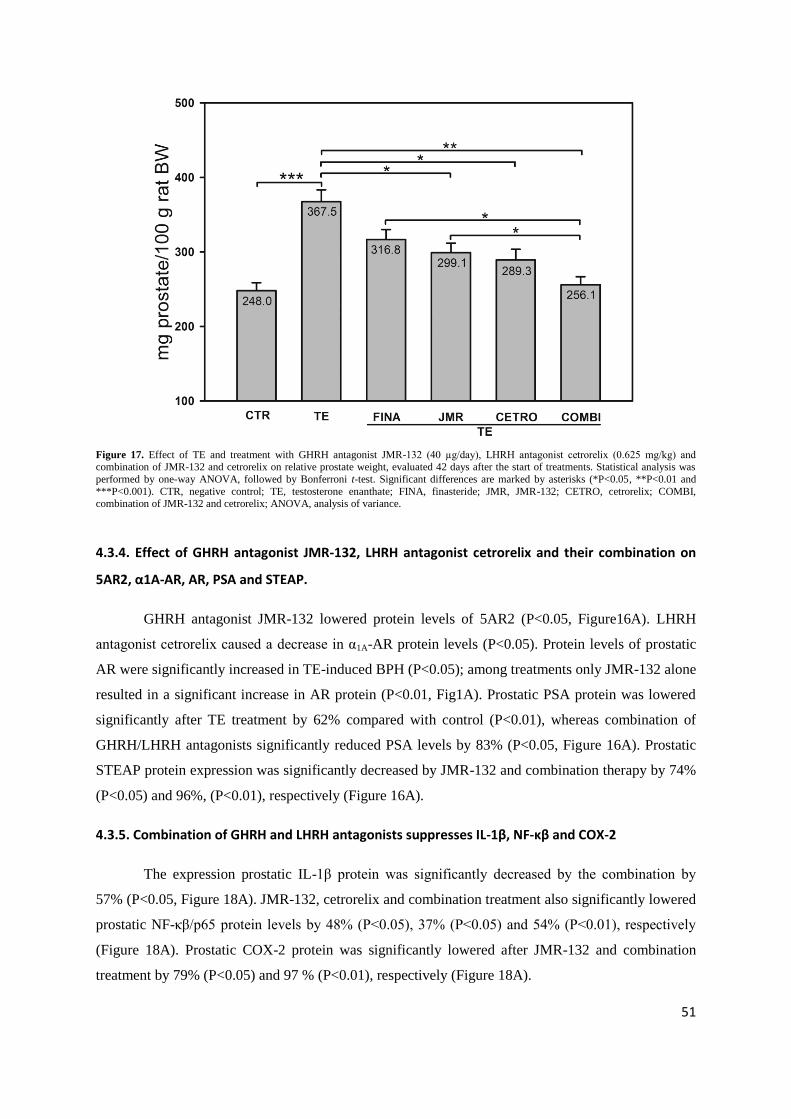
4.3.3. Reduction of prostate size by GHRH antagonist JMR-132, LHRH antagonist cetrorelix and
their combination.
Control prostates weighed 248.0±10.7 mg/100 g rat BW; while in TE controls prostates were
enlarged by 48.2% to 367.5±15.9 mg/100 g rat BW (P<0.001; Figure 17). GHRH antagonist JMR-132
at 40µg/day, LHRH antagonist cetrorelix at 0.625 mg/kg, and their combination significantly lowered
prostate weights by 18.6% (P<0.05), 21.3% (P<0.05) and 30.3% (P<0.01), respectively compared to
TE controls (Fig. 2). This reduction of prostate weight was superior to that obtained with finasteride
0.1 mg/kg/day (nonsignificant 13.8 % reduction; Figure 17). In addition, JMR-132, cetrorelix and
combinations decreased prostatic DNA content by 18.3% (P<0.05), 14.9% (P<0.05) and 34.5%
(P<0.01), respectively (Table 14).
Table 14. Effect of GHRH antagonist JMR-132, LHRH antagonist cetrorelix and their
TE/ Combination 403.2 ± 7.9 537.0 ± 18.5 178.1 ± 7.1** 524.3 ± 21.6 †P<0.05 as compared to Control; *P<0.05 and **P<0.01 as compared to TE. Statistical analysis was performed by one-way ANOVA,
followed by Bonferroni t-test.
51
Figure 17. Effect of TE and treatment with GHRH antagonist JMR-132 (40 µg/day), LHRH antagonist cetrorelix (0.625 mg/kg) and combination of JMR-132 and cetrorelix on relative prostate weight, evaluated 42 days after the start of treatments. Statistical analysis was
performed by one-way ANOVA, followed by Bonferroni t-test. Significant differences are marked by asterisks (*P<0.05, **P<0.01 and
***P<0.001). CTR, negative control; TE, testosterone enanthate; FINA, finasteride; JMR, JMR-132; CETRO, cetrorelix; COMBI, combination of JMR-132 and cetrorelix; ANOVA, analysis of variance.
4.3.4. Effect of GHRH antagonist JMR-132, LHRH antagonist cetrorelix and their combination on
5AR2, α1A-AR, AR, PSA and STEAP.
GHRH antagonist JMR-132 lowered protein levels of 5AR2 (P<0.05, Figure16A). LHRH
antagonist cetrorelix caused a decrease in α1A-AR protein levels (P<0.05). Protein levels of prostatic
AR were significantly increased in TE-induced BPH (P<0.05); among treatments only JMR-132 alone
resulted in a significant increase in AR protein (P<0.01, Fig1A). Prostatic PSA protein was lowered
significantly after TE treatment by 62% compared with control (P<0.01), whereas combination of
STEAP protein expression was significantly decreased by JMR-132 and combination therapy by 74%
(P<0.05) and 96%, (P<0.01), respectively (Figure 16A).
4.3.5. Combination of GHRH and LHRH antagonists suppresses IL-1β, NF-κβ and COX-2
The expression prostatic IL-1β protein was significantly decreased by the combination by
57% (P<0.05, Figure 18A). JMR-132, cetrorelix and combination treatment also significantly lowered
prostatic NF-κβ/p65 protein levels by 48% (P<0.05), 37% (P<0.05) and 54% (P<0.01), respectively
(Figure 18A). Prostatic COX-2 protein was significantly lowered after JMR-132 and combination
treatment by 79% (P<0.05) and 97 % (P<0.01), respectively (Figure 18A).
52
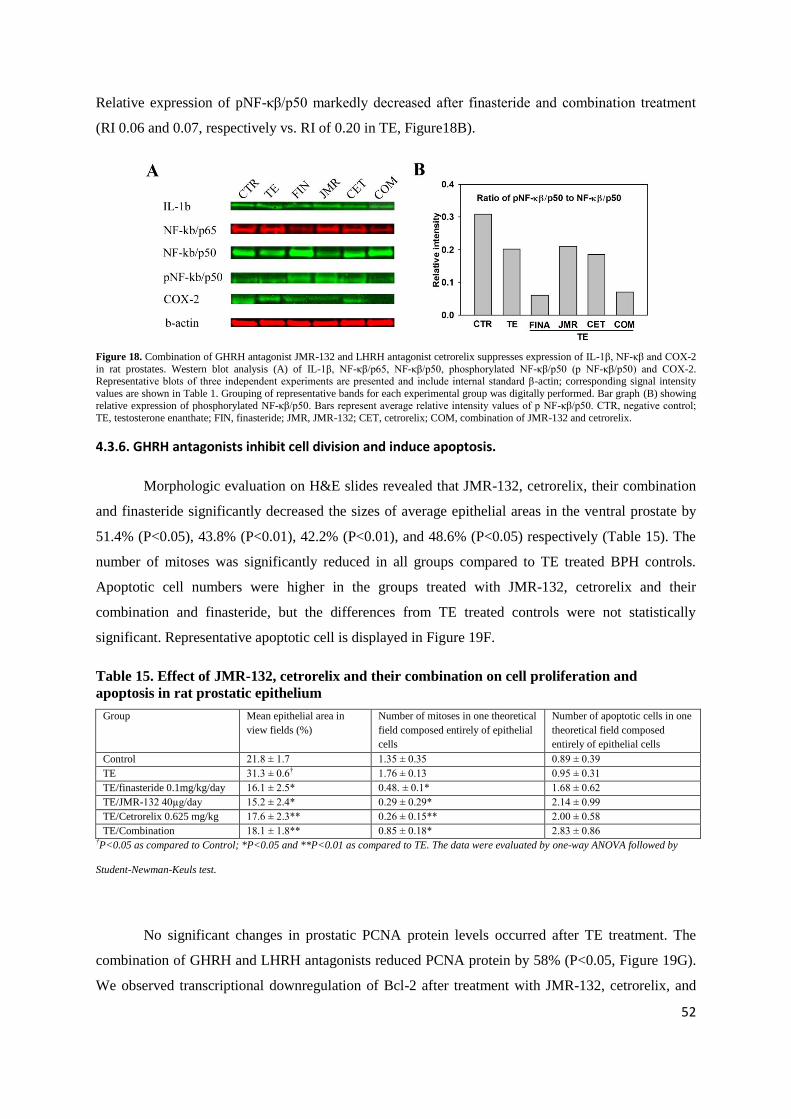
Relative expression of pNF-κβ/p50 markedly decreased after finasteride and combination treatment
(RI 0.06 and 0.07, respectively vs. RI of 0.20 in TE, Figure18B).
Figure 18. Combination of GHRH antagonist JMR-132 and LHRH antagonist cetrorelix suppresses expression of IL-1β, NF-κβ and COX-2
in rat prostates. Western blot analysis (A) of IL-1β, NF-κβ/p65, NF-κβ/p50, phosphorylated NF-κβ/p50 (p NF-κβ/p50) and COX-2. Representative blots of three independent experiments are presented and include internal standard β-actin; corresponding signal intensity
values are shown in Table 1. Grouping of representative bands for each experimental group was digitally performed. Bar graph (B) showing relative expression of phosphorylated NF-κβ/p50. Bars represent average relative intensity values of p NF-κβ/p50. CTR, negative control;
TE, testosterone enanthate; FIN, finasteride; JMR, JMR-132; CET, cetrorelix; COM, combination of JMR-132 and cetrorelix.
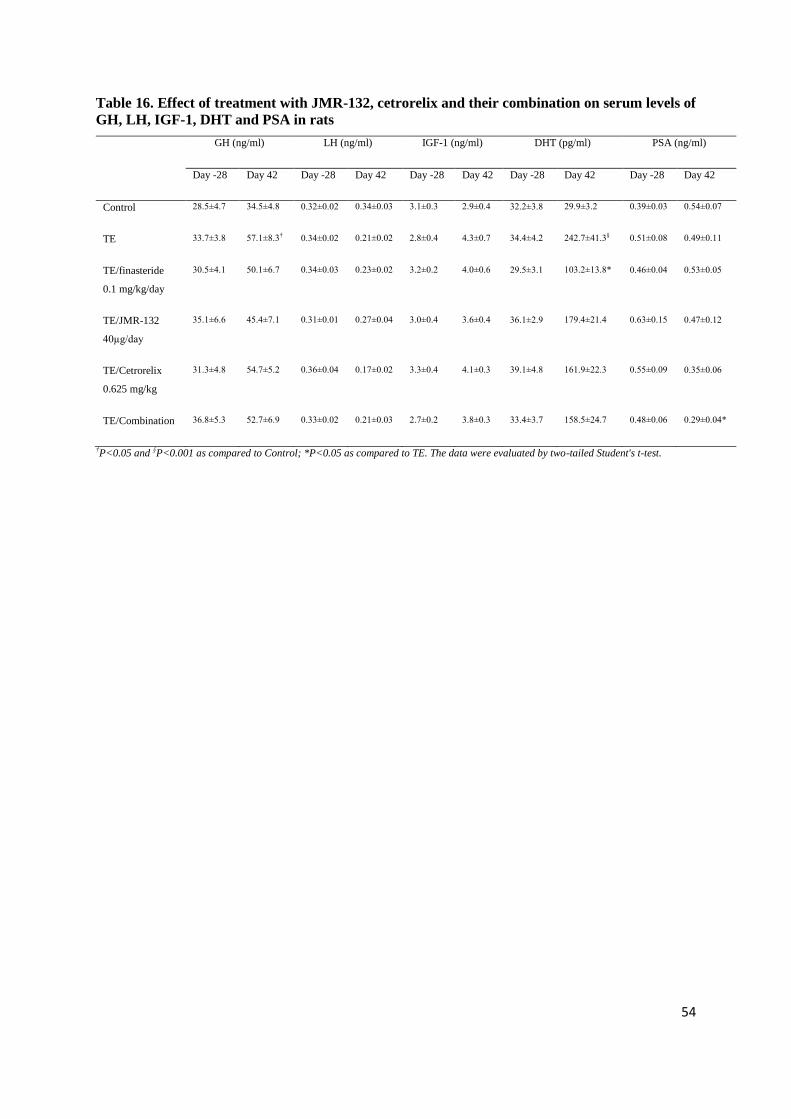
4.3.6. GHRH antagonists inhibit cell division and induce apoptosis.
Morphologic evaluation on H&E slides revealed that JMR-132, cetrorelix, their combination
and finasteride significantly decreased the sizes of average epithelial areas in the ventral prostate by
51.4% (P<0.05), 43.8% (P<0.01), 42.2% (P<0.01), and 48.6% (P<0.05) respectively (Table 15). The
number of mitoses was significantly reduced in all groups compared to TE treated BPH controls.
Apoptotic cell numbers were higher in the groups treated with JMR-132, cetrorelix and their
combination and finasteride, but the differences from TE treated controls were not statistically
significant. Representative apoptotic cell is displayed in Figure 19F.
Table 15. Effect of JMR-132, cetrorelix and their combination on cell proliferation and
TE/Combination 18.1 ± 1.8** 0.85 ± 0.18* 2.83 ± 0.86 †P<0.05 as compared to Control; *P<0.05 and **P<0.01 as compared to TE. The data were evaluated by one-way ANOVA followed by
Student-Newman-Keuls test.
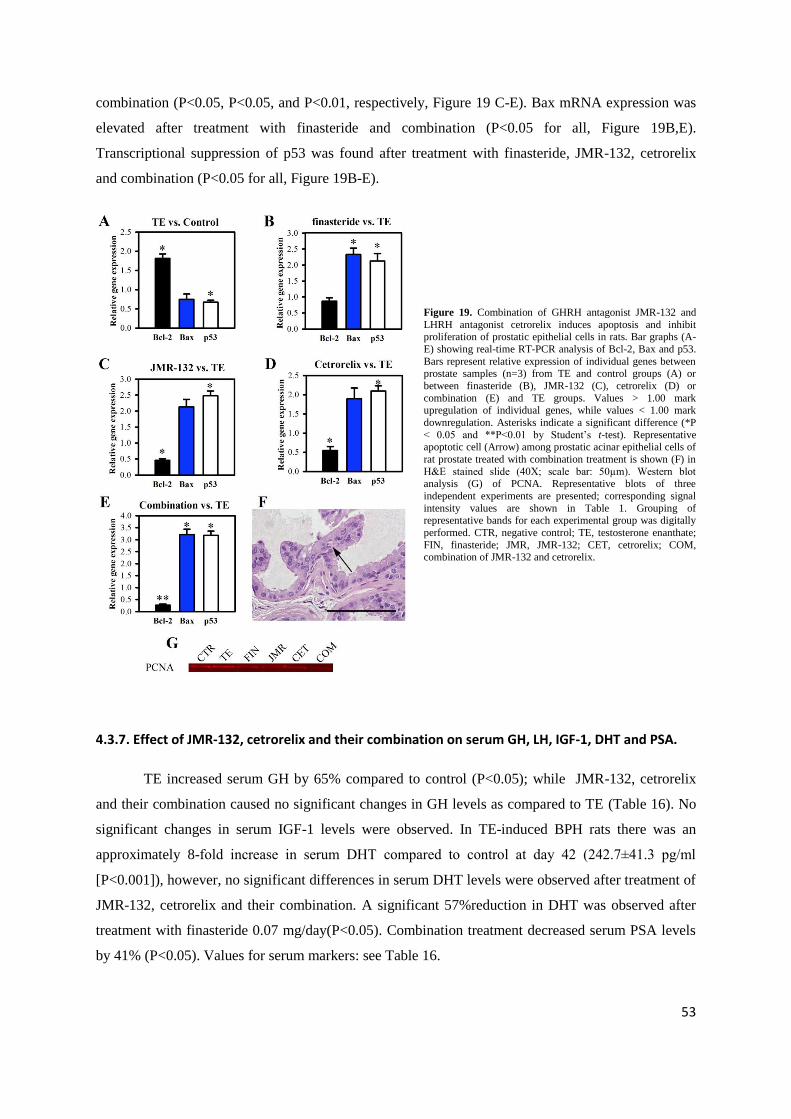
No significant changes in prostatic PCNA protein levels occurred after TE treatment. The
combination of GHRH and LHRH antagonists reduced PCNA protein by 58% (P<0.05, Figure 19G).
We observed transcriptional downregulation of Bcl-2 after treatment with JMR-132, cetrorelix, and
53
combination (P<0.05, P<0.05, and P<0.01, respectively, Figure 19 C-E). Bax mRNA expression was
elevated after treatment with finasteride and combination (P<0.05 for all, Figure 19B,E).
Transcriptional suppression of p53 was found after treatment with finasteride, JMR-132, cetrorelix
and combination (P<0.05 for all, Figure 19B-E).
Figure 19. Combination of GHRH antagonist JMR-132 and
LHRH antagonist cetrorelix induces apoptosis and inhibit proliferation of prostatic epithelial cells in rats. Bar graphs (A-
E) showing real-time RT-PCR analysis of Bcl-2, Bax and p53.
Bars represent relative expression of individual genes between prostate samples (n=3) from TE and control groups (A) or
between finasteride (B), JMR-132 (C), cetrorelix (D) or
combination (E) and TE groups. Values > 1.00 mark upregulation of individual genes, while values < 1.00 mark
downregulation. Asterisks indicate a significant difference (*P
< 0.05 and **P<0.01 by Student‟s t-test). Representative apoptotic cell (Arrow) among prostatic acinar epithelial cells of
rat prostate treated with combination treatment is shown (F) in
H&E stained slide (40X; scale bar: 50µm). Western blot analysis (G) of PCNA. Representative blots of three
independent experiments are presented; corresponding signal
intensity values are shown in Table 1. Grouping of representative bands for each experimental group was digitally
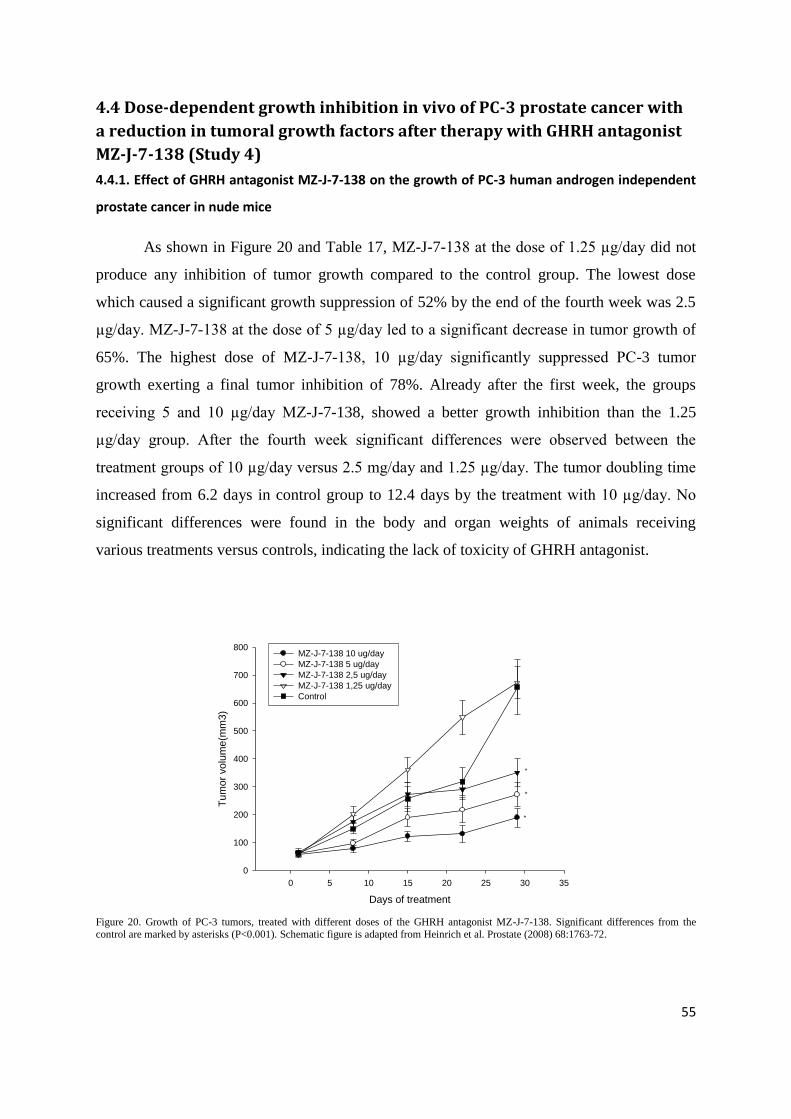
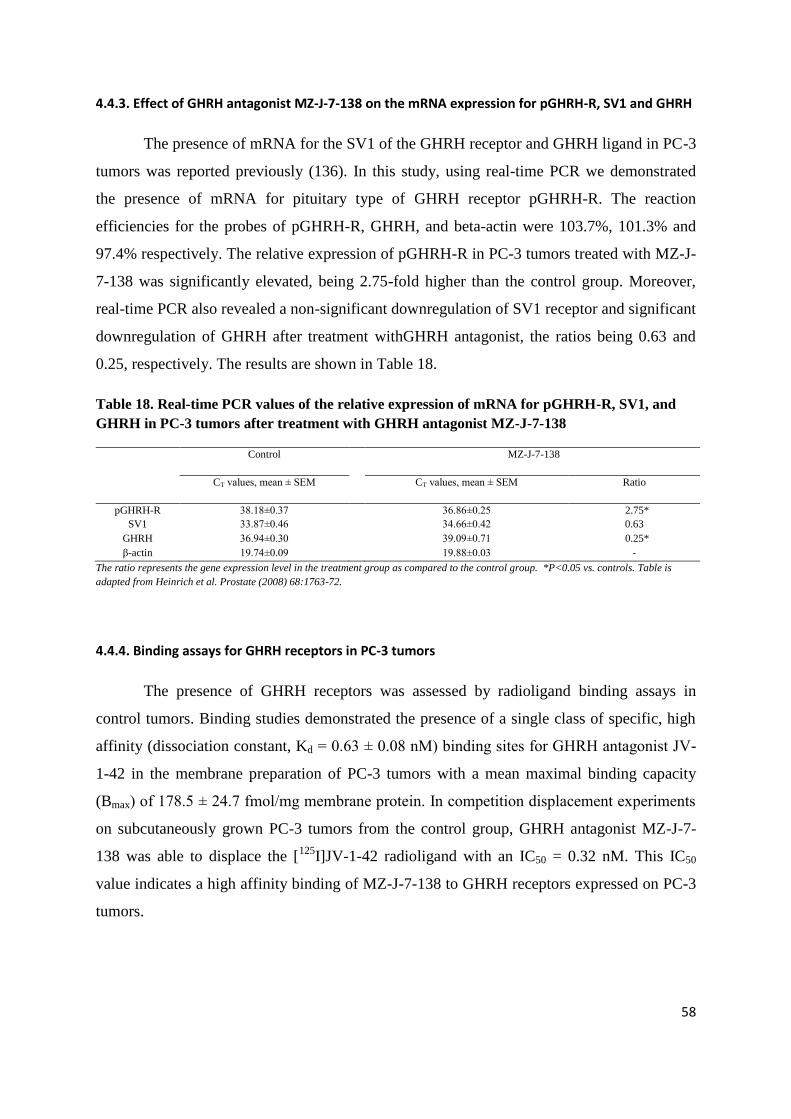
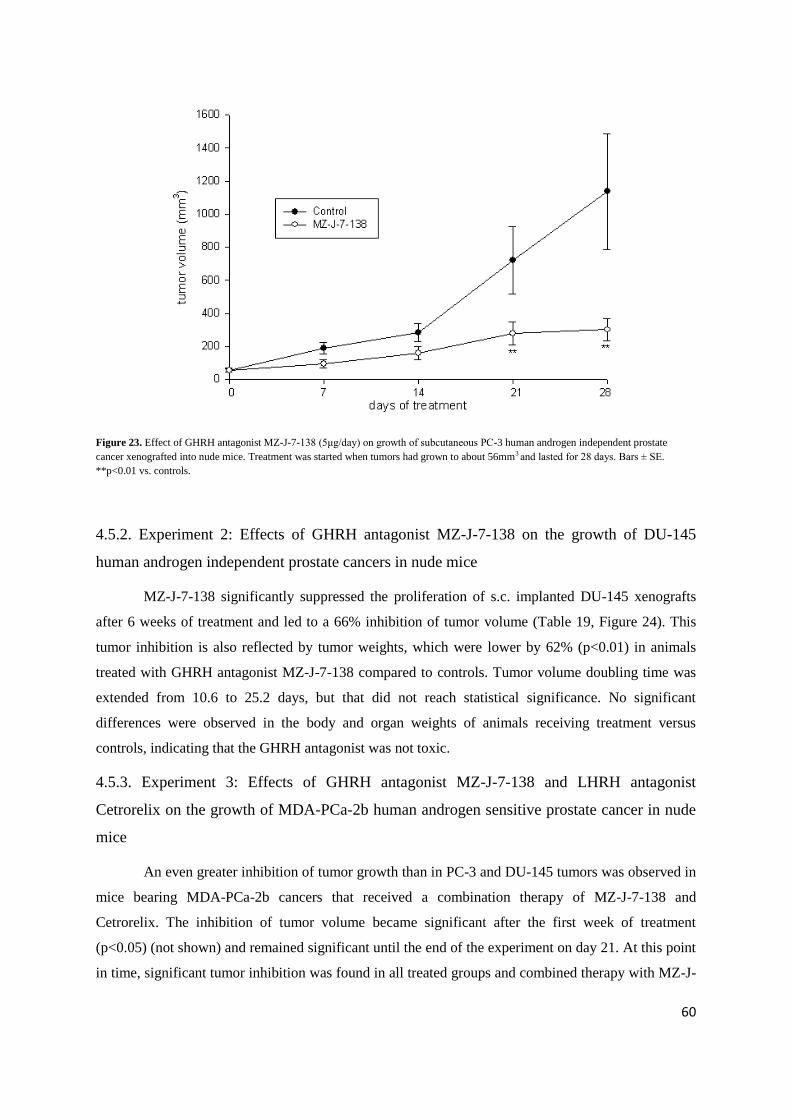
Figure 23. Effect of GHRH antagonist MZ-J-7-138 (5μg/day) on growth of subcutaneous PC-3 human androgen independent prostate
cancer xenografted into nude mice. Treatment was started when tumors had grown to about 56mm3 and lasted for 28 days. Bars ± SE.
**p<0.01 vs. controls.
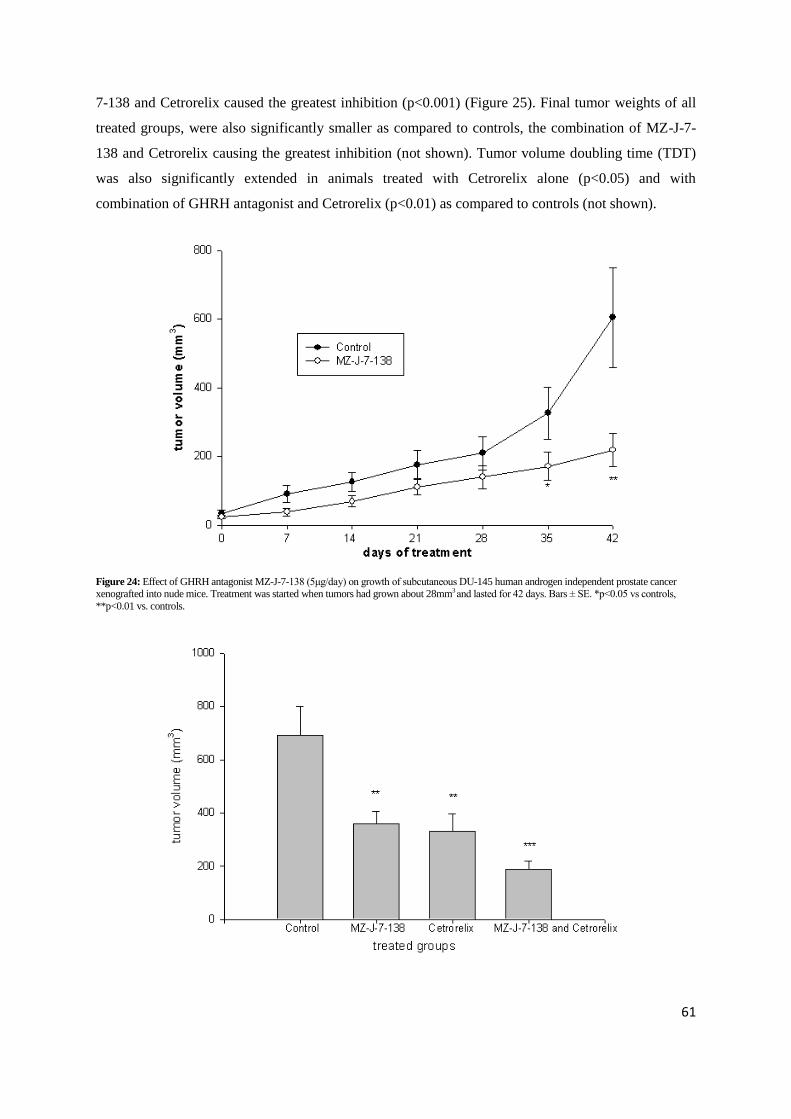
4.5.2. Experiment 2: Effects of GHRH antagonist MZ-J-7-138 on the growth of DU-145
human androgen independent prostate cancers in nude mice
MZ-J-7-138 significantly suppressed the proliferation of s.c. implanted DU-145 xenografts
after 6 weeks of treatment and led to a 66% inhibition of tumor volume (Table 19, Figure 24). This
tumor inhibition is also reflected by tumor weights, which were lower by 62% (p<0.01) in animals
treated with GHRH antagonist MZ-J-7-138 compared to controls. Tumor volume doubling time was
extended from 10.6 to 25.2 days, but that did not reach statistical significance. No significant
differences were observed in the body and organ weights of animals receiving treatment versus
controls, indicating that the GHRH antagonist was not toxic.
4.5.3. Experiment 3: Effects of GHRH antagonist MZ-J-7-138 and LHRH antagonist
Cetrorelix on the growth of MDA-PCa-2b human androgen sensitive prostate cancer in nude
mice
An even greater inhibition of tumor growth than in PC-3 and DU-145 tumors was observed in
mice bearing MDA-PCa-2b cancers that received a combination therapy of MZ-J-7-138 and
Cetrorelix. The inhibition of tumor volume became significant after the first week of treatment
(p<0.05) (not shown) and remained significant until the end of the experiment on day 21. At this point
in time, significant tumor inhibition was found in all treated groups and combined therapy with MZ-J-
61
7-138 and Cetrorelix caused the greatest inhibition (p<0.001) (Figure 25). Final tumor weights of all
treated groups, were also significantly smaller as compared to controls, the combination of MZ-J-7-
138 and Cetrorelix causing the greatest inhibition (not shown). Tumor volume doubling time (TDT)
was also significantly extended in animals treated with Cetrorelix alone (p<0.05) and with
combination of GHRH antagonist and Cetrorelix (p<0.01) as compared to controls (not shown).
Figure 24: Effect of GHRH antagonist MZ-J-7-138 (5μg/day) on growth of subcutaneous DU-145 human androgen independent prostate cancer xenografted into nude mice. Treatment was started when tumors had grown about 28mm3 and lasted for 42 days. Bars ± SE. *p<0.05 vs controls,
**p<0.01 vs. controls.
62
Figure 25: Effect of GHRH antagonist MZ-J-7-138 (5μg/day) s.c , Cetrorelix (100μg/day) and the combination of MZ-J-7-138 (5μg/day) and
Cetrorelix (100μg/day) on the growth of subcutaneous MDA-Pca-2b human androgen sensitive prostate cancers in nude mice. Treatment was started
when tumors had grown about 76mm3 and lasted for 21 days. Bars ± SE. **p<0.01 vs. controls. ***p<0.001 vs controls.
Weights of prostates, seminal vesicles and testicles of animals that received Cetrorelix were
significantly lower compared to contols, indicating the androgen deprivation effect of Cetrorelix. No
significant differences were observed in the body weights or other organ weights of animals receiving
various treatments compared to controls, indicating that none of our compounds was toxic.
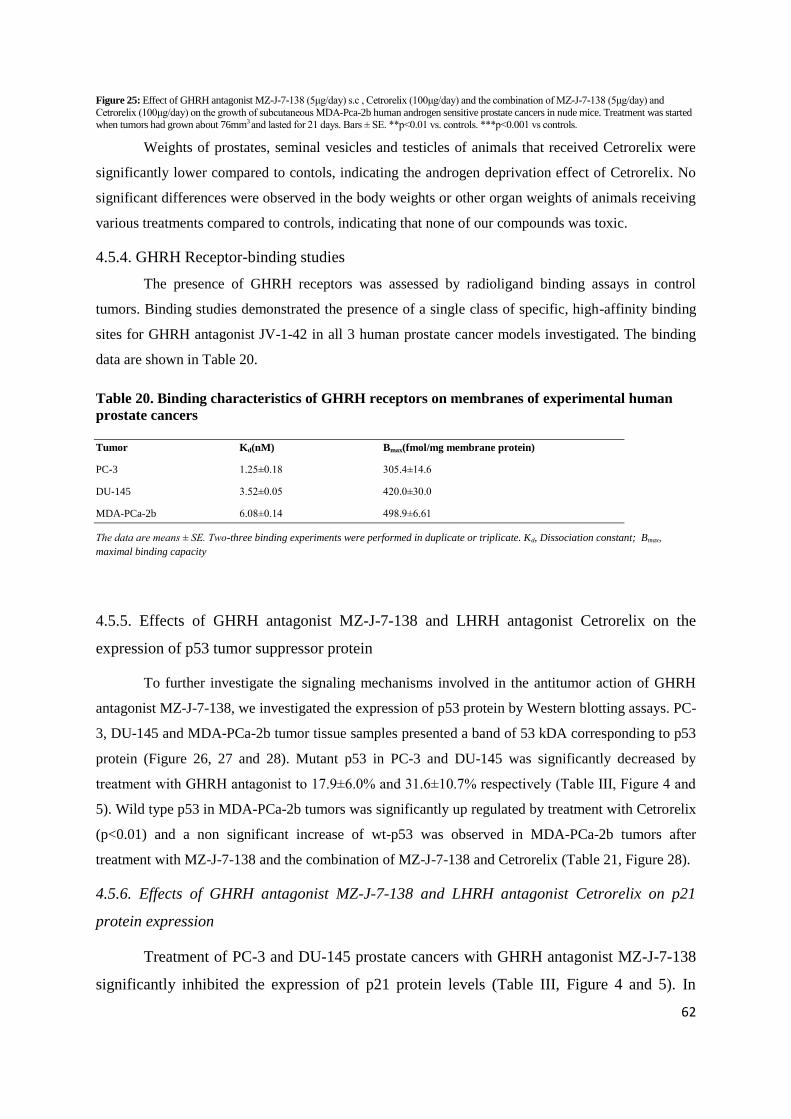
4.5.4. GHRH Receptor-binding studies
The presence of GHRH receptors was assessed by radioligand binding assays in control
tumors. Binding studies demonstrated the presence of a single class of specific, high-affinity binding
sites for GHRH antagonist JV-1-42 in all 3 human prostate cancer models investigated. The binding
data are shown in Table 20.
Table 20. Binding characteristics of GHRH receptors on membranes of experimental human
prostate cancers
Tumor Kd(nM) Bmax(fmol/mg membrane protein)
PC-3 1.25±0.18 305.4±14.6
DU-145 3.52±0.05 420.0±30.0
MDA-PCa-2b 6.08±0.14 498.9±6.61
The data are means ± SE. Two-three binding experiments were performed in duplicate or triplicate. Kd, Dissociation constant; Bmax,
maximal binding capacity
4.5.5. Effects of GHRH antagonist MZ-J-7-138 and LHRH antagonist Cetrorelix on the
expression of p53 tumor suppressor protein
To further investigate the signaling mechanisms involved in the antitumor action of GHRH
antagonist MZ-J-7-138, we investigated the expression of p53 protein by Western blotting assays. PC-
3, DU-145 and MDA-PCa-2b tumor tissue samples presented a band of 53 kDA corresponding to p53
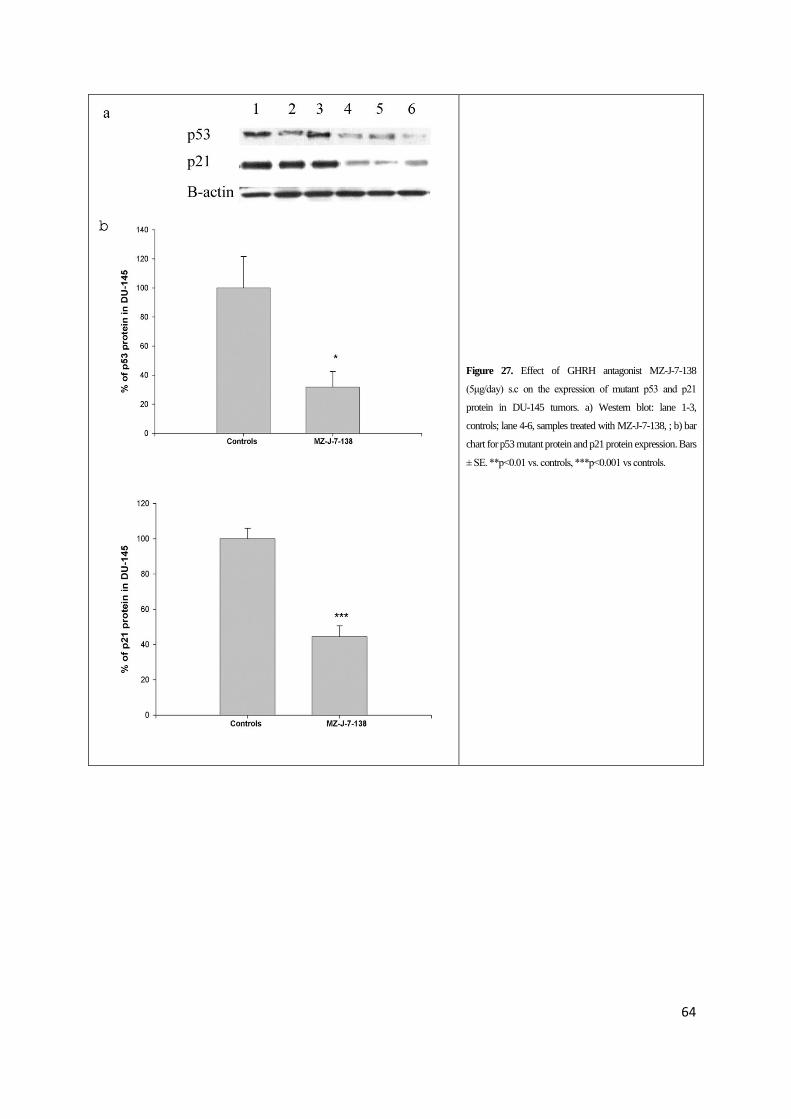
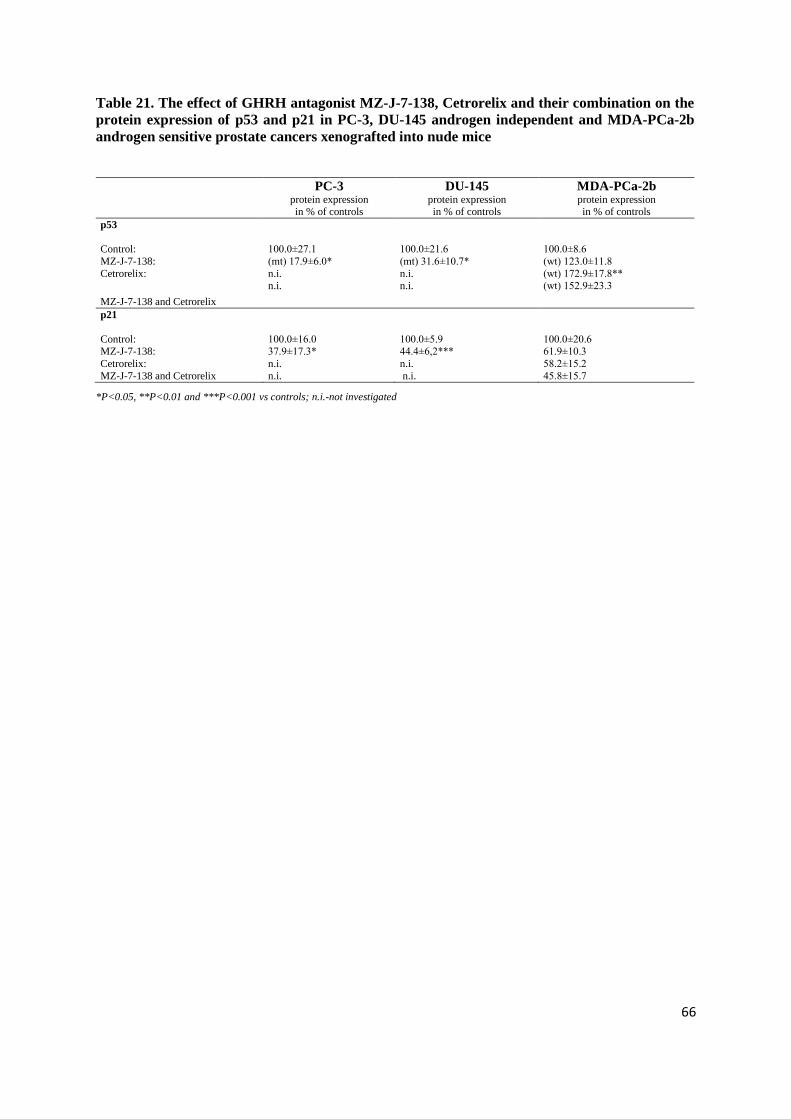
protein (Figure 26, 27 and 28). Mutant p53 in PC-3 and DU-145 was significantly decreased by
treatment with GHRH antagonist to 17.9±6.0% and 31.6±10.7% respectively (Table III, Figure 4 and
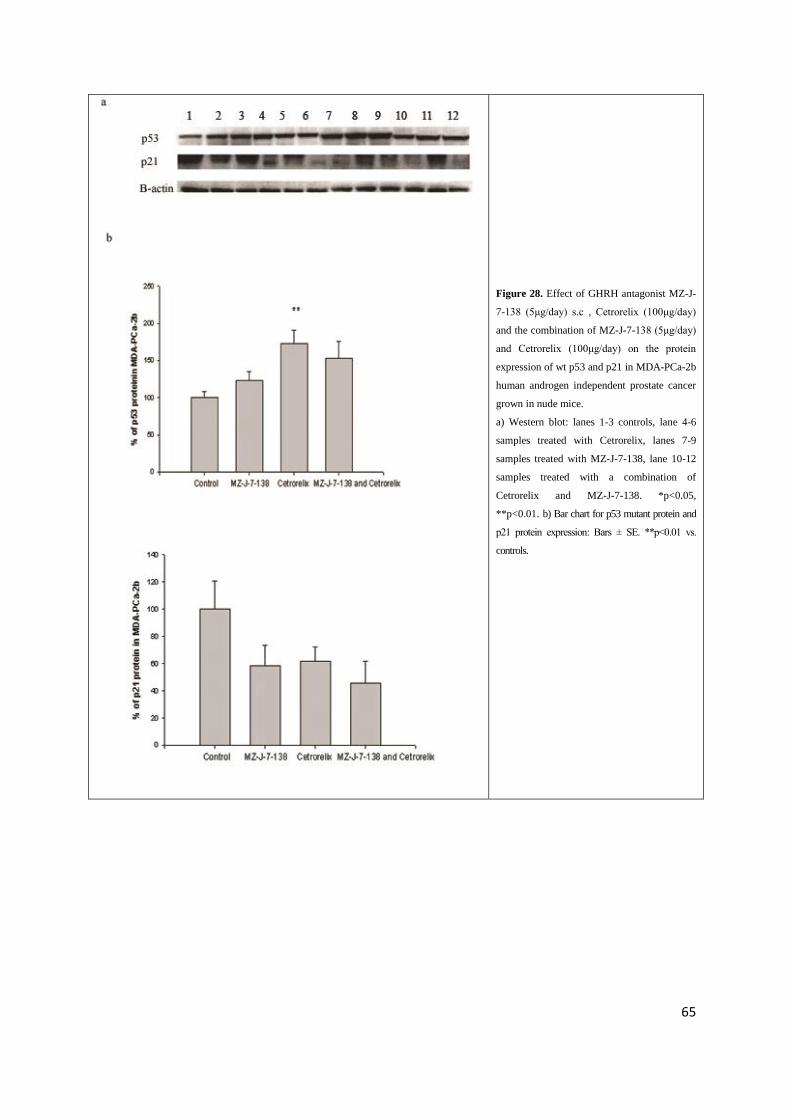
5). Wild type p53 in MDA-PCa-2b tumors was significantly up regulated by treatment with Cetrorelix
(p<0.01) and a non significant increase of wt-p53 was observed in MDA-PCa-2b tumors after
treatment with MZ-J-7-138 and the combination of MZ-J-7-138 and Cetrorelix (Table 21, Figure 28).
4.5.6. Effects of GHRH antagonist MZ-J-7-138 and LHRH antagonist Cetrorelix on p21
protein expression
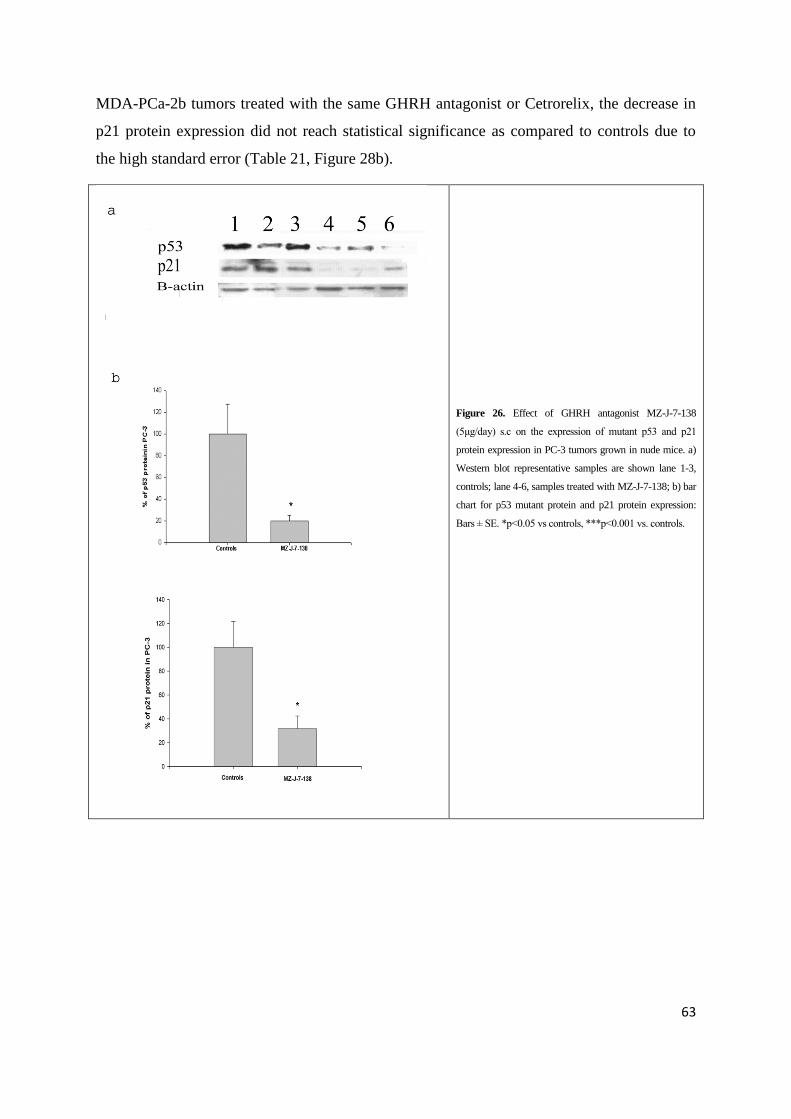
Treatment of PC-3 and DU-145 prostate cancers with GHRH antagonist MZ-J-7-138
significantly inhibited the expression of p21 protein levels (Table III, Figure 4 and 5). In
63
MDA-PCa-2b tumors treated with the same GHRH antagonist or Cetrorelix, the decrease in
p21 protein expression did not reach statistical significance as compared to controls due to
the high standard error (Table 21, Figure 28b).
Figure 26. Effect of GHRH antagonist MZ-J-7-138
(5μg/day) s.c on the expression of mutant p53 and p21
protein expression in PC-3 tumors grown in nude mice. a)
Western blot representative samples are shown lane 1-3,
controls; lane 4-6, samples treated with MZ-J-7-138; b) bar
chart for p53 mutant protein and p21 protein expression:
Bars ± SE. *p<0.05 vs controls, ***p<0.001 vs. controls.
64
Figure 27. Effect of GHRH antagonist MZ-J-7-138
(5μg/day) s.c on the expression of mutant p53 and p21
protein in DU-145 tumors. a) Western blot: lane 1-3,
controls; lane 4-6, samples treated with MZ-J-7-138, ; b) bar
chart for p53 mutant protein and p21 protein expression. Bars
± SE. **p<0.01 vs. controls, ***p<0.001 vs controls.
65
Figure 28. Effect of GHRH antagonist MZ-J-
7-138 (5μg/day) s.c , Cetrorelix (100μg/day)
and the combination of MZ-J-7-138 (5μg/day)
and Cetrorelix (100μg/day) on the protein
expression of wt p53 and p21 in MDA-PCa-2b
human androgen independent prostate cancer
grown in nude mice.
a) Western blot: lanes 1-3 controls, lane 4-6
samples treated with Cetrorelix, lanes 7-9
samples treated with MZ-J-7-138, lane 10-12
samples treated with a combination of
Cetrorelix and MZ-J-7-138. *p<0.05,
**p<0.01. b) Bar chart for p53 mutant protein and
p21 protein expression: Bars ± SE. **p<0.01 vs.
controls.
66
Table 21. The effect of GHRH antagonist MZ-J-7-138, Cetrorelix and their combination on the
protein expression of p53 and p21 in PC-3, DU-145 androgen independent and MDA-PCa-2b
androgen sensitive prostate cancers xenografted into nude mice
PC-3 protein expression in % of controls
DU-145 protein expression in % of controls
MDA-PCa-2b protein expression in % of controls
p53
Control:
MZ-J-7-138:
Cetrorelix:
MZ-J-7-138 and Cetrorelix
100.0±27.1
(mt) 17.9±6.0*
n.i. n.i.
100.0±21.6
(mt) 31.6±10.7*
n.i. n.i.
100.0±8.6
(wt) 123.0±11.8
(wt) 172.9±17.8** (wt) 152.9±23.3
p21
Control: MZ-J-7-138:
Cetrorelix:
MZ-J-7-138 and Cetrorelix
100.0±16.0 37.9±17.3*
n.i.
n.i.
100.0±5.9 44.4±6,2***
n.i.
n.i.
100.0±20.6 61.9±10.3
58.2±15.2
45.8±15.7
*P<0.05, **P<0.01 and ***P<0.001 vs controls; n.i.-not investigated
67
5. Discussion
5.1. Effects of LHRH antagonist cetrorelix on experimental benign prostatic
hyperplasia (Study 1)
Clinical data have demonstrated that therapy with LHRH antagonist Cetrorelix resulted in
long-lasting improvement in LUTS (55,56,58). This improvement, including reduction in prostate
volume and increase in urinary peak flow rate, appears to be superior to that produced by α-blockers
or 5α-reductase inhibitors(57). Low doses of Cetrorelix used in recent clinical trials cause only a
partial suppression of pituitary-gonadal axis and testosterone levels.
In the present study, we have shown that Cetrorelix significantly reduced prostate weights by
18% in non-castrating doses of 0.625 mg/kg (59). Histological observations in our rat model of BPH
revealed marked hyperplastic morphological changes in the prostates of testosterone-treated BPH
animals, while treatment with a low dose of Cetrorelix (0.625 mg/kg) caused an involution of these
hyperplastic changes resulting in a morphology similar to that of normal animals. Although
inflammation is not a main characteristic of the BPH model used in this study, we also observed
incidental inflammatory infiltrates in all experimental groups.
The presence of LHRH and LHRH-R in rat prostate was demonstrated by real-time PCR and
Western blot. Furthermore, ligand competition assay detected specific high affinity receptors for
LHRH in rat prostate. Cetrorelix 0.625 mg/kg significantly lowered prostatic AR and 5α-reductase 2
levels, however, serum DHT and LH were only slightly decreased. Changes in serum PSA were not
significant after treatment with Cetrorelix at 0.625 mg/kg. Moreover, the expression of LHRH and
LHRH-R and direct antiproliferative effects of LHRH and its analogs have been demonstrated in
many malignant human tumors (61,62,137). Recently we showed that Cetrorelix inhibits the
proliferation of human prostate epithelial BPH-1 cell line in vitro (66). These findings suggest that
low doses of Cetrorelix did not impair gonadal function in rats as was also shown by experimental
(59) and clinical findings (55-58). Prostate shrinkage is a result of direct inhibitory effects of
Cetrorelix exerted through prostatic LHRH receptors, implies the presence of an LHRH-based
autocrine regulatory system.
Herein, we used real-time PCR arrays to investigate the beneficial molecular mechanisms of
Cetrorelix in a BPH-model. The analyses showed several proinflammatory pathways and growth
factors were upregulated in control animals with induced BPH and markedly downregulated in
Cetrorelix-treated animals. Verifying PCR array results and more precisely determining changes in
gene expression, we studied the expression of selected proinflammatory and growth factor encoding
genes by real-time RT-PCR. Of the 11 genes analyzed, nine (IGF-1, EGF, TGF-β1 and-β2, FGF-2,
FGF-7, VEGF-A, IL-1β and IL-6) showed the same change pattern as in the PCR arrays, i.e.
68
upregulation after TE treatment and downregulation after Cetrorelix. These insulin-like, transforming
and fibroblast growth factors and downstream effector molecules as well as a variety of interleukins,
can lead to abnormal stromal and epithelial prostate cell growth (21,37,40).
Our observation of the transcriptional activation of inflammatory chemokine ligands (e.g., C5,
CCL25 and CXCL2) and interleukins (e.g., IL-3, IL-5, IL-6, IL-13, IL-15 and IL-17) in the prostate of
rats with induced BPH is consistent with clinical findings (138) and with experimental findings in rats
(139). Chemokines promote neutrophil recruitment and T-lymphocyte infiltration and the subsequent
progression of the inflammation associated with BPH. We found that Cetrorelix significantly lowered
transcriptional expression of several chemokines including C5 and CCL25.
Low doses of Cetrorelix caused a marked reduction in cytokine mRNA levels for IFN-γ, IL-
1α, IL-3, IL-4, IL-5, IL-6, IL-13, IL-15 and IL-17. These cytokines are part of an inflammatory
network in BPH including several growth factors (20,38,140). IFN-γ,produced by infiltrating T-cells,
is a natural antagonist of growth inhibiting TGF-β; FGF-2 stimulates growth (37). IFN-γ also
stimulates IL-15, thereby augmenting increased influx of T-lymphocytes (41). These T-cells further
produce lymphokines such as IL-4 and IL-13, facilitating formation of active androgens and estrogens
by inducing 3β-hydroxydehydrogenase/isomerase. T-cell derived IL-17 fine tunes immune response,
stimulating IL-6, IL-8 and IL-1α and β (38,40-42).
In summary, our wide-range analysis of gene expression in the prostate of rats with
testosterone-induced BPH revealed the transcriptional activation of several genes including those for
proinflammatory interleukins, chemokines and prostatic growth factors. The expression of these genes
was suppressed in Cetrorelix-treated animals. These findings suggest that Cetrorelix exerts its
beneficial effects on BPH by suppressing proinflammatory cytokines and growth factors at the
transcriptional level.
The results of this study indicate that the reduction in prostate volume could be due to direct
inhibitory effects of Cetrorelix exerted through prostatic LHRH receptors as well as transcriptional
suppression of proinflammatory cytokines and growth factors. These findings shed light on the
mechanism of action of LHRH antagonists in BPH and also suggest a role for LHRH as a locally
acting growth factor in BPH. It is possible that LHRH antagonists could be clinically used for therapy
of BPH in combination with other agents.
5.2. Effects of GHRH antagonists on experimental benign prostatic
hyperplasia (Study 2) The main finding of our study is that GHRH antagonists JMR-132, MIA-313 and MIA-459
reduce prostate size in an experimental model of BPH. In addition to prostate shrinkage in rats,
69
multiple factors related to growth and inflammation, which are crucial in the pathogenesis and
progression of BPH (21), were markedly reduced by treatment with GHRH antagonists. The
expression of GHRH, GHRH-R and its splice variant SV1 in rat prostate was demonstrated by
Western blot. The antibody used to detect GHRH receptors identifies both pituitary type GHRH-R
and its splice variant SV1 (141). Furthermore, ligand competition assay detected specific high affinity
receptors for GHRH in rat prostate and immunohistochemical analyses revealed that this expression
of GHRH-R is confined to luminal epithelial cells of the rat prostate. Changes in serum GH, IGF-1,
DHT, and PSA were not significant after treatment with GHRH antagonists. Recently we showed that
GHRH antagonists inhibit the proliferation of human prostate epithelial BPH-1 cell line in vitro
(76).These findings strongly suggest that prostate shrinkage is a result of direct inhibitory effects of
GHRH antagonists exerted through prostatic GHRH receptors, not involving the GH/IGF-1 axis. The
demonstration of the co-expression of GHRH and its receptors in rat prostate supports the hypothesis
that GHRH produced locally in the prostate could act in an autocrine/paracrine manner through an
interaction with the GHRH receptors (72). The presence of this pathway, which is disrupted by
GHRH antagonists, provides a mechanistic explanation for the antiproliferative effects of such
antagonists in prostate cell growth in culture (76) and in nude mice xenograft models of prostate
cancer (67,73,74). Our data also imply that GHRH could be involved in the pathogenesis of BPH.
Herein, we used real-time PCR arrays to investigate the beneficial molecular mechanisms of
GHRH antagonists in a BPH-model. The analyses showed that several growth factors were
upregulated in TE-induced BPH control rats and markedly downregulated in animals treated with
GHRH antagonists. Growth factors are regulatory peptides that govern the response of cells to injury
and mediate the highly coordinated processes of cell growth, differentiation, and apoptosis. Among
them there are many polypeptides which use autocrine or paracrine pathways to signal stromal and
epithelial cells in the microenvironment (21). Verifying PCR array results and more precisely
determining changes in gene expression, we studied the expression of selected growth factor and
proinflammatory encoding genes by real-time RT-PCR. We confirmed that GHRH antagonists
suppress transcriptional expression of IGF-2, TGF-α, TGF-β1 and-β2, EGF, FGF-2, VEGF-A and IL-
1β. Several of these growth factors were reported to be involved in the pathogenesis of BPH: EGF and