Page 1
EFFECTS OF BUFFER SALTS, TEMPERATURE
AND pH ON FOOD WASTE COMPOSTING
A Thesis
Submitted to the Faculty of Graduate Studies and Research
in Partial Fulfillment of the Requirements
for the degree of
Master of Applied Science
in Environmental Systems Engineering
University of Regina
by
Sheng Li
Regina, Saskatchewan
January, 2012
Copyright 2012: Sheng. Li
Page 2
I 1 Library and Archives Canada
Published Heritage Branch
395 Wellington Street Ottawa ON KlA ON4 Canada
NOTICE:
The author has granted a non-exclusive license allowing Library and Archives Canada to reproduce, publish, archive, preserve, conserve, communicate to the public by telecommunication or on the Internet, loan, distrbute and sell theses worldwide, for commercial or non-commercial purposes, in microform, paper, electronic and/or any other formats.
The author retains copyright ownership and moral rights in this thesis. Neither the thesis nor substantial extracts from it may be printed or otherwise reproduced without the author's permission.
Bibliotheque et Archives Canada
Direction du Patrimoine de ('edition
395, rue Wellington Ottawa ON K1A ON4 Canada
Your file Votre reference
ISBN: 978-0-494-88499-7
Our file Notre reference
ISBN: 978-0-494-88499-7
AVIS:
L'auteur a accorde une licence non exclusive permettant a la Bibliotheque et Archives Canada de reproduire, publier, archiver, sauvegarder, conserver, transmettre au public par telecommunication ou par ('Internet, preter, distribuer et vendre des theses partout dans le monde, a des fins commerciales ou autres, sur support microforme, papier, electronique et/ou autres formats.
L'auteur conserve la propriete du droit d'auteur et des droits moraux qui protege cette these. Ni la these ni des extraits substantiels de celle-ci ne doivent etre imprimes ou autrement reproduits sans son autorisation.
In compliance with the Canadian Privacy Act some supporting forms may have been removed from this thesis.
While these forms may be included in the document page count, their removal does not represent any loss of content from the thesis.
Canada.
Conformement a la loi canadienne sur la protection de la vie privee, quelques formulaires secondaires ont ete enleves de cette these.
Bien que ces formulaires aient inclus dans la pagination, it n'y aura aucun contenu manquant.
Library and Archives Canada
Published Heritage Branch
Bibliotheque et Archives Canada
Direction du Patrimoine de I'edition
395 Wellington Street Ottawa ON K1A0N4 Canada
395, rue Wellington Ottawa ON K1A 0N4 Canada
Your file Votre reference
ISBN: 978-0-494-88499-7
Our file Notre reference
ISBN: 978-0-494-88499-7
NOTICE:
The author has granted a nonexclusive license allowing Library and Archives Canada to reproduce, publish, archive, preserve, conserve, communicate to the public by telecommunication or on the Internet, loan, distrbute and sell theses worldwide, for commercial or noncommercial purposes, in microform, paper, electronic and/or any other formats.
AVIS:
L'auteur a accorde une licence non exclusive permettant a la Bibliotheque et Archives Canada de reproduire, publier, archiver, sauvegarder, conserver, transmettre au public par telecommunication ou par I'lnternet, preter, distribuer et vendre des theses partout dans le monde, a des fins commerciales ou autres, sur support microforme, papier, electronique et/ou autres formats.
The author retains copyright ownership and moral rights in this thesis. Neither the thesis nor substantial extracts from it may be printed or otherwise reproduced without the author's permission.
L'auteur conserve la propriete du droit d'auteur et des droits moraux qui protege cette these. Ni la these ni des extraits substantiels de celle-ci ne doivent etre imprimes ou autrement reproduits sans son autorisation.
In compliance with the Canadian Privacy Act some supporting forms may have been removed from this thesis.
While these forms may be included in the document page count, their removal does not represent any loss of content from the thesis.
Conformement a la loi canadienne sur la protection de la vie privee, quelques formulaires secondaires ont ete enleves de cette these.
Bien que ces formulaires aient inclus dans la pagination, il n'y aura aucun contenu manquant.
Canada
Page 3
UNIVERSITY OF REGINA
FACULTY OF GRADUATE STUDIES AND RESEARCH
SUPERVISORY AND EXAMINING COMMITTEE
Sheng Li, candidate for the degree of Master of Applied Science in Environmental Systems Engineering, has presented a thesis titled, Effects of Buffer Salts, Temperature and pH on Food Waste Composting, in an oral examination held on December 22, 2011. The following committee members have found the thesis acceptable in form and content, and that the candidate demonstrated satisfactory knowledge of the subject material.
External Examiner: Dr. David deMontigny, Process Systems Engineering
Supervisor: Dr. Guo H. Huang, Environmental Systems Engineering
Committee Member: Dr. Fanhua Zeng, Petroleum Systems Engineering
Committee Member: Dr. Stephanie Young, Environmental Systems Engineering
Chair of Defense: Dr. Boting Yang, Department of Computer Science
*Not present at defense
UNIVERSITY OF REGINA
FACULTY OF GRADUATE STUDIES AND RESEARCH
SUPERVISORY AND EXAMINING COMMITTEE
Sheng Li, candidate for the degree of Master of Applied Science in Environmental Systems Engineering, has presented a thesis titled, Effects of Buffer Salts, Temperature andpH on Food Waste Composting, in an oral examination held on December 22, 2011. The following committee members have found the thesis acceptable in form and content, and that the candidate demonstrated satisfactory knowledge of the subject material.
External Examiner: Dr. David deMontigny, Process Systems Engineering
Supervisor: Dr. Guo H. Huang, Environmental Systems Engineering
Committee Member: Dr. Fanhua Zeng, Petroleum Systems Engineering
Committee Member: Dr. Stephanie Young, Environmental Systems Engineering
Chair of Defense: Dr. Boting Yang, Department of Computer Science
*Not present at defense
Page 4
ABSTRACT
In this thesis research, the effects of buffer salts, temperature and pH on food-waste
composting under various conditions were examined. Three factors regarding the
composting experiments were investigated via ten runs (including three control runs
and three parallel runs) of bench-scale in-vessel composting experiments. The
research can be divided into two sections:
In the first section, several buffer salts with initially different initial pH have been
utilized as the pH control amendments. Three runs with K2HPO4/MgSO4,
KH2PO4/MgSO4 and NaAc added, were compared with the control run without
anything added. The effects of the three agents upon pH, microbial activity and
ammonia release were then evaluated. Nitrogen transformation within composting
composition was also analyzed. The results showed the alkaline additives (NaAc and
K2HPO4/MgSO4) had a positive influence upon the degradation of organic material
while acidic additive (ICH2PO4/MgSO4) severely reduced the pH value and resulted in
reduced microorganism activity. With the assistance of MgSO4, phosphates could be
transferred to struvite, which further reduced the ammonia emission. However, the
results of nitrogen transformation showed NI-13-N only accounted for approximately
10% of total nitrogen and thus stimulating microorganism activity in order to
decompose more organic nitrogen into inorganic components was more critical than
ABSTRACT
In this thesis research, the effects of buffer salts, temperature and pH on food-waste
composting under various conditions were examined. Three factors regarding the
composting experiments were investigated via ten runs (including three control runs
and three parallel runs) of bench-scale in-vessel composting experiments. The
research can be divided into two sections:
In the first section, several buffer salts with initially different initial pH have been
utilized as the pH control amendments. Three runs with K^HPOVMgSO,!,
KH2PC>4/MgS04 and NaAc added, were compared with the control run without
anything added. The effects of the three agents upon pH, microbial activity and
ammonia release were then evaluated. Nitrogen transformation within composting
composition was also analyzed. The results showed the alkaline additives (NaAc and
K2HPC>4/MgS04) had a positive influence upon the degradation of organic material
while acidic additive (KftPCVMgSC^) severely reduced the pH value and resulted in
reduced microorganism activity. With the assistance of MgSC>4, phosphates could be
transferred to struvite, which further reduced the ammonia emission. However, the
results of nitrogen transformation showed NH3-N only accounted for approximately
10% of total nitrogen and thus stimulating microorganism activity in order to
decompose more organic nitrogen into inorganic components was more critical than
i
Page 5
preventing ammonia emission. Due to this circumstance, K2HPO4/MgSO4 was the
best amendment to the investigated experiments.
In the second part of the research, a two-term modified Monod model was proposed to
quantify the combined effects of temperature and pH upon the growth of mesophiles
and thermophiles, simultaneously, during the composting process. Cross-validation
was also employed to improve the model's accuracy. Six runs of food waste
composting (two with the addition of water, two with heating conditions and the
remaining two as control runs) through bench-scale in-vessel reactors were
constructed to demonstrate the performance of the proposed model. The simulation
results indicated the modified Monod function exhibited superiority in a higher
coefficient of determination, a smaller SSE and provided more information regarding
mesophiles and thermophiles, respectively, when compared with the original model.
Meanwhile, the thermophiles had a larger maximum degradation rate and a larger
half-saturation constant than mesophiles, which revealed that thermophiles played a
major role in decomposing organic matter within the investigated composting
processes. Thermophiles were more sensitive to the changes in pH, which implied that
the initial stage was more critical with respect to thermophiles when the produced
organic acid exhibited the potentially inhibitory effects.
ii
preventing ammonia emission. Due to this circumstance, K.2HP04/MgS04 was the
best amendment to the investigated experiments.
In the second part of the research, a two-term modified Monod model was proposed to
quantify the combined effects of temperature and pH upon the growth of mesophiles
and thermophiles, simultaneously, during the composting process. Cross-validation
was also employed to improve the model's accuracy. Six runs of food waste
composting (two with the addition of water, two with heating conditions and the
remaining two as control runs) through bench-scale in-vessel reactors were
constructed to demonstrate the performance of the proposed model. The simulation
results indicated the modified Monod function exhibited superiority in a higher
coefficient of determination, a smaller SSE and provided more information regarding
mesophiles and thermophiles, respectively, when compared with the original model.
Meanwhile, the thermophiles had a larger maximum degradation rate and a larger
half-saturation constant than mesophiles, which revealed that thermophiles played a
major role in decomposing organic matter within the investigated composting
processes. Thermophiles were more sensitive to the changes in pH, which implied that
the initial stage was more critical with respect to thermophiles when the produced
organic acid exhibited the potentially inhibitory effects.
ii
Page 6
ACKNOWLEDGEMENTS
First, I would like to express my sincere thanks to my supervisor, Dr. Gordon Huang,
for his exceptional instructions, guidance, and patience which were influencing
factors in the completion of this research. His philosophy will inspire me in every
aspect of my life and the experience in University of Regina will be forever engraved
in my mind.
I am very grateful to the members of the composting group, Dr. Baiyu Zhang, Dr. Hui
Yu, Dr. Yupeng Lin, Dr Xiaosheng Qin, Xueling Sun, Kuang Peng and Kai An who
designed the experiment and collected the data. I also extend my grateful
acknowledgement to Chunjiang An, Jia Wei, Yao Yao, Shan Zhao and Wei Sun for
their unselfish assistance during my research. Their suggestions heightened the results
of this project.
I am grateful to the Faculty of Graduate Studies and Research at the University of
Regina, for providing research scholarships for my graduate study.
Finally, I would like to thank my parents, Jinjie Li and Xiangyang Li, and my family
members, Xiangjun Li and Zhiwu Liang, for their understanding and encouragement
over the past few years. I could not present this thesis without their loving support.
iii
ACKNOWLEDGEMENTS
First, 1 would like to express my sincere thanks to my supervisor, Dr. Gordon Huang,
for his exceptional instructions, guidance, and patience which were influencing
factors in the completion of this research. His philosophy will inspire me in every
aspect of my life and the experience in University of Regina will be forever engraved
in my mind.
I am very grateful to the members of the composting group, Dr. Baiyu Zhang, Dr. Hui
Yu, Dr. Yupeng Lin, Dr Xiaosheng Qin, Xueling Sun, Kuang Peng and Kai An who
designed the experiment and collected the data. I also extend my grateful
acknowledgement to Chunjiang An, Jia Wei, Yao Yao, Shan Zhao and Wei Sun for
their unselfish assistance during my research. Their suggestions heightened the results
of this project.
I am grateful to the Faculty of Graduate Studies and Research at the University of
Regina, for providing research scholarships for my graduate study.
Finally, I would like to thank my parents, Jinjie Li and Xiangyang Li, and my family
members, Xiangjun Li and Zhiwu Liang, for their understanding and encouragement
over the past few years. I could not present this thesis without their loving support.
iii
Page 7
TABLE OF CONTENTS
ABSTRACT i
ACKNOWLEDGEMENTS iii
LIST OF FIGURES viii
LIST OF TABLES xiii
CHAPTER 1 INTRODUCTION 1
1.1 Background 1
1.2 Challenges to Food Waste Composting 2
1.3 Objective 4
1.4 Thesis Organization 5
CHAPTER 2 LITERATURE REVIEW 7
2.1 Application of Composting 9
2.1.1 Composting of Farming/Agriculture Waste 9
2.1.2 Composting of Municipal Solid Waste 11
2.1.3 Composting of Food Waste 12
2.2 Factors Affecting Composting Reaction Rate and Products Quality 13
2.2.1 Temperature 14
2.2.2 pH 19
2.2.3 Moisture Content 27
iv
TABLE OF CONTENTS
ABSTRACT - i
ACKNOWLEDGEMENTS ui
LIST OF FIGURES viii
LIST OF TABLES xiii
CHAPTER 1 INTRODUCTION 1
1.1 Background 1
1.2 Challenges to Food Waste Composting 2
1.3 Objective 4
1.4 Thesis Organization 5
CHAPTER 2 LITERATURE REVIEW 7
2.1 Application of Composting 9
2.1.1 Composting of Farming/Agriculture Waste 9
2.1.2 Composting of Municipal Solid Waste 11
2.1.3 Composting of Food Waste 12
2.2 Factors Affecting Composting Reaction Rate and Products Quality 13
2.2.1 Temperature 14
2.2.2 pH 19
2.2.3 Moisture Content 27
iv
Page 8
2.2.4 Oxygen 28
2.2.5 Nitrogen Content 29
2.3 Modeling of the Composting Process 31
2.4 Literature Review Summary 35
CHAPTER 3 MATERIALS AND METHOD 38
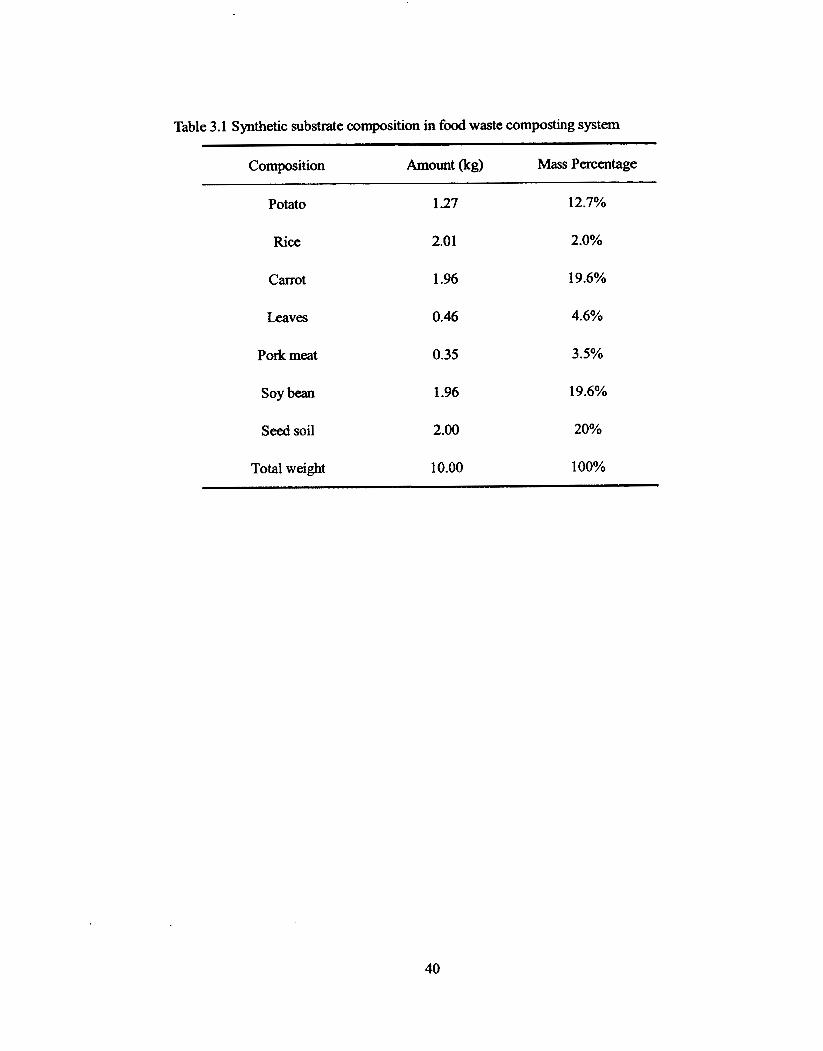
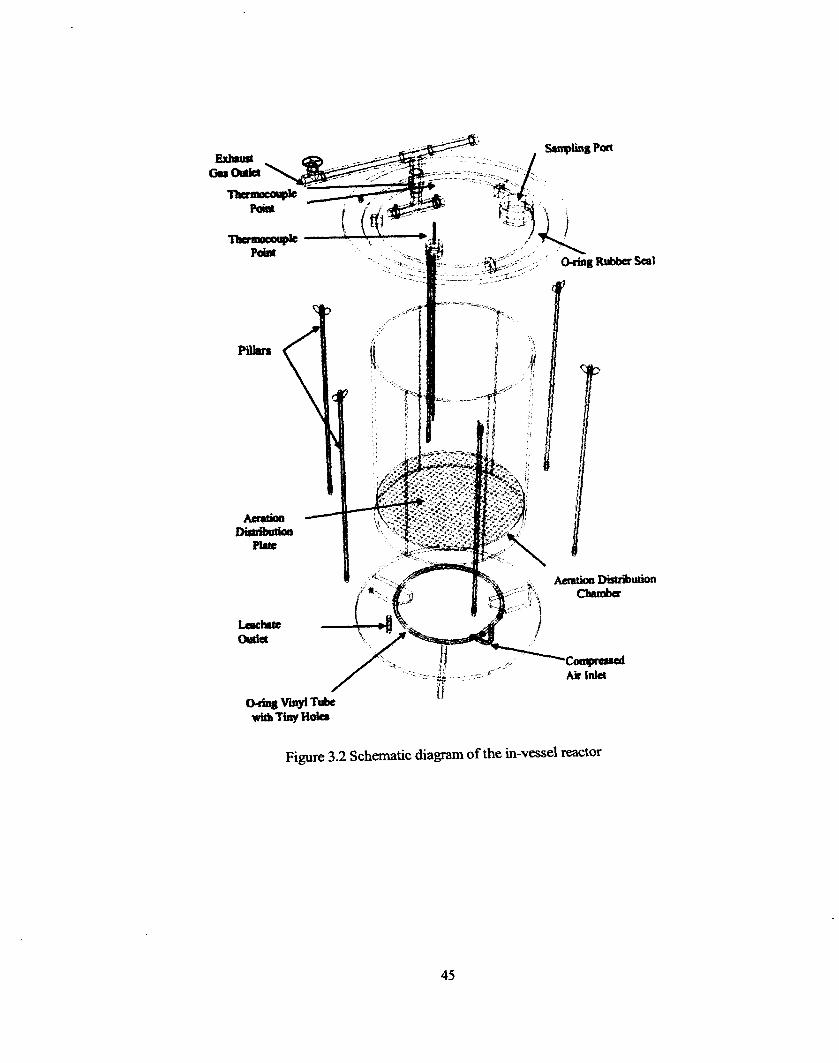
3.1 Overview of Experimental Approaches 38
3.2 Composting Materials 38
3.3 In-Vessel Composting System 39
3.4 Turning and Sampling 50
3.5 Physical and Chemical Analysis 50
3.5.1 Weight and Volume 51
3.5.2 Moisture Content 53
3.5.3 Ash and Organic Content 53
3.5.4 Oxygen Uptake Rate (OUR) 54
3.5.5 Aqueous Ammonium (NH4+-N) Concentration 55
3.5.6 Gaseous Ammonia (NI-I3-N) Concentration 58
3.5.7 Carbon-Nitrogen (C/N) Ratio 58
3.5.8 Microorganism Colony Counting 59
3.6 Statistical Analysis 61
3.6.1 One-way ANOVA 61
3.6.2 Leave-one-out Cross-validation 62
2.2.4 Oxygen 28
2.2.5 Nitrogen Content 29
2.3 Modeling of the Composting Process 31
2.4 Literature Review Summary 35
CHAPTER 3 MATERIALS AND METHOD 38
3.1 Overview of Experimental Approaches 38
3.2 Composting Materials 38
3.3 In-Vessel Composting System 39
3.4 Turning and Sampling 50
3.5 Physical and Chemical Analysis 50
3.5.1 Weight and Volume 51
3.5.2 Moisture Content 53
3.5.3 Ash and Organic Content 53
3.5.4 Oxygen Uptake Rate (OUR) 54
3.5.5 Aqueous Ammonium (NH/-N) Concentration 55
3.5.6 Gaseous Ammonia (NH3-N) Concentration 58
3.5.7 Carbon-Nitrogen (C/N) Ratio 58
3.5.8 Microorganism Colony Counting 59
3.6 Statistical Analysis 61
3.6.1 One-way ANOVA 61
3.6.2 Leave-one-out Cross-validation 62
v
Page 9
CHAPTER 4 EFFECTS OF BUFFER SALTS 64
4.1 Variations in Physicochemical and Microbiological Parameters 64
4.1.1 Temperature 64
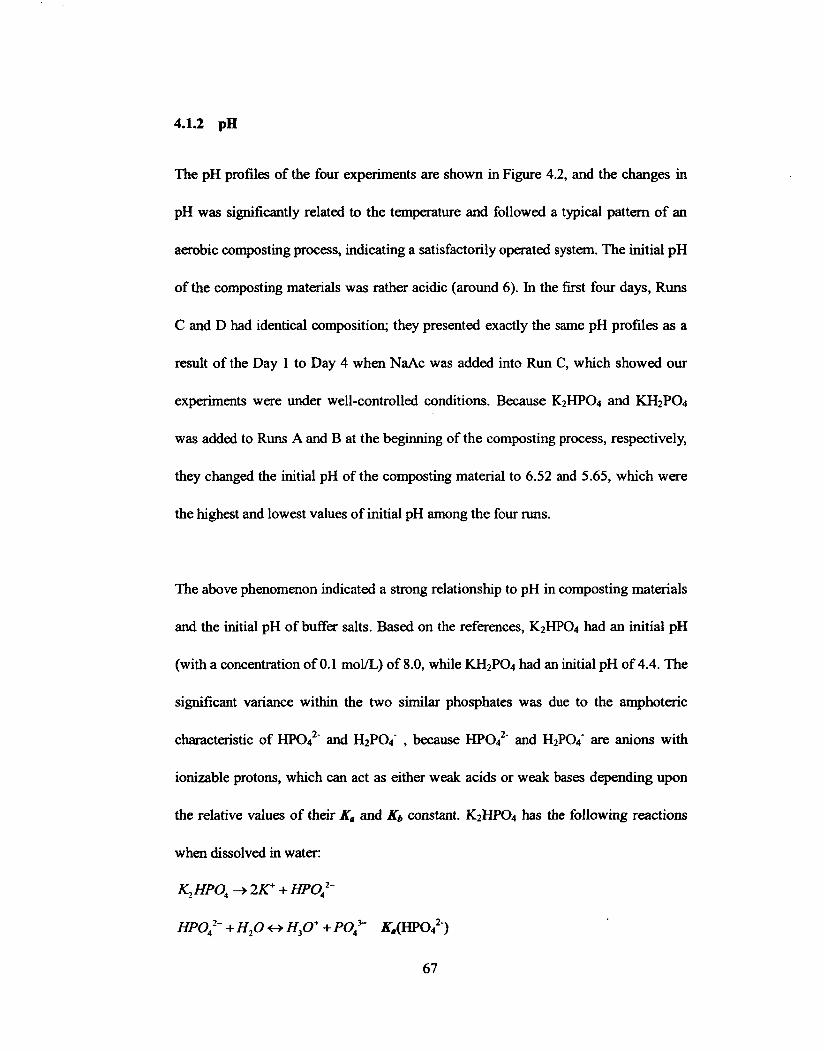
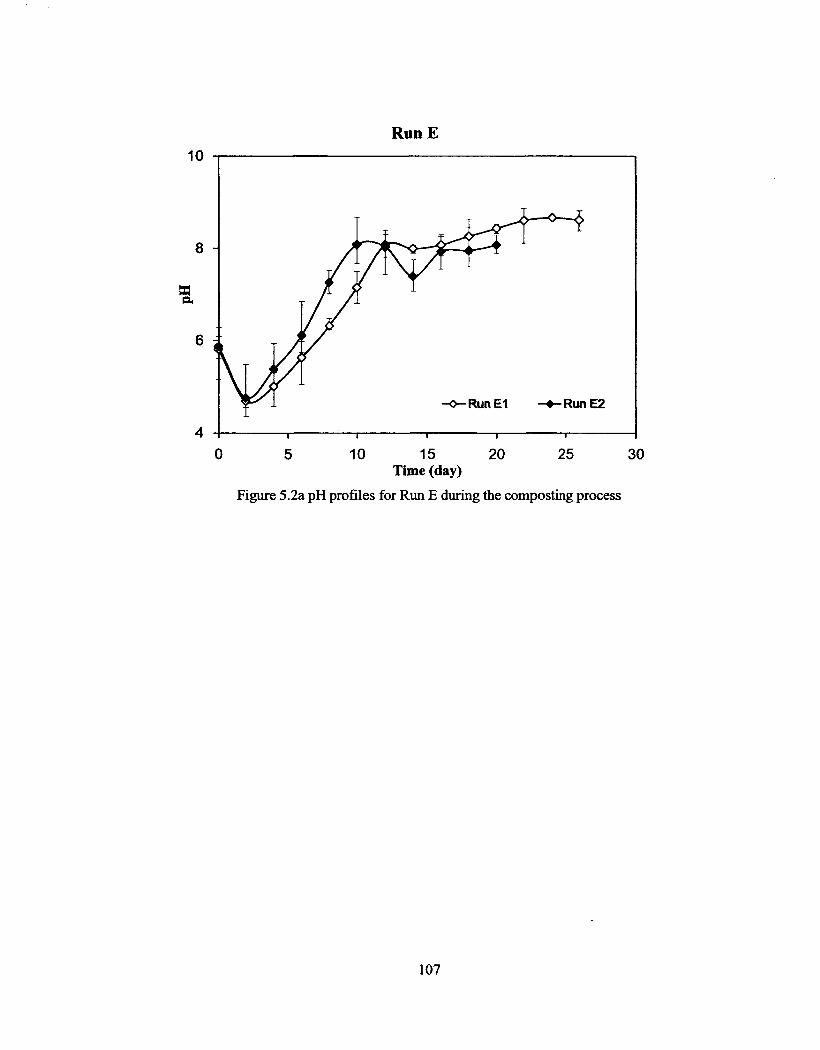
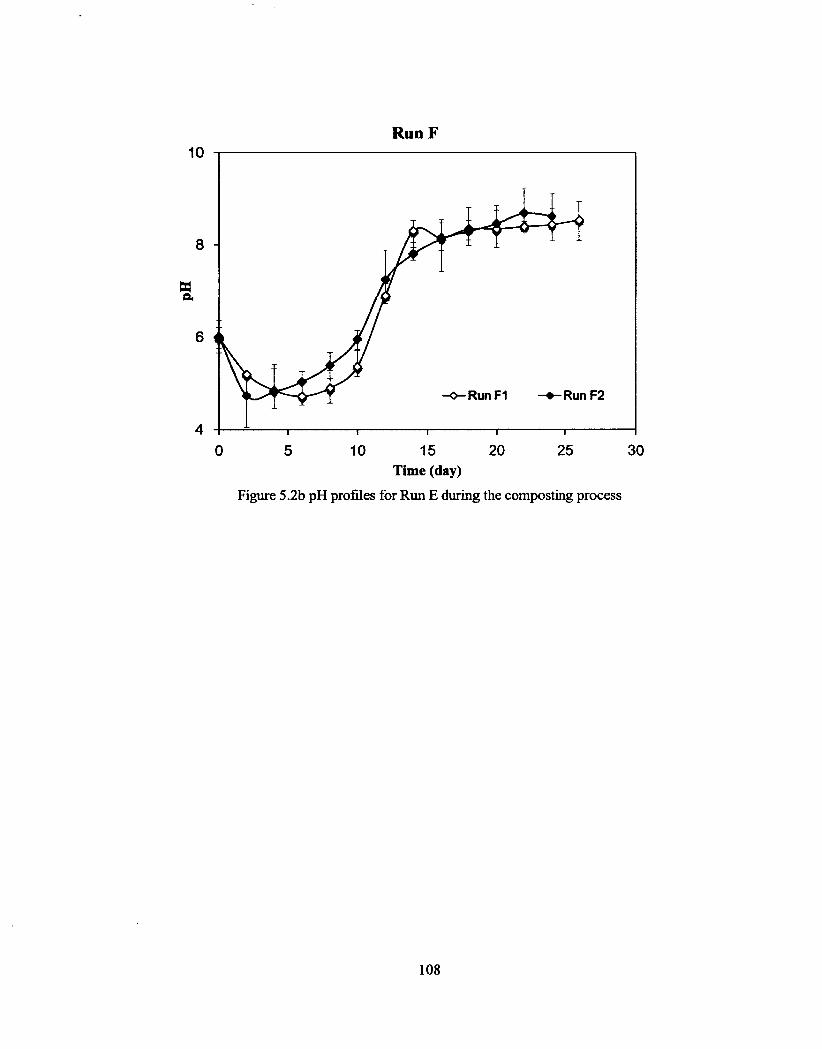
4.1.2 pH 67
4.2 Change in Microbial Activities 72
4.2.1 Daily and Cumulative Oxygen Uptake 72
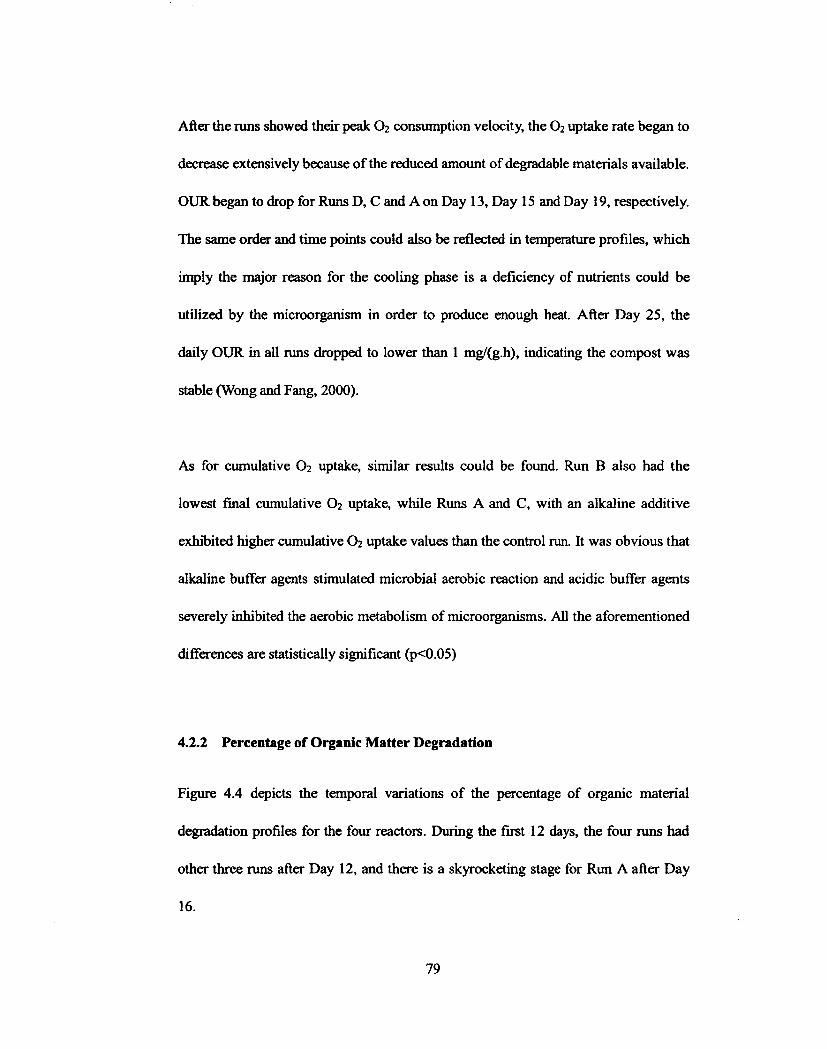
4.2.2 Percentage of Organic Matter Degradation 79
4.2.3 Changes in Ammonia Loss 83
4.3 Nitrogen Mass Balance in Composting System 91
4.4 Summary 97
CHAPTER 5 El}'} ECTS OF TEMPERATURE AND pH 98
5.1 Kinetics Model Development 98
5.1.1 Development of a Two-Term Monod Equation with Correction Factors of
Temperature and pH 98
5.1.2 Non-Linear Regression 102
5.2 State-Variable Profiles 102
5.3 Model Calibration 110
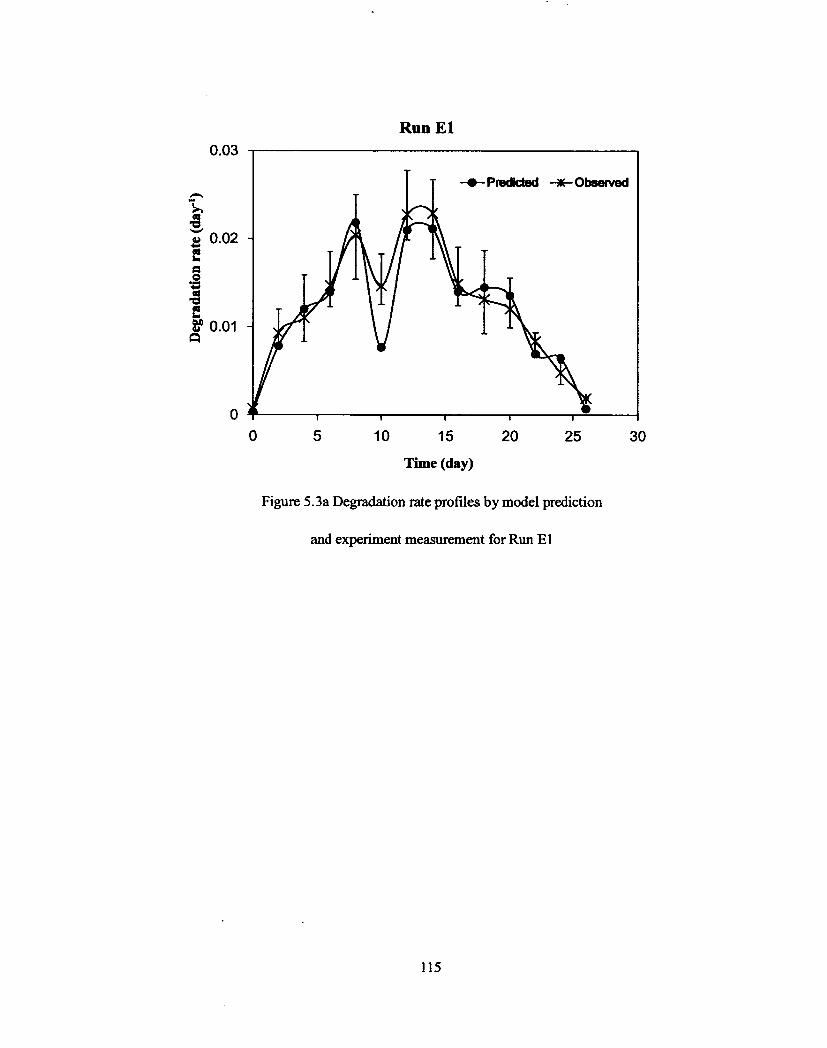
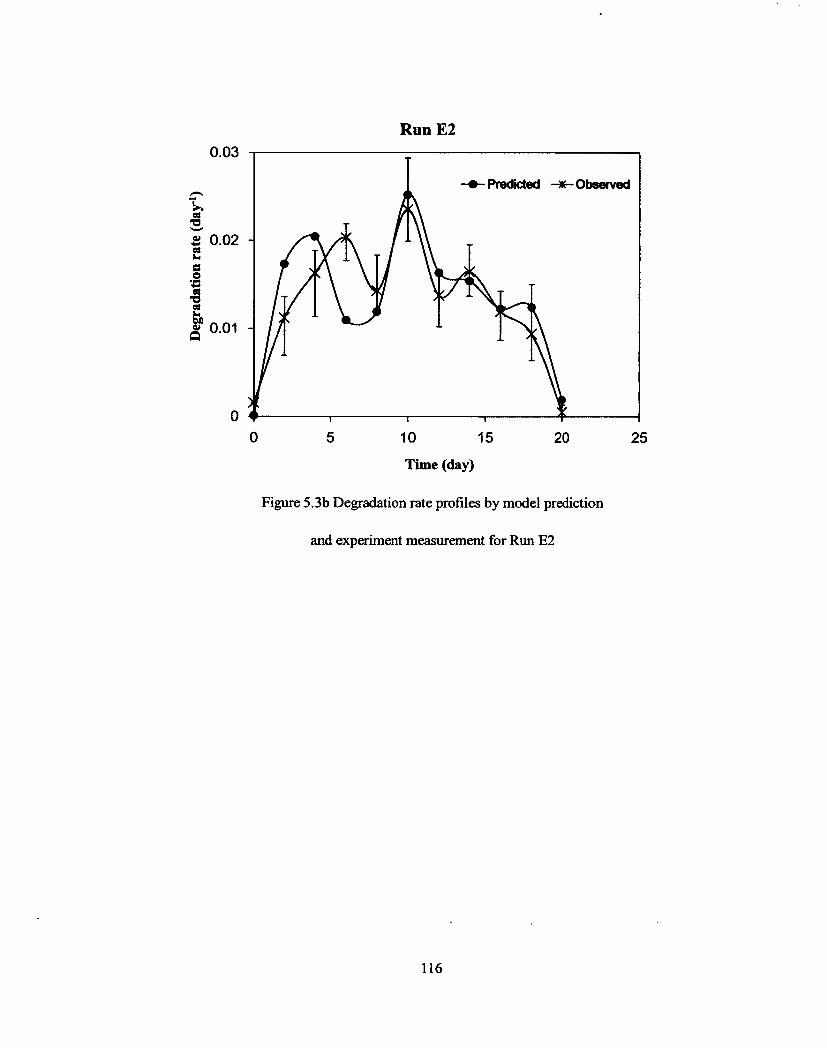
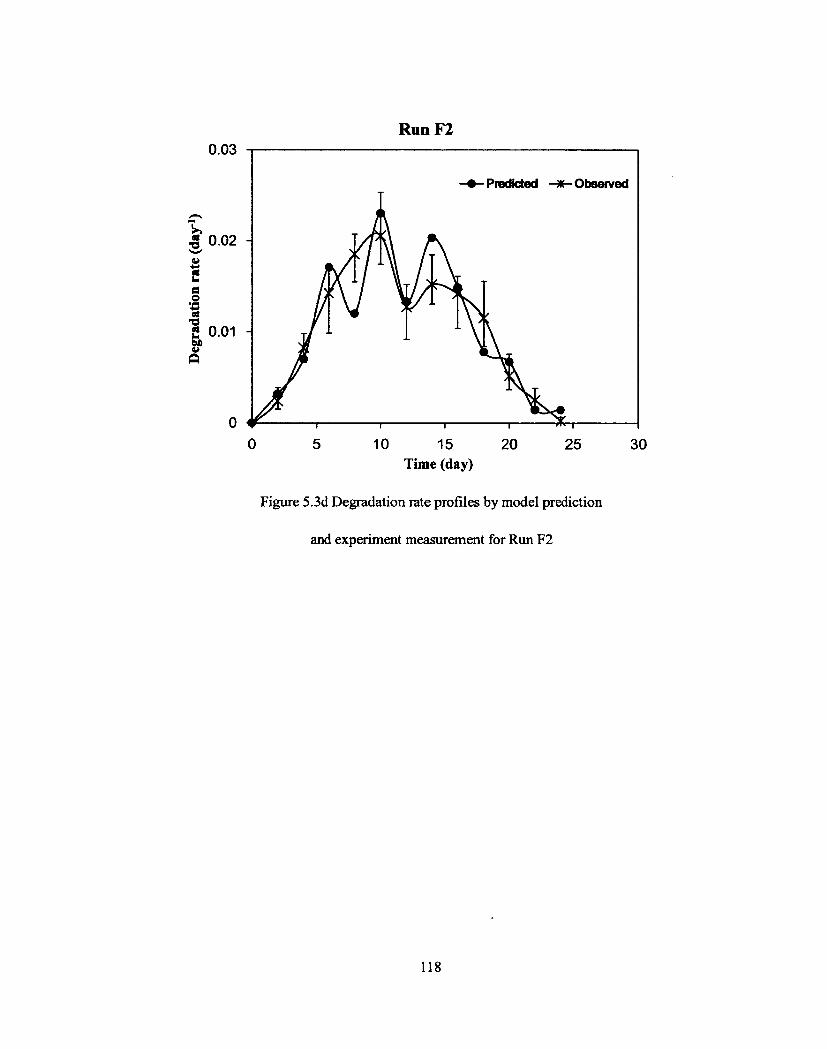
5.4 Test of Model Performance 114
5.5 Discussion 135
5.5.1 Comparison with Original Monod Function 135
5.5.2 Environmental Factors of Microorganism Growth 148
vi
CHAPTER 4 EFFECTS OF BUFFER SALTS 64
4.1 Variations in Physicochemical and Microbiological Parameters 64
4.1.1 Temperature 64
4.1.2 pH 67
4.2 Change in Microbial Activities 72
4.2.1 Daily and Cumulative Oxygen Uptake 72
4.2.2 Percentage of Organic Matter Degradation 79
4.2.3 Changes in Ammonia Loss 83
4.3 Nitrogen Mass Balance in Composting System 91
4.4 Summary 97
CHAPTER 5 EFFECTS OF TEMPERATURE AND pH 98
5.1 Kinetics Model Development 98
5.1.1 Development of a Two-Term Monod Equation with Correction Factors of
Temperature and pH 98
5.1.2 Non-Linear Regression 102
5.2 State-Variable Profiles 102
5.3 Model Calibration 110
5.4 Test of Model Performance 114
5.5 Discussion 135
5.5.1 Comparison with Original Monod Function 135
5.5.2 Environmental Factors of Microorganism Growth 148
vi
Page 10
5.6 Summary 149
CHAPTER 6 CONCLUSIONS 151
6.1 Summary 151
6.2 Contributions 152
6.3 Recommendations for Future Studies 154
REFERENCE 156
vii
5.6 Summary 149
CHAPTER 6 CONCLUSIONS 151
6.1 Summary 151
6.2 Contributions 152
6.3 Recommendations for Future Studies 154
REFERENCE 156
vii
Page 11
LIST OF FIGURES
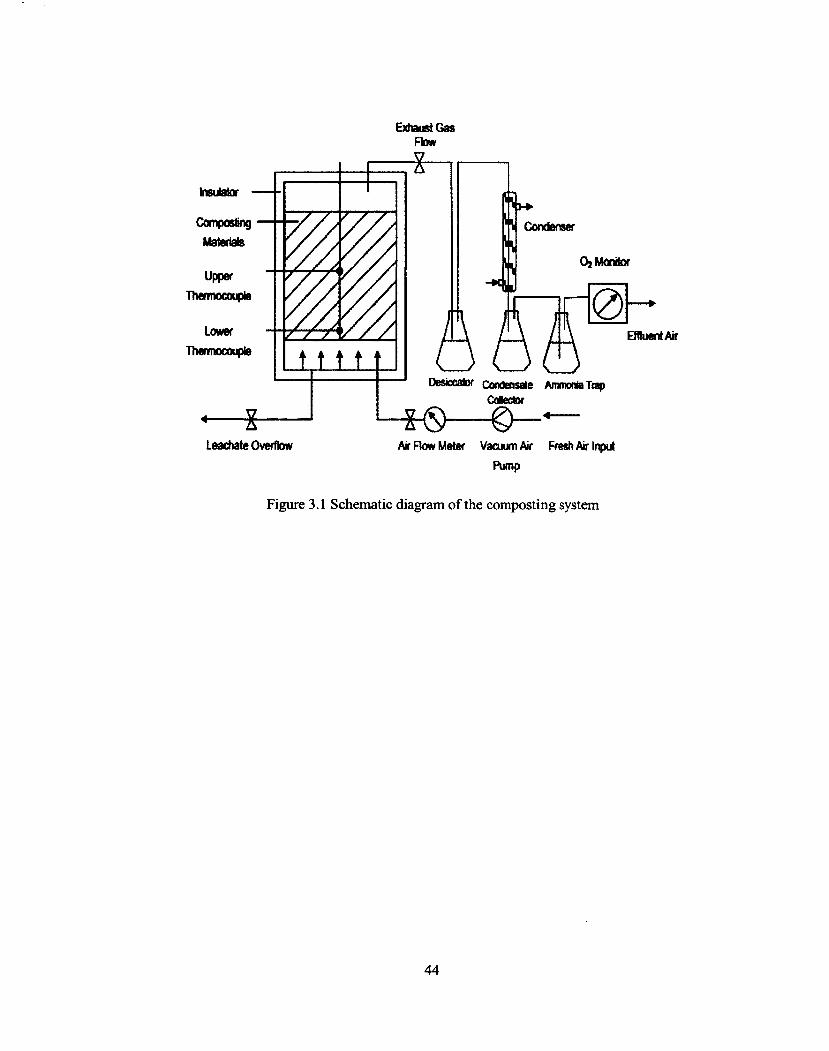
Figure 3.1 Schematic diagram of the composting system 44
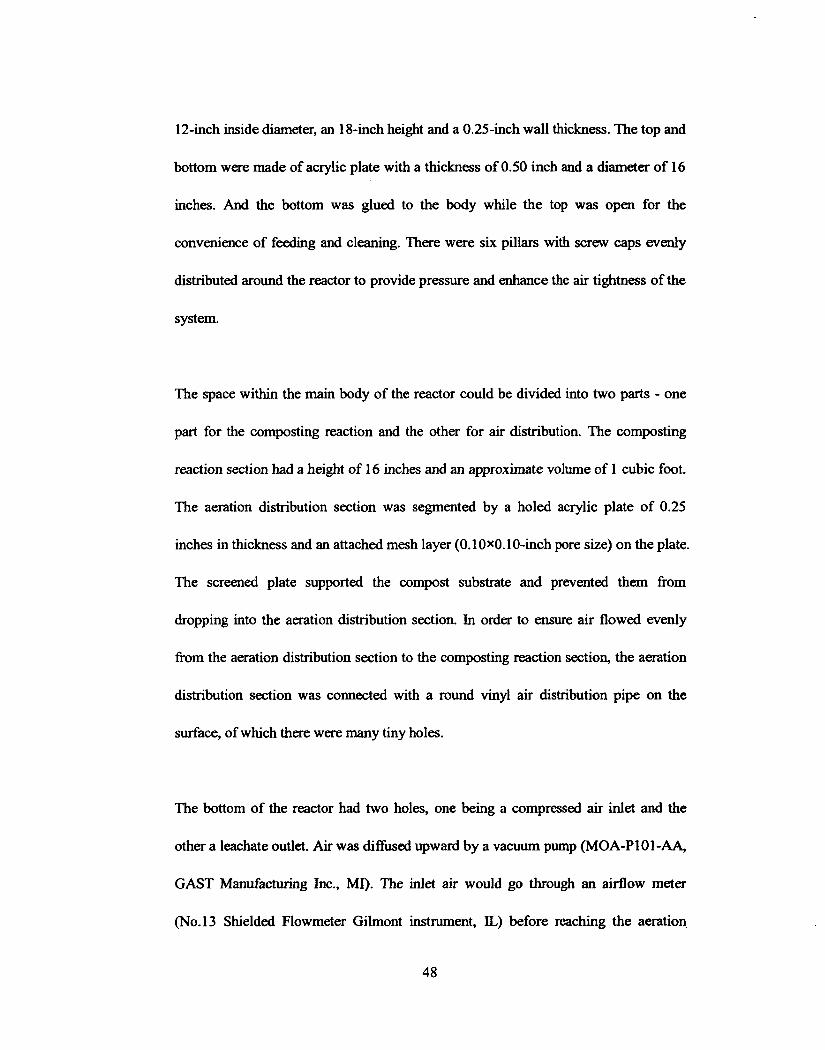
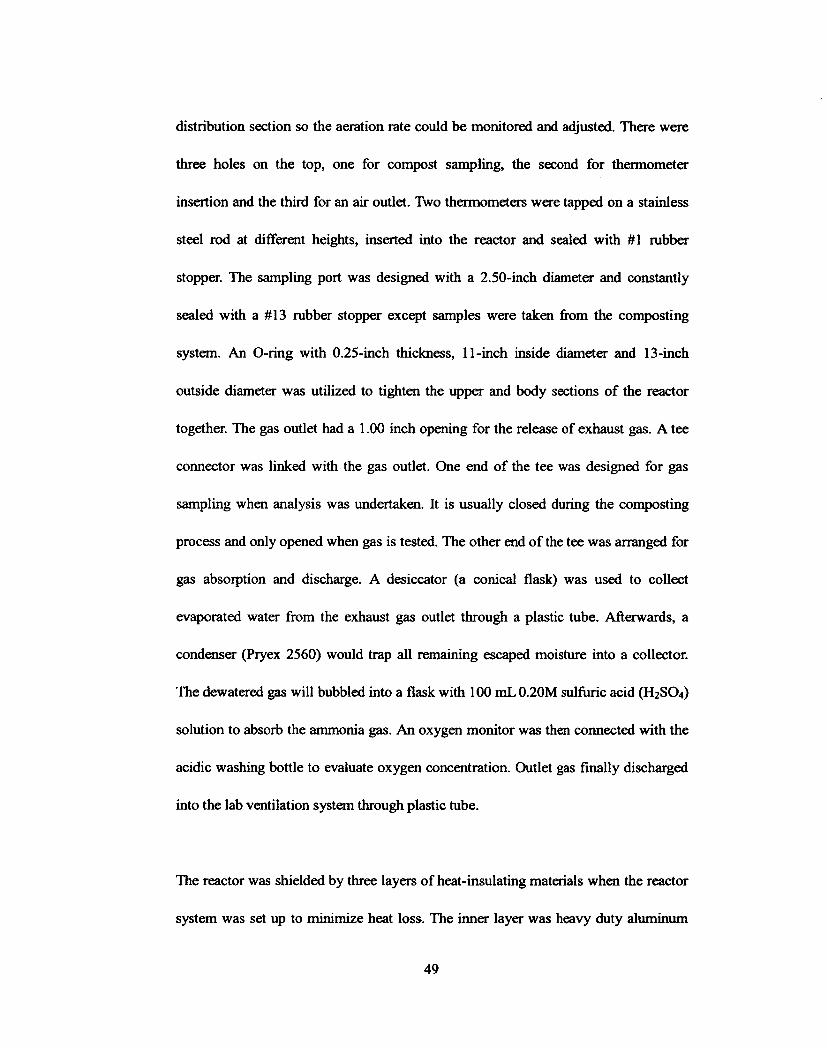
Figure 3.2 Schematic diagram of the in-vessel reactor 45
Figure 3.3 Picture of the in-vessel composting reactor 46
Figure 3.4 Picture of the in-vessel composting reactor with insulation layer 47
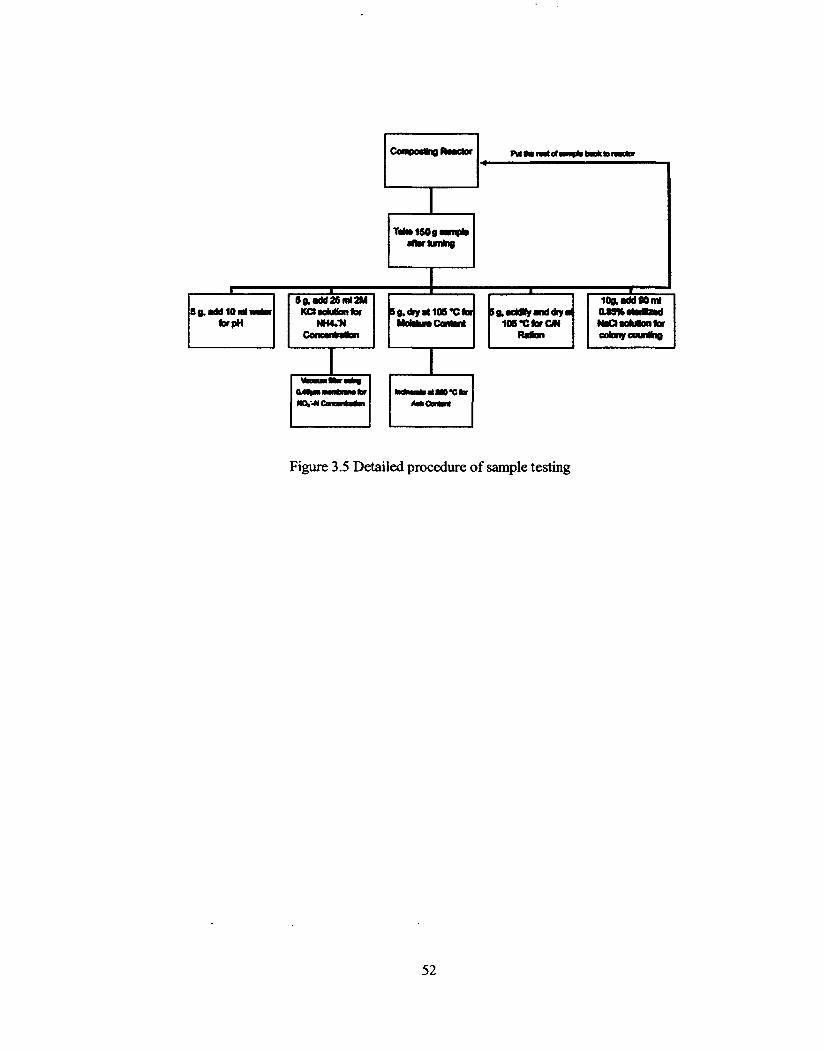
Figure 3.5 Detailed procedure of sample testing 52
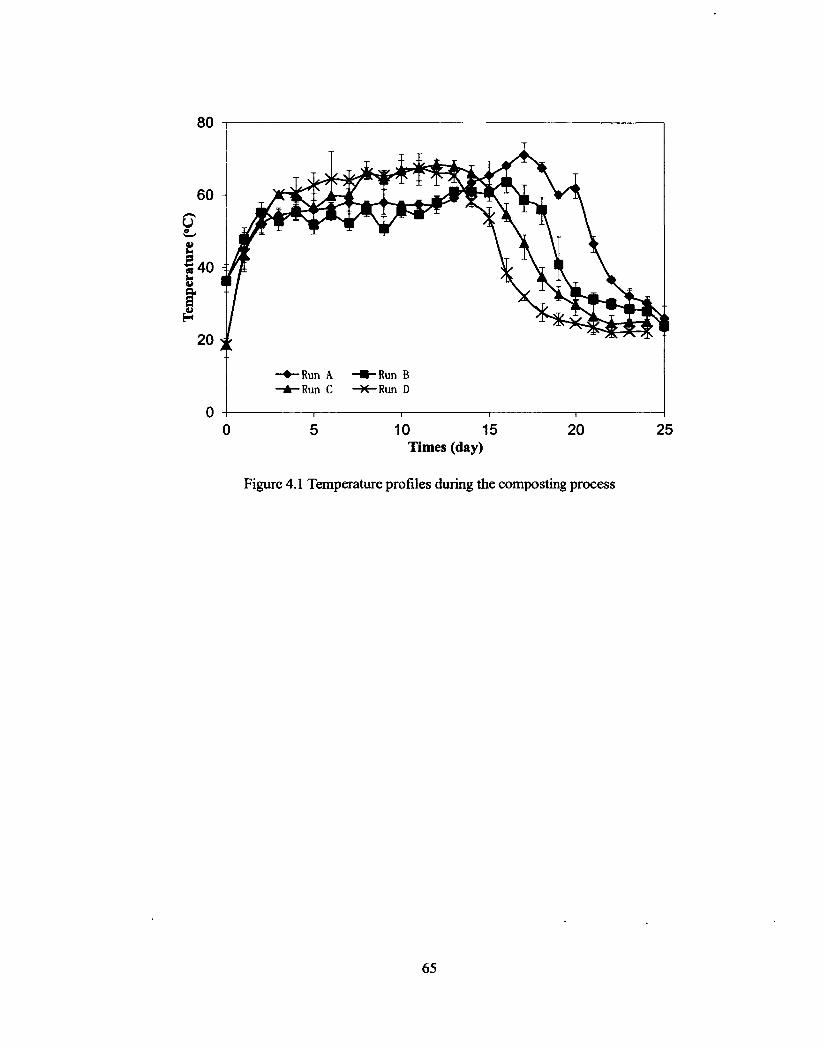
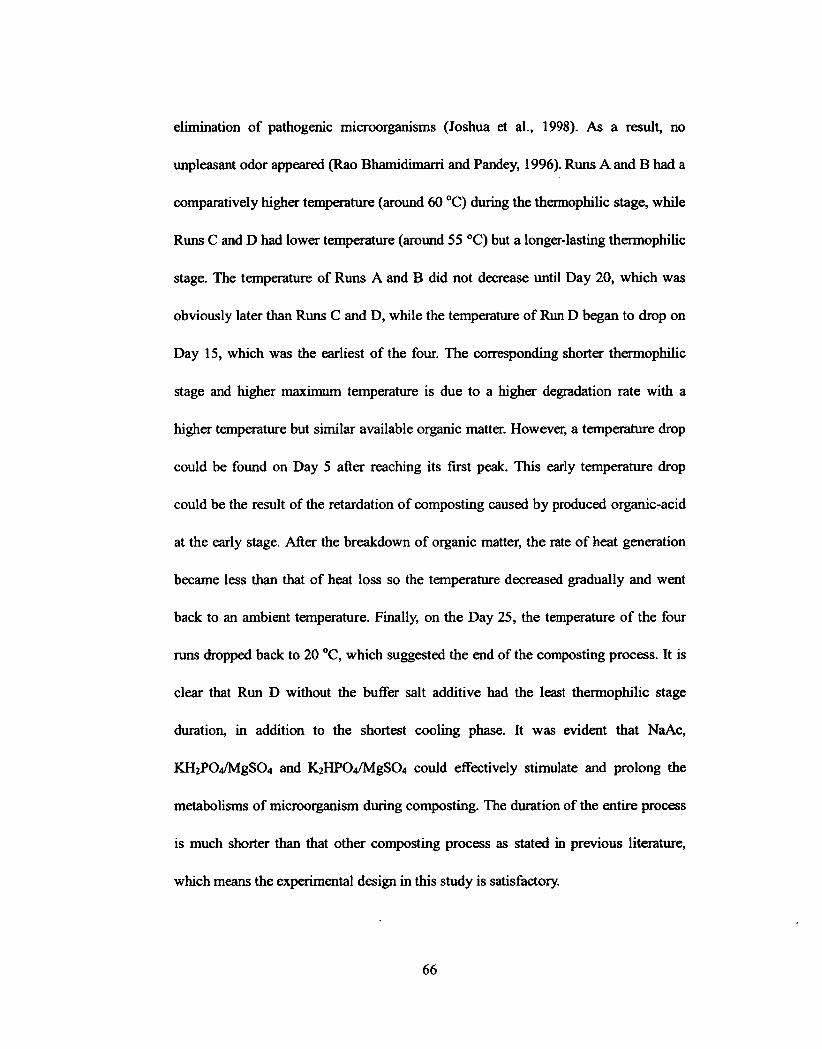
Figure 4.1 Temperature profiles during the composting process 65
Figure 4.2 pH profiles during the composting process 68
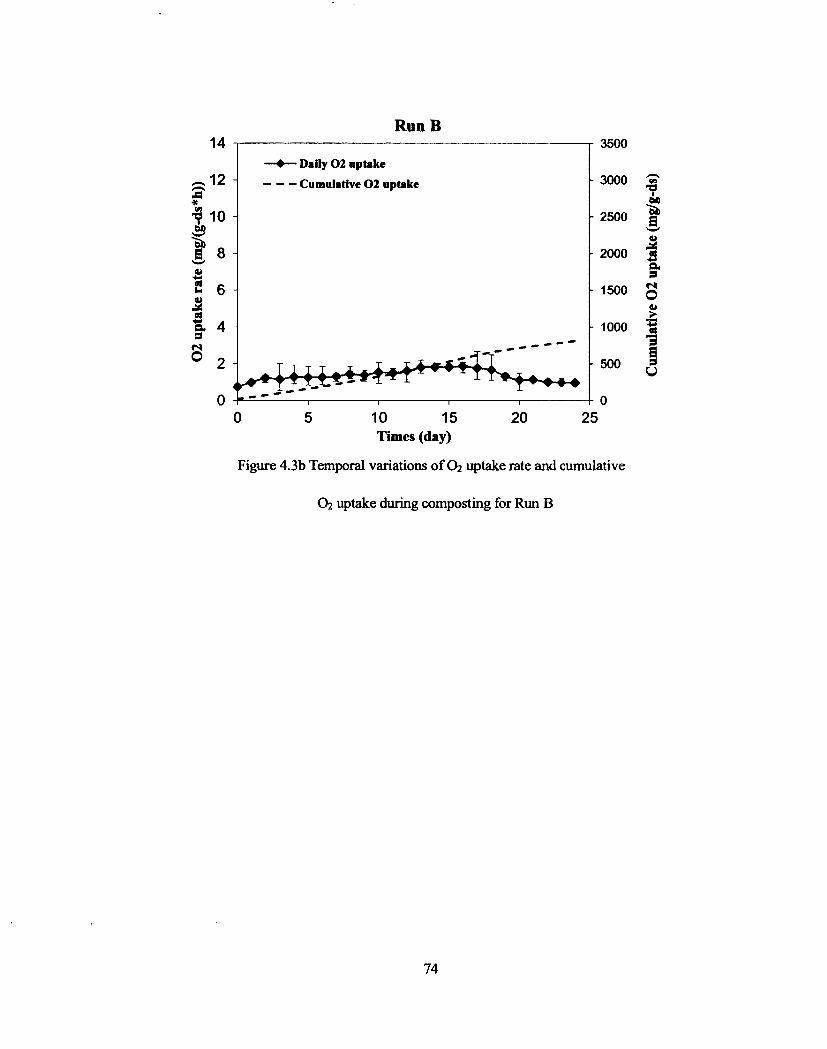
Figure 4.3a Temporal variations of 0 2 uptake rate and cumulative 0 2 uptake
during composting for Run A 73
Figure 4.3b Temporal variations of 02 uptake rate and cumulative 0 2 uptake
during composting for Run B 74
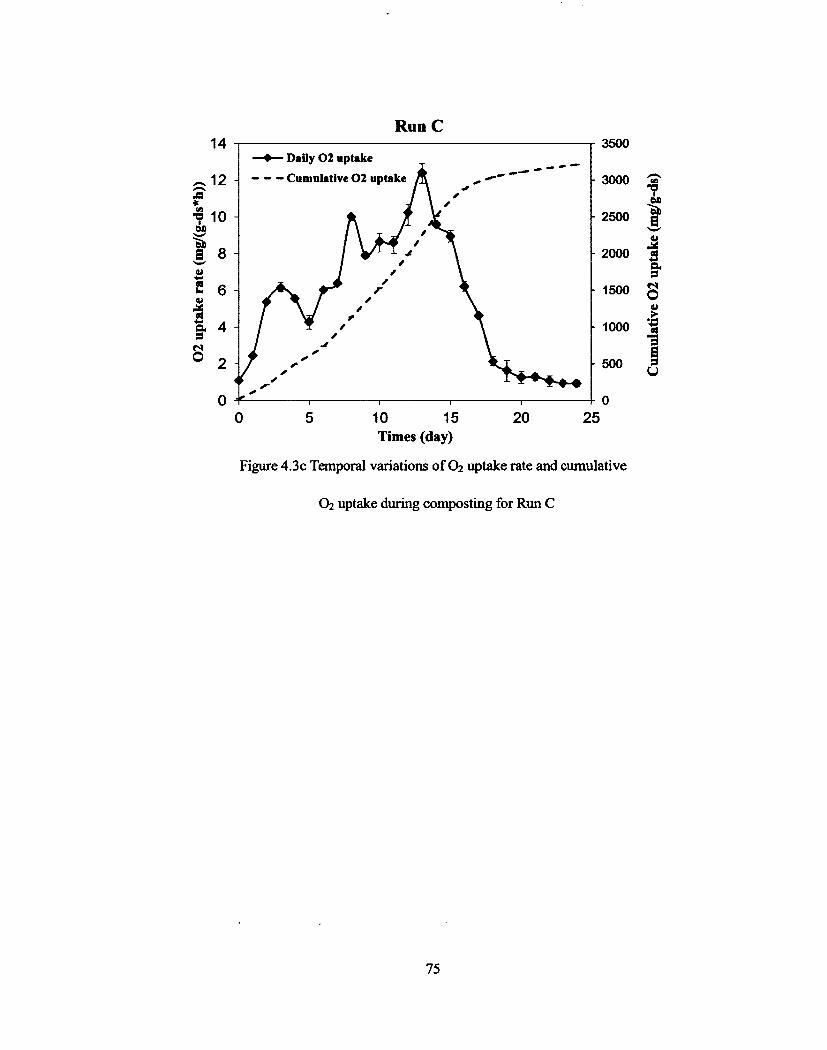
Figure 4.3c Temporal variations of 0 2 uptake rate and cumulative 0 2 uptake
during composting for Run C 75
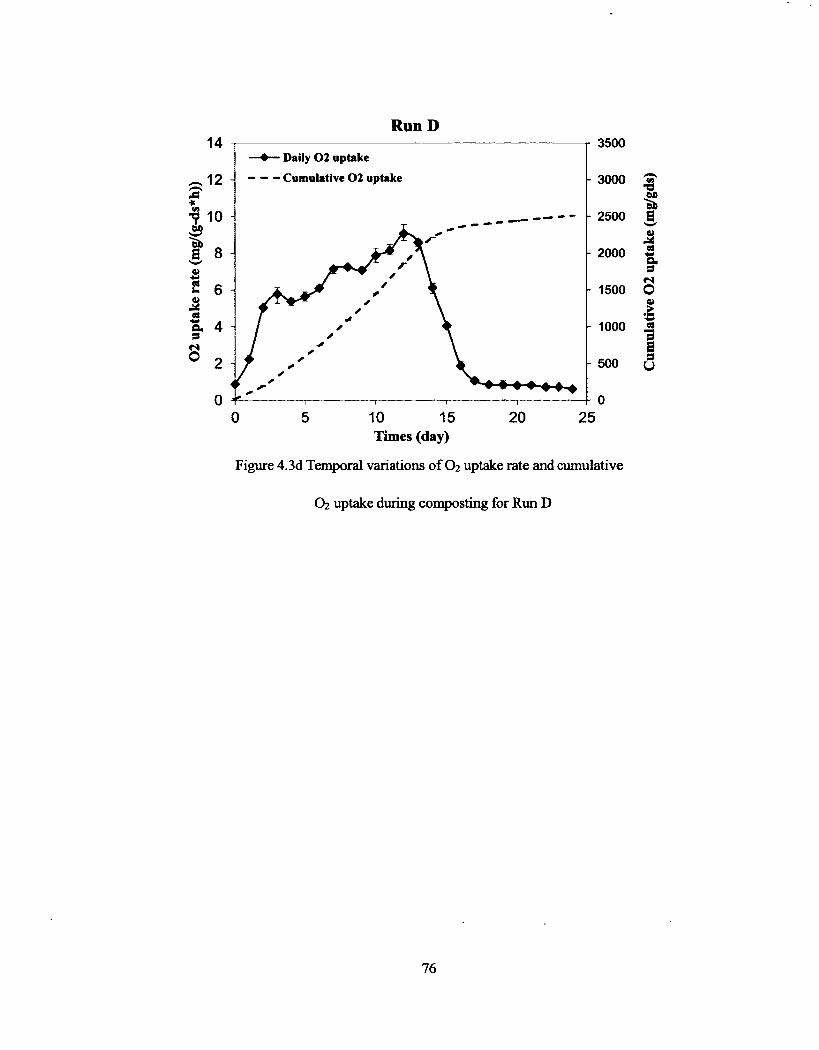
Figure 4.3d Temporal variations of 0 2 uptake rate and cumulative 0 2 uptake
during composting for Run D 76
Figure 4.4 Degradation rate profiles during the compostingprocess 80
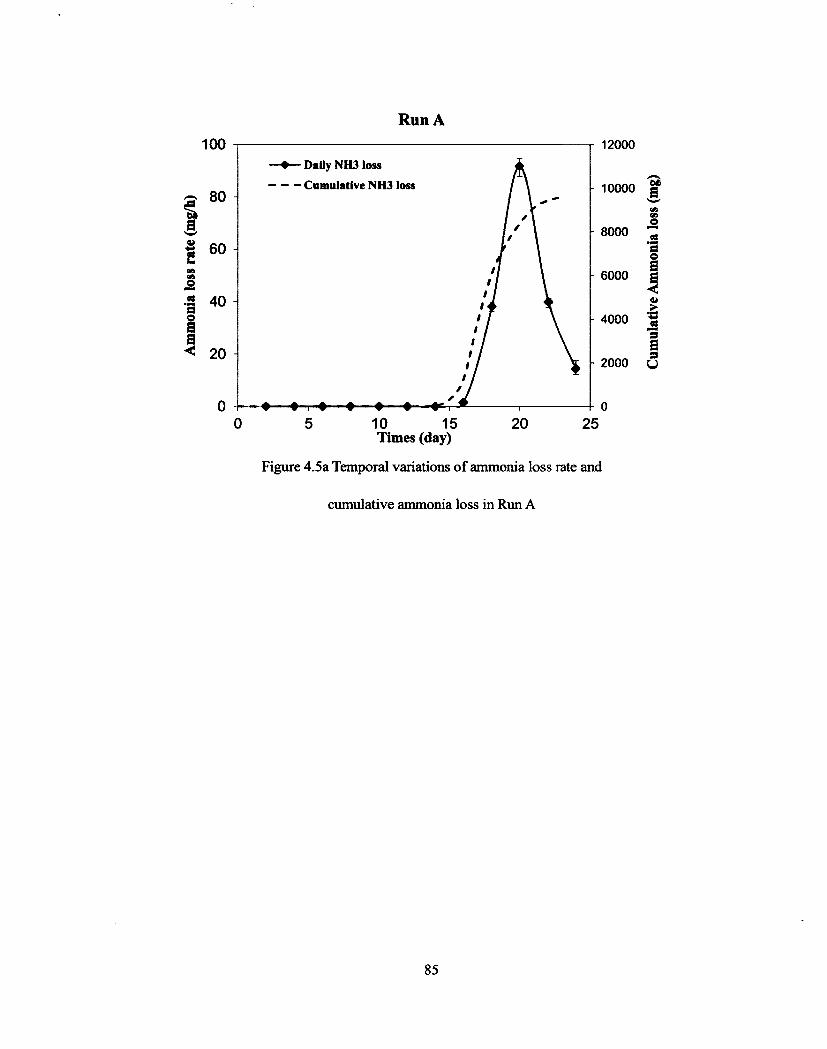
Figure 4.5a Temporal variations of ammonia loss rate and cumulative ammonia
loss in Run A 85
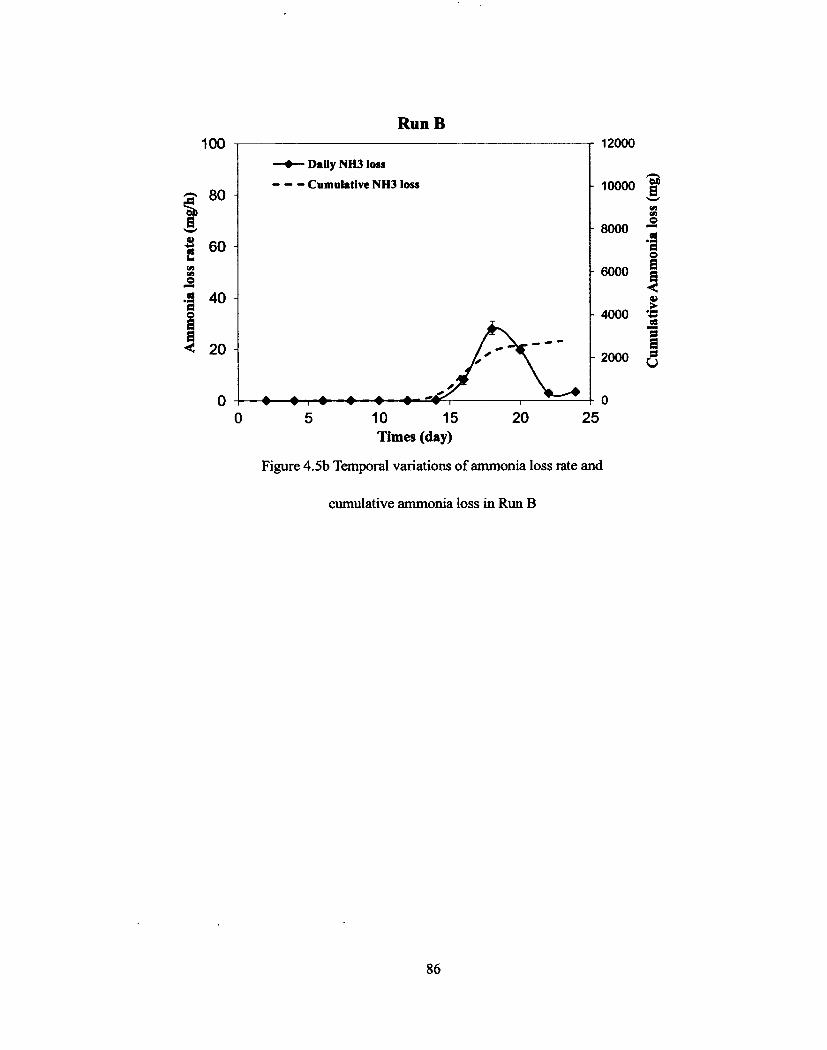
Figure 4.5b Temporal variations of ammonia loss rate and cumulative ammonia
loss in Run B 86
viii
LIST OF FIGURES
Figure 3.1 Schematic diagram of the composting system 44
Figure 3.2 Schematic diagram of the in-vessel reactor 45
Figure 3.3 Picture of the in-vessel composting reactor 46
Figure 3.4 Picture of the in-vessel composting reactor with insulation layer 47
Figure 3.5 Detailed procedure of sample testing 52
Figure 4.1 Temperature profiles during the composting process 65
Figure 4.2 pH profiles during the composting process 68
Figure 4.3a Temporal variations of O2 uptake rate and cumulative O2 uptake
during composting for Run A 73
Figure 4.3b Temporal variations of O2 uptake rate and cumulative O2 uptake
during composting for Run B 74
Figure 4.3c Temporal variations of O2 uptake rate and cumulative O2 uptake
during composting for Run C 75
Figure 4.3d Temporal variations of O2 uptake rate and cumulative O2 uptake
during composting for Run D 76
Figure 4.4 Degradation rate profiles during the compostingprocess 80
Figure 4.5a Temporal variations of ammonia loss rate and cumulative ammonia
loss in Run A 85
Figure 4.5b Temporal variations of ammonia loss rate and cumulative ammonia
loss in Run B 86
Vlll
Page 12
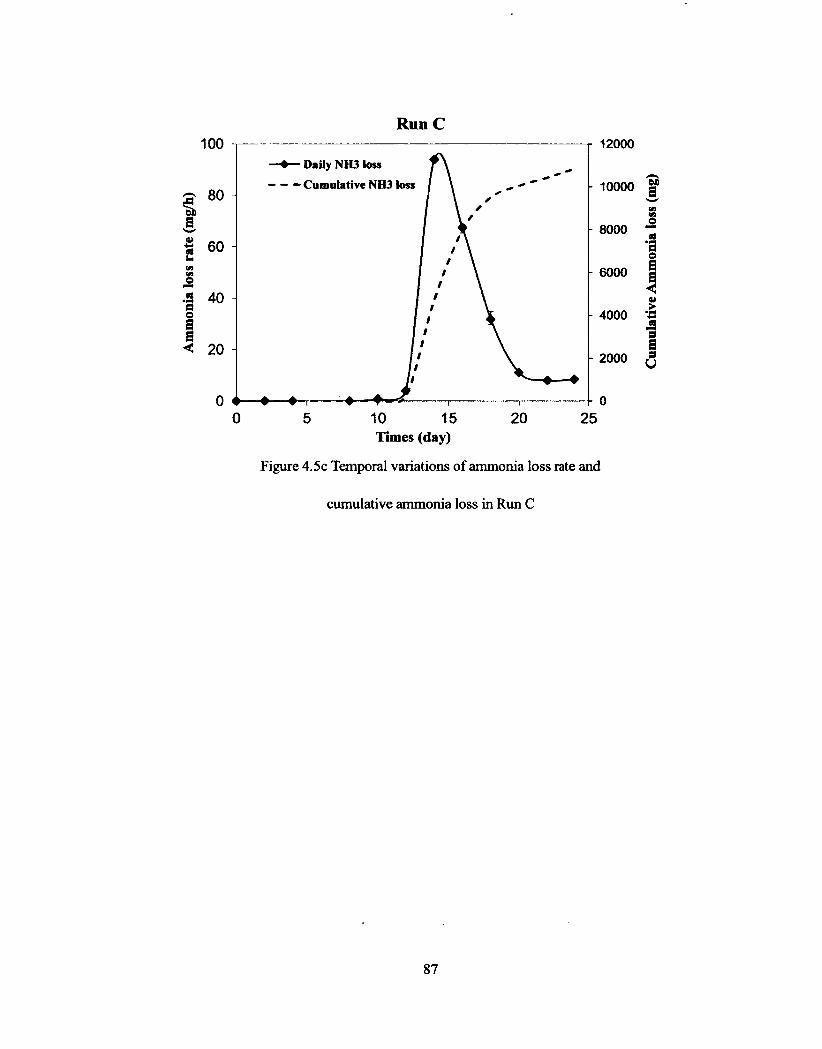
Figure 4.5c Temporal variations of ammonia loss rate and cumulative ammonia
loss in Run C 87
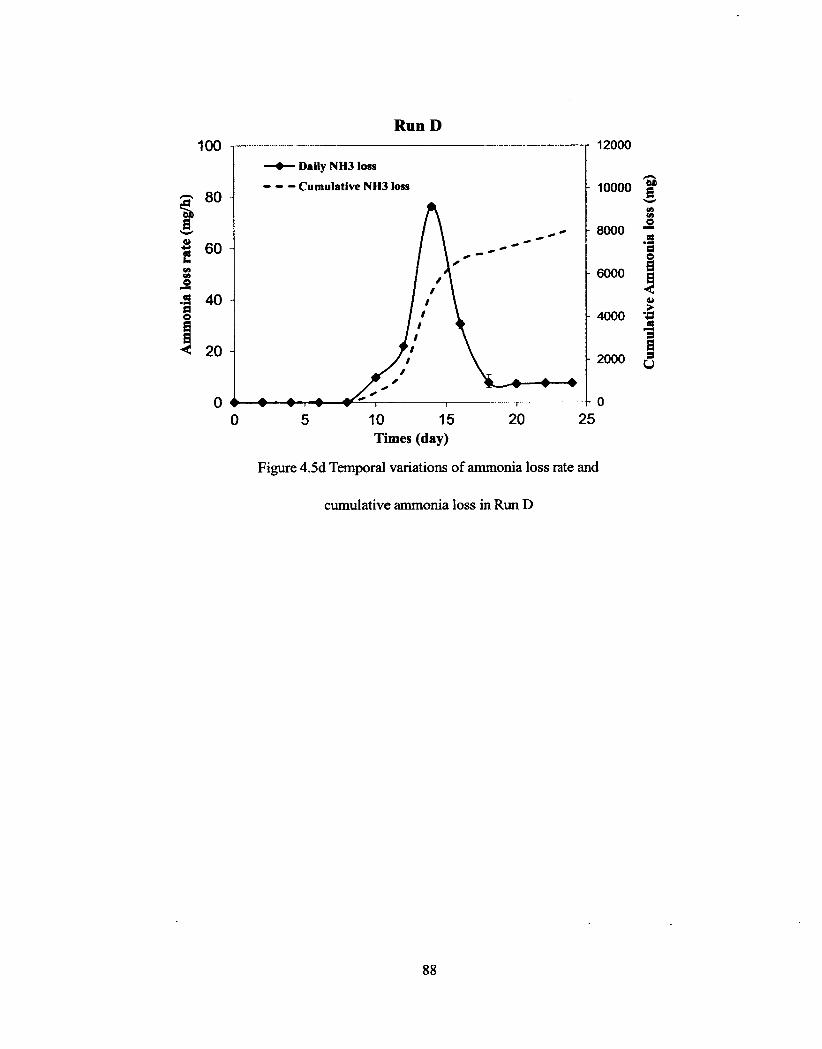
Figure 4.5d Temporal variations of ammonia loss rate and cumulative ammonia
loss in Run D 88
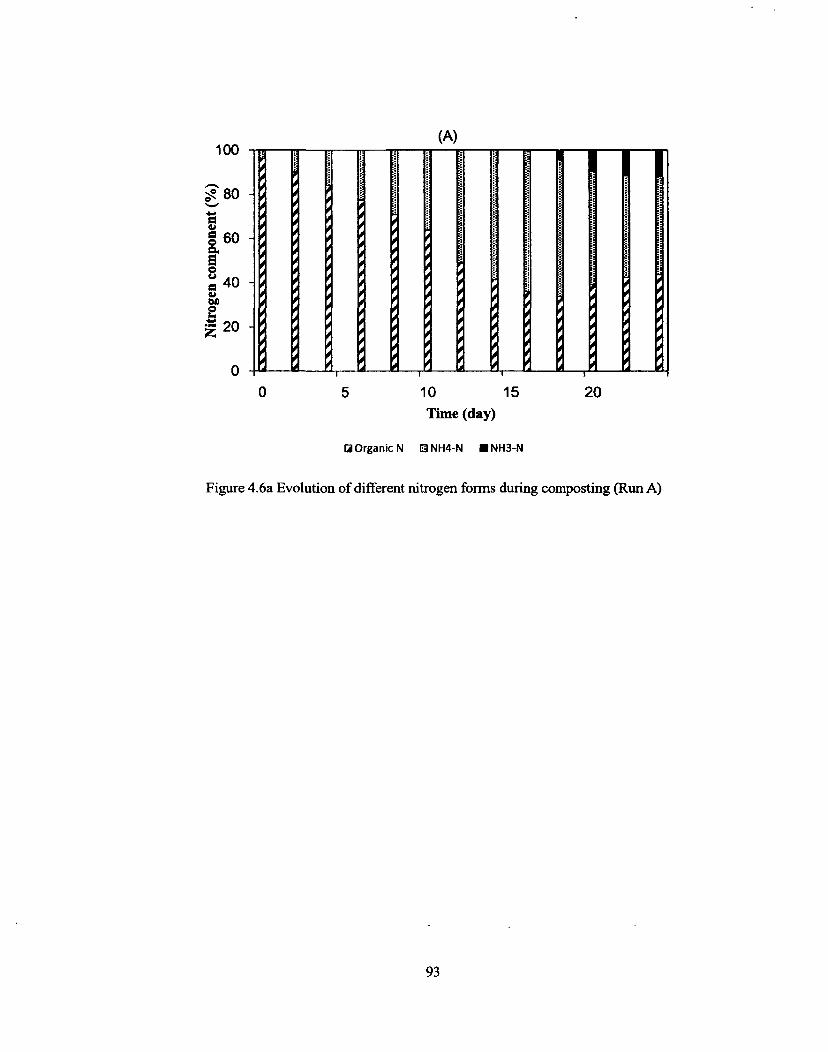
Figure 4.6a Evolution of different nitrogen forms during composting (Run A) 93
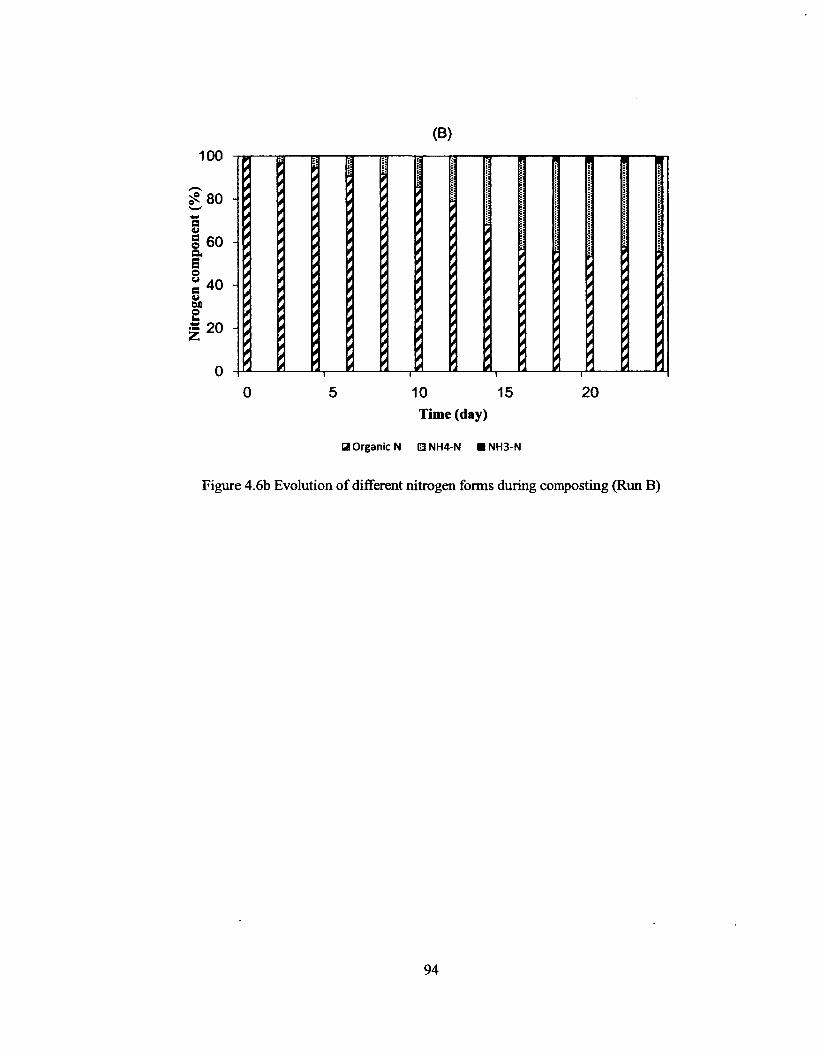
Figure 4.6b Evolution of different nitrogen forms during composting (Run B) 94
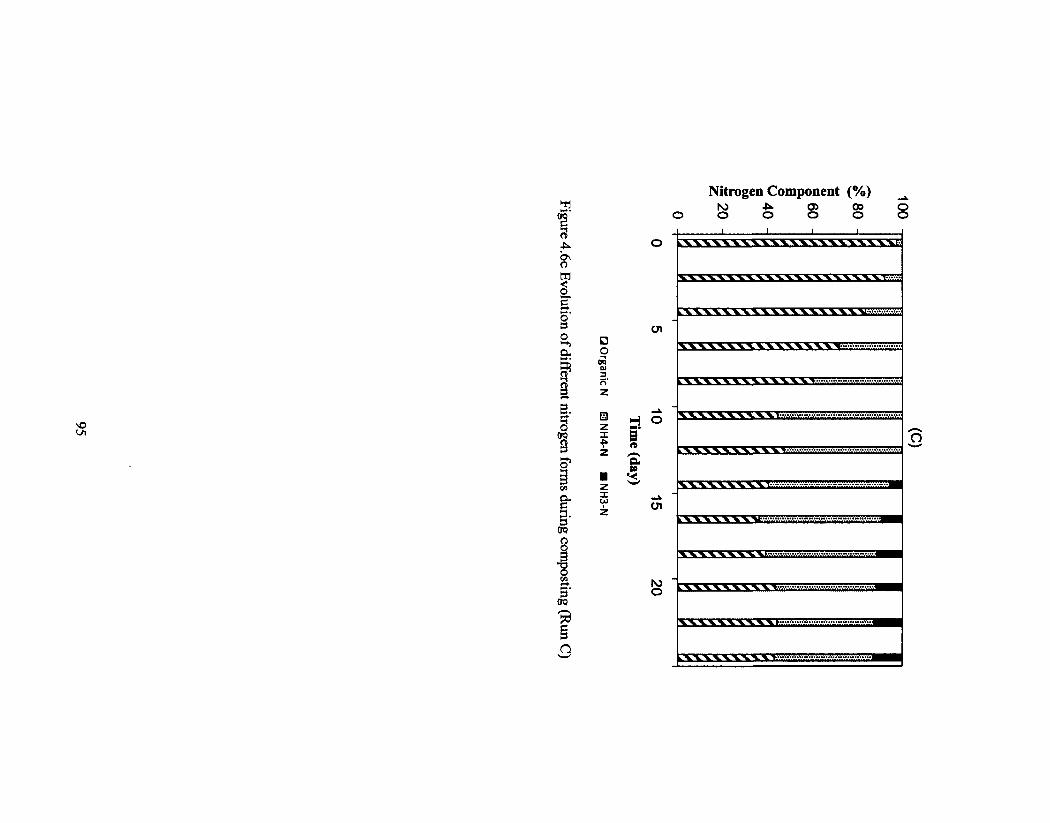
Figure 4.6c Evolution of different nitrogen forms during composting (Run C) 95
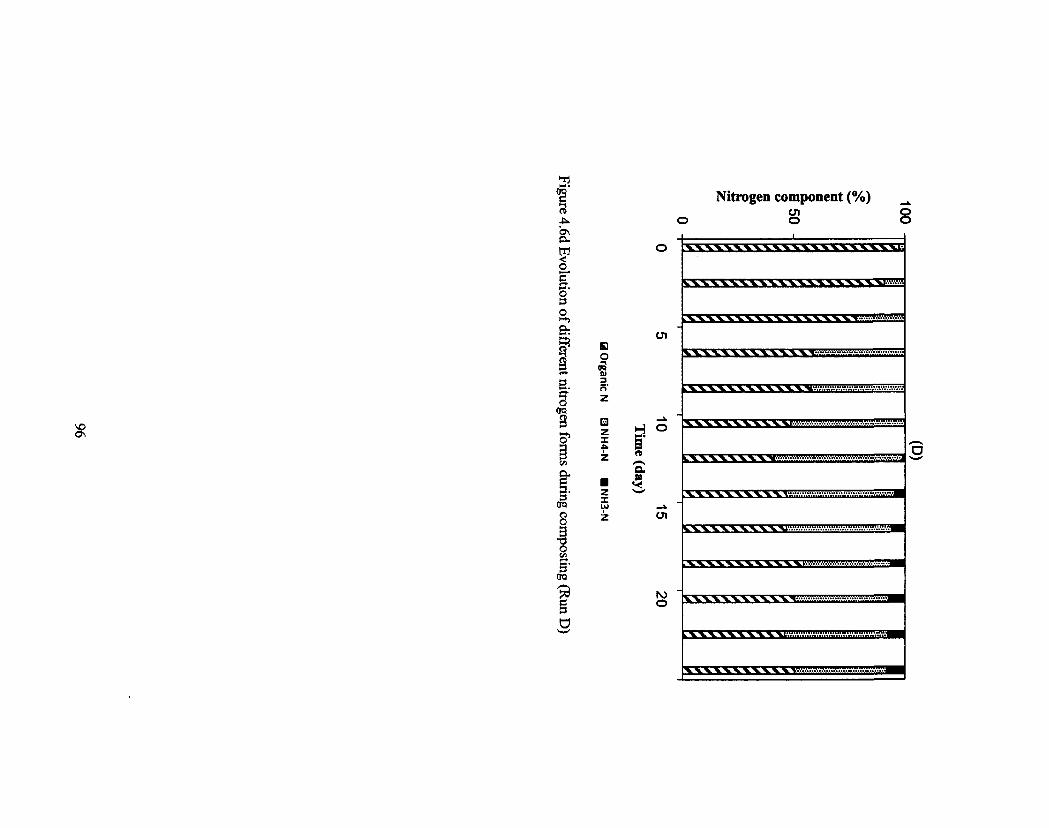
Figure 4.6d Evolution of different nitrogen forms during composting (Run D) 96
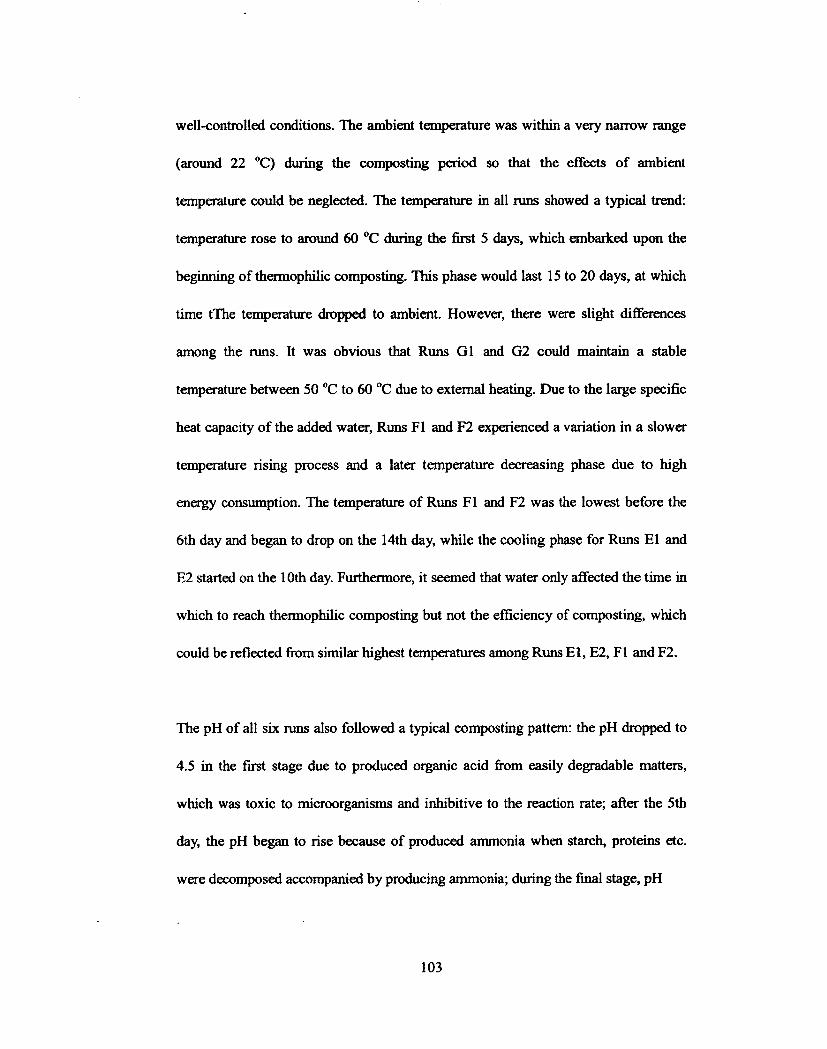
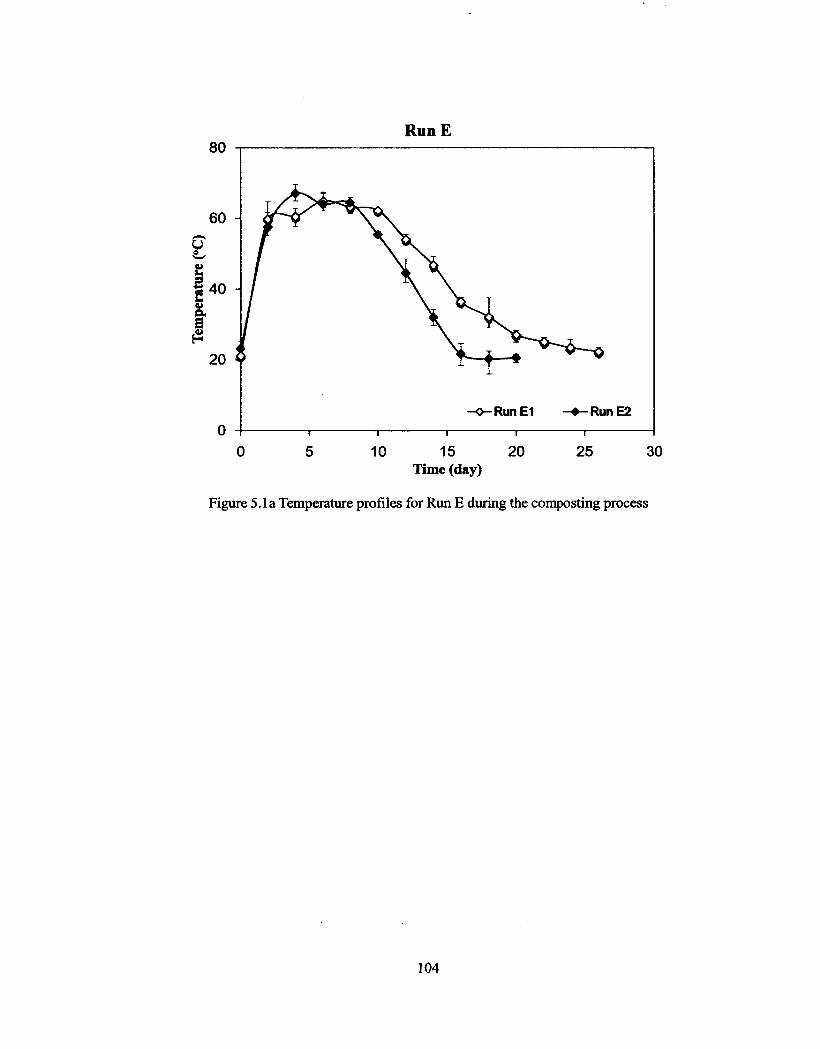
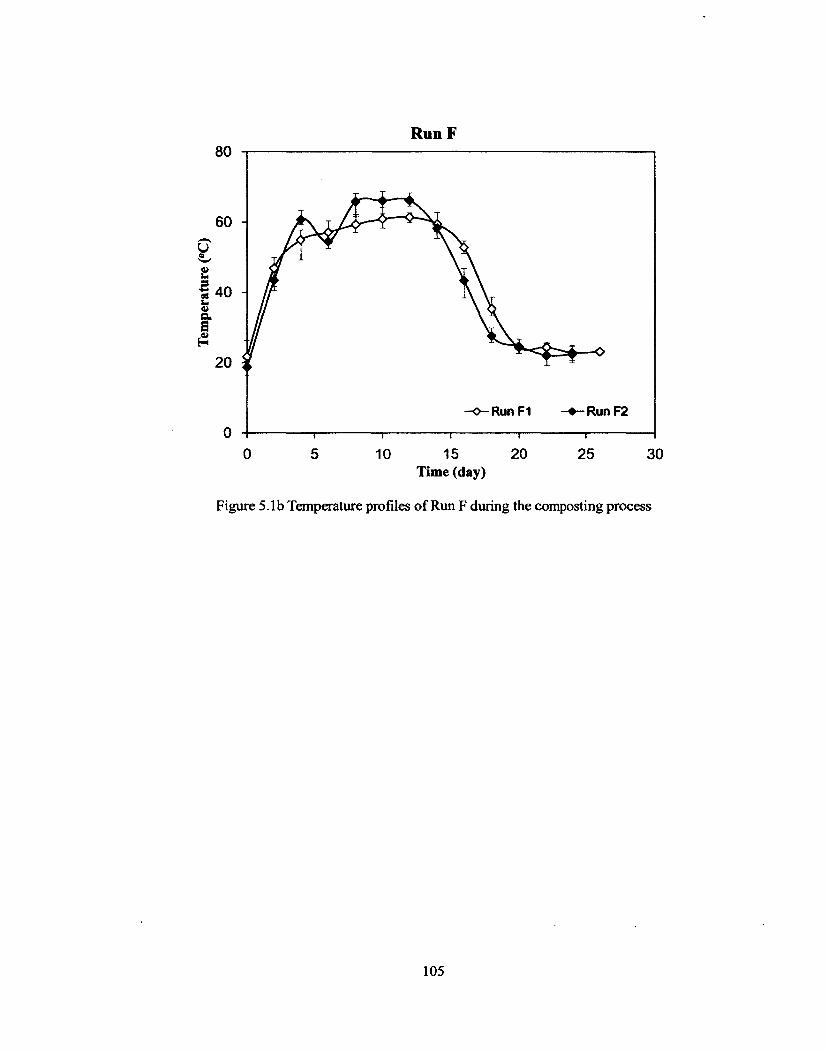
Figure 5.1a Temperature profiles for Run E during the composting process ....104
Figure 5.1b Temperature profiles of Run F during the composting process 105
Figure 5.1c Temperature profiles of Run G during the composting process 106
Figure 5.2a pH profiles for Run E during the composting process 107
Figure 5.2b pH profiles for Run E during the composting process 108
Figure 5.2c pH profiles of Run G during the composting process 109
Figure 5.3a Degradation rate profiles by model prediction and experiment
measurement for Run El 115
Figure 5.3b Degradation rate profiles by model prediction and experiment
measurement for Run E2 116
Figure 5.3c Degradation rate profiles by model prediction and experiment
measurement for Run Fl 117
Figure 5.3d Degradation rate profiles by model prediction and experiment
ix
Figure 4.5c Temporal variations of ammonia loss rate and cumulative ammonia
loss in Run C 87
Figure 4.5d Temporal variations of ammonia loss rate and cumulative ammonia
loss in Run D 88
Figure 4.6a Evolution of different nitrogen forms during composting (Run A) ..93
Figure 4.6b Evolution of different nitrogen forms during composting (Run B)..94
Figure 4.6c Evolution of different nitrogen forms during composting (Run C)..95
Figure 4.6d Evolution of different nitrogen forms during composting (Run D) .96
Figure 5.1a Temperature profiles for Run E during the composting process .... 104
Figure 5.1b Temperature profiles of Run F during the composting process 105
Figure 5.1c Temperature profiles of Run G during the composting process 106
Figure 5.2a pH profiles for Run E during the composting process 107
Figure 5.2b pH profiles for Run E during the composting process 108
Figure 5.2c pH profiles of Run G during the composting process 109
Figure 5.3a Degradation rate profiles by model prediction and experiment
measurement for Run El 115
Figure 5.3b Degradation rate profiles by model prediction and experiment
measurement for Run E2 116
Figure 5.3c Degradation rate profiles by model prediction and experiment
measurement for Run F1 117
Figure 5.3d Degradation rate profiles by model prediction and experiment
IX
Page 13
measurement for Run F2 118
Figure 5.3e Degradation rate profiles by model prediction and experiment
measurement for Run G1 119
Figure 5.3f Degradation rate profiles by model prediction and experiment
measurement for Run G2 120
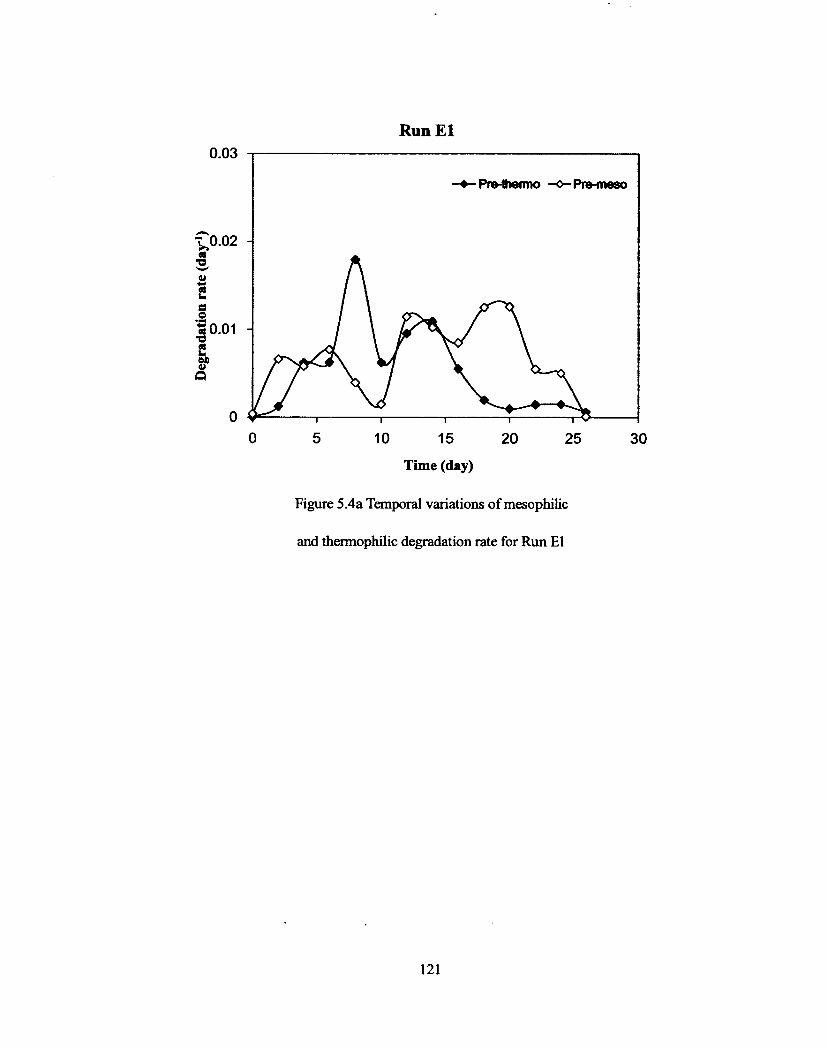
Figure 5.4a Temporal variations of mesophilic and thermophilic degradation rate
for Run El 121
Figure 5.4b Temporal variations of mesophilic and thermophilic degradation rate
for Run E2 122
Figure 5 Ac Temporal variations of mesophilic and thermophilic degradation rate
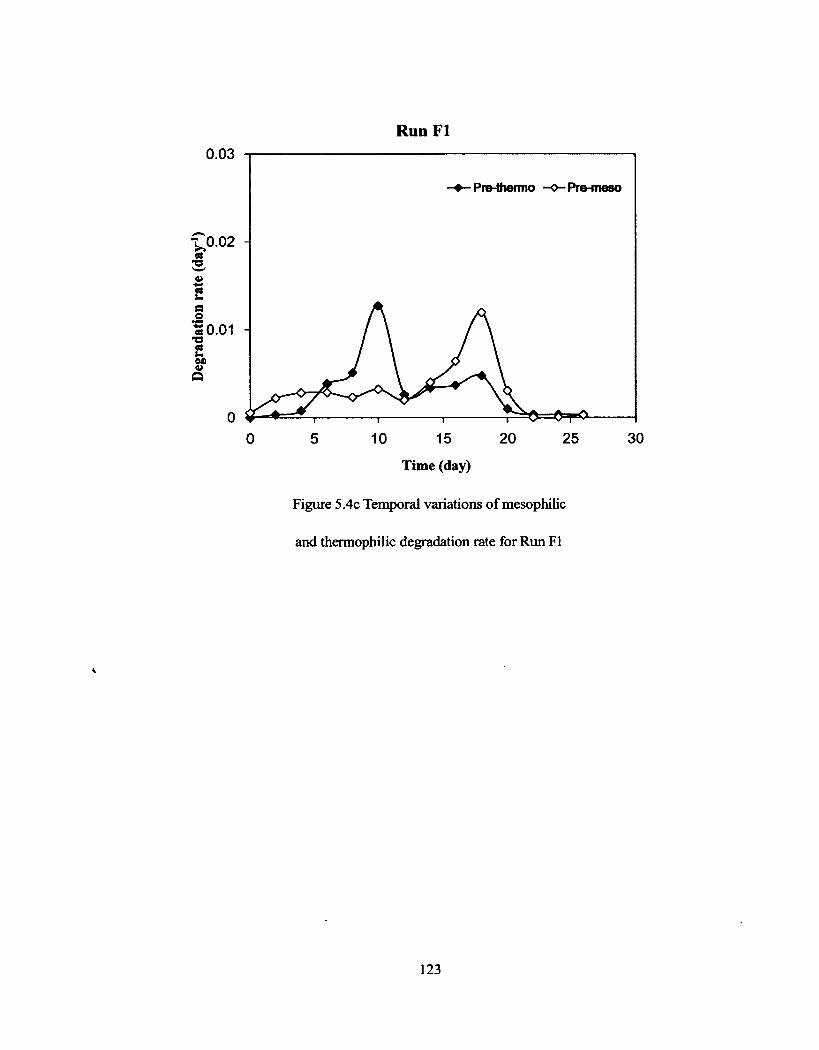
for Run Fl 123
Figure 5.4d Temporal variations of mesophilic and thermophilic degradation rate
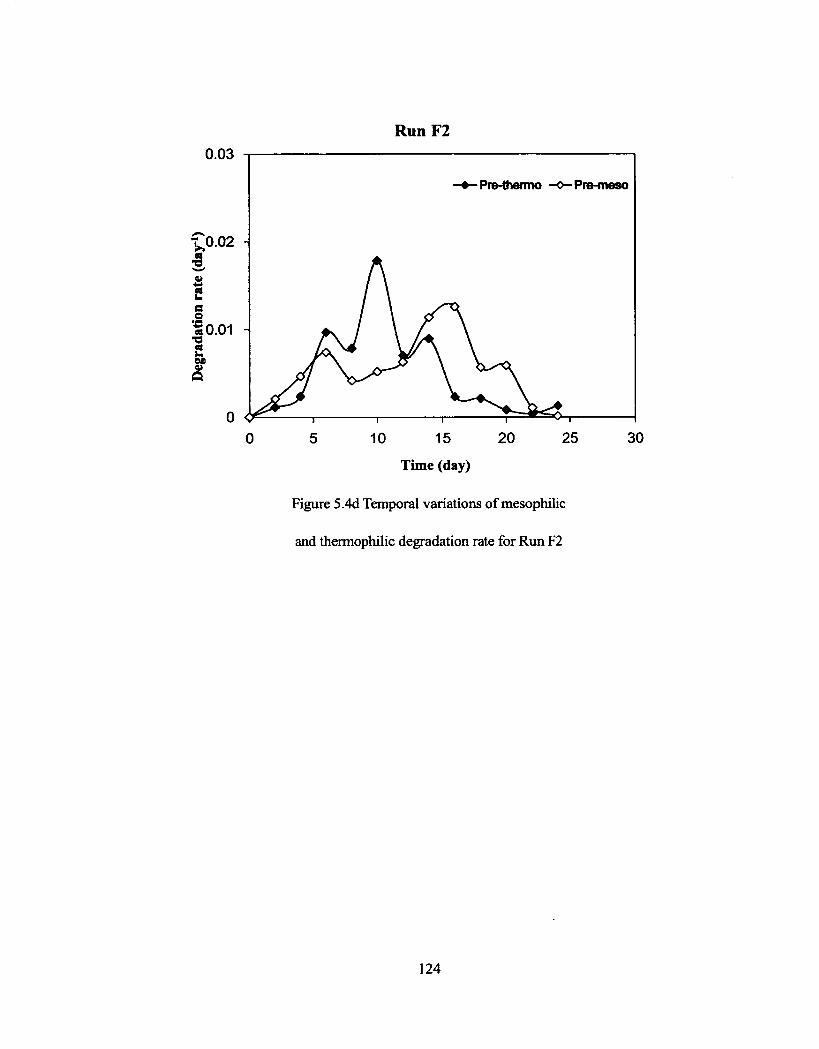
for Run F2 124
Figure 5.4e Temporal variations of mesophilic and thermophilic degradation rate
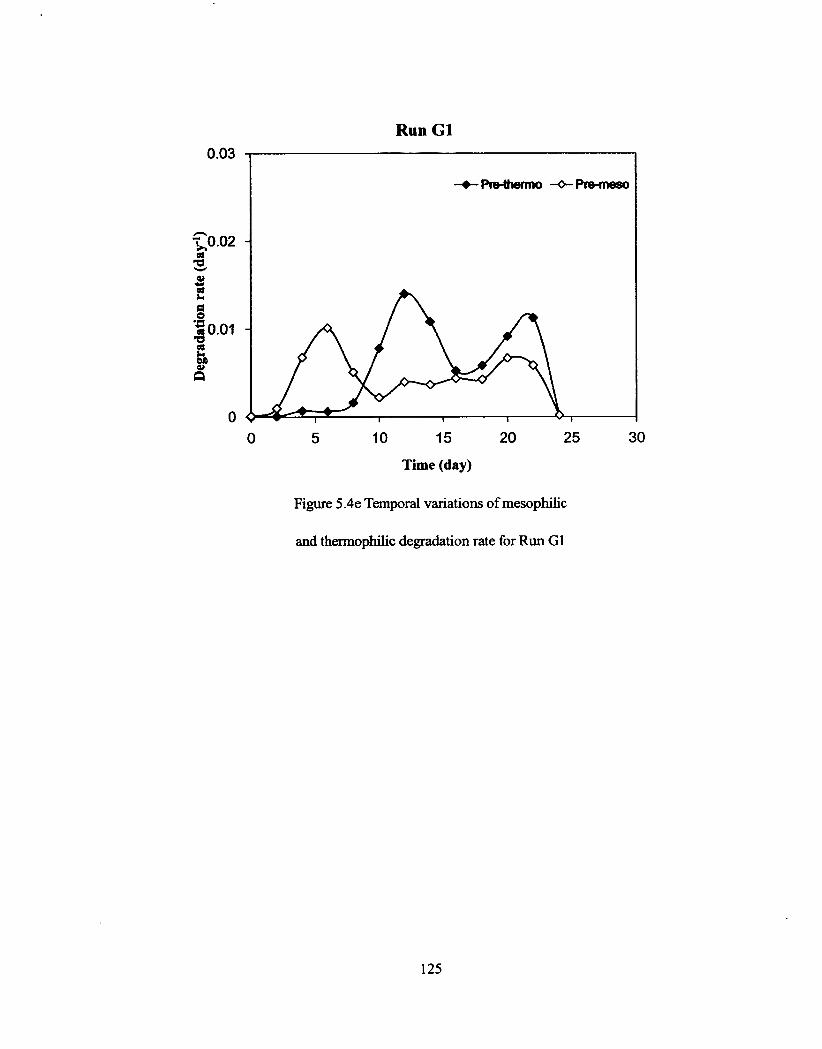
for Run G1 125
Figure 5.4f Temporal variations of mesophilic and thermophilic degradation rate
for Run G2 126
Figure 5.5a Normal probability plot of residues in modified Monod equation (Run
El) 129
Figure 5.5b Normal probability plot of residues in modified Monod equation (Run
E2) 130
x
measurement for Run F2 118
Figure 5.3e Degradation rate profiles by model prediction and experiment
measurement for Run G1 119
Figure 5.3f Degradation rate profiles by model prediction and experiment
measurement for Run G2 120
Figure 5.4a Temporal variations of mesophilic and thermophilic degradation rate
for Run El 121
Figure 5.4b Temporal variations of mesophilic and thermophilic degradation rate
for Run E2 122
Figure 5.4c Temporal variations of mesophilic and thermophilic degradation rate
for Run F1 123
Figure 5.4d Temporal variations of mesophilic and thermophilic degradation rate
for Run F2 124
Figure 5,4e Temporal variations of mesophilic and thermophilic degradation rate
for Run G1 125
Figure 5.4f Temporal variations of mesophilic and thermophilic degradation rate
for Run G2 126
Figure 5.5a Normal probability plot of residues in modified Monod equation (Run
El) 129
Figure 5.5b Normal probability plot of residues in modified Monod equation (Run
E2) 130
Page 14
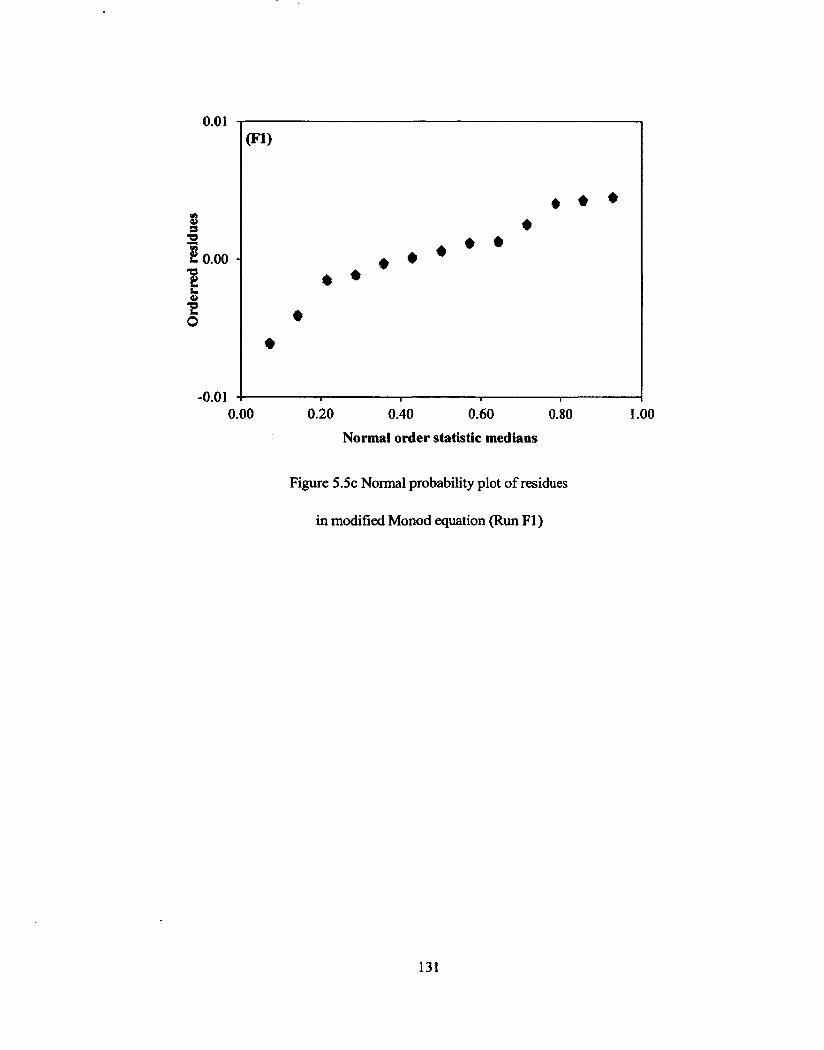
Figure 5.5c Normal probability plot of residues in modified Monod equation (Run
F l ) 131
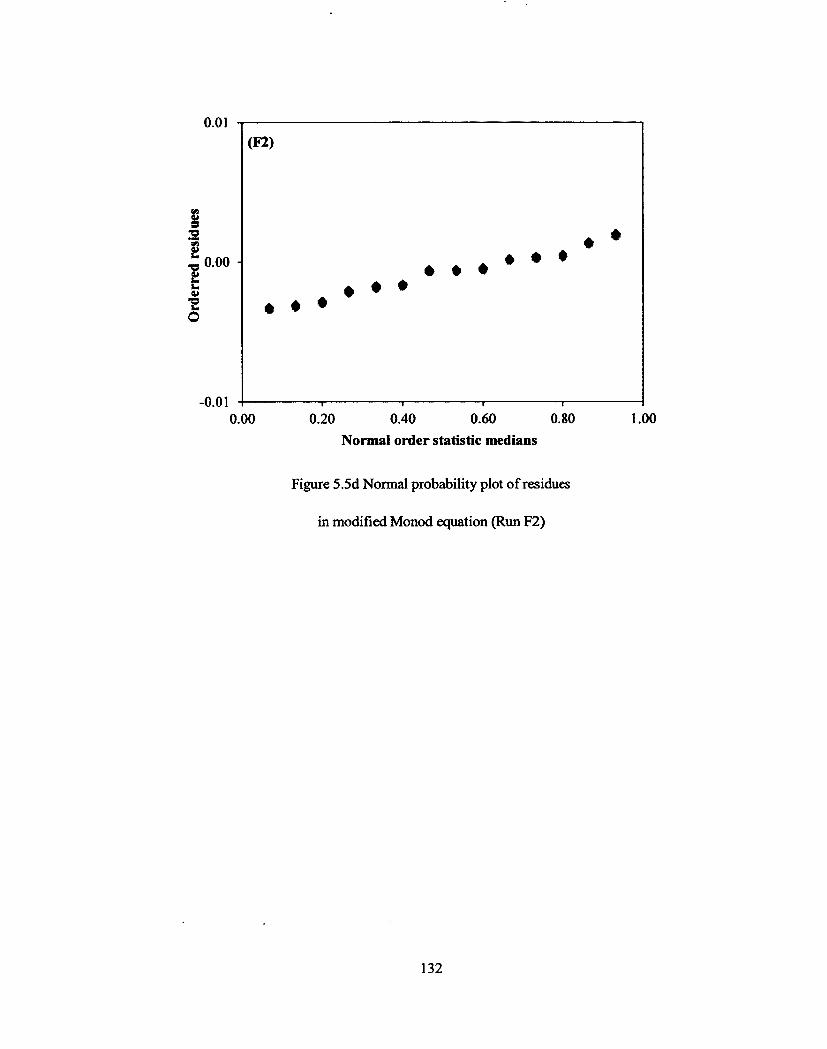
Figure 5.5d Normal probability plot of residues in modified Monod equation (Run
F2) 132
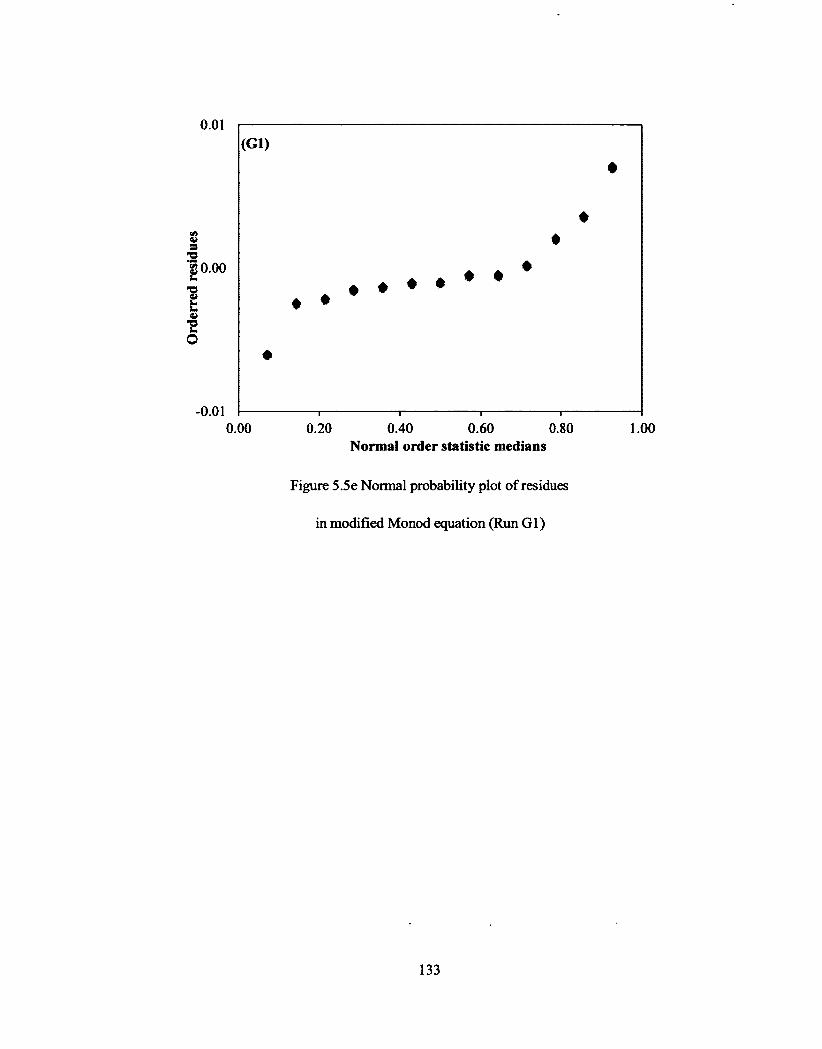
Figure 5.5e Normal probability plot of residues in modified Monod equation (Run
Gl) 133
Figure 5.5f Normal probability plot of residues in modified Monod equation (Run
G2) 134
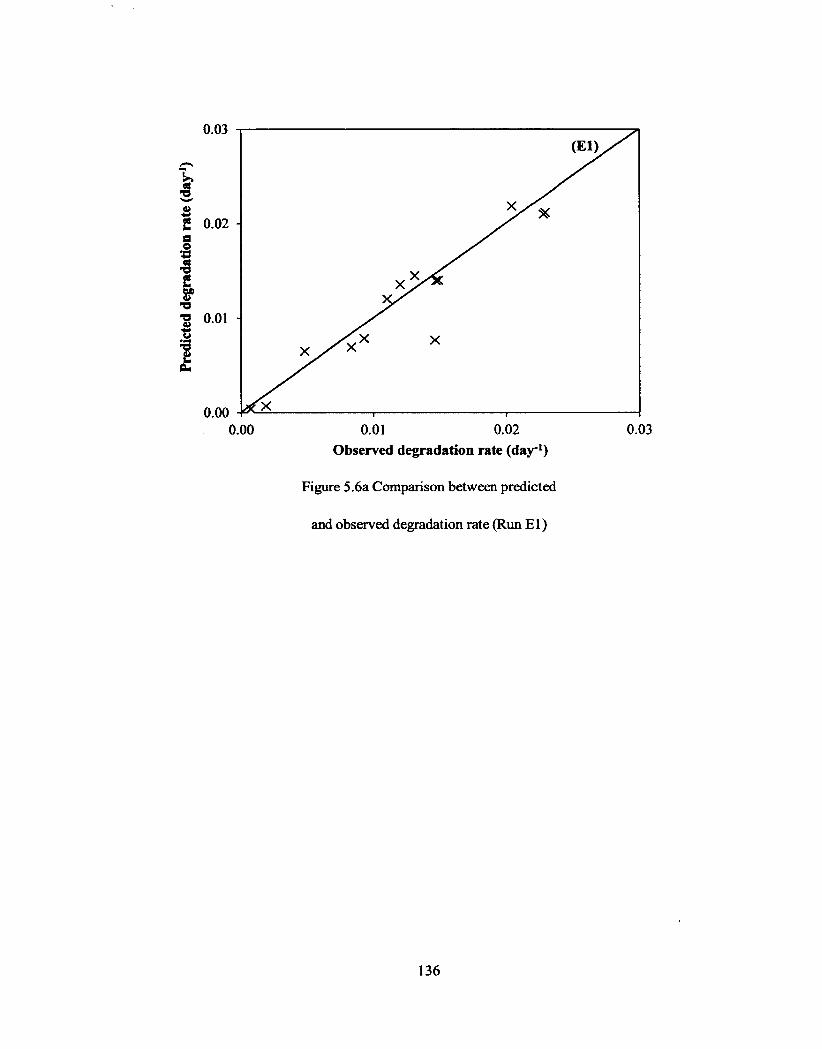
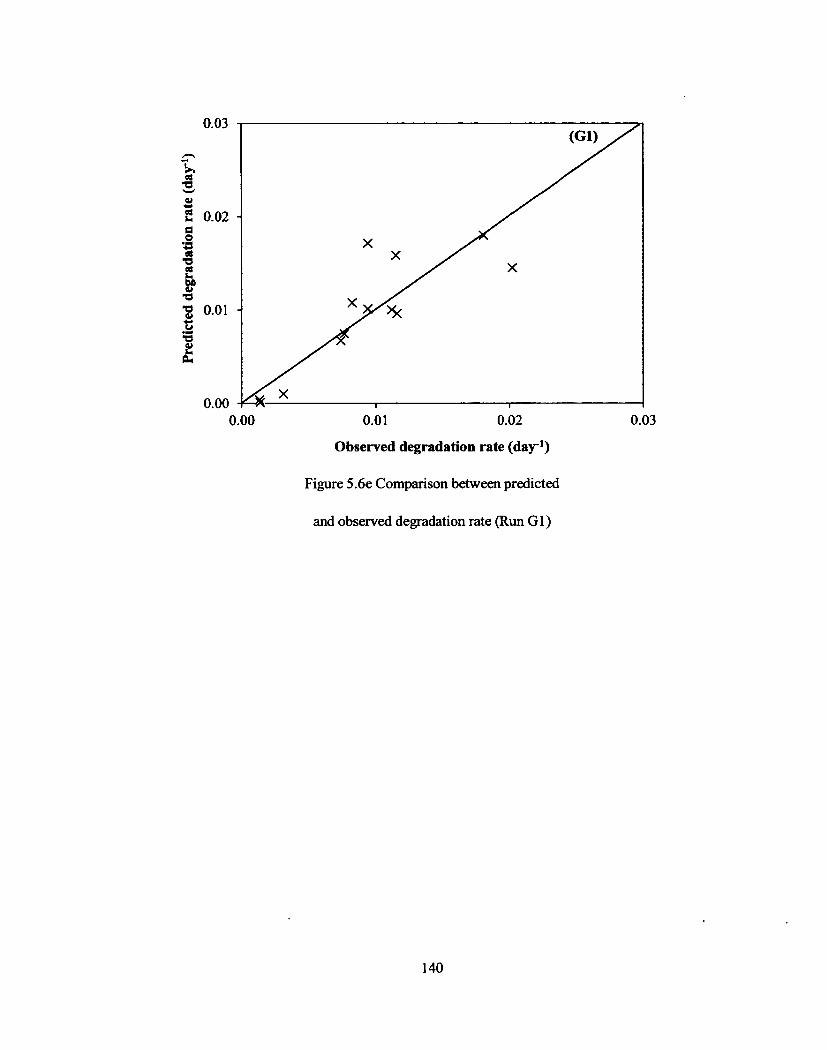
Figure 5.6a Comparison between predicted and observed degradation rate (Run
El) 136
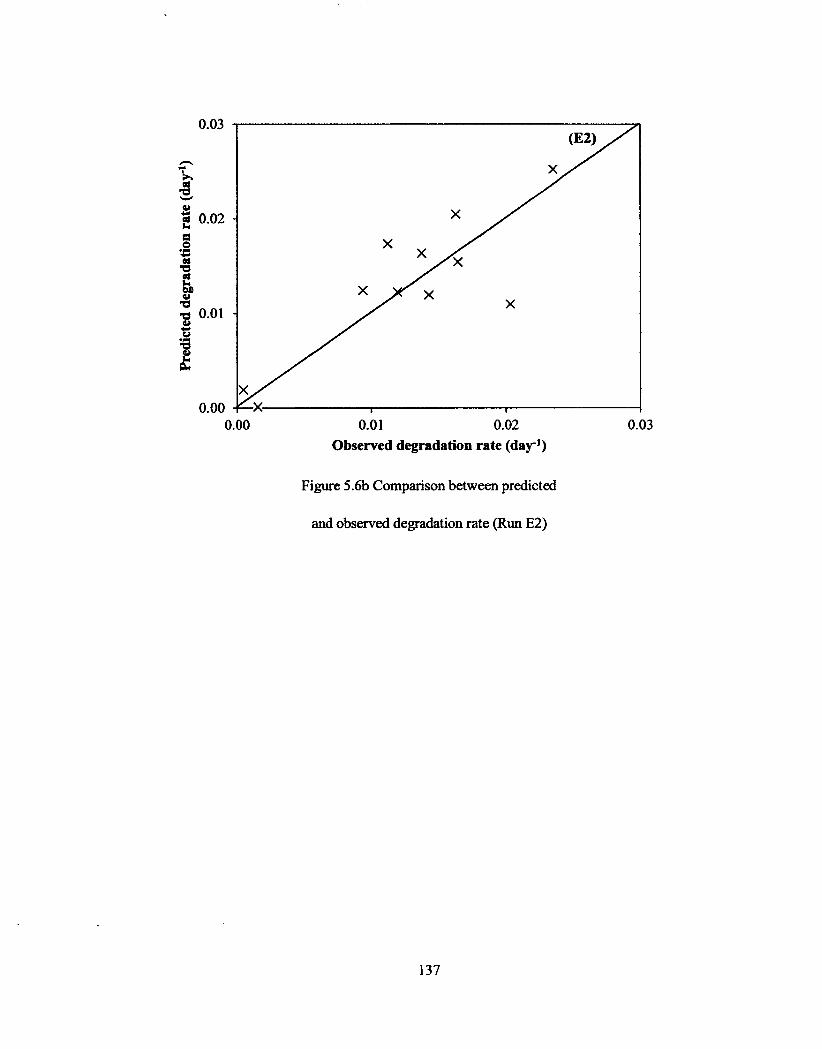
Figure 5.6b Comparison between predicted and observed degradation rate (Run
E2) 137
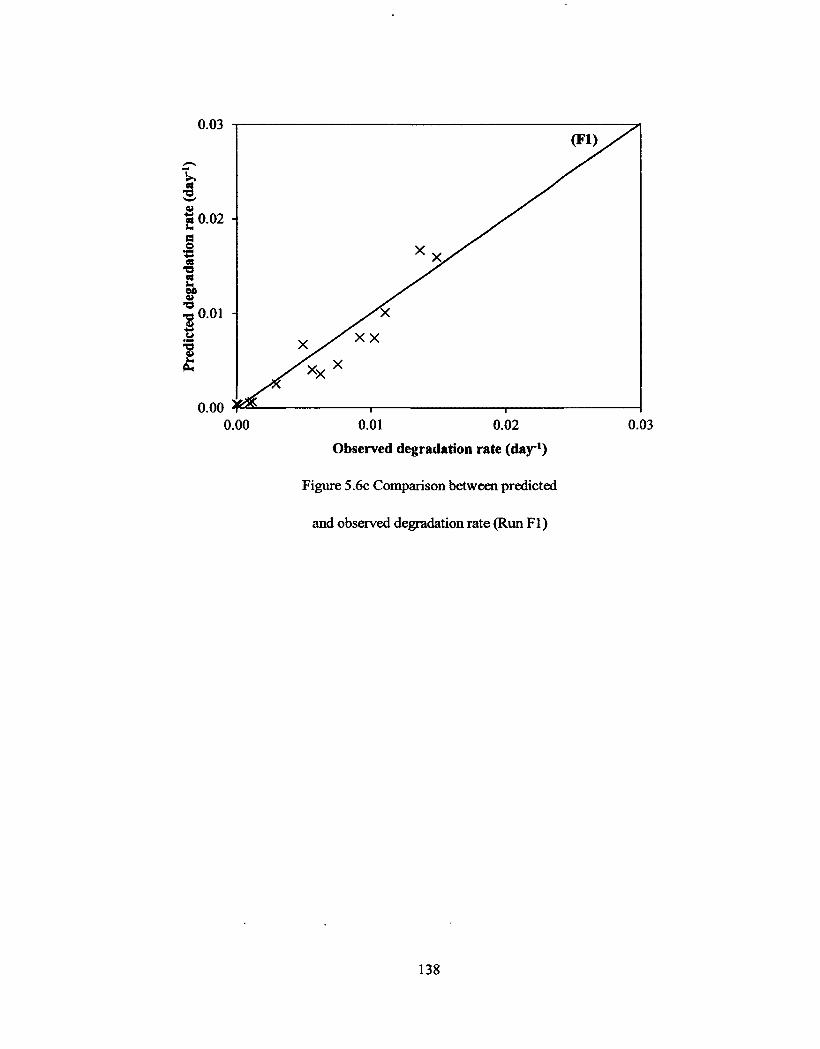
Figure 5.6c Comparison between predicted and observed degradation rate (Run
Fl) 138
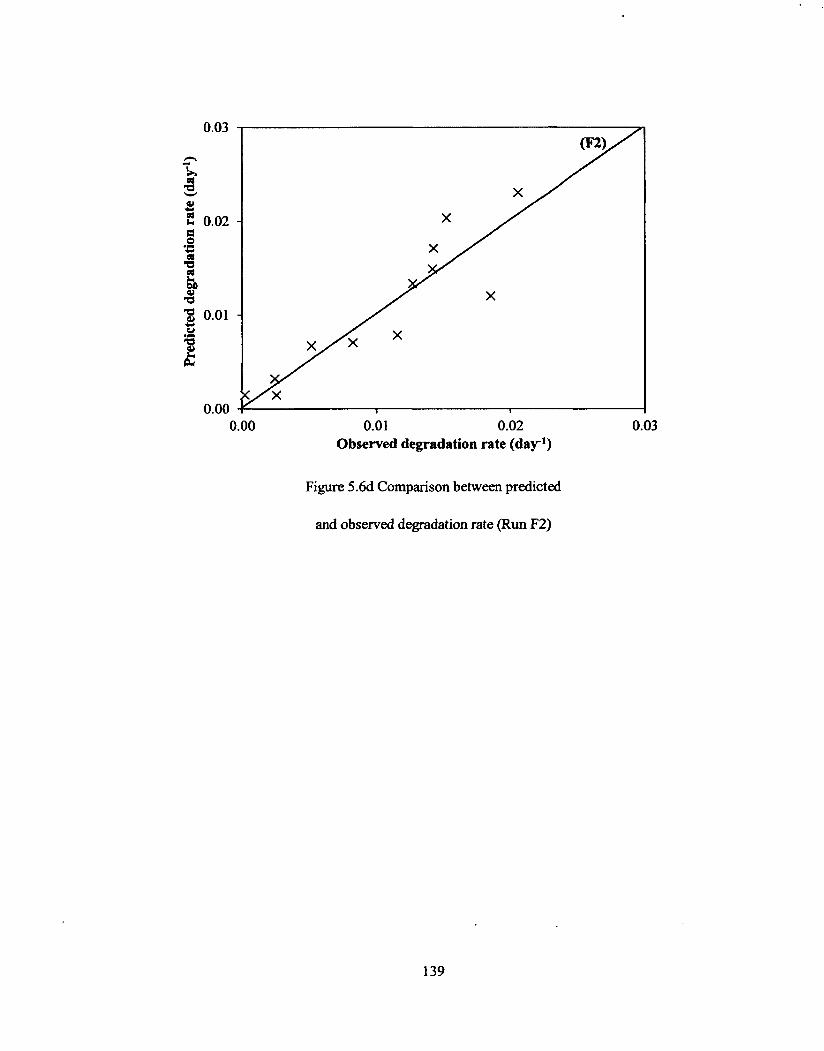
Figure 5.6d Comparison between predicted and observed degradation rate (Run
F2) 139
Figure 5.6e Comparison between predicted and observed degradation rate (Run
G I ) 140
Figure 5.6f Comparison between predicted and observed degradation rate (Run
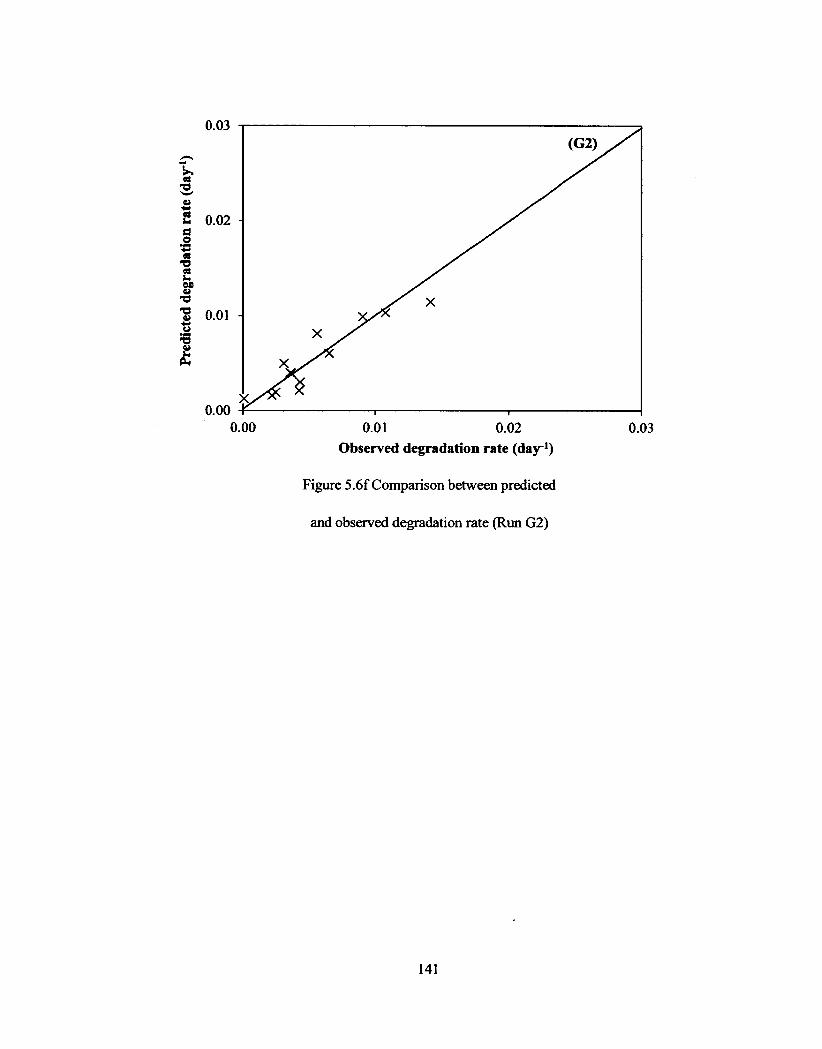
G2) 141
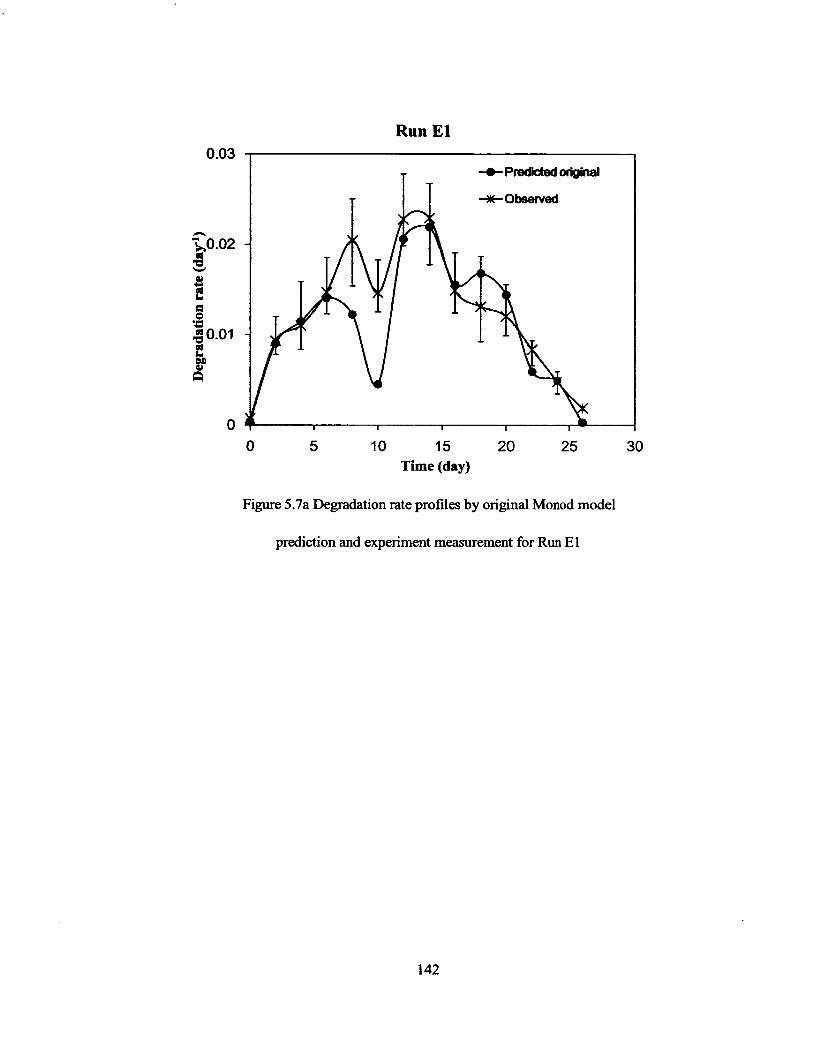
Figure 5.7a Degradation rate profiles by original Monod model prediction and
xi
Figure 5.5c Normal probability plot of residues in modified Monod equation (Run
Fl) 131
Figure 5.5d Normal probability plot of residues in modified Monod equation (Run
F2) 132
Figure 5.5e Normal probability plot of residues in modified Monod equation (Run
Gl) 133
Figure 5.5f Normal probability plot of residues in modified Monod equation (Run
G2) 134
Figure 5.6a Comparison between predicted and observed degradation rate (Run
El) 136
Figure 5.6b Comparison between predicted and observed degradation rate (Run
E2) 137
Figure 5.6c Comparison between predicted and observed degradation rate (Run
Fl) 138
Figure 5.6d Comparison between predicted and observed degradation rate (Run
F2) 139
Figure 5.6e Comparison between predicted and observed degradation rate (Run
Gl) 140
Figure 5.6f Comparison between predicted and observed degradation rate (Run
G2) 141
Figure 5.7a Degradation rate profiles by original Monod model prediction and
XI
Page 15
experiment measurement for Run El 142
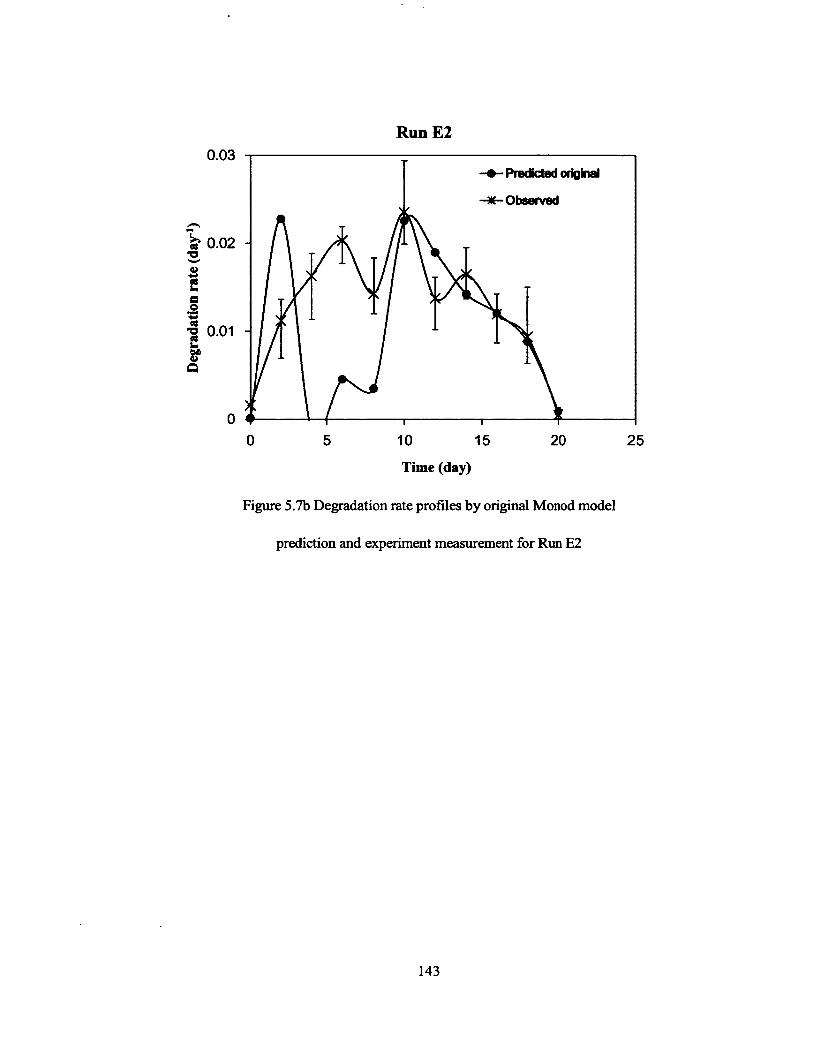
Figure 5.7b Degradation rate profiles by original Monod model prediction and
experiment measurement for Run E2 143
Figure 5.7c Degradation rate profiles by original Monod model prediction and
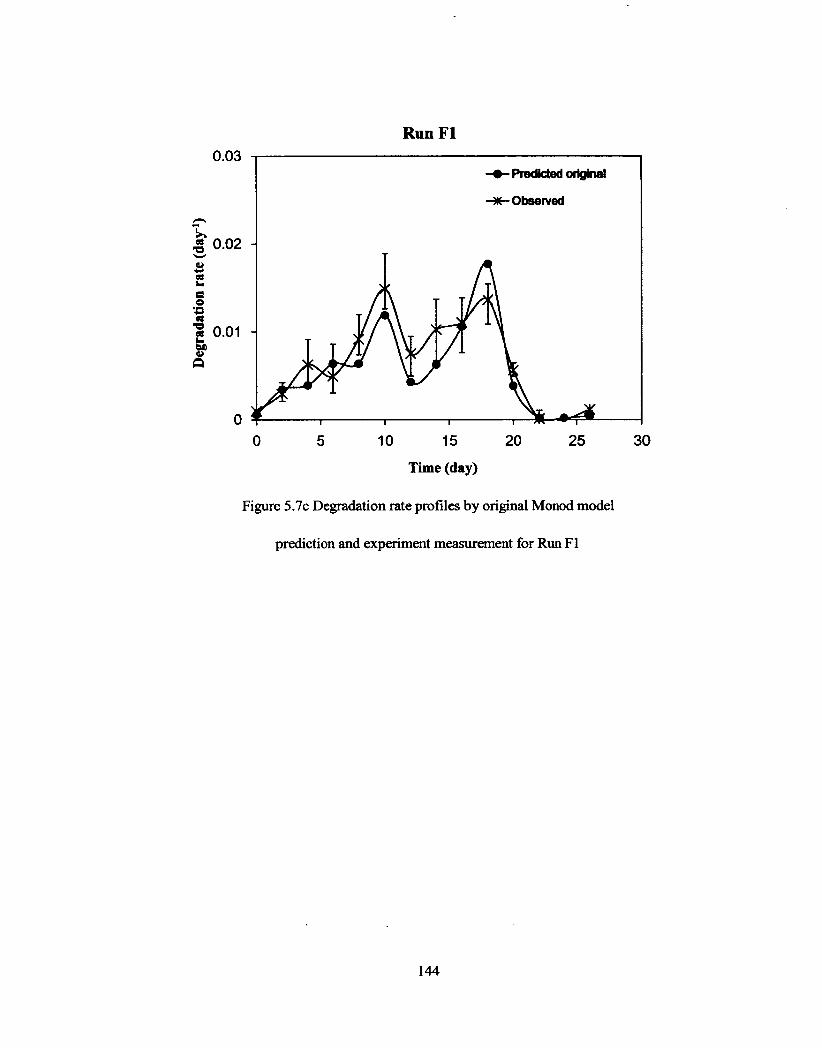
experiment measurement for Run Fl 144
Figure 5.7d Degradation rate profiles by original Monod model prediction and
experiment measurement for Run F2 145
Figure 5.7e Degradation rate profiles by original Monod model prediction and
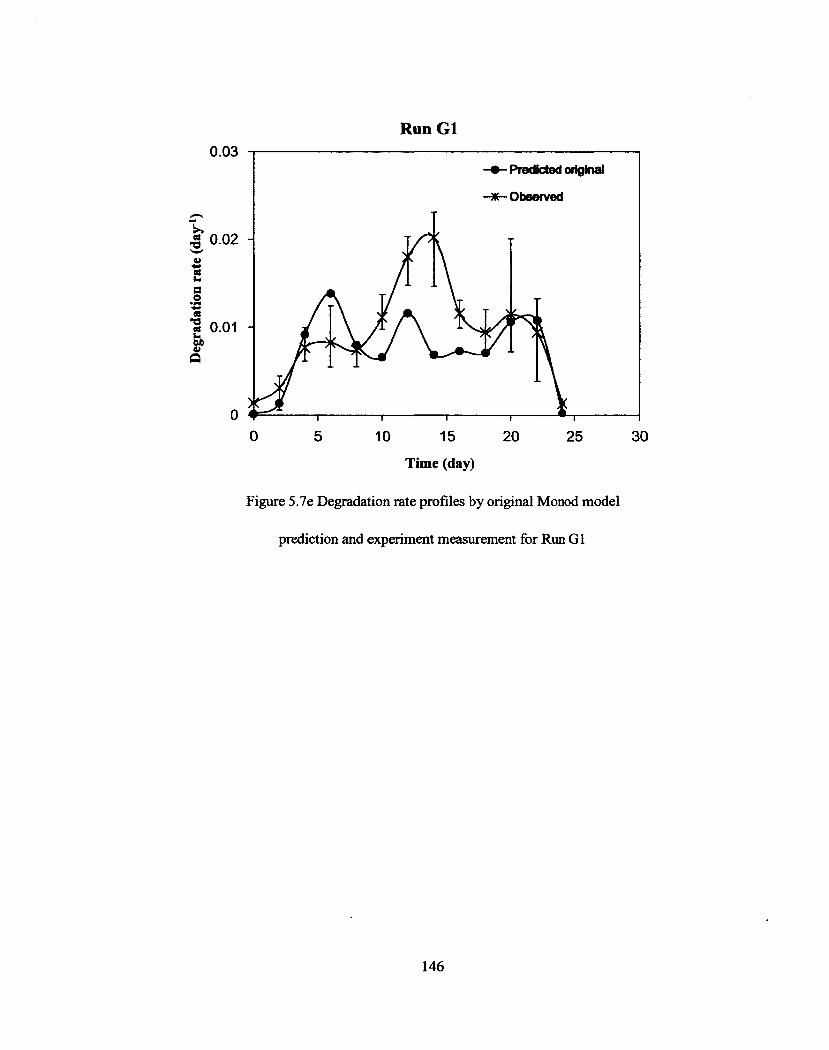
experiment measurement for Run G1 146
Figure 5.7f Degradation rate profiles by original Monod model prediction and
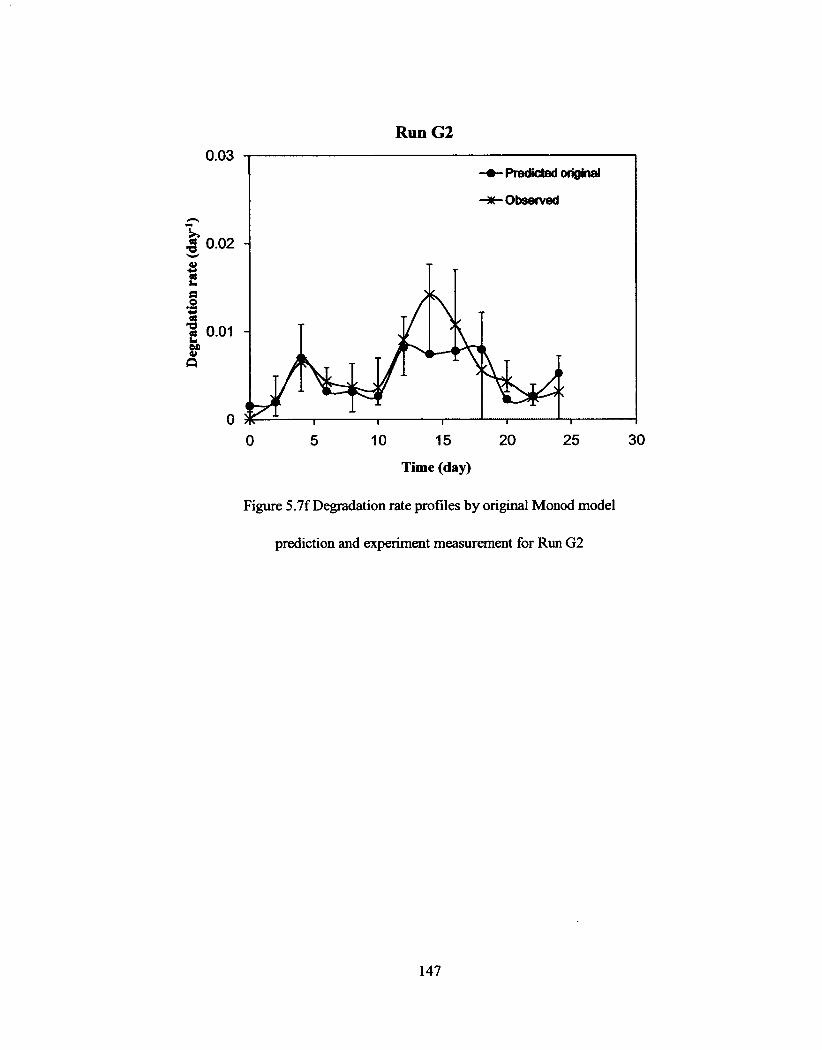
experiment measurement for Run G2 147
xii
experiment measurement for Run El 142
Figure 5.7b Degradation rate profiles by original Monod model prediction and
experiment measurement for Run E2 143
Figure 5.7c Degradation rate profiles by original Monod model prediction and
experiment measurement for Run F1 144
Figure 5.7d Degradation rate profiles by original Monod model prediction and
experiment measurement for Rim F2 145
Figure 5.7e Degradation rate profiles by original Monod model prediction and
experiment measurement for Run G1 146
Figure 5.7f Degradation rate profiles by original Monod model prediction and
experiment measurement for Run G2 147
xii
Page 16
LIST OF TABLES
Table 3.1 Synthetic substrate composition in food waste composting system 40
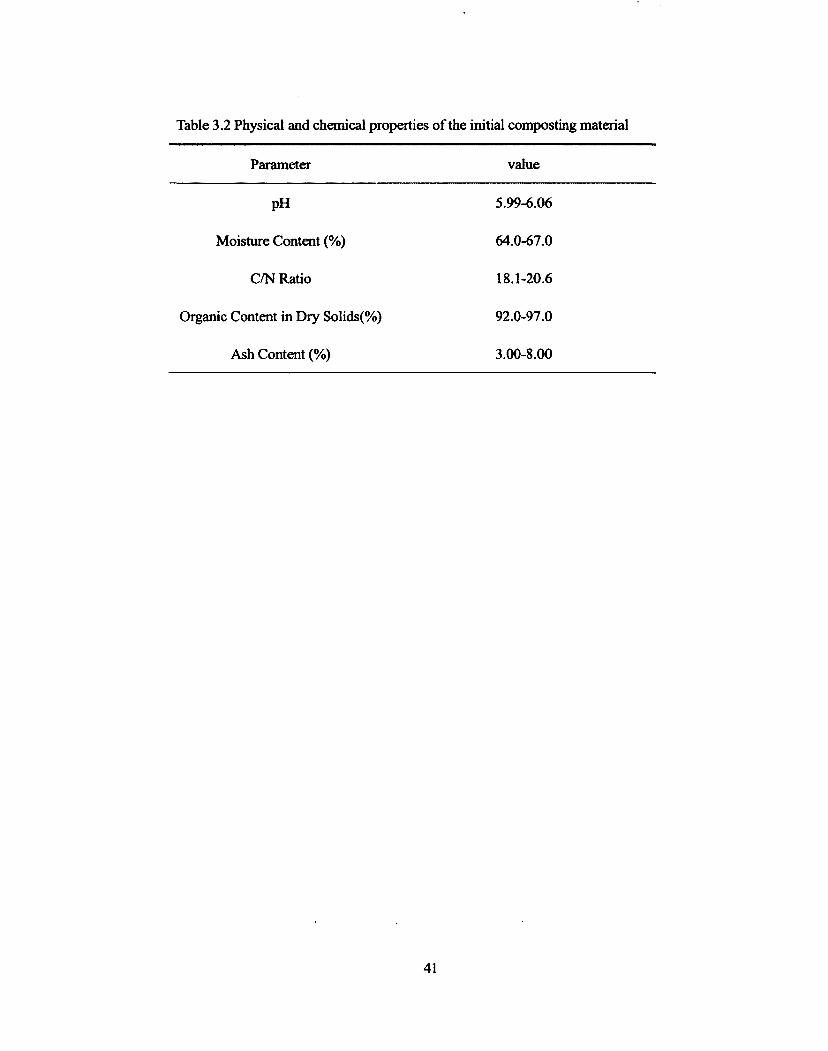
Table 3.2 Physical and chemical properties of the initial composting material 41
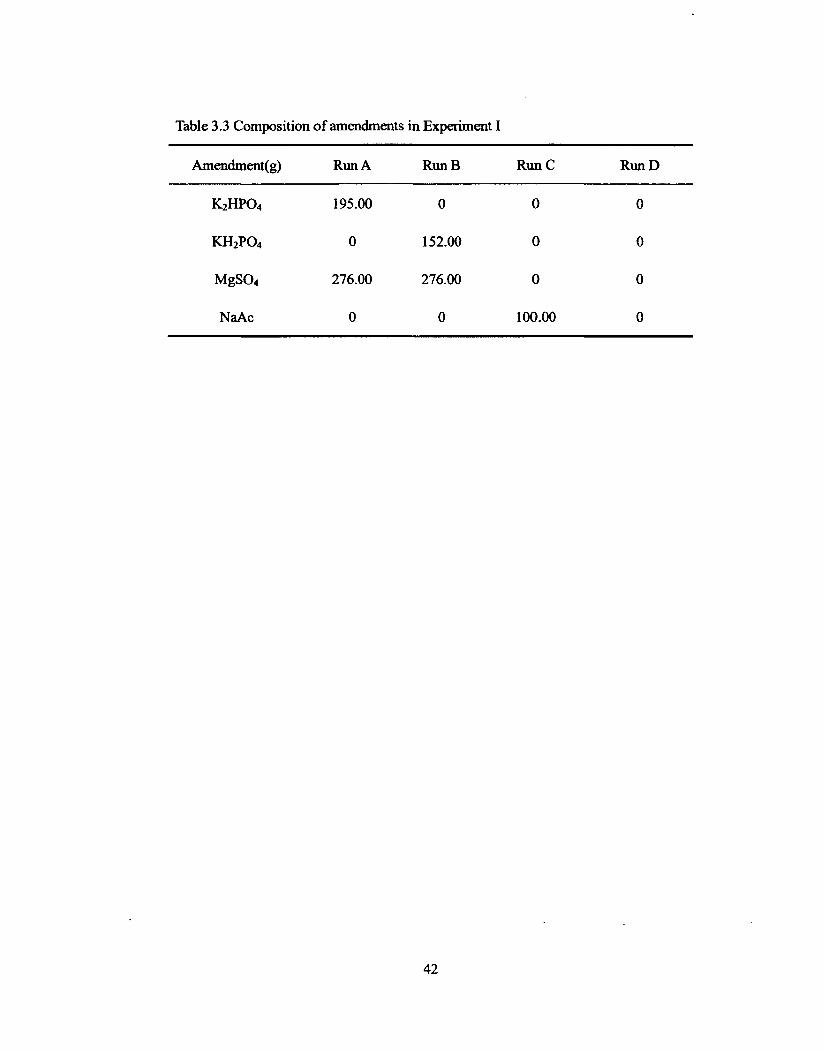
Table 3.3 Composition of amendments in Experiment I 42
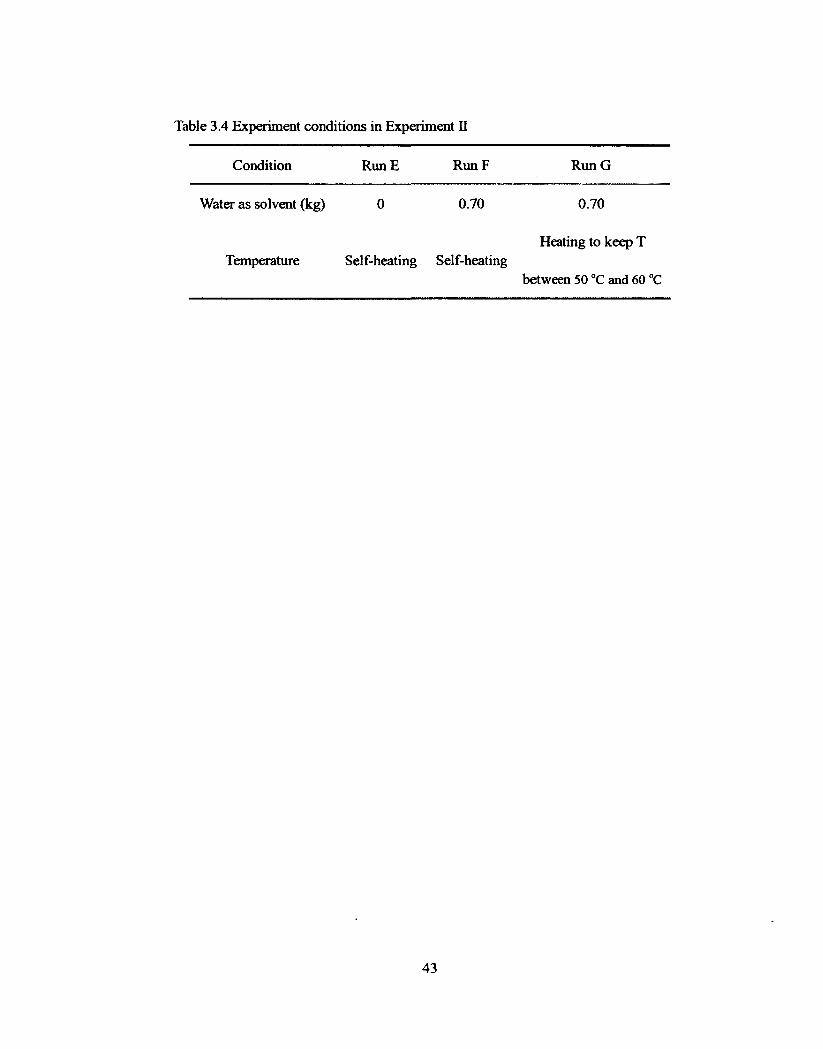
Table 3.4 Experiment conditions in Experiment II 43
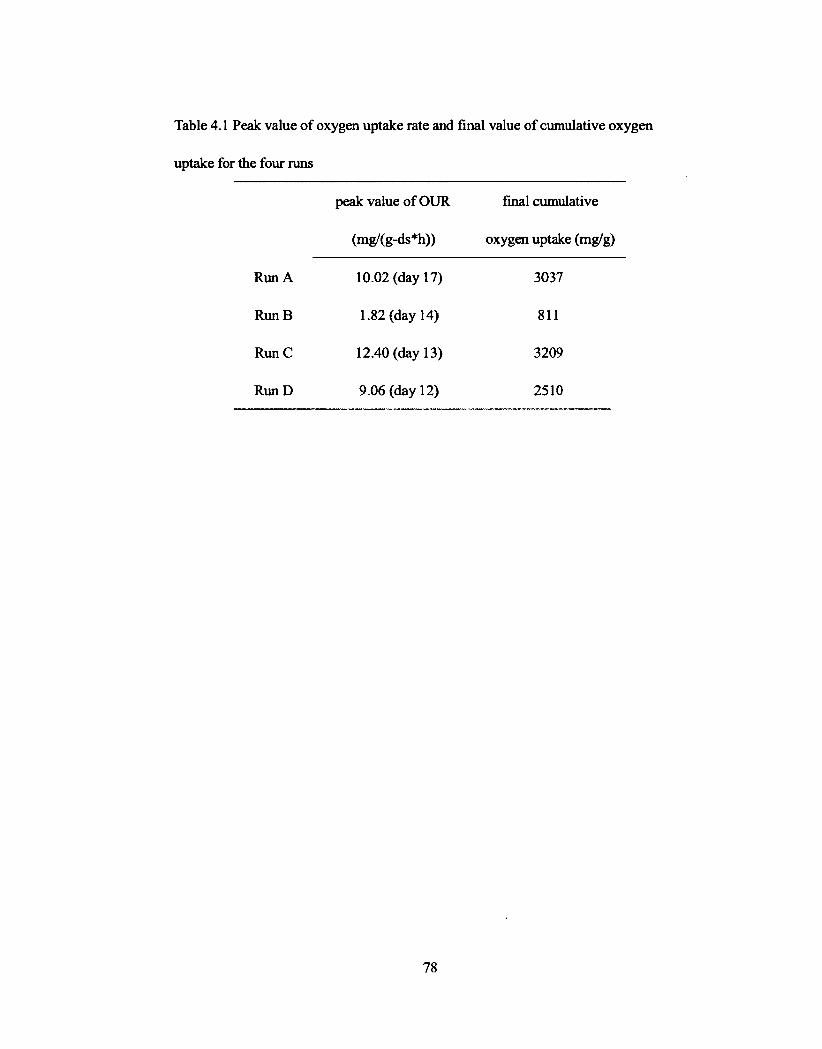
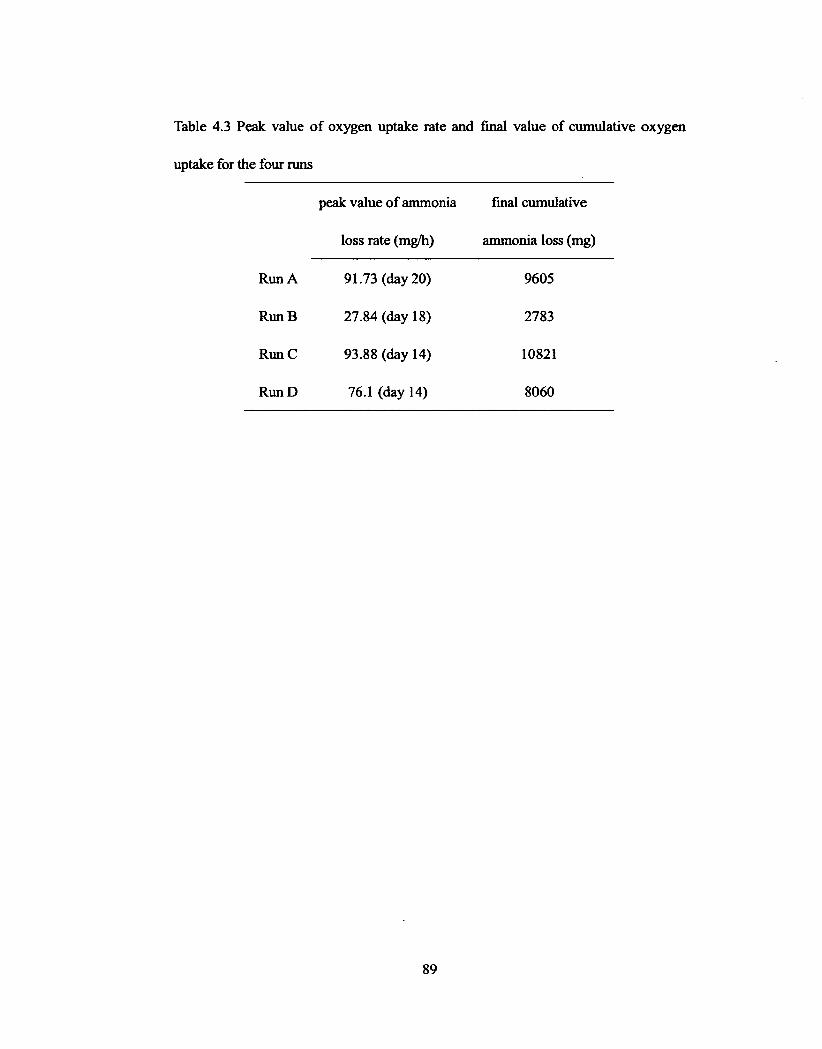
Table 4.1 Peak value of oxygen uptake rate and final value of cumulative oxygen
uptake for the four runs 78
Table 4.2 Comparison between fmal organic matters and cumulative 0 2 uptake in
composting system 82
Table 4.3 Peak value of oxygen uptake rate and fmal value of cumulative oxygen
uptake for the four runs 89
Table 5.1 Coefficients obtained from modified and original Monod models.... 111
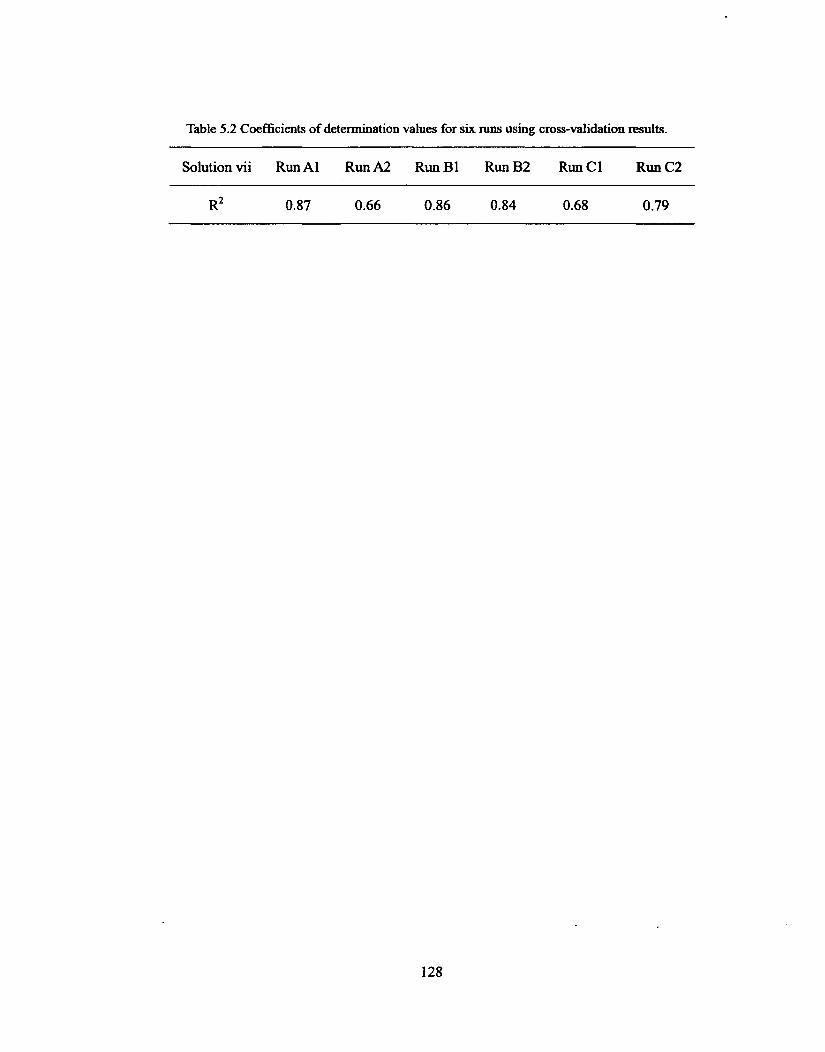
Table 5.2 Coefficients of determination values for six runs using cross-validation
results. 128
LIST OF TABLES
Table 3.1 Synthetic substrate composition in food waste composting system ....40
Table 3.2 Physical and chemical properties of the initial composting material...41
Table 3.3 Composition of amendments in Experiment I 42
Table 3.4 Experiment conditions in Experiment II 43
Table 4.1 Peak value of oxygen uptake rate and final value of cumulative oxygen
uptake for the four runs 78
Table 4.2 Comparison between final organic matters and cumulative O2 uptake in
composting system 82
Table 4.3 Peak value of oxygen uptake rate and final value of cumulative oxygen
uptake for the four runs 89
Table 5.1 Coefficients obtained from modified and original Monod models.... 111
Table 5.2 Coefficients of determination values for six runs using cross-validation
results 128
xiii
Page 17
CHAPTER 1
INTRODUCTION
1.1 Background
Concern over Municipal Solid Waste (MSW) has attracted increased attention across
Canada due to economic progress and the enhancement of living standards
(Environment Canada, 2010). As a typical consumer society, Canada is now facing a
more severe environmental threat due to the production of large amounts of MSW. An
increasing in MSW can cause various severe environment problems, including surface
and groundwater contamination, air pollution and Greenhouse Gas (GHG) emissions
(Abu Qdais and Hamoda, 2004). Over 25 million tons of GHG emissions were related
to MSW in 2003, which accounts for 3.5% of Canada's total annual GHG emissions.
The majority of the GHG emissions were uncaptured methane due to MSW disposal
in landfills (Environment Canada, 2003).
Furthermore, as the heaviest component of MSW after recyclable ingredients are
removed, food waste must be given special consideration due to its characteristics of
high moisture content and high organic compounds (McDonnell, 1999). Too much
moisture will cause the leachate problems in a landfill, which in turn can threaten the
soil and groundwater in landfill and create further energy consumption during the
incineration process; many organic matters will produce unpleasant odors when food
waste is treated according to traditional disposal methods. Moreover, it is of
1
Page 18
socio-economic and environment significance since the organic portion of food waste
can be restored and reused (Lin, 2006). As a result, it is advantageous to fmd an
attractive alternative with which to recycle and conserve food waste.
Composting is considered one of the most suitable approaches to food waste recycling.
It is defined as biodegradation process within a moist, warm and aerated environment,
in which the organic portion of solid waste can be decomposed into sanitary,
nuisance-free and humus like materials (An, 2006; Gray et al., 1971; C. Golueke,
1977; Wilson and Dalmat, 1986; Finstein and Morris, 1975; R.T. Haug, 1993).
Compared to traditional land filling without energy recovery, composting is useful for
avoiding GHGs emissions and reducing huge amounts of organic waste. Moreover,
successful compost products composting can be utilized as soil conditioner and
fertilizer. Another benefit is the low requirement of capital investment. As a result,
composting is an effective alternative in MSW management with which to divert
organic waste from the landfill or incineration. According to the Composting Council
of Canada, composting has also been widely employed in treating sewage sludge,
agricultural waste and contaminated soils (Antler, 2000). The wide applications of
compost indicate a growing market, which provides many benefits to the Canadian
society and the Canadian composting industry.
1.2 Challenges to Food Waste Composting
In order to obtain high quality compost products, it is necessary to understand the
2
socio-economic and environment significance since the organic portion of food waste
can be restored and reused (Lin, 2006). As a result, it is advantageous to find an
attractive alternative with which to recycle and conserve food waste.
Composting is considered one of the most suitable approaches to food waste recycling.
It is defined as biodegradation process within a moist, warm and aerated environment,
in which the organic portion of solid waste can be decomposed into sanitary,
nuisance-free and humus like materials (An, 2006; Gray et al., 1971; C. Golueke,
1977; Wilson and Dalmat, 1986; Finstein and Morris, 1975; R.T. Haug, 1993).
Compared to traditional land filling without energy recovery, composting is useful for
avoiding GHGs emissions and reducing huge amounts of organic waste. Moreover,
successful compost products composting can be utilized as soil conditioner and
fertilizer. Another benefit is the low requirement of capital investment. As a result,
composting is an effective alternative in MSW management with which to divert
organic waste from the landfill or incineration. According to the Composting Council
of Canada, composting has also been widely employed in treating sewage sludge,
agricultural waste and contaminated soils (Antler, 2000). The wide applications of
compost indicate a growing market, which provides many benefits to the Canadian
society and the Canadian composting industry.
1.2 Challenges to Food Waste Composting
In order to obtain high quality compost products, it is necessary to understand the
2
Page 19
mechanism of the food waste composting. Although the concepts for composting
different substrates are very similar, the features of food waste composting still offer a
unique challenge, since existing knowledge is inadequate for supporting a successful
food waste composting (Lei and Vander-Gheynst, 2000). Although increased attention
has been drawn to the subject of food waste composting in the past decade, an
efficient composting performance is difficult to achieve. An in-depth look and
effective control at composting systems are also desired. The challenges of food waste
can be investigated via an experimental approach and a modeling approach.
In the experimental aspect, there are two major limitations which restrict the
acceleration of the composting process and the improvement of compost quality. One
limitation is acidification during the initial phase due to the generation of short-chain
organic acids (Lei and Vander-Gheynst, 2000). It has been proven that low pH during
the initial phase would severely inhibit the composting process (Beck-Friis et al.,
2003; Nakasaki et al., 1993; Sundberg and Jonsson, 2005). The second limitation is
volatile nitrogen loss in the form of ammonia in the thermophilic stage with a high pH
level (Groenestein and Van Faassen, 1996). Ammonia is generated from the
decomposition of organic nitrogen material by the deamination process (Y. Liang et
al., 2006). Since nitrogen is a rather important nutrient and the key factor in
maintaining compost quality, the loss of nitrogen not only slows down the speed of
organic matter biodegradation in a composting process but also worsens the compost
fertility (Hu et al., 2007). Simultaneously, NH3 produces an unpleasant odor and
3
Page 20
harms the environmental atmosphere. Moreover, interaction between the two
limitations makes the situation more complicated: if alkaline additives are used, it
would to be beneficial to inhibit pH drop in the beginning but more nitrogen loss
would be caused; in comparison, acid additives are suitable for ammonia absorption
but do not work with respect to organic acid when composting starts.
In the modeling aspect, many efforts have been undertaken in developing kinetics
models for microbiological reactions during the composting processes. A majority of
researchers have employed the Monod equation to simulate microorganism growth
(Monod, 1949). Predominantly based on the Monod equation and its modifications,
various kinetics models have been reported (Isik and Sponza, 2005; Castillo et al.,
1999). Limitations in the previous models could be found wherein only the
concentration of overall microorganisms was used instead of taking into consideration
different kinds of microorganism separately (Richard and Walker, 2006). In fact,
composting is an extremely complicated and dynamic process. The successions of
microorganism populations need to be closely considered. Meanwhile, few studies
have been conducted to quantitatively investigate the interaction effects between pH
and temperature on microbial growth during the composting process.
1.3 Objective
As an extension of previous research (Sun, 2006; An, 2006; Yu and Huang, 2009), the
objective of this particular research is to examine the effects of buffer salts,
4
harms the environmental atmosphere. Moreover, interaction between the two
limitations makes the situation more complicated: if alkaline additives are used, it
would to be beneficial to inhibit pH drop in the beginning but more nitrogen loss
would be caused; in comparison, acid additives are suitable for ammonia absorption
but do not work with respect to organic acid when composting starts.
In the modeling aspect, many efforts have been undertaken in developing kinetics
models for microbiological reactions during the composting processes. A majority of
researchers have employed the Monod equation to simulate microorganism growth
(Monod, 1949). Predominantly based on the Monod equation and its modifications,
various kinetics models have been reported (Isik and Sponza, 2005; Castillo et al.,
1999). Limitations in the previous models could be found wherein only the
concentration of overall microorganisms was used instead of taking into consideration
different kinds of microorganism separately (Richard and Walker, 2006). In fact,
composting is an extremely complicated and dynamic process. The successions of
microorganism populations need to be closely considered. Meanwhile, few studies
have been conducted to quantitatively investigate the interaction effects between pH
and temperature on microbial growth during the composting process.
13 Objective
As an extension of previous research (Sun, 2006; An, 2006; Yu and Huang, 2009), the
objective of this particular research is to examine the effects of buffer salts,
4
Page 21
temperature and pH on food waste composting, using bench-scale in-vessel
composting systems. Improvements to both the experimental and modeling
approaches are undertaken. The objectives entail the following:
(i) To investigate the effects of buffer salts within different stages of the composting
process. Three types of buffer salts (K2HPO4/MgSO4, KH2PO4/MgSO4, and
NaAc) will be utilized as a novel category of pH amendments to investigate their
influences on the composting process. Moreover, nitrogen mass balance will be
considered to investigate the conflicts between multiple factors.
(ii) To develop a novel kinetics model to simulate the combined effects of pH and
temperature on mesophilic and thermophilic microorganisms, as well as organic
matter degradation in a food waste composting. Then, the kinetics parameters for
mesophiles and thermophiles will be calibrated, respectively. A comparison
between the modified model and the original Monod equation will be undertaken.
And the interactions between temperature and pH will be analyzed based on the
model results.
1.4 Thesis Organization
This thesis consists of five chapters. Chapter 2 reviews previous research regarding
waste composting, the factors affecting composting, and the models for microbiology
in composting systems. The review provides insight with which to understand how the
effects of buffer salts, pH and temperature influence the composting process and
5
temperature and pH on food waste composting, using bench-scale in-vessel
composting systems. Improvements to both the experimental and modeling
approaches are undertaken. The objectives entail the following:
(i) To investigate the effects of buffer salts within different stages of the composting
process. Three types of buffer salts (K2HP(VMgS04, Kt^PCVMgSO^ and
NaAc) will be utilized as a novel category of pH amendments to investigate their
influences on the composting process. Moreover, nitrogen mass balance will be
considered to investigate the conflicts between multiple factors.
(ii) To develop a novel kinetics model to simulate the combined effects of pH and
temperature on mesophilic and thermophilic microorganisms, as well as organic
matter degradation in a food waste composting. Then, the kinetics parameters for
mesophiles and thermophiles will be calibrated, respectively. A comparison
between the modified model and the original Monod equation will be undertaken.
And the interactions between temperature and pH will be analyzed based on the
model results.
1.4 Thesis Organization
This thesis consists of five chapters. Chapter 2 reviews previous research regarding
waste composting, the factors affecting composting, and the models for microbiology
in composting systems. The review provides insight with which to understand how the
effects of buffer salts, pH and temperature influence the composting process and
5
Page 22
resulting products. Chapter 3 describes the composting system apparatus and
substrates, experimental procedures, and parameter measurements. The concepts and
methodologies of statistical testing and cross validation are also included. Chapter 4
focuses on the effects of buffer salts via graphical results of various parameters. The
findings are also interpreted and discussed. Chapter 5 illustrated the effects of pH and
temperature through establishing a modified Monod function. The model performance
will be testified and the results of this model will be introduced. Chapter 6 presents
the conclusion of this research.
6
Page 23
CHAPTER 2
LITERATURE REVIEW
Waste management has become a critical problem in research and everyday practice
due to rising concerns regarding environmental pollution and resource conservation
(Brewer, 2001). Many solid waste management experts believe a single, simple
solution is inadequate to meet the requirements of waste management. However, an
integrated approach with multiple combined techniques combined would be valuable
to a wide range of pollution concerns (Uif, 1998; Fromme, 1999). It is well
recognized that a successful comprehensive strategy involves the four key elements
applied in a hierarchical manner (Lin, 2006): a) reduction in the volume and toxicity
of solid waste; b) recycling the useful portion of solid waste as much as possible; c)
recovery of energy from the combustion systems coupled with the best available
pollution control technology; and d) utilization of landfills with adequate
environmental control methods.
Composting can meet these multiple objectives through an integrated approach, which
contain odor reduction, nutrients recycling and waste management (R. T. Haug, 1980,
1986; Miller, 1989; Hansen et al., 1992; Albert et al., 2002; Park et al., 2004). It is
defined as a biochemical process with the presence of various microorganisms, in
which biodegradable organic wastes can be transferred to nuisance-free, humus-like
and sanitary materials, which can be used as soil fertilizer and conditioner (Gray et al.,
7
Page 24
1971; C. G. Golueke, 1973; Nakasaki et al., 1985; Wilson and Dalmat, 1986; Nergo et
al., 1999; de Bertoldi et al., 1983; Buchannan and Gliessman, 1991; Garcia et al.,
1992; Schlegel, 1992). The use of composting products has been proved of its ability
to sustain the quality and quantity of crop production levels similar to crop treated
with chemical fertilizers (Finstein and Morris, 1975). Composted organic waste is
able to supply nutrients to plants in a balanced way, providing high yields with a low
risk of groundwater and soil contamination. Thus composting offers the potential of
producing useful products from the organic fraction of solid waste. It assists in
decomposing degradable material, decreasing volume, weight and water content, and
killing pathogenic microorganisms, thus producing stabilized process residue
(Godden, 1983; Hoitink and Keener, 1993; Finstein and Hogan, 1992; Szmidt and
Fox, 2001).
Composting is essential to solid waste recycling and pollution reduction by avoiding
the transformation of possible waste materials into a series of toxic products (J. E.
Campbell, 1990; Sequi, 1996; Ryckeboer and J., 2003). It has been thousands of years
since the composting of organic wastes was used as a fanning technique(Jacobowitz
and Steenhuis, 1984). However, the modern composting technique can be thought as
an accelerated and controlled decomposition process with human interference
(Finstein and Morris, 1975; Solano et al., 2001a). Since sustainability considerations
are major driving forces within composting technologies, improvements in
8
1971; C. G. Golueke, 1973; Nakasaki et al., 1985; Wilson and Dalmat, 1986; Nergo et
al., 1999; de Bertoldi et al., 1983; Buchannan and Gliessman, 1991; Garcia et al.,
1992; Schlegel, 1992). The use of composting products has been proved of its ability
to sustain the quality and quantity of crop production levels similar to crop treated
with chemical fertilizers (Finstein and Morris, 1975). Composted organic waste is
able to supply nutrients to plants in a balanced way, providing high yields with a low
risk of groundwater and soil contamination. Thus composting offers the potential of
producing useful products from the organic fraction of solid waste. It assists in
decomposing degradable material, decreasing volume, weight and water content, and
killing pathogenic microorganisms, thus producing stabilized process residue
(Godden, 1983; Hoitink and Keener, 1993; Finstein and Hogan, 1992; Szmidt and
Fox, 2001).
Composting is essential to solid waste recycling and pollution reduction by avoiding
the transformation of possible waste materials into a series of toxic products (J. E.
Campbell, 1990; Sequi, 1996; Ryckeboer and J., 2003). It has been thousands of years
since the composting of organic wastes was used as a farming technique(Jacobowitz
and Steenhuis, 1984). However, the modem composting technique can be thought as
an accelerated and controlled decomposition process with human interference
(Finstein and Morris, 1975; Solano et al., 2001a). Since sustainability considerations
are major driving forces within composting technologies, improvements in
8
Page 25
composting processes will assist in promoting the efficiency and economic viability,
and ultimately contribute to agricultural and societal sustainability (Molla et al., 2005)
2.1 Application of Composting
2.1.1 Composting of Farming/Agriculture Waste
Composting was originally intended to treat farming waste such as livestock manure
and crop residues (Zucconi et al., 1981). Due to the large amounts of organic
materials within the waste, the results showed only sufficiently bio-stabilized
composting products could be applied to soil. The application of fresh organic
materials into soil might cause severe damage to plant growth. Due to anaerobic
conditions created within soil, nitrogen starvation and toxic metabolites such as
ammonia and organic acids will be produced (Mathur, 1991). Sufficiently matured
products were also recommended to control the spread of pathogens, phytotoxic
substances and unpleasant odors (Edwards and Daniel, 1992; Hansen et al., 1993;
Tiquia and Tam, 1998).
Manure is usually rich in nitrogen content, while crop residue is a good carbon source.
Extensive work has been conducted to mix and co-compost the two types of common
fanning waste. Appropriate conditions with respect to the compost carbon/nitrogen
ratio and moisture content can be achieved by choosing a favourable ratio of manure
and crops. The co-compost method has been widely recognized for treating
9
Page 26
farming/agriculture waste (Genevini et al., 1997; Tam and Tiquia, 1999; Filippi et al.,
2002). Pare et al. (1998) studied the composting process of animal manure and
shredded paper in order to analysis the transformation of carbon and nitrogen. In the
beginning, NH4+-N was initially decreased, and an increase of NC03-N was observed
towards the end of the process. Added nitrogen would lead to an inhibition of carbon
mineralization. Tiquia and Tam (2000) conducted research on the life cycle of
nitrogen during the composting of chicken litter, which is a mixture of chicken
manure, wood shavings, waste feed and feathers. The results showed a large portion
of nitrogen existed in the form of organic matter. The loss of nitrogen exceeded half
the initial nitrogen mass of the pile, which was predominated by the volatilization of
ammonia when the temperature and pH were both very high.
Farming waste is always accumulated into a heap-on-site. However, this condition is
not suitable for composting because an anaerobic process will occur. In this situation
and chosen from several popular methods, the windrow and aerated static-pile
methods become the most appropriate methods for on farm composting (de Bertoldi et
al., 1985). The windrow method is to heap the raw material into a long triangular pile
of a particular size with a thickness of 20 to 30 cm from the surface, depending on the
diffusion aeration (Haga, 1998). Periodical turning is required to avoid anaerobic
conditions inside the pile. Regular turning can not only help provide aeration within
the pile, but can also homogenize the composting substrates and re-establish the
porosity media to enlarge the active surface area (Cekmecelioglu, 2004). However,
10
farming/agriculture waste (Genevini et al., 1997; Tam and Tiquia, 1999; Filippi et al.,
2002). Pare et al. (1998) studied the composting process of animal manure and
shredded paper in order to analysis the transformation of carbon and nitrogen. In the
beginning, NH^-N was initially decreased, and an increase of N03-N was observed
towards the end of the process. Added nitrogen would lead to an inhibition of carbon
mineralization. Tiquia and Tam (2000) conducted research on the life cycle of
nitrogen during the composting of chicken litter, which is a mixture of chicken
manure, wood shavings, waste feed and feathers. The results showed a large portion
of nitrogen existed in the form of organic matter. The loss of nitrogen exceeded half
the initial nitrogen mass of the pile, which was predominated by the volatilization of
ammonia when the temperature and pH were both very high.
Farming waste is always accumulated into a heap-on-site. However, this condition is
not suitable for composting because an anaerobic process will occur. In this situation
and chosen from several popular methods, the windrow and aerated static-pile
methods become the most appropriate methods for on farm composting (de Bertoldi et
al., 1985). The windrow method is to heap the raw material into a long triangular pile
of a particular size with a thickness of 20 to 30 cm from the surface, depending on the
diffusion aeration (Haga, 1998). Periodical turning is required to avoid anaerobic
conditions inside the pile. Regular turning can not only help provide aeration within
the pile, but can also homogenize the composting substrates and re-establish the
porosity media to enlarge the active surface area (Cekmecelioglu, 2004). However,
Page 27
sufficient aeration in the static pile method is generally achieved by heaping the
mixed raw materials onto a base containing perforated pipes, which supplies air from
a fan-blower to the heap (Solano et al., 2001b).
2.1.2 Composting of Municipal Solid Waste
With the continuous growth of human population and communities scale, traditional
solid waste disposal approaches such as landfills and incineration, can hardly meet the
demand of increasing solid waste generation and the aim of sustainable municipal
solid waste (MSW) management, due to their capacity limitations and the possibilities
of environmental pollution. In some regions with high population densities such as
Europe and Asia, a shortage of land for waste disposal has become a significant issue.
In order to reduce the amount of solid waste, composting the biodegradable fraction
of municipal solid waste has become a widely accepted approach (Gellens et al., 1995;
Yoshida et al., 2001). The techniques used in MSW composting are mostly derived
from fanning waste composting. Other than windrow and aerated static pile methods,
an in-vessel composting system can be used occasionally. It refers to a composting
reaction occurring in enclosed reactors. Generally, by using metal tanks or concrete
bunkers, this method can provide better control over aeration, temperature and
moisture in composting materials (Donahue et al., 1998; Seymour et al., 2001;
Cekmecelioglu, 2004). Also, an in-vessel composting system can handle more
11
sufficient aeration in the static pile method is generally achieved by heaping the
mixed raw materials onto a base containing perforated pipes, which supplies air from
a fan-blower to the heap (Solano et al., 2001b).
2.1.2 Composting of Municipal Solid Waste
With the continuous growth of human population and communities scale, traditional
solid waste disposal approaches such as landfills and incineration, can hardly meet the
demand of increasing solid waste generation and the aim of sustainable municipal
solid waste (MSW) management, due to their capacity limitations and the possibilities
of environmental pollution. In some regions with high population densities such as
Europe and Asia, a shortage of land for waste disposal has become a significant issue.
In order to reduce the amount of solid waste, composting the biodegradable fraction
of municipal solid waste has become a widely accepted approach (Gellens et al., 1995;
Yoshida et al., 2001). The techniques used in MSW composting are mostly derived
from farming waste composting. Other than windrow and aerated static pile methods,
an in-vessel composting system can be used occasionally. It refers to a composting
reaction occurring in enclosed reactors. Generally, by using metal tanks or concrete
bunkers, this method can provide better control over aeration, temperature and
moisture in composting materials (Donahue et al., 1998; Seymour et al., 2001;
Cekmecelioglu, 2004). Also, an in-vessel composting system can handle more
11
Page 28
composting substrates than windrows and static aerated piles when a space is similar,
which makes it particularly suitable for urban areas.
2.13 Composting of Food Waste
Food-service establishments and urban households have generated increasing amounts
of food waste, giving municipal authorities significant concerns. Food waste is also a
major part of municipal solid waste. Because of the unique characteristics of food
waste, (very damp and highly degradable), many undesirable environmental issues
can arise during its storage, collection and transportation (Choi and Park, 1998; Seo et
al., 2004; Smars et al., 2002; Svensson et al., 2004; Chang et al., 2006). Up to now,
traditional solid waste management approaches such as landfill and incineration are
still used to treat a major portion of food waste. However, the high moisture content
of food waste may retard burning in incinerators and may reduce the efficiency of
waste-to-energy plants. Moreover, high moisture content may also generate large
amounts of leachate in landfills, which is a major reason for soil and groundwater
pollution (Walker, 2008). Also a large percentage of organic matters may be
transformed into methane gas, adding to the accumulation of greenhouse gases in the
atmosphere (Kjeldsen and Fischer, 1995; Boltze and de Freitas, 1997). Therefore,
composting has garnered more and more attention with respect to dealing with food
waste (Kwon and Lee, 2004; McDonnell, 1993, 1999; Namkoong et al., 1999). It is
believed that a dominantly aerobic environment will mitigate produced methane and
12
composting substrates than windrows and static aerated piles when a space is similar,
which makes it particularly suitable for urban areas.
2.1.3 Composting of Food Waste
Food-service establishments and urban households have generated increasing amounts
of food waste, giving municipal authorities significant concerns. Food waste is also a
major part of municipal solid waste. Because of the unique characteristics of food
waste, (very damp and highly degradable), many undesirable environmental issues
can arise during its storage, collection and transportation (Choi and Park, 1998; Seo et
al., 2004; Smlrs et al., 2002; Svensson et al., 2004; Chang et al., 2006). Up to now,
traditional solid waste management approaches such as landfill and incineration are
still used to treat a major portion of food waste. However, the high moisture content
of food waste may retard burning in incinerators and may reduce the efficiency of
waste-to-energy plants. Moreover, high moisture content may also generate large
amounts of leachate in landfills, which is a major reason for soil and groundwater
pollution (Walker, 2008). Also a large percentage of organic matters may be
transformed into methane gas, adding to the accumulation of greenhouse gases in the
atmosphere (Kjeldsen and Fischer, 1995; Boltze and de Freitas, 1997). Therefore,
composting has garnered more and more attention with respect to dealing with food
waste (Kwon and Lee, 2004; McDonnell, 1993, 1999; Namkoong et al., 1999). It is
believed that a dominantly aerobic environment will mitigate produced methane and
12
Page 29
leaching acidic substances, and thus, aerobic composting is accepted as an
environment friendly alternative for the handling of food waste (Droffiner and Brinton,
1995; Seymour et al., 2001; Elwell et al., 1996; Donahue et al., 1998; Laos et al.,
1998; Faucette et al., 2001; Tomati et al., 2001; Filippi et al., 2002; Das et al., 2003;
Koivula et al., 2004).
Donahue et al. (1998) demonstrated a successful food waste composting process with
sawdust and mulch chips added into an in-vessel system within 14 days. Chang et al.
(2006) designed a reactor in laboratory scale to study the effects of the operational
conditions regarding the composting process by using a synthetic food waste made
from dog food. The results showed the synthetic food could be composted within 4
days, and the final products could pass maturity tests, which is a MCDA
(Multi-Criteria Decision Analysis) system. The optimal operating conditions were 1.6
L air/kg (dry solid) per minute of air suction rate, 32% of mass with seeding and 50%
of time with agitation. There are also several studies regarding the obtaining of a high
decomposition rate and stabilized end products by optimizing food-waste composting
operations.
2.2 Factors Affecting Composting Reaction Rate and Products Quality
Since composting is a biochemical process, aerobic breakdown of solid organic matter
by microorganisms is a crucial step in composting (Defilkx et al., 1990). However,
biodegradation is a sum of a series of complex metabolic processes and
13
leaching acidic substances, and thus, aerobic composting is accepted as an
environment friendly alternative for the handling of food waste (Droffiner and Brinton,
1995; Seymour et al., 2001; Elwell et al., 1996; Donahue et al., 1998; Laos et al.,
1998; Faucette et al., 2001; Tomati et al., 2001; Filippi et al., 2002; Das et al., 2003;
Koivula et al., 2004).
Donahue et al. (1998) demonstrated a successful food waste composting process with
sawdust and mulch chips added into an in-vessel system within 14 days. Chang et al.
(2006) designed a reactor in laboratory scale to study the effects of the operational
conditions regarding the composting process by using a synthetic food waste made
from dog food. The results showed the synthetic food could be composted within 4
days, and the final products could pass maturity tests, which is a MCDA
(Multi-Criteria Decision Analysis) system. The optimal operating conditions were 1.6
L air/kg (dry solid) per minute of air suction rate, 32% of mass with seeding and 50%
of time with agitation. There are also several studies regarding the obtaining of a high
decomposition rate and stabilized end products by optimizing food-waste composting
operations.
2.2 Factors Affecting Composting Reaction Rate and Products Quality
Since composting is a biochemical process, aerobic breakdown of solid organic matter
by microorganisms is a crucial step in composting (Derikx et al., 1990). However,
biodegradation is a sum of a series of complex metabolic processes and
13
Page 30
transformations by a large mixed population of microorganisms, rather than a single
and simple unitary process. The precise chemical changes and microbial species
involved in the composting process will vary according to the composition of
raw-materials. Even in the same process, the entire system will also change
dynamically and reflect the change of environmental factors (Yoshida et al., 2001).
There are two groups of main factors in a composting process, operational conditions,
which include temperature, moisture content, pH level, and aeration rate; the
substrate-related parameters, which include the C/N ratio, particle size and nutrient
content (Bishop and Godfrey, 1983). These parameters will affect the progress of
composting, and may change continuously along with time. It is worth noting that all
the parameters are not independent but have some interactions and correlations. As a
result, these parameters should be appropriately controlled to achieve compost
maturity.
2.2.1 Temperature
2.2.1.1 Temperature Profiles in Food Waste Composting
The temperature of the system is the function of accumulated heat generated by
microbial reaction, heat brought out in the system by leachate and emitted gases and
the heat capacity of the compost and reactor. Its evolution is an indicator of metabolic
activities during the composting process (MacGregor et al., 1981). Consequently, the
temperature acts as a convenient and direct parameter with which to determine the
14
Page 31
phase of the composting process. Effective ways to control temperature are beneficial
for pathogen deduction, respiration rate optimization, moisture removal, and compost
stabilization (Soares et al., 1995; Lin, 2006). As a result, a number of studies have
addressed heat transport in the composting process (Finger et al., 1976; Characklis
and Gujer, 1979; Kishimoto et al., 1987; Bach et al., 1985; Nakasaki, 1987; Tiquia
and Tam, 2000; Pare et al., 1998).
A typical composting is normally an exothermal process, in which energy will be
released and temperature will rise when degradable organic materials break-down
during the process. This biological metabolism process will also produce carbon
dioxide and water (Tiquia and Tam, 1998; Bari and Koening, 2001; Ryckeboer et al.,
2003a). Composting is self-insulated, which means the temperature only decreases
according to the evaporated water being carried through ventilated air (R.T. Haug,
1993; An, 2006). Normally, the temperature in the system initially rises to 60-70 °C
during the process then cools down slowly to ambient temperature (Fu, 2004).
2.2.1.2 Microorganism Activities under Different Temperatures
Generally, the temperature exhibits major correlation with the types and species of
dominant microorganisms. Correspondingly, the composting process can be divided
into three stages based on temperature evolution, which are mesophilic, thermophilic
and cooling stages (Gray et al., 1971). Although there is no clear-cut threshold
between mesophilic and thermophilic stages, Miller (1996) considered a temperature
15
Page 32
below 40 °C as mesophilic, while a temperature between 45 °C and 70 °C as
thennophilic; Haug (1991) considered a temperature between 60 °C to 80 °C as
thermophilic, which is case sensitive. Although the combined activities of many
individual microorganisms are involved (Cheung, 2008), the most commonly used
classification of microorganisms in composting is based on their optimum
temperature, so that two classes of microorganism can be considered regarding to
different temperatures which they grow under: mesophilic microorganisms (also
known as mesophiles) and thermophilic microorganisms (also known as thermophiles)
(Swatek, 1967). Mesophiles have optimal temperature between 20.0 to 35.0 °C. The
miminum and maximum tolerable temperatures for survival are 10.0 °C and 45.0 °C,
respectively (Lyles, 1969). Thermophiles are best adapted to a temperature between
50.0 °C and 60.0 °C. The tolerance level for thermophiles is from 35.0 °C to 85.0 °C
(Lyles, 1969; Henis, 1987; Lester and Birkett, 1999). A temperature outside the
adaptive range will limit microbial activities (Ryckeboer et al., 2003b). On the other
hand, different species and types of microorganisms have their own optimum
temperature. It has been reported that fungi is an important group in the early
mesophilic stage, while bacteria dominants the thermophilic phase (Klamer and Bath,
1998; Strom, 1985).
Different microbial communities predominate at various stages: the most typical stage
in composting system is the early acidic phase. Mesophilic microorganisms are the
major active species which break down the readily degradable matters such as sugar,
16
below 40 °C as mesophilic, while a temperature between 45 °C and 70 °C as
thermophilic; Haug (1991) considered a temperature between 60 °C to 80 °C as
thermophilic, which is case sensitive. Although the combined activities of many
individual microorganisms are involved (Cheung, 2008), the most commonly used
classification of microorganisms in composting is based on their optimum
temperature, so that two classes of microorganism can be considered regarding to
different temperatures which they grow under: mesophilic microorganisms (also
known as mesophiles) and thermophilic microorganisms (also known as thermophiles)
(Swatek, 1967). Mesophiles have optimal temperature between 20.0 to 35.0 °C. The
miminum and maximum tolerable temperatures for survival are 10.0 °C and 45.0 °C,
respectively (Lyles, 1969). Thermophiles are best adapted to a temperature between
50.0 °C and 60.0 °C. The tolerance level for thermophiles is from 35.0 °C to 85.0 °C
(Lyles, 1969; Henis, 1987; Lester and Birkett, 1999). A temperature outside the
adaptive range will limit microbial activities (Ryckeboer et al., 2003b). On the other
hand, different species and types of microorganisms have their own optimum
temperature. It has been reported that fungi is an important group in the early
mesophilic stage, while bacteria dominants the thermophilic phase (Klamer and BMth,
1998; Strom, 1985).
Different microbial communities predominate at various stages: the most typical stage
in composting system is the early acidic phase. Mesophilic microorganisms are the
major active species which break down the readily degradable matters such as sugar,
Page 33
starches, lipids, fats and proteins because they are easily hydrolyzed or have a low
molecular weight, and generated heat will shift the process to the thermophilic stage
(Nakasaki et al., 1985; Fogarty and Tuovinen, 1991). Several studies exist regarding
the decrease in pH decreasing during the initial stage of composting because of the
organic acids intermediates (Finstein and Morris, 1975). De Bertoldi et al. (1983)
testified the formed organic acids are a result of the breakdown of sugar and fats by
bacteria. Bacteria is less tolerant to low pH conditions than fungi (Sundberg et al.,
2004) although the optimum pH for bacteria is neutral. A low pH condition will be
inhibitory to microorganisms, which may lead to inactive or suppressed microbial
activity. The low degradation rate can be reflected from a low mesophilic temperature,
low oxygen consumption, and low carbon-dioxide emission rates (Kubota and
Kakasaki, 1991; Robertsson, 2002).
When most of the readily degradable matters are depleted, including organic acids,
the pH rises towards the neutral and alkaline range (Miller, 1996; Ryckeboer et al.,
2003a). With the temperature rising, thermophilic microorganisms begin to dominate
the process due to the suitable temperature in the system. In this stage, organic
decomposition rate reaches its maximum and temperature is maintained at
approximately 70 °C, because thermophilic microorganisms have a higher efficiency
with which to degrade nutrients. At this stage, moderate resistant degradable matters
such as celluloses, hemicelluloses and chitin, and highly resistant degradable matters
like lignin and lignocelluloses are degraded (Stentiford, 1993).
17
starches, lipids, fats and proteins because they are easily hydrolyzed or have a low
molecular weight, and generated heat will shift the process to the thermophilic stage
(Nakasaki et al., 1985; Fogarty and Tuovinen, 1991). Several studies exist regarding
the decrease in pH decreasing during the initial stage of composting because of the
organic acids intermediates (Finstein and Morris, 1975). De Bertoldi et al. (1983)
testified the formed organic acids are a result of the breakdown of sugar and fats by
bacteria. Bacteria is less tolerant to low pH conditions than fungi (Sundberg et al.,
2004) although the optimum pH for bacteria is neutral. A low pH condition will be
inhibitory to microorganisms, which may lead to inactive or suppressed microbial
activity. The low degradation rate can be reflected from a low mesophilic temperature,
low oxygen consumption, and low carbon-dioxide emission rates (Kubota and
Kakasaki, 1991; Robertsson, 2002).
When most of the readily degradable matters are depleted, including organic acids,
the pH rises towards the neutral and alkaline range (Miller, 1996; Ryckeboer et al.,
2003a). With the temperature rising, thermophilic microorganisms begin to dominate
the process due to the suitable temperature in the system. In this stage, organic
decomposition rate reaches its maximum and temperature is maintained at
approximately 70 °C, because thermophilic microorganisms have a higher efficiency
with which to degrade nutrients. At this stage, moderate resistant degradable matters
such as celluloses, hemicelluloses and chitin, and highly resistant degradable matters
like lignin and lignocelluloses are degraded (Stentiford, 1993).
Page 34
Once the majority of the substrates have been consumed, so that there is not enough
metabolic heat remains to maintain thermophilic temperature, the rate of heat
generation cannot meet that of heat loss. The cooling stage takes place and the
temperature arrives at ambient temperature. The activities of microorganisms also
slow down. (Waksman et al., 1939). When the composting reaches the cooling phase,
the thermophile population decreases and mesophlies begin to re-colonize the
compost materials to help move the compost into maturity, which is called a
resumption of mesophiles (Poincelot, 1974; Strom, 1985; Fogarty and Tuovinen, 1991;
Herrmann and Shann, 1997). However, the activity of mesophiles is extremely low
because residues are highly resistant to decomposition. At last, the fmal composting
products become stable with extremely low microbial activity in the residue.
Temperature influences not only the dominant microorganisms and their population,
but also the rate and pathway of decomposition. Waksman et al. (1939) pointed out
that the maximum degradation rate occurred at 50 °C in a batch system with horse
manure; Jens and Regan (1973a) reported that the highest degradation rate can be
found at 55 °C in a continuous feeding system; Strom (1985) determined the optimum
temperature for a thermophilic continuous process to be 60 °C; and Cathcart et al.
(1986) showed maximum CO2 generation was realized at a temperature of 55 °C in a
batch composting;
18
Once the majority of the substrates have been consumed, so that there is not enough
metabolic heat remains to maintain thermophilic temperature, the rate of heat
generation cannot meet that of heat loss. The cooling stage takes place and the
temperature arrives at ambient temperature. The activities of microorganisms also
slow down. (Waksman et al., 1939). When the composting reaches the cooling phase,
the thermophile population decreases and mesophlies begin to re-colonize the
compost materials to help move the compost into maturity, which is called a
resumption of mesophiles (Poincelot, 1974; Strom, 1985; Fogarty and Tuovinen, 1991;
Herrmann and Shann, 1997). However, the activity of mesophiles is extremely low
because residues are highly resistant to decomposition. At last, the final composting
products become stable with extremely low microbial activity in the residue.
Temperature influences not only the dominant microorganisms and their population,
but also the rate and pathway of decomposition. Waksman et al. (1939) pointed out
that the maximum degradation rate occurred at 50 °C in a batch system with horse
manure; Jeris and Regan (1973a) reported that the highest degradation rate can be
found at 55 °C in a continuous feeding system; Strom (1985) determined the optimum
temperature for a thermophilic continuous process to be 60 °C; and Cathcart et al.
(1986) showed maximum CO2 generation was realized at a temperature of 55 °C in a
batch composting;
18
Page 35
Controlling temperature is also a useful tool with respect to sanitation. The
thermophilic temperature reached during the composting process can reduce pathogen
concentration dramatically and provide a safe compost product (Cooney and Wise,
1975). As a result, attaining and maintaining an appropriate temperature for a specific
period of time is necessary for consistent pathogen destruction. Moreover, a faster and
more complete composting can be achieved if optimal temperature is maintained in
the thermophilic range. On the other hand, an extremely high temperature will
deactivate proteins and biological activity will decline as the population dies, thus,
severely slowing the composting process. In summary, maintaining a consistent
temperature may provide for faster and more complete composting, and pathogen
destruction and stable fmal compost products. Variations in material, composting
methods, aeration rates, substrate composition and other factors could affect optimal
composting (Hall, 1998).
2.2.2 pH
2.2.2.1 pH Profile in Food Waste Composting
Generally, pH has been used as an index to evaluate the composting process and
control the reaction rate (Nakasaki et al., 1993; VanderGheynst and Lei, 2000;
Nakasaki et al., 1992). In a typical composting process, pH usually drops during the
initial stage, but rises rapidly to alkaline when the thermophilic stage begins. The
generated short-chain organic acids and released ammonia appear to contribute a great
deal to the pH variation time, leading to an initial pH' drop to approximately 5.0
19
Controlling temperature is also a useful tool with respect to sanitation. The
thermophilic temperature reached during the composting process can reduce pathogen
concentration dramatically and provide a safe compost product (Cooney and Wise,
1975). As a result, attaining and maintaining an appropriate temperature for a specific
period of time is necessary for consistent pathogen destruction. Moreover, a faster and
more complete composting can be achieved if optimal temperature is maintained in
the thermophilic range. On the other hand, an extremely high temperature will
deactivate proteins and biological activity will decline as the population dies, thus,
severely slowing the composting process. In summary, maintaining a consistent
temperature may provide for faster and more complete composting, and pathogen
destruction and stable final compost products. Variations in material, composting
methods, aeration rates, substrate composition and other factors could affect optimal
composting (Hall, 1998).
2.2.2 pH
2.2.2.1 pH Profile in Food Waste Composting
Generally, pH has been used as an index to evaluate the composting process and
control the reaction rate (Nakasaki et al., 1993; VanderGheynst and Lei, 2000;
Nakasaki et al., 1992). In a typical composting process, pH usually drops during the
initial stage, but rises rapidly to alkaline when the thermophilic stage begins. The
generated short-chain organic acids and released ammonia appear to contribute a great
deal to the pH variation time, leading to an initial pH' drop to approximately 5.0
19
Page 36
during the mesophilic stage, and a pH rising in the thermophilic stage to
approximately 8.0 (Conghos et al., 2003; Sundberg and Jonsson, 2005)
The organic acids, which are mainly lactic and acetic acids, were generated from the
decomposition of easily degradable organic matters, such as sugar, starch and fat
(Poincelot, 1974; Mathur, 1991; Beck-Friis et al., 2001; R.T. Haug, 1993; Kirchmann
and Widen, 1994; Venglovsky et al., 2005). This acid-producing process has been
observed during the storage and collection of substrates, as well as at the beginning of
batch-scale composting (Eklind and Kirchmann, 2000; Day et al., 1998; Beck-Friis et
al., 2003). It is commonly accepted that organic acids are generated by a microbial
product of anaerobic metabolism (Beck-Friis et al., 2001). In real systems, if the
oxygen diffusion is not sufficient, oxygen in some parts of the composting system can
be exhausted and short-chain organic acids can still be found even when the compost
off-gas has a high oxygen concentration (Beck-Friis et al., 2003). Consequently, the
anaerobic condition can hardly be avoided.
It has been well-recognized that organic acids are the reason for low pH in the initial
phase of composting. Because their un-dissociated forms can pass through cell
membranes and cause an imbalance of protons, the short-chain organic acids are toxic
to microorganisms when the pH is less than 5 (Erickson and Fung, 1988). On the
other hand, at the end of the mesophilic stage when the pH level rises up to 6, the
short-chain organic acids (dissociated forms) become readily decomposable
20
during the mesophilic stage, and a pH rising in the thermophilic stage to
approximately 8.0 (Conghos et al., 2003; Sundberg and Jonsson, 2005)
The organic acids, which are mainly lactic and acetic acids, were generated from the
decomposition of easily degradable organic matters, such as sugar, starch and fat
(Poincelot, 1974; Mathur, 1991; Beck-Friis et al., 2001; R.T. Haug, 1993; Kirchmann
and Widen, 1994; Venglovsky et al., 2005). This acid-producing process has been
observed during the storage and collection of substrates, as well as at the beginning of
batch-scale composting (Eklind and Kirchmann, 2000; Day et al., 1998; Beck-Friis et
al., 2003). It is commonly accepted that organic acids are generated by a microbial
product of anaerobic metabolism (Beck-Friis et al., 2001). In real systems, if the
oxygen diffusion is not sufficient, oxygen in some parts of the composting system can
be exhausted and short-chain organic acids can still be found even when the compost
off-gas has a high oxygen concentration (Beck-Friis et al., 2003). Consequently, the
anaerobic condition can hardly be avoided.
It has been well-recognized that organic acids are the reason for low pH in the initial
phase of composting. Because their un-dissociated forms can pass through cell
membranes and cause an imbalance of protons, the short-chain organic acids are toxic
to microorganisms when the pH is less than 5 (Erickson and Fung, 1988). On the
other hand, at the end of the mesophilic stage when the pH level rises up to 6, the
short-chain organic acids (dissociated forms) become readily decomposable
Page 37
(Beck-Friis et al., 2003; Brinton, 1998). Due to this situation, the decarboxylation
process of organic anions occurs which assimilated one proton per molecule to
produce aldehyde and carbon dioxide (Barakzai and Mengel, 1993; Yan et al., 1996).
In a successful composting, the acids are decomposed and thus, the pH level is
accordingly increased to 8 from the mesophilic to the thermophilic stage (Day et al.,
1998; Jeong and Hwang, 2005). The ammonification and mineralization of organic
nitrogen through microbial activities also contribute to a shift in pH (Finstein and
Mon-is, 1975; Bishop and Godfrey, 1983; Mahimairaja et al., 1994; Thambirajah et al.,
1995). During the later stage, nitrification can help to neutralize the pH (Tiquia and
Tam, 1998; Venglovsky et al., 2005). The reaction of decarboxylation and
ammonification/mineralization processes can be found as follows:
R-000- +H+ -* R- CHO +CO2
R- NH2 + H20 + H+ + HCO3- -NH4> + +HCO3- +R-OH
Various species of microorganisms have different optimal pH levels. For example, the
optimal pH level for most of bacteria is from 6.0 to 7.5, while that for fungi is 5.5 to
8.5 (C. G. Golueke, 1973). Bertoldi et al. (1983) suggested that the optimum pH
levels for composting were between 5.5 and 8.0; Nakasaki et al. (1993) discussed the
pH dependency of microbial activities and found the optimal pH within a range of 7
to 8.
2.2.2.2 pH Problems in Food Waste Composting
21
(Beck-Friis et al., 2003; Brinton, 1998). Due to this situation, the decarboxylation
process of organic anions occurs which assimilated one proton per molecule to
produce aldehyde and carbon dioxide (Barakzai and Mengel, 1993; Yan et al., 1996).
In a successful composting, the acids are decomposed and thus, the pH level is
accordingly increased to 8 from the mesophilic to the thermophilic stage (Day et al.,
1998; Jeong and Hwang, 2005). The ammonification and mineralization of organic
nitrogen through microbial activities also contribute to a shift in pH (Finstein and
Morris, 1975; Bishop and Godfrey, 1983; Mahimairaja et al., 1994; Thambirajah et al.,
1995). During the later stage, nitrification can help to neutralize the pH (Tiquia and
Tam, 1998; Venglovsky et al., 2005). The reaction of decarboxylation and
ammonification/mineralization processes can be found as follows:
R-COO~ +H+ ->R-CH0+C02
R-NH2+ H2O+H++HCO~ -> NH;+HCO; +R-OH
Various species of microorganisms have different optimal pH levels. For example, the
optimal pH level for most of bacteria is from 6.0 to 7.5, while that for fungi is 5.5 to
8.5 (C. G. Golueke, 1973). Bertoldi et al. (1983) suggested that the optimum pH
levels for composting were between 5.5 and 8.0; Nakasaki et al. (1993) discussed the
pH dependency of microbial activities and found the optimal pH within a range of 7
to 8.
2.2.2.2 pH Problems in Food Waste Composting
21
Page 38
Due to the large quantity of short-chain organic acids produced in the initial stage of
food-waste composting, the pH level in the materials can hardly stay in the optimum
range for composting (Beck-Friis et al., 2001; Smars et al., 2002), which will in turn
cause less viable microbial activities so as to hinder the transformation from
mesophilic to thermophilic conditions (Day et al., 1998; Schloss and Walker, 2000;
Weppen, 2001; Cathcart et al., 1986). Several studies have explained that this
phenomenon was due to a low pH in the materials, as well as the toxicity of
short-chain organic acids. Today, this problem has been further analyzed by
examining both temperature and pH levels (Smars et al., 2002; Sundberg et al., 2004).
Beck-Friss et al. (2001) found a very low respiration activity occurred in the material
if the temperature was regulated at 55 °C and the pH to 5.1-5.5. Smars et al. (2004)
stated the initial phase of the low pH would be substantially prolonged if the
temperature was above 40 °C. Nevertheless, the length of the initial phase can be
reduced if the temperature has been kept under 40 °C until the acids disappear.
Sundberg et al. (2002) tested the combined effects of temperature (from 36 to 46 °C)
and pH (from 4.6 to 9.2) on the respiration rate during the early stage of composting.
The results showed microorganism activity would be severely inhibited at 46 °C and a
pH of less than 6, which means that combination of low pH and high temperature is
detrimental to the composting process. One hypothesis with respect to this lag phase
with low microorganism activity is that the microorganism can withstand only one
extreme environment, high temperature or low pH, but not both simultaneously
(Storm, 1985). Another possible explanation is the existence of two types of
22
Due to the large quantity of short-chain organic acids produced in the initial stage of
food-waste composting, the pH level in the materials can hardly stay in the optimum
range for composting (Beck-Friis et al., 2001; Sm&rs et al., 2002), which will in turn
cause less viable microbial activities so as to hinder the transformation from
mesophilic to thermophilic conditions (Day et al., 1998; Schloss and Walker, 2000;
Weppen, 2001; Cathcart et al., 1986). Several studies have explained that this
phenomenon was due to a low pH in the materials, as well as the toxicity of
short-chain organic acids. Today, this problem has been further analyzed by
examining both temperature and pH levels (Sm&rs et al., 2002; Sundberg et al., 2004).
Beck-Friss et al. (2001) found a very low respiration activity occurred in the material
if the temperature was regulated at 55 °C and the pH to 5.1-5.5. Sm&rs et al. (2004)
stated the initial phase of the low pH would be substantially prolonged if the
temperature was above 40 °C. Nevertheless, the length of the initial phase can be
reduced if the temperature has been kept under 40 °C until the acids disappear.
Sundberg et al. (2002) tested the combined effects of temperature (from 36 to 46 °C)
and pH (from 4.6 to 9.2) on the respiration rate during the early stage of composting.
The results showed microorganism activity would be severely inhibited at 46 °C and a
pH of less than 6, which means that combination of low pH and high temperature is
detrimental to the composting process. One hypothesis with respect to this lag phase
with low microorganism activity is that the microorganism can withstand only one
extreme environment, high temperature or low pH, but not both simultaneously
(Storm, 1985). Another possible explanation is the existence of two types of
Page 39
microorganisms, a mesophilic acid-tolerant community and a thermophilic
community which does not tolerate an acid environment. This assumption was
supported by the fact that fungi require a more acidic and colder environment than
bacteria do (Atlas and Bartha, 1998).
In the food waste composting process, temperature often rises quickly to a
thermophile level. This unfavourable condition with high temperature and low pH is
easily formed due to the good self-insulating features of the composting materials
(R.T. Haug, 1993). Therefore, the question of how to avoid this low-activity period is
a primary problem requiring a solution in food waste composting (Kwon and Lee,
2004). Meanwhile, the NH3 emission is also closely related to the pH level and the
effects of the pH variation on ammonia emission are also of concern (Groenestein and
Van Faassen, 1996; Y. Liang et al., 2006).
Unlike manure waste composting with a high degradation rate for ammonium, urea
and other organic nitrogen, and the emission of NH3 during food waste composting
shows a substantial difference (de Bertoldi et al., 1985; Tam and Tiquia, 1999). Thus,
the experience of manure-waste composting cannot be simply adapted to food waste
composting. Although the large amount of short-chain organic acids, generated in the
initial stage, can help restrain the emission of NH3, ammonia is emitted in gaseous
form when the composting process shifts to the thermophiles stage according to the
23
Page 40
evolving factors such as temperature and pH (Nakasaki et al., 1993; Beck-Friis et al.,
2001).
2.2.2.3 PH Control Methods in Food Waste Composting
Many studies have been carried out in terms of pH control strategies in the
composting process. Basically, the control methods can be divided into two groups:
alkaline-material addition and nutrient adjustment (An, 2006). SmArs (2002)
developed the temperature process control strategy but it required more energy to cool
down the composting materials in order to keep the temperature under 40 °C until the
pH level rises to 5.5. As a result, this strategy is not suitable for large-scale or
industrial composting facilities. Two order strategies will be presented in this section.
Alkaline material addition: Alkaline materials can be divided into two groups: strong
alkaline materials and weak alkaline materials. Lime is one of most commonly used
strong alkaline materials. Nakasaki et al. (1993) used lime to prevent pH level from
dropping to the acidic range in laboratory-scale composting of garbage under
well-controlled experimental conditions. The results showed that pH control can assist
in enhancing the degradation rate when compared to that without pH control. Wong
and Fang (2000) have used a series of experiments to evaluate the effects of lime on
the composting of sewage sludge. In the tests, added lime at a high level of 1.63%
could raise the pH to 7.3 to 9.2 in composting materials. The pH rose to more than 9.0
in the beginning and gradually fell to 6.9. As for the run with added lime at a low
level of 0.63%, no inhibition effects on microbial and enzymes were observed when
24
evolving factors such as temperature and pH (Nakasaki et al., 1993; Beck-Friis et al.,
2001).
2.2.2.3 PH Control Methods in Food Waste Composting
Many studies have been carried out in terms of pH control strategies in the
composting process. Basically, the control methods can be divided into two groups:
alkaline-material addition and nutrient adjustment (An, 2006). SmSrs (2002)
developed the temperature process control strategy but it required more energy to cool
down the composting materials in order to keep the temperature under 40 °C until the
pH level rises to 5.5. As a result, this strategy is not suitable for large-scale or
industrial composting facilities. Two order strategies will be presented in this section.
Alkaline material addition: Alkaline materials can be divided into two groups: strong
alkaline materials and weak alkaline materials. Lime is one of most commonly used
strong alkaline materials. Nakasaki et al. (1993) used lime to prevent pH level from
dropping to the acidic range in laboratory-scale composting of garbage under
well-controlled experimental conditions. The results showed that pH control can assist
in enhancing the degradation rate when compared to that without pH control. Wong
and Fang (2000) have used a series of experiments to evaluate the effects of lime on
the composting of sewage sludge. In the tests, added lime at a high level of 1.63%
could raise the pH to 7.3 to 9.2 in composting materials. The pH rose to more than 9.0
in the beginning and gradually fell to 6.9. As for the run with added lime at a low
level of 0.63%, no inhibition effects on microbial and enzymes were observed when
Page 41
compared with the test without any amendment. On the other hand, the thennophilic
stage was prolonged when lime was added. Sasaki et al. (2003) also used lime to
control pH in a waste oil composting treatment. The treated test could hold a pH level
of around 6 to 7. In the test without the lime addition, the pH dropped to lower than 3
after the first few days and remained at that level until the end of testing. The oil
degradation efficiency could be enhanced to 83.4% in the pH-controlled test, which
was approximately 60% more than uncontrolled test. Sodium hydroxide (NaOH) is
also widely used to adjust pH in laboratory scale composting (VanderGheynst and Lei,
2000). Due to high costs, strong alkaline additives are not suitable for a large-scale
composting application. Another reason is that a strong alkaline additive will become
totally ionized in the substrates. So that the strong base must be added gradually to
composting materials to neutralize the continually generated acids, to maintain pH at a
suitable range and to prevent a high pH level, which needs to be more labor intensive
(Sasaki et al., 2003).
Weak alkaline materials such as coal ash and wood ash residues can be used to
replace of strong alkaline in order to prevent a drop in pH during composting
(Nakasaki et al., 1993; A. G. Campbell et al., 1997). Wood ash is an alkaline material
with a pH typically between 8 to 13 and an amendment to control the pH level at 5.7
to 7.6 in yard waste and bio-solid composting (A. G. Campbell et al., 1997). Coal ash
residues which contain coal fly ash and bottom ash (also known as lagoon ash) are
• major wastes from burnt coal in electricity power stations and rich. with CaO, MgO
25
compared with the test without any amendment. On the other hand, the thermophilic
stage was prolonged when lime was added. Sasaki et al. (2003) also used lime to
control pH in a waste oil composting treatment. The treated test could hold a pH level
of around 6 to 7. In the test without the lime addition, the pH dropped to lower than 3
after the first few days and remained at that level until the end of testing. The oil
degradation efficiency could be enhanced to 83.4% in the pH-controlled test, which
was approximately 60% more than uncontrolled test. Sodium hydroxide (NaOH) is
also widely used to adjust pH in laboratory scale composting (VanderGheynst and Lei,
2000). Due to high costs, strong alkaline additives are not suitable for a large-scale
composting application. Another reason is that a strong alkaline additive will become
totally ionized in the substrates. So that the strong base must be added gradually to
composting materials to neutralize the continually generated acids, to maintain pH at a
suitable range and to prevent a high pH level, which needs to be more labor intensive
(Sasaki et al., 2003).
Weak alkaline materials such as coal ash and wood ash residues can be used to
replace of strong alkaline in order to prevent a drop in pH during composting
(Nakasaki et al., 1993; A. G. Campbell et al., 1997). Wood ash is an alkaline material
with a pH typically between 8 to 13 and an amendment to control the pH level at 5.7
to 7.6 in yard waste and bio-solid composting (A. G. Campbell et al., 1997). Coal ash
residues which contain coal fly ash and bottom ash (also known as lagoon ash) are
major wastes from burnt coal in electricity power stations and rich, with CaO, MgO
Page 42
and silicate contents. They are believed to have a large alkaline buffering capacity.
Based on results from Wong et al. (1995) and Suzuki et al. (2004), the coal fly ash
and bottom ash have a pH level of 8.87 to 12.2 and 9.8 to 11.4, respectively. Suzuki et
al. (2004) used a statistical method to evaluate the correlation between the addition of
ash and the pH level during the co-composting of wood chips waste with coal ash and
volcanic ash. There was a positive correlation between added coal bottom ash and the
pH levels. However, coal fly ash appears to be not significantly related to the pH
levels. Wong et al. (1995) investigated the effects of different amounts of coal ash
residues with microbial sludge added. The additions of fly ash and bottom ash both
caused an increase of 4.5 to 7.2 in the pH level of the sludge. Thus, the bottom ash
would be a better suited co-composting candidate because of the smaller pH drop and
high CO2 evolution. Fang et al. (1999) studied nutrient transformation with the
addition of the coal fly ash during the sewage sludge composting. The coal fly ash
amendment wouldn't cause a significant nitrogen loss but would inhibit the activities
of nitrifying bacteria and nitrogen-fixing bacteria.
Nutrient adjustment: Because of the high organic content in food wastes such as
carbohydrate and fat, it can be easily transformed into acids to create a low pH in the
initial stage (An, 2006):
C 6 H i 20 6 2C 2 H 4 (OH)C00" + 2H+
But the produced H+ can be consumed when amine is mineralized (Hanajima et al.,
2001):
26
and silicate contents. They are believed to have a large alkaline buffering capacity.
Based on results from Wong et al. (1995) and Suzuki et al. (2004), the coal fly ash
and bottom ash have a pH level of 8.87 to 12.2 and 9.8 to 11.4, respectively. Suzuki et
al. (2004) used a statistical method to evaluate the correlation between the addition of
ash and the pH level during the co-composting of wood chips waste with coal ash and
volcanic ash. There was a positive correlation between added coal bottom ash and the
pH levels. However, coal fly ash appears to be not significantly related to the pH
levels. Wong et al. (1995) investigated the effects of different amounts of coal ash
residues with microbial sludge added. The additions of fly ash and bottom ash both
caused an increase of 4.5 to 7.2 in the pH level of the sludge. Thus, the bottom ash
would be a better suited co-composting candidate because of the smaller pH drop and
high CO2 evolution. Fang et al. (1999) studied nutrient transformation with the
addition of the coal fly ash during the sewage sludge composting. The coal fly ash
amendment wouldn't cause a significant nitrogen loss but would inhibit the activities
of nitrifying bacteria and nitrogen-fixing bacteria.
Nutrient adjustment: Because of the high organic content in food wastes such as
carbohydrate and fat, it can be easily transformed into acids to create a low pH in the
initial stage (An, 2006):
C6Ht206 -• 2C2Ha(OH)COO~ + 2/T
But the produced H+ can be consumed when amine is mineralized (Hanajima et al.,
2001):
26
Page 43
R— NH2 + H20 + H+ +HCO3 -+ NH4+ +HCO3 + R— OH
Thus, an additives with high organic nitrogen could be used as a neutralization
method for pH control (Sasaki et al., 2003). Sasaki et al. have used two nitrogen
sources, urea and ammonium sulfate in the composting of waste oil. With an addition
of urea, the pH was increased to 8.5 and maintained around 6 without the use of other
manual pH controls, while ammonium sulfate could not prevent the pH from dropping
during the test.
Soybean residues such as waste from soya drinks and tofu (a popular food in Asian
countries), have also been used to amend food waste composting due to their high
nitrogen contents. Nakasaki et al. (1992) successfully composted soybean residues
with two inoculum sources; Hanajima et al. (2001) promoted the efficiency of
composing of cattle wastes and rice straw with the amendment of tofu residues. Wong
et al. (2001) investigated the effects of turning frequency in co-composting of soybean
residues and leaves.
2.2.3 Moisture Content
Water is a critical physical and ecological factor in a composting system (Miller, 1989;
Baker and Allmaras, 1990). Acceptable efficiency of microbial stabilization requires
sufficient moisture in the solid waste (Dirksen and Dasberg, 1993; Iriarte and Ciria,
2001). 50% to 70% is the most satisfactory range of moisture content for
27
R-NH2+ H2O+H++ HCO; -> NH; + HCO;+R-OH
Thus, an additives with high organic nitrogen could be used as a neutralization
method for pH control (Sasaki et al., 2003). Sasaki et al. have used two nitrogen
sources, urea and ammonium sulfate in the composting of waste oil. With an addition
of urea, the pH was increased to 8.5 and maintained around 6 without the use of other
manual pH controls, while ammonium sulfate could not prevent the pH from dropping
during the test.
Soybean residues such as waste from soya drinks and tofii (a popular food in Asian
countries), have also been used to amend food waste composting due to their high
nitrogen contents. Nakasaki et al. (1992) successfully composted soybean residues
with two inoculum sources; Hanajima et al. (2001) promoted the efficiency of
composing of cattle wastes and rice straw with the amendment of tofu residues. Wong
et al. (2001) investigated the effects of turning frequency in co-composting of soybean
residues and leaves.
2.2.3 Moisture Content
Water is a critical physical and ecological factor in a composting system (Miller, 1989;
Baker and Allmaras, 1990). Acceptable efficiency of microbial stabilization requires
sufficient moisture in the solid waste (Dirksen and Dasberg, 1993; Iriarte and Ciria,
2001). 50% to 70% is the most satisfactory range of moisture content for
27
Page 44
composting and should be maintained at an active microbial reaction (Polprasert,
1989; Robinson and Stentiford, 1993; Zhang, 2000). Water is both a products and
reactants of microbial reactions. Moisture also affects substrate porosity and gas
diffusivity. Moisture in compost can be increased by a respiration process and
decreased by an evaporation process, as well as energy loss (Stentiford, 1996).
Microbial activity may be greatly slowed due to shortage of water if the moisture
content is below 30%. At this time, additional water may help to restart the process
(Bakshi et al., 1987; Stentiford, 1996; Nakasaki et al., 2004; Nakasaki et al., 2005).
However, excessive moisture content will fill the interspace between the organic mass
and restrict aeration, resulting in odors and a significant decrease in the temperature
and rate of decomposition (Iriarte and Ciria, 2001; Jeris and Regan, 1973b; Inbar,
1990). Although the optimum moisture level varies according to materials and species
of microorganisms, it is clear that maintaining a moderate moisture content (greater
than 30%) but avoiding excessive water (greater than 70%) is essential to maintain
effective degradation (Zhang, 2000; Jeris and Regan, 1973b).
2.2.4 Oxygen
Many researchers consider oxygen consumption and carbon dioxide levels as
feedback parameters of microorganism activities (Jeris and Regan, 1973a, 1973c;
Nakasaki and Shoda, 1987; deBertoldi et al., 1988; Vinci et al., 1996; Bodelier and
Laanbroek, 1997; Richard et al., 1999). It was generally recognized that a level of
28
Page 45
oxygen less than 5% might limit aerobic activities (R.T. Haug, 1993). Moreover, the
interaction between moisture content and oxygen availability is important (Jeris and
Regan, 1973b). Excessive moisture in the compost can reduce the free air space
within the pile, which inhibits air distribution among the substrates and limits oxygen
availability and the degradation rate (Wong and Fang, 2000). On the other hand, the
oxygen level is, for the most part, decided by the aeration rate. Excessive aeration
rates will draw more evaporated water out of the system, which causes a decrease in
moisture content. If the moisture content is too low as previously discussed, the
degradation rate would also be inhibited (Wong et al., 1995; Suzuki et al., 2004;
Wong et al., 2001).
2.2.5 Nitrogen Content
Since compost has long been used as soil fertilizer, nitrogen (N) has as an essential
role in all living cells and is the most valuable part from an agricultural standpoint
(Wilson, 1989). The nitrogen transformation process has also been accepted as a
maturity and stability index for composting (Bernal et al., 1996; Fu, 2004). A loss of
nitrogen not only slows down the speed of organic matter biodegradation in the
composting process but also worsens the fertility of its products (Hu et al., 2007).
However, nitrogen-related reactions in a composting process are quite complicated.
Basically, the principle procedures governing transformation between different
species of nitrogen contain mineralization, volatilization, nitrification, immobilization
29
Page 46
and denitrification (Hellebrand, 1998). Mineralization, also known as ammonification,
is a process which transfers nitrogen content in the organic form (R-NH2) to inorganic
ammonium (NI14+), in an acidic environment. Volatilization is the conversion of
ammonium (NH4+), released in the form of ammonia gas (NH3) when the pH is
greater than 7. Nitrification and denitrification are the processes which transfer the
nitrogen element to NO2IN03", N20/N2 and cause nitrogen loss in the form of a gas
(Czepiel et al., 1996). However, NH3 is the dominant gas being emitted (Witter and
Lopez-Real, 1987; Beck-Friis et al., 2001)
The C/N ratio of the initial composting raw-materials could be the fatal reason which
affected the nitrogen loss in the composting process (de Bertoldi et al., 1980; Brink,
1995). In a composting system with a high C/N ratio, nitrogen becomes the restriction
in microorganism growth thus leads to nitrogen immobilization (assimilation). On the
other hand, carbon-limited substrates with a low C/N ratio will emit excess nitrogen
(Kirchmann and Witter, 1989; Sikora, 1999). In real world applications of composting,
the substrates can be either nitrogen-rich materials (such as grass chippings) or with
low nitrogen content (such as cellulose) (Kayragian and Tchobanogious, 1992). A
C/N ratio maintained at 15 to 30 was considered optimal for composting (R.T. Haug,
1993). It has also been verified that a lower initial C/N ratio will cause a promoted
biodegradation rate (Huang et al., 2004; Abu Qdais and Hamoda, 2004; Michel et al.,
2004).
30
and denitrification (Hellebrand, 1998). Mineralization, also known as anunonification,
is a process which transfers nitrogen content in the organic form (R-NH2) to inorganic
ammonium (NHt+), in an acidic environment. Volatilization is the conversion of
ammonium (NHt+), released in the form of ammonia gas (NH3) when the pH is
greater than 7. Nitrification and denitrification are the processes which transfer the
nitrogen element to NO2VNO3", N2O/N2 and cause nitrogen loss in the form of a gas
(Czepiel et al., 1996). However, NH3 is the dominant gas being emitted (Witter and
Lopez-Real, 1987; Beck-Friis et al., 2001)
The C/N ratio of the initial composting raw-materials could be the fatal reason which
affected the nitrogen loss in the composting process (de Bertoldi et al., 1980; Brink,
1995). In a composting system with a high C/N ratio, nitrogen becomes the restriction
in microorganism growth thus leads to nitrogen immobilization (assimilation). On the
other hand, carbon-limited substrates with a low C/N ratio will emit excess nitrogen
(Kirchmann and Witter, 1989; Sikora, 1999). In real world applications of composting,
the substrates can be either nitrogen-rich materials (such as grass chippings) or with
low nitrogen content (such as cellulose) (Kayragian and Tchobanogious, 1992). A
C/N ratio maintained at 15 to 30 was considered optimal for composting (R.T. Haug,
1993). It has also been verified that a lower initial C/N ratio will cause a promoted
biodegradation rate (Huang et al., 2004; Abu Qdais and Hamoda, 2004; Michel et al.,
2004).
30
Page 47
Some pH control amendments also affect the nitrogen transfonnation process (Sun,
2006). In Fang et al.'s experiments, a 35% level of coal fly ash amendment could
significantly inhibit decomposition activity so that the concentration of organic
nitrogen and total nitrogen increased along with the composting process. The coal fly
ash also caused obvious NH4+-N during the thermophilic phase. Moreover, added coal
fly ash would also lower the amount of soluble NO3-N content, indicating a reduced
nitrification process (Fang and Wong, 1999). On the other hand, although coal bottom
ash has been accepted as a suitable pH control amendment, the effects of coal bottom
ash on nitrogen transfonnation have seldom been reported. To avoid nitrogen
emission, many measures have been taken into consideration. For example, high
carbon-containing substrates (sawdust and straw), physical adsorbents (clay, zeolite,
and basalt) and chemical absorbents (hydrogen phosphate) have been introduced
(Witter and Lopez-Real, 1988; Jeong and Hwang, 2005; Jeong and Kim, 2001).
2.3 Modeling of the Composting Process
Previously, many studies have been undertaken to conduct modeling simulation of
composting processes (Whang and Meenaghan, 1980; Heijnen and Roele, 1981;
Hamelers, 2001; Marugg, 1993; Hauhs, 1996; Mysliwiec et al., 2001; Nelson et al.,
2003; Trefry and Franzmann, 2003; Johannessen et al., 2005; Stombaugh and Nokes,
1996). Jeris and Regan (1973a, b, c) considered multiple factors of the composting
process in their models. Haug (1993) discussed the possibilities of using different
dynamic models to simulate composting systems. Many proposed models have been
31
Some pH control amendments also affect the nitrogen transformation process (Sun,
2006). In Fang et al.'s experiments, a 35% level of coal fly ash amendment could
significantly inhibit decomposition activity so that the concentration of organic
nitrogen and total nitrogen increased along with the composting process. The coal fly
ash also caused obvious NH/-N during the thermophilic phase. Moreover, added coal
fly ash would also lower the amount of soluble NO3-N content, indicating a reduced
nitrification process (Fang and Wong, 1999). On the other hand, although coal bottom
ash has been accepted as a suitable pH control amendment, the effects of coal bottom
ash on nitrogen transformation have seldom been reported. To avoid nitrogen
emission, many measures have been taken into consideration. For example, high
carbon-containing substrates (sawdust and straw), physical adsorbents (clay, zeolite,
and basalt) and chemical absorbents (hydrogen phosphate) have been introduced
(Witter and Lopez-Real, 1988; Jeong and Hwang, 2005; Jeong and Kim, 2001).
2.3 Modeling of the Composting Process
Previously, many studies have been undertaken to conduct modeling simulation of
composting processes (Whang and Meenaghan, 1980; Heijnen and Roele, 1981;
Hamelers, 2001; Marugg, 1993; Hauhs, 1996; Mysliwiec et al., 2001; Nelson et al.,
2003; Trefiy and Franzmann, 2003; Johannessen et al., 2005; Stombaugh and Nokes,
1996). Jeris and Regan (1973a, b, c) considered multiple factors of the composting
process in their models. Haug (1993) discussed the possibilities of using different
dynamic models to simulate composting systems. Many proposed models have been
Page 48
verified through lab-scale experiments (Finger et al., 1976; Suler and Finstein, 1977;
Beck, 1979). Nowadays, the main stream of models will consider parameter such as
temperature, moisture, oxygen content, carbon dioxide, energy content and substrate
composition (Lin, 2006; R.T. Haug, 1993; R. T. Haug, 1996; Richard, 1997;
VanderGheynst et al., 1996; VanderGheynst, 1997; K. Ekinci, 2001).
Various portions of the composting process have been simulated, such as respiratory
activities under the effects of many physical, chemical and biological variables (Beck,
1984; Ljung and Glad, 1994; Nobuyuki et al., 2001; Das and Keener, 1996).
Moreover, the interactions, or multiple dimensional interactions among different
parameters must be taken into consideration. For example, the air flow rate will affect
temperature in two ways - input of cold ambient air causes a reduction temperature
and a prompted reaction rate, due to sufficient oxygen causes an increase in
temperature. Air flow will cause the evaporation of more water content. Therefore,
aeration rate, temperature and moisture are interrelated (R.T. Haug, 1993; R. T. Haug,
1996; Bari and Koening, 2001; Richard, 1997; Van Lier et al., 1994). To investigate
the energy flow in the modeling, normal conduction, convection and phase change
would be considered but conduction can frequently be negligible, especially in forced
air systems with high aeration rate (MacGregor et al., 1981; Trefry and Franzmann,
2003; Hall, 1998; R. Smith and Eilers, 1980)
32
Page 49
Smith and Eilers (1980) proposed a two dimensional fmite difference model to
simulate windrow bio-solid composting with forced aeration conditions. The spatial
and temporal solutions of airflow, substrate decomposition and heat generation were
studied. The model was based on the assumption that flow patterns and quantities of
air were independent of time. There were several corresponding experiments to
validate the accuracy of the model in order to predict dry matter, volatile matter and
moisture content. Nakasaki (1987) developed a model to describe the process of
composting of sewage sludge cake composting. Mass and heat balance in a complete
batch reactor were the basis of this model. Carbon dioxide release and volatile
transformation were considered and the system's temperature and water content were
calculated. Three experiments also supported the validity of the model.
A continuous feed complete mix reactor was invented by Haug (1993), in which the
composting mass was schematically represented by gas, liquid and solid phases.
Many models have focused on this type of composting and organic matter degradation
was treated as a first-order reaction with respect to substrate concentration in these
models. The reaction constants in this reaction were correlated to the temperature.
Correlation factors with respect to suboptimal values of air filled volume fraction,
moisture content and oxygen concentration in aerated gas were taken into
consideration. Van Tier et al. (1994) developed a mathematical model of the
composting process based on mass and heat transfer in phase-II composting.
Continuous simulation and modeling were conducted via time-dependent analysis so.
33
Smith and Eilers (1980) proposed a two dimensional finite difference model to
simulate windrow bio-solid composting with forced aeration conditions. The spatial
and temporal solutions of airflow, substrate decomposition and heat generation were
studied. The model was based on the assumption that flow patterns and quantities of
air were independent of time. There were several corresponding experiments to
validate the accuracy of the model in order to predict dry matter, volatile matter and
moisture content. Nakasaki (1987) developed a model to describe the process of
composting of sewage sludge cake composting. Mass and heat balance in a complete
batch reactor were the basis of this model. Carbon dioxide release and volatile
transformation were considered and the system's temperature and water content were
calculated. Three experiments also supported the validity of the model.
A continuous feed complete mix reactor was invented by Haug (1993), in which the
composting mass was schematically represented by gas, liquid and solid phases.
Many models have focused on this type of composting and organic matter degradation
was treated as a first-order reaction with respect to substrate concentration in these
models. The reaction constants in this reaction were correlated to the temperature.
Correlation factors with respect to suboptimal values of air filled volume fraction,
moisture content and oxygen concentration in aerated gas were taken into
consideration. Van lier et al. (1994) developed a mathematical model of the
composting process based on mass and heat transfer in phase-II composting.
Continuous simulation and modeling were conducted via time-dependent analysis so
Page 50
differential equations could be solved. The substrates were stratified because of their
different densities and porosities. The simulation results contain a time series of
oxygen demand, water and dry matter weight losses, temperature in various layers,
and heat loss through the tunnel wall of the container. The experimental data was used
to validate the model.
Stombaugh and Nokes (1996) designed a dynamic composting model to describe
microbial growth and death kinetics. Organic matter degradation rates were obtained
by establishing a stoichiometric conversion and parameterizing reasonable factors. To
test its validity, the model was compared to a lab scale experiment which composted a
mixture of cracked corn and palletized corncobs. The results showed that the model
was able to predict temperature fluctuation, the oxygen uptake rate, and moisture
exchange and substrate degradation for the input mixture which was readily
compostable.
Several related studies regarding developing kinetics models for microbiology
reactions models during the composting process exist. Hall (1998) developed a
numerical model which contained substrate, oxygen, moisture and energy as four
primary parameters. The changes in variables on system dynamics were investigated.
Hamelers (2001) constructed a particle-level mathematical model based on biofilm
theory. Polymeric substrates, microbial biomasses, oxygen and water concentration
were treated as state variables. First-order-kinetic and Mechaelis-Menten
34
Page 51
multiple-substrate-dependent rates have been used to model reaction rates. Nakhla et
al. (2006) have developed a modified Monod model including first-order hydrolysis of
particulate organic matter. Other than these kinetics, the Monod equation is the most
widely used equation (Monod, 1949; Xi et al., 2005; Petric and Selimbasic, 2008). Xi
et al. (2005) used two-stage Monod kinetics to analysis composting processes under
different limitative conditions. I. Petric and V. Selimbasic (2008) simulated aerobic
composting processes using a derivative form of the Monod equation with integrated
mass and heat transfer. Based predominantly on the Monod equation and its
modification, various kinetics models have been reported (Isik and Sponza, 2005;
Castillo et al., 1999; Nakhla et al., 2006; Bhunia and Ghangrekar, 2008). Furthermore,
many researchers have worked on comparing different kinetics models. The effects of
Monod, the Grau second-order and the Haldane kinetic model were compared through
linear and non-linear regression by Bhunia and Ghangrekar (2008). However,
limitations in previous models could be found only concentration of overall
microorganisms was used instead of considering different kinds separately (Richard
and Walker, 2006). Meanwhile, few studies have been conducted to quantitatively
investigate the interaction effects between pH and temperature on microbial growth
during the composting process.
2.4 Literature Review Summary
Composting has been recognized as a cost-effective alternative for treating food waste.
In the past decades, many research efforts have been undertaken to contribute to our
35
multiple-substrate-dependent rates have been used to model reaction rates. Nakhla et
al. (2006) have developed a modified Monod model including first-order hydrolysis of
particulate organic matter. Other than these kinetics, the Monod equation is the most
widely used equation (Monod, 1949; Xi et al., 2005; Petric and Selimbasic, 2008). Xi
et al. (2005) used two-stage Monod kinetics to analysis composting processes under
different limitative conditions. I. Petric and V. Selimbasic (2008) simulated aerobic
composting processes using a derivative form of the Monod equation with integrated
mass and heat transfer. Based predominantly on the Monod equation and its
modification, various kinetics models have been reported (Isik and Sponza, 2005;
Castillo et al., 1999; Nakhla et al., 2006; Bhunia and Ghangrekar, 2008). Furthermore,
many researchers have worked on comparing different kinetics models. The effects of
Monod, the Grau second-order and the Haldane kinetic model were compared through
linear and non-linear regression by Bhunia and Ghangrekar (2008). However,
limitations in previous models could be found only concentration of overall
microorganisms was used instead of considering different kinds separately (Richard
and Walker, 2006). Meanwhile, few studies have been conducted to quantitatively
investigate the interaction effects between pH and temperature on microbial growth
during the composting process.
2.4 Literature Review Summary
Composting has been recognized as a cost-effective alternative for treating food waste.
In the past decades, many research efforts have been undertaken to contribute to our
Page 52
understanding of the composting process, technology development and modeling
simulation, which have proven to be essential in achieving the successful operation of
food waste composting. However, due to the distinctive features of food waste,
traditional solid waste disposal methods are no longer suitable, in-depth studies are
still lacking with respect to improving system efficiency and reliability:
(i) The literature review indicates complicated interactions of pH with other
parameters in the composting system and different stages of pH evolvement are
mutually related. However, the strategy of pH control is not straightforward:
keeping pH neither dropping in the initial stage to promote microorganism
activity nor rising too high at the thermophilic stage to prevent a loss of ammonia.
Few studies were conducted to meet the objective successfully with regards to the
conflict. As a result, a new category of amendment which has different effects on
pH in the composting system at different stages is desired.
(ii) A composting system is extremely complex and dynamic, or even case specific.
Many types of microorganisms exist and various reactions take place in the
system so their temporal variations must be taken into consideration. Previous
models which consider overall microbial concentration cannot depict the system
precisely and accurately. Consequently, previous empirical parameters, such as
kinetics parameters, optimal value of temperature, and pH are case-specific. Thus,
the development of a modelling system that .incorporates both mesophilic and
36
Page 53
thermophilic microorganisms is desired. Such a model could provide parameters
for mesophiles and thermophiles, respectively. Moreover, this method would be
able to deal with the interactive effects of temperature and pH on the two types of
microorganisms, which is beneficial when it comes to understanding regarding
the mechanics of different microbes under different temperatures and pH
conditions.
37
Page 54
CHAPTER 3
MATERIALS AND METHOD
3.1 Overview of Experimental Approaches
In order to fulfill the objectives of this study, ten individual runs (A, B, C, D, El, E2,
Fl, F2, G1 and G2) were carried out with specifically designed amendments or
approaches under two different experiments. Experiment I was intended to analyze
the effects of buffer salts in composting. Three types of buffer salts (K2HPO4/MgSO4,
KH2PO4/MgSO4 and NaAc) with different initial pH were added into Runs A, B and
C, respectively. Experiment II aimed to modify the Monod equation in order to reflect
thermophile and mesophile activity, respectively. To create different external
conditions, water was added into Run E and temperature control was conducted at
Run F. The composting reaction took place under fully aerated (3.00 L/min)
conditions. Small samples were extracted from a compost reactor to undertake a
physical and a chemical test, in order to investigate microbial growth and activity.
Numbers of populations of microorganisms were counted to reflect the degree of
microorganism growth.
3.2 Composting Materials
To control the potential variability of substrate characteristics, a synthetic food waste
with better uniformity was preferred to real restaurant or cafeteria wasted (Schwab et
al., 1994). In this study, in order to obtain sufficient nutrients and a proper C/N ratio
38
CHAPTER 3
MATERIALS AND METHOD
3.1 Overview of Experimental Approaches
In order to fulfill the objectives of this study, ten individual runs (A, B, C, D, El, E2,
Fl, F2, G1 and G2) were carried out with specifically designed amendments or
approaches under two different experiments. Experiment I was intended to analyze
the effects of buffer salts in composting. Three types of buffer salts (K^HPO-j/MgSO^
KH2P04/MgSC>4 and NaAc) with different initial pH were added into Runs A, B and
C, respectively. Experiment II aimed to modify the Monod equation in order to reflect
thermophile and mesophile activity, respectively. To create different external
conditions, water was added into Run E and temperature control was conducted at
Run F. The composting reaction took place under fully aerated (3.00 L/min)
conditions. Small samples were extracted from a compost reactor to undertake a
physical and a chemical test, in order to investigate microbial growth and activity.
Numbers of populations of microorganisms were counted to reflect the degree of
microorganism growth.
3.2 Composting Materials
To control the potential variability of substrate characteristics, a synthetic food waste
with better uniformity was preferred to real restaurant or cafeteria wasted (Schwab et
al., 1994). In this study, in order to obtain sufficient nutrients and a proper C/N ratio
38
Page 55
and moisture, a mixture of potato, carrot, ground pork, steamed rice, cooked soybean
and leaves was utilized as synthetic food waste. All food products were brought from
a local grocery store and pretreated prior to the experiment. The soybeans and rice
were steamed, and carrots and potatoes were peeled and chopped into pieces with a
diameter of approximately 5 mm. All food materials were ground into small pieces
and thoroughly mixed manually before being loaded into the compost reactor. (R.T.
Haug, 1993; Richard et al., 2002). The substrate composition and initial
characteristics of the raw materials can be found in Table 3.1 and Table 3.2,
respectively (Cheung, 2008). In Experiment I, K2HPO4, KH2PO4, NaAc with the same
amount of substance was added into Runs A, B and C as three different types of pH
amendment. To achieve a better performance of phosphate, MgSO4 was added into
Runs A and B with a mole ratio of 2:1 to phosphate buffer salts. The detailed
mole-based amounts of amendments are listed in Table 3.3. In Experiment II, different
conditions were adopted to test microbial activity. As a result, water was added into
Runs Fl and F2; the temperature of Runs GI and G2 was controlled between 50 °C
and 60 °C. Detailed external conditions can be found on Table 3.4.
3.3 In-Vessel Composting System
Figure 3.1shows a schematic diagram of the experimental system of this experiment.
The main reactor was assembled in three parts: an upper part, a bottom part and a
cylindrical body. The reactor was designed and manufactured as presented by Figure
3.2 to Figure 3.4. The main body of the reactor was made of acrylic tube with a
39
and moisture, a mixture of potato, carrot, ground pork, steamed rice, cooked soybean
and leaves was utilized as synthetic food waste. All food products were brought from
a local grocery store and pretreated prior to the experiment. The soybeans and rice
were steamed, and carrots and potatoes were peeled and chopped into pieces with a
diameter of approximately 5 mm. All food materials were ground into small pieces
and thoroughly mixed manually before being loaded into the compost reactor. (R.T.
Haug, 1993; Richard et al., 2002). The substrate composition and initial
characteristics of the raw materials can be found in Table 3.1 and Table 3.2,
respectively (Cheung, 2008). In Experiment I, K2HPO4, KH2PO4, NaAc with the same
amount of substance was added into Runs A, B and C as three different types of pH
amendment. To achieve a better performance of phosphate, MgSC>4 was added into
Runs A and B with a mole ratio of 2:1 to phosphate buffer salts. The detailed
mole-based amounts of amendments are listed in Table 3.3. In Experiment II, different
conditions were adopted to test microbial activity. As a result, water was added into
Runs F1 and F2; the temperature of Runs G1 and G2 was controlled between 50 °C
and 60 °C. Detailed external conditions can be found on Table 3.4.
3 J In-Vessel Composting System
Figure 3.1 shows a schematic diagram of the experimental system of this experiment.
The main reactor was assembled in three parts: an upper part, a bottom part and a
cylindrical body. The reactor was designed and manufactured as presented by Figure
3.2 to Figure 3.4. The main body of the reactor was made of acrylic tube with a
Page 56
Table 3.1 Synthetic substrate composition in food waste composting system
Composition Amount (kg) Mass Percentage
Potato 1.27 12.7%
Rice 2.01 2.0%
Carrot 1.96 19.6%
Leaves 0.46 4.6%
Pork meat 0.35 3.5%
Soy bean 1.96 19.6%
Seed soil 2.00 20%
Total weight 10.00 100%
40
Table 3.1 Synthetic substrate composition in food waste composting system
Composition Amount (kg) Mass Percentage
Potato 1.27 12.7%
Rice 2.01 2.0%
Carrot 1.96 19.6%
Leaves 0.46 4.6%
Pork meat 0.35 3.5%
Soybean 1.96 19.6%
Seed soil 2.00 20%
Total weight 10.00 100%
40
Page 57
Table 3.2 Physical and chemical properties of the initial composting material
Parameter value
pH 5.99-6.06
Moisture Content (%) 64.0-67.0
C/N Ratio 18.1-20.6
Organic Content in Dry Solids(%) 92.0-97.0
Ash Content (%) 3.00-8.00
41
Table 3.2 Physical and chemical properties of the initial composting material
Parameter value
pH 5.99-6.06
Moisture Content (%) 64.0-67.0
C/N Ratio 18.1-20.6
Organic Content in Dry Solids(%) 92.0-97.0
Ash Content (%) 3.00-8.00
41
Page 58
Table 3.3 Composition of amendments in Experiment I
Amendment(g) Run A Run B Run C Run D
K2HPO4 195.00 0 0 0
KH2PO4 0 152.00 0 0
MgSO4 276.00 276.00 0 0
NaAc 0 0 100.00 0
42
Table 3.3 Composition of amendments in Experiment I
Amendment(g) Run A Run B Run C Run D
K2HPO4 195.00 0 0 0
KH2PO4 0 152.00 0 0
MgS04 276.00 276.00 0 0
NaAc 0 0 100.00 0
42
Page 59
Table 3.4 Experiment conditions in Experiment II
Condition Run E Run F Run G
Water as solvent (kg)
Temperature
0
Self-heating
0.70
Self-heating
0.70
Heating to keep T
between 50 °C and 60 °C
43
Table 3.4 Experiment conditions in Experiment II
Condition Run E Run F Run G
Water as solvent (kg) 0 0.70 0.70
Heating to keep T Temperature Self-heating Self-heating
between 50 °C and 60 °C
43
Page 60
Exhaust Gas Row
insulator
Composting
Matenais
Upper
Thermocouple
Lower
Thermocouple t t t
1 X
Leachate Overflow
02 Moridor
Effluent Air
Desiccabr Condensate Monacan Trap
Air Flow Meter Vacuum Air Fresh Air Input
Pump
Figure 3.1 Schematic diagram of the composting system
44
Exhaust Gas Flow
Condenser
Upper
Thermocouple
Lower
Thermocouple
Desiccator Condensate AmmonteTrap Colector
Leachate Overflow Air Row Meter Vacuum Air Fresh Air Input
Pump
Figure 3.1 Schematic diagram of the composting system
44
Page 61
Exhaust Gas Outlet
Thermocouple Poitit
Thermocouple Point
Pillars
Madan Distribution
Plate
Laicism Outlet
0-dng Vimi Tube with Tiny Holes
Sim"ling Port
0-ring Rubber Seal
Aeration Distribution Chamber
Compressed Mr Inkt
Figure 3.2 Schematic diagram of the in-vessel reactor
45
Gas Outlet
Thermocouple Point
Thennoooaple Point
Sampling Pact
Pillars
Aenuoo Distribution
Plate
T
O-ring Rubber Seal
Lcachate Outlet
O-ring Vinyl Tube with Tiny Hole«
Aeration Distribution Chamber
Compressed Air Inlet
Figure 3.2 Schematic diagram of the in-vessel reactor
45
Page 62
Figure 3.3 Picture of the in-vessel composting reactor
46
Figure 3.3 Picture of the in-vessel composting reactor
Page 63
Figure 3.4 Picture of the in-vessel composting reactor with insulation layer
47
Figure 3.4 Picture of the in-vessel composting reactor with insulation layer
47
Page 64
12-inch inside diameter, an 18-inch height and a 0.25-inch wall thickness. The top and
bottom were made of acrylic plate with a thickness of 0.50 inch and a diameter of 16
inches. And the bottom was glued to the body while the top was open for the
convenience of feeding and cleaning. There were six pillars with screw caps evenly
distributed around the reactor to provide pressure and enhance the air tightness of the
system.
The space within the main body of the reactor could be divided into two parts - one
part for the composting reaction and the other for air distribution. The composting
reaction section had a height of 16 inches and an approximate volume of 1 cubic foot.
The aeration distribution section was segmented by a holed acrylic plate of 0.25
inches in thickness and an attached mesh layer (0.10x0.10-inch pore size) on the plate.
The screened plate supported the compost substrate and prevented them from
dropping into the aeration distribution section. In order to ensure air flowed evenly
from the aeration distribution section to the composting reaction section, the aeration
distribution section was connected with a round vinyl air distribution pipe on the
surface, of which there were many tiny holes.
The bottom of the reactor had two holes, one being a compressed air inlet and the
other a leachate outlet. Air was diffused upward by a vacuum pump (M0A-P101-AA,
GAST Manufacturing Inc., MI). The inlet air would go through an airflow meter
(No.13 Shielded Flowmeter Gilmont instrument, IL) before reaching the aeration
48
12-inch inside diameter, an 18-inch height and a 0.25-inch wall thickness. The top and
bottom were made of acrylic plate with a thickness of 0.50 inch and a diameter of 16
inches. And the bottom was glued to the body while the top was open for the
convenience of feeding and cleaning. There were six pillars with screw caps evenly
distributed around the reactor to provide pressure and enhance the air tightness of the
system.
The space within the main body of the reactor could be divided into two parts - one
part for the composting reaction and the other for air distribution. The composting
reaction section had a height of 16 inches and an approximate volume of 1 cubic foot.
The aeration distribution section was segmented by a holed acrylic plate of 0.25
inches in thickness and an attached mesh layer (0.10x0.10-inch pore size) on the plate.
The screened plate supported the compost substrate and prevented them from
dropping into the aeration distribution section. In order to ensure air flowed evenly
from the aeration distribution section to the composting reaction section, the aeration
distribution section was connected with a round vinyl air distribution pipe on the
surface, of which there were many tiny holes.
The bottom of the reactor had two holes, one being a compressed air inlet and the
other a leachate outlet. Air was diffused upward by a vacuum pump (MOA-PIOI-AA,
GAST Manufacturing Inc., MI). The inlet air would go through an airflow meter
(No. 13 Shielded Flowmeter Gilmont instrument, IL) before reaching the aeration
Page 65
distribution section so the aeration rate could be monitored and adjusted. There were
three holes on the top, one for compost sampling, the second for thermometer
insertion and the third for an air outlet. Two thermometers were tapped on a stainless
steel rod at different heights, inserted into the reactor and sealed with #1 rubber
stopper. The sampling port was designed with a 2.50-inch diameter and constantly
sealed with a #13 rubber stopper except samples were taken from the composting
system. An 0-ring with 0.25-inch thickness, 11-inch inside diameter and 13-inch
outside diameter was utilized to tighten the upper and body sections of the reactor
together. The gas outlet had a 1.00 inch opening for the release of exhaust gas. A tee
connector was linked with the gas outlet. One end of the tee was designed for gas
sampling when analysis was undertaken. It is usually closed during the composting
process and only opened when gas is tested. The other end of the tee was arranged for
gas absorption and discharge. A desiccator (a conical flask) was used to collect
evaporated water from the exhaust gas outlet through a plastic tube. Afterwards, a
condenser (Pryex 2560) would trap all remaining escaped moisture into a collector.
The dewatered gas will bubbled into a flask with 100 mL 0.20M sulfuric acid (H2SO4)
solution to absorb the ammonia gas. An oxygen monitor was then connected with the
acidic washing bottle to evaluate oxygen concentration. Outlet gas finally discharged
into the lab ventilation system through plastic tube.
The reactor was shielded by three layers of heat-insulating materials when the reactor
system was set up to minimize heat loss. The inner layer was heavy duty aluminum
49
distribution section so the aeration rate could be monitored and adjusted. There were
three holes on the top, one for compost sampling, the second for thermometer
insertion and the third for an air outlet. Two thermometers were tapped on a stainless
steel rod at different heights, inserted into the reactor and sealed with #1 rubber
stopper. The sampling port was designed with a 2.50-inch diameter and constantly
sealed with a #13 rubber stopper excqpt samples were taken from the composting
system. An O-ring with 0.25-inch thickness, 11-inch inside diameter and 13-inch
outside diameter was utilized to tighten the upper and body sections of the reactor
together. The gas outlet had a 1.00 inch opening for the release of exhaust gas. A tee
connector was linked with the gas outlet. One end of the tee was designed for gas
sampling when analysis was undertaken. It is usually closed during the composting
process and only opened when gas is tested. The other end of the tee was arranged for
gas absorption and discharge. A desiccator (a conical flask) was used to collect
evaporated water from the exhaust gas outlet through a plastic tube. Afterwards, a
condenser (Pryex 2560) would trap all remaining escaped moisture into a collector.
The dewatered gas will bubbled into a flask with 100 mL0.20M sulfuric acid (H2SO4)
solution to absorb the ammonia gas. An oxygen monitor was then connected with the
acidic washing bottle to evaluate oxygen concentration. Outlet gas finally discharged
into the lab ventilation system through plastic tube.
The reactor was shielded by three layers of heat-insulating materials when the reactor
system was set up to minimize heat loss. The inner layer was heavy duty aluminum
49
Page 66
foil, which was used to reflect heat. The middle layer was a foam insulation material
with which to fill the interspaces between the reactor's surface and six pillars. An
insulator filled with fiberglass with a thickness of 3.50 inches was used as the outer
layer around the reactor. Similar insulators were applied on the top and bottom. Three
straps were buckled around the reactor to ensure the tightness of the insulating
materials. In the laboratory, a 20±1.00 °C room temperature was maintained during
the experiment.
3.4 Turning and Sampling
Turning the compost material with a shovel was undertaken a few times daily before
taking samples in order to homogenize the compost material inside the reactor.
Samples were collected every day to analyze pH, moisture content, ash content,
ammonium, C/N ratio and microorganism. Three samples of approximately 50 g were
collected, randomly, from the reactors after the turning is over. In order to achieve an
evenly-distributed, consistent and highly representative pooled sample, three samples
(regardless of moisture content) were then mixed in a 500 mL beaker. Then, the
pooled sample was divided into several small individual sub-samples by weight for
the parameter tests. Some samples were used to analyze more than one parameter.
3.5 Physical and Chemical Analysis
Physical, chemical and microbial parameters which included temperature, pH, oxygen
uptake rate (OUR), weight of compost material and reactor, moisture, ash and organic
50
Page 67
contents, gaseous ammonia and aqueous ammonium concentrations, carbon-nitrogen
ratio and microorganism colony counting were measured during the experiment to
evaluate the composting process. The analysis procedures and determinations of
specific parameters are given below (Figure 3.5)
3.5.1 Weight and Volume
The weight and volume of the remaining composting materials were measured daily.
To determine the mass of the decomposed compost material in a reactor ( Wcompost), the
total weight of both the reactor and compost substrate (Wcompost+reactor) on day i was
measured on an electronic scale. The weight of the empty reactor was 10.9 kg
(Wreactor):
(compost)i(k g) = W(compost+reactor)i (kg) — W reactor (kg)
= W (compatt+reactor)i (kg)-10.9
A ruler was used to measure the distance (hdistance) from the upper surface of the
composting material, 1 to the top of the reactor on a daily basis. Because the size of
the designed reactor was known (total height was 16 inches and inner diameter was 12
inches).
Knives! = -7-4 D (kW' hdistance) = 113x (1 6—hd!stance)
51
contents, gaseous ammonia and aqueous ammonium concentrations, carbon-nitrogen
ratio and microorganism colony counting were measured during the experiment to
evaluate the composting process. The analysis procedures and determinations of
specific parameters are given below (Figure 3.5)
3.5.1 Weight and Volume
The weight and volume of the remaining composting materials were measured daily.
To determine the mass of the decomposed compost material in a reactor (fVcompost), the
total weight of both the reactor and compost substrate (fVcomposl+reactor) on day i was
measured on an electronic scale. The weight of the empty reactor was 10.9 kg
(Wreactor)•
^(compost+reaetor)i ($8) -W^ikg)
A ruler was used to measure the distance (hdistance) from the upper surface of the
composting material, 1 to the top of the reactor on a daily basis. Because the size of
the designed reactor was known (total height was 16 inches and inner diameter was 12
inches).
Ko^s, = -Kisxmct) = 1 13x (16 —AdisaaJ
51
Page 68
Put no not olsomplo Ma to rumor
Tskri 150g sompls saw lurning
5p, add 25 ra12111 10p. add 00 ml 5 10 KCI solution for 59. dry at105'CI 5 I" acidly and dry al OM% slosIturd g. add rol mist
for pH H144:11 lAcislunt Content 105'C for CN NaCt solution far Concentration Raw colony coating
I Mialum SW wing
OAOpm mentesio for ND, 4Calartallon
woo* al SOO V Ow Ash Conlost
Figure 3.5 Detailed procedure of sample testing
52
Put •» mat o< back to iwoor
>fer
StMkiyMddqii 100 *C for CM
5 g, (ky at 106 *C tot NaCtMMbnlor ootaiy umi^nj
Figure 3.5 Detailed procedure of sample testing
52
Page 69
3.5.2 Moisture Content
Thermo-gravimetry was chosen to measure moisture content and ash content (Black,
1965). A crucible with a cover was weighted after it had been dried in the oven at 105
°C overnight to a constant weight (Wcrucibk). A 5.00 g wet sub-sample was placed in
the crucible and weighted (W wet-total) with the cover closed to reduced evaporation.
Later, the sample with the crucible was dried at 105 ±5 °C in the oven for over 4
hours. The sample was removed from the oven and placed into a desiccator until it
cooled to room temperature. The sample was then weighted with the cover closed
(Wary-wia0. The moisture content of the compost sample could be calculated using
Wcrucibk: Wwet-total and Why-total based on the following equation:
Moisturecontent = Wva —total —W dry—total x100%
Wwet—total —Wctucibk
After the Wthy-totai data was recorded, the cooled crucible with compost material was
retained for ash content analysis.
3.5.3 Ash and Organic Content
The ignition method was used to obtain the ash content data from the compost
samples (Black, 1965). After measurement the moisture content, the dry sample
(Wiry-total) was incinerated in a muffle-furnace at 550 °C for about 4 hours. Then it was
removed from the furnace and placed in a desiccator to cool. When the sample
reached room temperature, the fmal weight was recorded as W — final- Based on an
assumption that the inorganic matter remained unchanged during the food waste
53
3.5.2 Moisture Content
Thermo-gravimetry was chosen to measure moisture content and ash content (Black,
1965). A crucible with a cover was weighted after it had been dried in the oven at 105
°C overnight to a constant weight (fVcrucMe)- A 5.00 g wet sub-sample was placed in
the crucible and weighted (fVweMOta/) with the cover closed to reduced evaporation.
Later, the sample with the crucible was dried at 105 ±5 °C in the oven for over 4
hours. The sample was removed from the oven and placed into a desiccator until it
cooled to room temperature. The sample was then weighted with the cover closed
(Wdry-toiai)- The moisture content of the compost sample could be calculated using
Wcrucibie, WweMoml and Wdry-totai based on the following equation:
W -W Moisturecontent = ^-totai x
W -W yvet-total crucible
After the Wdry-wmi data was recorded, the cooled crucible with compost material was
retained for ash content analysis.
3.5.3 Ash and Organic Content
The ignition method was used to obtain the ash content data from the compost
samples (Black, 1965). After measurement the moisture content, the dry sample
(Wdry-tou!) was incinerated in a muffle-furnace at 550 °C for about 4 hours. Then it was
removed from the furnace and placed in a desiccator to cool. When the sample
reached room temperature, the final weight was recorded as Wf,nai. Based on an
assumption that the inorganic matter remained unchanged during the food waste
53
Page 70
composting (Jeong and Kim, 2001; Stabnikova et al., 2005), ash and organic-matter
contents could be calculated using the following equations.
"a r"cible X100% AshContent; = Wfii —Wccfry-toial — Wcnicibk
Organic — matterContent =1— AshContent
—W = rby-total final W —W wet-total crucible
And the percentage of degradation (the loss of organic matter) could be calculated as
follows:
OMLoss. = -4 xi00% (1-4)4
Where Ai and Ao are the ash contents of ith day and the initial ash contents,
respectively.
3.5.4 Oxygen Uptake Rate (OUR)
M40 Multi-Gas Monitor (Industrial Scientific Corp., Oakdale, PA) was used to
monitor the oxygen concentration of exhaust gas. The OUR, a parameter describing
the amount of oxygen consumed by microorganisms, was the difference between inlet
and outlet concentrations of oxygen. First, an ambient 0 2 concentration was recorded
as 02,air (%). The monitor was then connected to the exhaust gas outlet of the
composting system. Data was read and recorded as 02,out (%) after 40 seconds to
attain a stabilized reading. At last, the oxygen uptake rate (OUR) could be calculated
using this equation:
54
composting (Jeong and Kim, 2001; Stabnikova et al., 2005), ash and organic-matter
contents could be calculated using the following equations.
W —W AshContent = x 100%
' w —w dry-total crucible
Organic - matterContent = 1 - AshContent
W - W _ "dry-total "final
W -W wet-total crucible
And the percentage of degradation (the loss of organic matter) could be calculated as
follows:
OMLoss, = A,~A° x 100% 0-4)4
Where A,• and Ao are the ash contents of ith day and the initial ash contents,
respectively.
3.5.4 Oxygen Uptake Rate (OUR)
M40 Multi-Gas Monitor (Industrial Scientific Corp., Oakdale, PA) was used to
monitor the oxygen concentration of exhaust gas. The OUR, a parameter describing
the amount of oxygen consumed by microorganisms, was the difference between inlet
and outlet concentrations of oxygen. First, an ambient O2 concentration was recorded
as Oi,air (%)- The monitor was then connected to the exhaust gas outlet of the
composting system. Data was read and recorded as 02,out (%) after 40 seconds to
attain a stabilized reading. At last, the oxygen uptake rate (OUR) could be calculated
using this equation:
54
Page 71
— 0 OUR =
0 2•°". 24u1 X AerationRate (L/min)
100
Once every three hours, the OUR was measured.
3.5.5 Aqueous Ammonium (NI14+-N) Concentration
Aqueous ammonia in composting materials was extracted and transformed into a
liquid sample. The indophenol blue method was used to measure aqueous ammonium
concentrations (Keeney and Nelson, 1982). An ultraviolet wavelength spectrometer
(UV-2100 UNICO), equipped with a 1-cm light path was used as a detector.
3.5.5.1 Test Procedures
5 g of a composting sample ( Ws,,,,,pk) was weighed and placed into a 250 mL flask.
50.0 mL ( Vextract,) 2 M KC1 (ACS, EMD Chemicals INC., NJ) was added into the flask.
Then, the flask was shaken on a mechanical shaker for 1 hour to allow the
sample-KC1 suspension to settle. The suspension was then centrifuged for about 8 to
15 minutes (5000 rpm; Thermo Electronic Crop., Precision Durefuge 100) and filtered
via a vacuum filter system. The filtered liquid sample was stored below a temperature
of 2 to 4 °C. When testing, the sample was diluted by 10 times, 100 times using 2 M
KCl to prepare solutions with serial concentrations. Sample neutralization was
necessary if the pH was too acidic or basic.
3.5.5.2 Indophenol Blue Method
Phenol-nitroprusside reagent: 7 g of phenol and. 34 mg of sodium nitroprusside
55
OUR = 2'a,r x AerationRate (L/min) 100
Once every three hours, the OUR was measured.
3.5.5 Aqueous Ammonium (NH4+-N) Concentration
Aqueous ammonia in composting materials was extracted and transformed into a
liquid sample. The indophenol blue method was used to measure aqueous ammonium
concentrations (Keeney and Nelson, 1982). An ultraviolet wavelength spectrometer
(UV-2100 UNICO), equipped with a 1-cm light path was used as a detector.
3.5.5.1 Test Procedures
5 g of a composting sample (Wsampie) was weighed and placed into a 250 mL flask.
50.0 mL (Vextract) 2 M KC1 (ACS, EMD Chemicals INC., NJ) was added into the flask.
Then, the flask was shaken on a mechanical shaker for 1 hour to allow the
sample-KCl suspension to settle. The suspension was then centrifuged for about 8 to
15 minutes (5000 rpm; Thermo Electronic Crop., Precision Durefuge 100) and filtered
via a vacuum filter system. The filtered liquid sample was stored below a temperature
of 2 to 4 °C. When testing, the sample was diluted by 10 times, 100 times using 2 M
KC1 to prepare solutions with serial concentrations. Sample neutralization was
necessary if the pH was too acidic or basic.
3.5.5.2 Indophenol Blue Method
Phenol-nitroprusside reagent: 7 g of phenol and 34 mg of sodium nitroprusside
55
Page 72
[disodium pentacyanonitrosylferrate, Na2Fe(CN)5N0.2H20] were dissolved into 80
mL of NH4+-free water. The solution was then diluted to final volume of 100 ml. The
solution was thoroughly mixed and stored in a dark-colored bottle in a refrigerator.
Buffered hypochlorite reagent: 1.480 g of sodium hydroxide (NaOH) was dissolved in
70 ml of NI-14+-free water. Next, 4.98 g of sodium monohydrogen phosphate
(Na2HPO4) and 20 ml of sodium hypochlorite (Na0C1) solution (5% w/w, VWR) was
added to the solution. Additional NaOH was used to adjust the pH to between the
range of 11.4 and 12.2 if necessary. The solution was then diluted to a final volume of
100 ml.
Ethylenediaminetetraacetic acid (EDTA) reagent: 6 g of ethylenediaminetetraacetic
acid disodium salt (EDTA disodium) was dissolved in 80 ml of deionized water. The
pH was adjusted to around 7. The solution was then diluted to a final volume of 100
ml and thoroughly mixing.
Standard ammonium (NITA+) solution: Immediately before usage, a 2 µg/ml standard
ammonium (NH4+) solution was prepared by pipetting: 0.4 ml standard ammonia
(NH4+) solution (1000 ppm, LabChem Inc. PA) into a 200 ml volumetric flask and
diluted into the scaled volume.
When testing, 3 ml of the diluted sample and 1 ml of the EDTA reagent were pipetted •
56
[disodium pentacyanonitrosylferrate, Na2Fe(CN)5N0.2H20] were dissolved into 80
mL of NH4+-free water. The solution was then diluted to final volume of 100 ml. The
solution was thoroughly mixed and stored in a dark-colored bottle in a refrigerator.
Buffered hypochlorite reagent: 1.480 g of sodium hydroxide (NaOH) was dissolved in
70 ml of NlV-free water. Next, 4.98 g of sodium monohydrogen phosphate
(Na2HPC>4) and 20 ml of sodium hypochlorite (NaOCl) solution (5% w/w, VWR) was
added to the solution. Additional NaOH was used to adjust the pH to between the
range of 11.4 and 12.2 if necessary. The solution was then diluted to a final volume of
100 ml.
Ethvlenediaminetetraacetic acid (EDTA) reagent: 6 g of ethylenediaminetetraacetic
acid disodium salt (EDTA disodium) was dissolved in 80 ml of deionized water. The
pH was adjusted to around 7. The solution was then diluted to a final volume of 100
ml and thoroughly mixing.
Standard ammonium (NH^) solution: Immediately before usage, a 2 |ig/ml standard
ammonium (NFLt+) solution was prepared by pipetting: 0.4 ml standard ammonia
(NH4+) solution (1000 ppm, LabChem Inc. PA) into a 200 ml volumetric flask and
diluted into the scaled volume.
When testing, 3 ml of the diluted sample and 1 ml of the EDTA reagent were pipetted
56
Page 73
into a 25 ml volumetric flask, and thoroughly mixed. The flask contents were allowed
to stand for 1 minute. 2 ml of the phenol-nitroprusside reagent were added first to the
flask. Then, 4 ml of the buffered hypochlorite reagent was also added, into the flask.
The solution was immediately diluted to the scaled volume with NI-14+-free water and
mixed.
The flask was bathed in water (40 °C) for 30 minutes and then cooled to room
temperature. The blue-colored complex was transferred to a 10 mm cell and the
absorbance at a wavelength of 636 run was determined against a blank reagent
solution. The NH4+-N concentration was read by referring to the calibration curve.
The calibration curve can be derived as follows: 3 ml 2M KCl solution was added into
a series of 25-m1 volumetric flasks. 0, 1, 2, 3, 4, 5 and 6 ml of the 2 µg/ml NH4+-N
solution were then added to the series of flasks to obtain the solutions with NH4+-N
concentrations of 0, 2, 4, 6, 8, 10 and 12 pg of NH4+-N/ml. The absorbance of these
solutions were measured and plotted to a calibration curve of
concentration-versus-absorbance.
Because the accuracy range of the indophenol blue method was 0.05-20 pg/mL, using
the appropriate dilution ratio (D) of a sample must be chosen with its concentration (C
mg/1) to fall within this accuracy range. The NH4+-N concentration of the target
solution can be calculated as follows:
57
into a 25 ml volumetric flask, and thoroughly mixed. The flask contents were allowed
to stand for 1 minute. 2 ml of the phenol-nitroprusside reagent were added first to the
flask. Then, 4 ml of the buffered hypochlorite reagent was also added, into the flask.
The solution was immediately diluted to the scaled volume with NH4+-free water and
mixed.
The flask was bathed in water (40 °C) for 30 minutes and then cooled to room
temperature. The blue-colored complex was transferred to a 10 mm cell and the
absorbance at a wavelength of 636 nm was determined against a blank reagent
solution. The NHU+-N concentration was read by referring to the calibration curve.
The calibration curve can be derived as follows: 3 ml 2M KCl solution was added into
a series of 25-ml volumetric flasks. 0, 1,2, 3, 4, 5 and 6 ml of the 2 ng/ml NR(+-N
solution were then added to the series of flasks to obtain the solutions with NH4+-N
concentrations of 0, 2, 4, 6, 8, 10 and 12 jig of NH4+-N/ml. The absorbance of these
solutions were measured and plotted to a calibration curve of
concentration-versus-absorbance.
Because the accuracy range of the indophenol blue method was 0.05-20 ng/mL, using
the appropriate dilution ratio (D) of a sample must be chosen with its concentration (C
mg/1) to fall within this accuracy range. The NH^-N concentration of the target
solution can be calculated as follows:
Page 74
C x D x10 (mg/kg dry compost) C
NN, -N =
1 — MOisturecontent
3.5.6 Gaseous Ammonia (N113-N) Concentration
A 500 mL wide mouth flask containing 100 mL 0.1 M H2SO4 was used to trap
ammonia (NH3) in the exhaust gas. After ammonia had been transformed into aqueous
ammonium in the liquid sample, the solution was collected daily and diluted to 500
mL. After a series of dilutions were made and neutralized, the NH4+-N concentration
in the collected solution was determined using the indophenol blue method which is
described in the Section 3.5.5. The trap was changed on a daily basis also.
3.5.7 Carbon-Nitrogen (C/N) Ratio
LECO TruSpec CN Determinator (LECO Corporation, St. Joseph, MI), which is a
combustion and gas composition analysis system, was used to determine the total
carbon and total nitrogen content. The mechanism is: when a sample was subjected to
two combustion processes at high temperature, formed combustion gases were
collected in the vessel. The gases were passed through a CO2 infrared detector to
measure the carbon content of the sample. NO„ was transformed into N2 by incoming
helium and N2 was determined as nitrogen content. The detailed procedure was as
follows:
5 g compost sample was weighted in a crucible and acidified, if necessary, to avoid
58
C x D C , = x lO (mg/kg dry compost)
NH, N | _ Moistvrecontent
3.5.6 Gaseous Ammonia (NH3-N) Concentration
A 500 mL wide mouth flask containing 100 mL 0.1 M H2SO4 was used to trap
ammonia (NH3) in the exhaust gas. After ammonia had been transformed into aqueous
ammonium in the liquid sample, the solution was collected daily and diluted to 500
mL. After a series of dilutions were made and neutralized, the NHL»+-N concentration
in the collected solution was determined using the indophenol blue method which is
described in the Section 3.5.5. The trap was changed on a daily basis also.
3.5.7 Carbon-Nitrogen (C/N) Ratio
LECO TruSpec CN Detenninator (LECO Corporation, St. Joseph, MI), which is a
combustion and gas composition analysis system, was used to determine the total
carbon and total nitrogen content. The mechanism is: when a sample was subjected to
two combustion processes at high temperature, formed combustion gases were
collected in the vessel. The gases were passed through a CO2 infrared detector to
measure the carbon content of the sample. NOx was transformed into N2 by incoming
helium and N2 was determined as nitrogen content. The detailed procedure was as
follows:
5 g compost sample was weighted in a crucible and acidified, if necessary, to avoid
58
Page 75
possible NH4+ loss. The sample with the crucible was placed in the oven and dried at
105 °C for 4 hours. The dry sample was mashed to a homogeneous powder and stored
in a desiccator. When tested, weight 0.1500 g and 0.2000 g dry sample in a tin foil cup,
then twist and seal it into a capsule, and the sample mass was recorded.
When using the LECO TruSpec CN Determinator, the system check and leak check
must be completed. The blank sample was analyzed first, until a stabilized plateau of
reading was reached (typically±- 0.001%). After analyzing 5 additional blank samples,
the blank calibration could be settled. 10 EDTA standard samples were weighted with
the mass being between 0.1500 g and 0.2000 g, and capsulated into small tins. The
EDTA samples were analyzed and standard calibration was performed. The sample
capsules were placed in order and analyzed in the carousel auto-sampler. For the sake
of quality control, the EDTA sample was inserted in the order every 10 samples.
3.5.8 Microorganism Colony Counting
The number of microorganism colonies was counted using the spread plate counting
method (Ryckeboer et al., 2003b; Pascual et al., 2002). 10% strength tryptic soy broth
agar (TSA, BactoTm, Difco, pH=7.3 ± 0.2, 17.0 g/L of pancreatic digest of casein, 3.0
g/L of enzymatic digest of soybean meal, 2.5 g/L of dextrose, 5.0 g/L of NaC1, 2.5 g/L
of K2HPO4, and 20.0 g/L of agar powder), a nutrient-rich and general-purpose media
was used as the culture medium for total thermophilic and mesophilic microorganism.
59
possible NH4+ loss. The sample with the crucible was placed in the oven and dried at
105 °C for 4 hours. The dry sample was mashed to a homogeneous powder and stored
in a desiccator. When tested, weight 0.1500 g and 0.2000 g dry sample in a tin foil cup,
then twist and seal it into a capsule, and the sample mass was recorded.
When using the LECO TruSpec CN Determinator, the system check and leak check
must be completed. The blank sample was analyzed first, until a stabilized plateau of
reading was reached (typically±0.001%). After analyzing 5 additional blank samples,
the blank calibration could be settled. 10 EDTA standard samples were weighted with
the mass being between 0.1500 g and 0.2000 g, and capsulated into small tins. The
EDTA samples were analyzed and standard calibration was performed. The sample
capsules were placed in order and analyzed in the carousel auto-sampler. For the sake
of quality control, the EDTA sample was inserted in the order every 10 samples.
3.5.8 Microorganism Colony Counting
The number of microorganism colonies was counted using the spread plate counting
method (Ryckeboer et al., 2003b; Pascual et al., 2002). 10% strength tryptic soy broth
agar (TSA, Bacto™, Difco, pH=7.3 ±0.2, 17.0 g/L of pancreatic digest of casein, 3.0
g/L of enzymatic digest of soybean meal, 2.5 g/L of dextrose, 5.0 g/L of NaCl, 2.5 g/L
of K2HP04, and 20.0 g/L of agar powder), a nutrient-rich and general-purpose media
was used as the culture medium for total thermophilic and mesophilic microorganism.
59
Page 76
The media solution was thorough mixed and then sterilized by autoclaving at 15 psi
for 15 minutes and cooled to around 50 °C. 15 mL of media solution was poured into
each Petri plate and was ready to be used when the agar solidified.
When conducting each test, a fresh weight of 10 g sample was added into a 250 mL
Erlenmeyer beaker with 90 mL of 0.85% sterile sodium chloride solution (Sigmam1).
The flask was capped, placed in a horizontal position on a mechanical shaker and
shaken at 200 rpm for 30 minutes in a water bath under a temperature of 20± 1 °C. A
certain amount of supernatant in the flask was transferred and diluted with 0.85%
sterilized sodium chloride solution to prepare tenfold serial dilutions with dilution
ratio from 10-2 to 10-1°.
Four dilutions adequately characterizing the microorganism were chosen from serial
solutions. 0.1 ml of each dilution was drawn and spread to a Petri plate which
contained the required medium. Each chosen dilution was extracted twice and
transferred to different Petri plate, using a sterilized spreader. The plates were
incubated at 25 °C to identify mesophilic microorganisms and at 55 °C to identify
thermophilic microorganisms. After 48 hours of incubation, all thermophiles were
enumerated. The mesophiles were counted after incubation on Day 7. The dilution
factor, which yielded 30 to 300 Colony-Forming Units (CFU) per plate was preferred
in order to enumerate the number of colonies. One extra sample was randomly
selected and incubated- for quality control so as to check data consistency. Then
60
The media solution was thorough mixed and then sterilized by autoclaving at 15 psi
for 15 minutes and cooled to around 50 °C. 15 mL of media solution was poured into
each Petri plate and was ready to be used when the agar solidified.
When conducting each test, a fresh weight of 10 g sample was added into a 250 mL
Erlenmeyer beaker with 90 mL of 0.85% sterile sodium chloride solution (Sigma™).
The flask was capped, placed in a horizontal position on a mechanical shaker and
shaken at 200 rpm for 30 minutes in a water bath under a temperature of 20 ± 1 °C. A
certain amount of supernatant in the flask was transferred and diluted with 0.85%
sterilized sodium chloride solution to prepare tenfold serial dilutions with dilution
ratio from 10"2 to 10"10.
Four dilutions adequately characterizing the microorganism were chosen from serial
solutions. 0.1 ml of each dilution was drawn and spread to a Petri plate which
contained the required medium. Each chosen dilution was extracted twice and
transferred to different Petri plate, using a sterilized spreader. The plates were
incubated at 25 °C to identify mesophilic microorganisms and at 55 °C to identify
thermophilic microorganisms. After 48 hours of incubation, all thermophiles were
enumerated. The mesophiles were counted after incubation on Day 7. The dilution
factor, which yielded 30 to 300 Colony-Forming Units (CFU) per plate was preferred
in order to enumerate the number of colonies. One extra sample was randomly
selected and incubated- for quality control so as to check data consistency. Then
Page 77
colony count was calculated as follows (Sun, 2006):
logo Co/onycount
= NumberojColonyx DilutionFactor
x100 (CFU/g dry compost) 1— MoistureContent
100 in this equation indicated that 0.01g dry sample was used in the test (the 100 ml
solution contained 10 g of dry sample and 0.1 ml solution was drawn and tested).
Both microorganisms were measured once every two days.
3.6 Statistical Analysis
3.6.1 One-Way ANOVA
One-way Analysis of Variance (ANOVA) is a technique used to compared the means
of two or more samples using F distribution (Montgomery, 2001). In this study,
one-factor four-level ANOVA is used to investigate the effects of three types of buffer
salts to multiple objectives, such as temperature, pH and oxygen uptake. The ANOVA
tests the null hypothesis that four treatments share the same mean value at a specific
time t. The core idea of ANOVA is partitioning the total variability into its component
parts, so that sample variance, which is also called unexplained variance or
within-group variance (described as the sum of squares due to error) and treatment
variance, which is called explained variance or between-group variance (described as
the sum of squares between treatments) can be obtained based on these equations
below:
AB T„atmem = En, (E — i7)2 K 1
MSE = Eorg -T, (N —K)
61
colony count was calculated as follows (Sun, 2006):
• „ , „ NumberofColonyx DilutionFactor , . log,0 ColonyCount = x 100 (CFU/g dry compost)
1 - MoistureContent
100 in this equation indicated that O.Olg dry sample was used in the test (the 100 ml
solution contained 10 g of dry sample and 0.1 ml solution was drawn and tested).
Both microorganisms were measured once every two days.
3.6 Statistical Analysis
3.6.1 One-Way ANOVA
One-way Analysis of Variance (ANOVA) is a technique used to compared the means
of two or more samples using F distribution (Montgomery, 2001). In this study,
one-factor four-level ANOVA is used to investigate the effects of three types of buffer
salts to multiple objectives, such as temperature, pH and oxygen uptake. The ANOVA
tests the null hypothesis that four treatments share the same mean value at a specific
time t. The core idea of ANOVA is partitioning the total variability into its component
parts, so that sample variance, which is also called unexplained variance or
within-group variance (described as the sum of squares due to error) and treatment
variance, which is called explained variance or between-group variance (described as
the sum of squares between treatments) can be obtained based on these equations
below:
MSr^^nW'-Y)2/K-\
MSe = (X0 -Yi-Y /(N-K) i
61
Page 78
Where Y. denotes the sample mean in the ith treatment, n, is the number of
replicates in the ith treatment, Y is the overall mean value of data, lc, is the jth
replicates in the ith treatment, K denotes the number of treatments and N is overall
sample size. Consequently, F test can be adopted to investigate whether the two types
of variability are significant or not:
F=MST„. ,IMSE
The F statistic follows the F-distribution with K-1, N-K degrees of freedom. Based on
given p value (c) :).05 in this research), the conclusion of which buffer salts can
significantly affect composting parameters can be made. If obtained p value is larger
than 0.05, which means treatment variance is insignificant, indicating no significant
differences existing with buffer salts added.
3.6.2 Leave-One-Out Cross-Validation
Cross-validation, also known as rotation estimation, is used to assess the accuracy of a
predictive model as it performs in practice (Picard and Cook, 1984). It is important to
guard against the testing hypothesis suggested by the data, which is also called "type
III errors" (hosteller, 1948). As the most common cross-validation method,
leave-one-out cross-validation was adopted herein by retaining the observed data from
a single run of six runs in the experiment as the validation run in order to test the
model, and the remaining five runs were retained as the training data in order to
obtain the kinetics parameters, specifically. To reduce variability, multiple rounds (6
62
Where Y, denotes the sample mean in the ith treatment, n, is the number of
replicates in the ith treatment, Y is the overall mean value of data, Yt] is the jth
replicates in the ith treatment, K denotes the number of treatments and N is overall
sample size. Consequently, F test can be adopted to investigate whether the two types
of variability are significant or not:
F = MSTrealmtn,lMSE
The F statistic follows the F-distribution with K-l, N-K degrees of freedom. Based on
given p value (p=0.05 in this research), the conclusion of which buffer salts can
significantly affect composting parameters can be made. If obtained p value is larger
than 0.05, which means treatment variance is insignificant, indicating no significant
differences existing with buffer salts added.
3.6.2 Leave-One-Out Cross-Validation
Cross-validation, also known as rotation estimation, is used to assess the accuracy of a
predictive model as it performs in practice (Picard and Cook, 1984). It is important to
guard against the testing hypothesis suggested by the data, which is also called "type
HI errors" (Mosteller, 1948). As the most common cross-validation method,
leave-one-out cross-validation was adopted herein by retaining the observed data from
a single run of six runs in the experiment as the validation run in order to test the
model, and the remaining five runs were retained as the training data in order to
obtain the kinetics parameters, specifically. To reduce variability, multiple rounds (6
62
Page 79
times in this study) of cross-validation are performed, with each of the six runs used
exactly once as the validation data and five times as training data. Then, six groups of
parameters were averaged to produce a single group of estimations as the final result,
based on numbers of data in the training set each time
63
Page 80
CHAPTER 4
Eh '14 ECTS OF BUFFER SALTS
4.1 Variations in Physicochemical and Microbiological Parameters
4.1.1 Temperature
The temperature levels were the averages of the measured values for upper and lower
sampling points within the reactor. The temperature profiles in these four reactors are
illustrated in Figure 4.1. A rapid heating-generating process was observed, so that the
temperature of the composting materials of the four runs rose from ambient
temperature to 50 °C at Day 4. This embarked upon a resumption of thermophilic
microorganism activity. It is widely accepted that 50 °C is a threshold between the
mesophilic stage and thermophilic stage, meaning when the temperature rises above
50 °C, thermophiles dominate the biodegradation process in the composting system. It
is reasonable to believe the quick initial activation of microorganism activities is due
to the sufficient contents of easily utilizable organic materials for microorganisms in
the synthetic composting materials.
The temperature levels of the four runs continued to increase after Day 4. Meanwhile,
the mesophilic microorganisms were overcome by the thermophiles (Deniz, 2004).
Thereafter, the temperatures of the four runs were kept at a high level (within the
range of 55 °C and 65 °C) for more than 10 days, which may contribute the
64
CHAPTER 4
EFFECTS OF BUFFER SALTS
4.1 Variations in Physicochemical and Microbiological Parameters
4.1.1 Temperature
The temperature levels were the averages of the measured values for upper and lower
sampling points within the reactor. The temperature profiles in these four reactors are
illustrated in Figure 4.1. A rapid heating-generating process was observed, so that the
temperature of the composting materials of the four runs rose from ambient
temperature to 50 °C at Day 4. This embarked upon a resumption of thermophilic
microorganism activity. It is widely accepted that 50 °C is a threshold between the
mesophilic stage and thermophilic stage, meaning when the temperature rises above
50 °C, thermophiles dominate the biodegradation process in the composting system. It
is reasonable to believe the quick initial activation of microorganism activities is due
to the sufficient contents of easily utilizable organic materials for microorganisms in
the synthetic composting materials.
The temperature levels of the four runs continued to increase after Day 4. Meanwhile,
the mesophilic microorganisms were overcome by the thermophiles (Deniz, 2004).
Thereafter, the temperatures of the four runs were kept at a high level (within the
range of 55 °C and 65 °C) for more than 10 days, which may contribute the
64
Page 81
0 5 10 15 Times (day)
20
Figure 4.1 Temperature profiles during the composting process
65
25
Run A
Run C
Run B
Run D
10 15 Times (day)
Figure 4.1 Temperature profiles during the composting process
65
Page 82
elimination of pathogenic microorganisms (Joshua et al., 1998). As a result, no
unpleasant odor appeared (Rao Bhamidimarri and Pandey, 1996). Runs A and B had a
comparatively higher temperature (around 60 °C) during the thermophilic stage, while
Runs C and D had lower temperature (around 55 °C) but a longer-lasting thermophilic
stage. The temperature of Runs A and B did not decrease until Day 20, which was
obviously later than Runs C and D, while the temperature of Run D began to drop on
Day 15, which was the earliest of the four. The corresponding shorter thermophilic
stage and higher maximum temperature is due to a higher degradation rate with a
higher temperature but similar available organic matter. However, a temperature drop
could be found on Day 5 after reaching its first peak. This early temperature drop
could be the result of the retardation of composting caused by produced organic-acid
at the early stage. After the breakdown of organic matter, the rate of heat generation
became less than that of heat loss so the temperature decreased gradually and went
back to an ambient temperature. Finally, on the Day 25, the temperature of the four
runs dropped back to 20 °C, which suggested the end of the composting process. It is
clear that Run D without the buffer salt additive had the least thermophilic stage
duration, in addition to the shortest cooling phase. It was evident that NaAc,
ICH2PO4/MgSO4 and K2HPO4/MgSO4 could effectively stimulate and prolong the
metabolisms of microorganism during composting. The duration of the entire process
is much shorter than that other composting process as stated in previous literature,
which means the experimental design in this study is satisfactory.
66
elimination of pathogenic microorganisms (Joshua et al., 1998). As a result, no
unpleasant odor appeared (Rao Bhamidimarri and Pandey, 1996). Runs A and B had a
comparatively higher temperature (around 60 °C) during the thermophilic stage, while
Runs C and D had lower temperature (around 55 °C) but a longer-lasting thermophilic
stage. The temperature of Rims A and B did not decrease until Day 20, which was
obviously later than Runs C and D, while the temperature of Run D began to drop on
Day 15, which was the earliest of the four. The corresponding shorter thermophilic
stage and higher maximum temperature is due to a higher degradation rate with a
higher temperature but similar available organic matter. However, a temperature drop
could be found on Day 5 after reaching its first peak. This early temperature drop
could be the result of the retardation of composting caused by produced organic-acid
at the early stage. After the breakdown of organic matter, the rate of heat generation
became less than that of heat loss so the temperature decreased gradually and went
back to an ambient temperature. Finally, on the Day 25, the temperature of the four
runs dropped back to 20 °C, which suggested the end of the composting process. It is
clear that Run D without the buffer salt additive had the least thermophilic stage
duration, in addition to the shortest cooling phase. It was evident that NaAc,
KH2PC>4/MgS04 and K.2HP04/MgS04 could effectively stimulate and prolong the
metabolisms of microorganism during composting. The duration of the entire process
is much shorter than that other composting process as stated in previous literature,
which means the experimental design in this study is satisfactory.
66
Page 83
4.1.2 pH
The pH profiles of the four experiments are shown in Figure 4.2, and the changes in
pH was significantly related to the temperature and followed a typical pattern of an
aerobic composting process, indicating a satisfactorily operated system. The initial pH
of the composting materials was rather acidic (around 6). In the first four days, Runs
C and D had identical composition; they presented exactly the same pH profiles as a
result of the Day 1 to Day 4 when NaAc was added into Run C, which showed our
experiments were under well-controlled conditions. Because K2HPO4 and KH2PO4
was added to Runs A and B at the beginning of the composting process, respectively,
they changed the initial pH of the composting material to 6.52 and 5.65, which were
the highest and lowest values of initial pH among the four runs.
The above phenomenon indicated a strong relationship to pH in composting materials
and the initial pH of buffer salts. Based on the references, K2HPO4 had an initial pH
(with a concentration of 0.1 mol/L) of 8.0, while KH2PO4 had an initial pH of 4.4. The
significant variance within the two similar phosphates was due to the amphoteric
characteristic of HP042- and H2PO4 , because HP042- and H2PO4 are anions with
ionizable protons, which can act as either weak acids or weak bases depending upon
the relative values of their K, and Kb constant. K2HPO4 has the following reactions
when dissolved in water:
K2HPO4 -+ 21C+ + HPO4'
HP042- + 1120 ++ H30 + +P043- K„(HP042)
67
4.1.2 pH
The pH profiles of the four experiments are shown in Figure 4.2, and the changes in
pH was significantly related to the temperature and followed a typical pattern of an
aerobic composting process, indicating a satisfactorily operated system. The initial pH
of the composting materials was rather acidic (around 6). In the first four days, Runs
C and D had identical composition; they presented exactly the same pH profiles as a
result of the Day 1 to Day 4 when NaAc was added into Run C, which showed our
experiments were under well-controlled conditions. Because K2HPO4 and KH2PO4
was added to Runs A and B at the beginning of the composting process, respectively,
they changed the initial pH of the composting material to 6.52 and 5.65, which were
the highest and lowest values of initial pH among the four runs.
The above phenomenon indicated a strong relationship to pH in composting materials
and the initial pH of buffer salts. Based on the references, K2HPO4 had an initial pH
(with a concentration of 0.1 mol/L) of 8.0, while KH2PO4 had an initial pH of 4.4. The
significant variance within the two similar phosphates was due to the amphoteric
characteristic of HPO42" and H2PO4" , because HPO42" and H2PO4' are anions with
ionizable protons, which can act as either weak acids or weak bases depending upon
the relative values of their K„ and Kb constant. K2HPO4 has the following reactions
when dissolved in water:
K2HPOT -» 2K* +HPO,2-
HPO;~ + H20 <-> HP* + PO/~ A.(HP042")
67
Page 84
10
8
6
4 0 5 10 15
Times (day) 20
Figure 4.2 pH profiles during the composting process
68
25
10
8
a a
6
Run A Run C
Run B Run D
4 10 20 0 5 15 25
Times (day)
Figure 4.2 pH profiles during the composting process
68
Page 85
11P042- + H20 4+ H2PO4- +011- Kb(HP042 )
IC,,(HP042 )= IC43(H3PO4)= 4.2 x10⁻¹³
Ka (HP042- ) / Ka 2 (H3PO4 ) 10-'4 / 6.3 x 1 0" = 1.6 x 10⁻⁷
Since ii,(HP042) is far smaller than Kb(HP042"), K2HPO4 is a stronger base than it is
an acid, so the K2HPO4 solution is basic.
KH2PO4 has similar reactions when dissolved in water:
KH2PO4 --> K+ + H2PO4
H2PO4 +1120 ++1130k +HP042- Ka(112PO4)
H2 PO4- + H2 0 4-> H3PO4 +0H" Kb(H2PO4)
Ka(H2PO4-)= Ka 2 (H3 PO4 ) = 6.3 x 10'
K,(H2PO4) = Kw / (H3PO4) = 10-14 / 7.2 x10-3 = 1.4 x10-' 2
Since Ka(H2PO4) is far larger than Kb(H2PO4) KH2PO4 is a stronger acid than it is a
base, so that the KH2PO4 solution is acidic.
As for NaAc added into Run C on Day 4, it is also basic in a solution because of the
contained basic anions. The reactions were as follows.
NaAc --÷Na+ + Ac-
Ac- +1120 44 HAc+011" 14(Ac")
Kb(Ac-)= Kw , Ic(HAc)= 10-14 /1.8xle =5.6x10⁻¹°
Thus NaAc is a base in a water solution, with an initial pH of 8.87. One common
.characteristic. of these three additives was they can absorb H+ or Off into a solution to
69
HPO;~ + H20 H2PO*~ + OH' JrA(HP042")
Ka(HPO<2-) = Ka}(HiPO4) = 4.2xl0~li
KB(HP042~) = KW / KA2(H3POA) = 1(T"7 6.3x10"* = 1.6xl(T7
Since JTa(HP042") is far smaller than Aa(HP042"), K2HPO4 is a stronger base than it is
an acid, so the K2HPO4 solution is basic.
KH2PO4 has similar reactions when dissolved in water:
KH2POA -+K++H2PO4~
H2PO~ + H20<r^ H,0+ + HPOA2- Aro(H2P04")
H2PO~ +H20<+ H3PO; + OH~ tf6(H2P04")
KA(H2P04') = KA2(H3P04) = 6.3xl0"8
Kb(H2P04-) = Kw/Ka i(H3POA) = 10"14 /7.2xl(T3 = 1.4xl0"12
Since ifaOHhPCV) is far larger than ^(tfcPOO , KH2PO4 is a stronger acid than it is a
base, so that the KH2P04 solution is acidic.
As for NaAc added into Rim C on Day 4, it is also basic in a solution because of the
contained basic anions. The reactions were as follows.
NaAc —> Na+ + Ac'
Ac +H20<r* HAc+OH' Kb( Ac)
K b ( A c ) = K W / K t t ( H A c ) = 10"'4 /1.8 x 10"5 = 5.6 x 1(T10
Thus NaAc is a base in a water solution, with an initial pH of 8.87. One common
.characteristic of these three additives was they can absorb H+ or OH" into a solution to
69
Page 86
resist change in ambient pH when acid or alkali is added or produced (Y. Liang et al.,
2006; Yu and Huang, 2009). HP042" and H2PO4 could both react with H+ or OR in
hydrolysis and ionization process. NaAc, in addition to produced HAc in a hydrolysis
process, could form a NaAc/HAc buffer solution and absorb both H+ and OR. Thus,
they were named "buffer salts" and are believed to be capable of maintaining a
constant pH value.
The pH dropped gradually from 6 to about 4.5 on the second day in all runs, and
stayed at this level in this stage, which could be explained by the generation of a large
amount of organic acids as the intermediate by-product of easily degradable organic
materials (Smars et al., 2002; Nakasaki et al., 1993; Beck-Friis et al., 2003). The
stabilization of pH during the initial acidic stage could be due to the following two
reasons: first, because of the properties of hydrolysis and ionization equilibriums of
buffer salts and produced organic acids, which are weak acids; second, microbial
activities would be inhibited in a low pH environment, which slowed the degradation
rate of organic acids. Only when the generation of short-chain organic acids was
slower than the degradation and evaporation of organic acids, did the pH levels begin
to rise (An, 2006). In the first four days, Runs C and D had identical compositions so
they presented exactly the same pH profile before NaAc was added into Run C, which
showed our experiments were under well-controlled conditions. The lowest pH was
4.51, 4.42, 4.70 and 4.73, respectively, in the four runs. A low pH was fairly
unsuitable for microorganism growth because low pH always coincided with a
70
resist change in ambient pH when acid or alkali is added or produced (Y. Liang et al.,
2006; Yu and Huang, 2009). HPO42" and H2PO4" could both react with H* or OH. in
hydrolysis and ionization process. NaAc, in addition to produced HAc in a hydrolysis
process, could form a NaAc/HAe buffer solution and absorb both H+ and OH". Thus,
they were named "buffer salts" and are believed to be capable of maintaining a
constant pH value.
The pH dropped gradually from 6 to about 4.5 on the second day in all runs, and
stayed at this level in this stage, which could be explained by the generation of a large
amount of organic acids as the intermediate by-product of easily degradable organic
materials (Sm&rs et al., 2002; Nakasaki et al., 1993; Beck-Friis et al., 2003). The
stabilization of pH during the initial acidic stage could be due to the following two
reasons: first, because of the properties of hydrolysis and ionization equilibriums of
buffer salts and produced organic acids, which are weak acids; second, microbial
activities would be inhibited in a low pH environment, which slowed the degradation
rate of organic acids. Only when the generation of short-chain organic acids was
slower than the degradation and evaporation of organic acids, did the pH levels begin
to rise (An, 2006). In the first four days, Runs C and D had identical compositions so
they presented exactly the same pH profile before NaAc was added into Rim C, which
showed our experiments were under well-controlled conditions. The lowest pH was
4.51, 4.42, 4.70 and 4.73, respectively, in the four runs. A low pH was fairly
unsuitable for microorganism growth because low pH always coincided with a
Page 87
reduced microorganism population and limited nutrient availability (Lei and
Vander-Gheynst, 2000; Nakasaki et al., 1993; Sundberg et al., 2004). Furthermore,
low pH also hindered the shift from the mesophilic stage to the thermophilic stage
because thermophiles have less tolerance to an acidic environment.
After the lag phase, a pH-increasing phase was observed in the four runs. In this phase,
pH in all runs rose gradually to around 5.5 prior to day 12 and then ascended
dramatically into the alkaline range. As for Runs A and B, the quick rise of pH levels
was later than in Runs C and D, which was coherent with temperature profiles. In
Figure 4.1, Runs A and B experienced a slightly lower temperature before Day 15
during their thermophilic stage. During the fmal stage, when the composting
processes ended, the pH of all the four runs had risen to an alkaline range. During the
later stage, the raised pH levels in all runs were induced due to the production of
ammonia through ammonification and mineralization of organic nitrogen, resulting
fronunicrobial activities (Bishop and Godfrey, 1983). Runs C and B had a maximum
and minimum pH, which was 9.16 and 7.64 (p<0.05), respectively. It suggested that
amendments added at the beginning of the composting process would still influence
the fmal pH. Comparing Runs A and C with two acidic additives, K2HF'04/MgSO4
and NaAc, respectively, Run A had a significantly lower final pH than Run C and
almost the same value with the control run, Run D. This would indicate strong buffer
ability towards the rising of pH for K2HPO4.
71
reduced microorganism population and limited nutrient availability (Lei and
Vander-Gheynst, 2000; Nakasaki et al., 1993; Sundberg et al., 2004). Furthermore,
low pH also hindered the shift from the mesophilic stage to the thermophilic stage
because thermophiles have less tolerance to an acidic environment.
After the lag phase, a pH-increasing phase was observed in the four runs. In this phase,
pH in all runs rose gradually to around 5.5 prior to day 12 and then ascended
dramatically into the alkaline range. As for Runs A and B, the quick rise of pH levels
was later than in Runs C and D, which was coherent with temperature profiles. In
Figure 4.1, Runs A and B experienced a slightly lower temperature before Day 15
during their thermophilic stage. During the final stage, when the composting
processes ended, the pH of all the four runs had risen to an alkaline range. During the
later stage, the raised pH levels in all runs were induced due to the production of
ammonia through ammonification and mineralization of organic nitrogen, resulting
frommicrobial activities (Bishop and Godfrey, 1983). Runs C and B had a maximum
and minimum pH, which was 9.16 and 7.64 (p<0.05), respectively. It suggested that
amendments added at the beginning of the composting process would still influence
the final pH. Comparing Runs A and C with two acidic additives, K2HP(VMgS04
and NaAc, respectively, Run A had a significantly lower final pH than Run C and
almost the same value with the control ran, Run D. This would indicate strong buffer
ability towards the rising of pH for K2HPO4.
71
Page 88
4.2 Change in Microbial Activities
4.2.1 Daily and Cumulative Oxygen Uptake
In composting research, the Carbon Dioxide (CO2) evolution rate and Oxygen (02)
Uptake Rate have been widely adopted to evaluate microbial activity and composting
efficiency (Fang et al., 1999; C. Liang et al., 2003; Yu and Huang, 2009). In this study,
0 2 uptake was used to evaluate microbial activity since 0 2 uptake directly reflects
microbial aerobic metabolism velocity (Iannotti et al.). Daily and cumulative 0 2
uptake profiles for the four runs are illustrated in Figure 4.3 (ds in the figure means
dry solid matters). Unlike the temperature and pH profiles, significant differences in
daily and cumulative 0 2 uptake profiles could be found in the four runs. In particular,
the daily 0 2 uptake of Run B, with the addition of KH2PO4/MgSO4, was much less
when compared with the other three runs. Run B had a daily 02 uptake value of less
than 2 mg/(g-ds*h) during the entire process, while the daily 02 uptake of the other 3
runs rose to 4-6 mg/(g-ds*h) after the acid inhibited phase and increased rapidly to
more than 10 mg/(g-ds*h) at the thermophilic stage. This phenomenon also testified to
the fact that the lower initial pH value did not suit microorganism growth (Hu et al.,
2007). In Run C, there was an obvious drop in the daily OUR on Day 4 with the
addition of NaAc, which reflects a short term of readaptation for microorganisms. The
profile of OUR rose again and secures the highest peak value.
72
4.2 Change in Microbial Activities
4.2.1 Daily and Cumulative Oxygen Uptake
In composting research, the Carbon Dioxide (CO2) evolution rate and Oxygen (O2)
Uptake Rate have been widely adopted to evaluate microbial activity and composting
efficiency (Fang et al., 1999; C. Liang et al., 2003; Yu and Huang, 2009). In this study,
O2 uptake was used to evaluate microbial activity since O2 uptake directly reflects
microbial aerobic metabolism velocity (Iannotti et al.). Daily and cumulative 02
uptake profiles for the four runs are illustrated in Figure 4.3 (ds in the figure means
dry solid matters). Unlike the temperature and pH profiles, significant differences in
daily and cumulative O2 uptake profiles could be found in the four runs. In particular,
the daily O2 uptake of Run B, with the addition of KI^POVMgSO,^ was much less
when compared with the other three runs. Run B had a daily O2 uptake value of less
than 2 mg/(g-ds*h) during the entire process, while the daily 02 uptake of the other 3
runs rose to 4-6 mg/(g-ds*h) after the acid inhibited phase and increased rapidly to
more than 10 mg/(g-ds*h) at the thermophilic stage. This phenomenon also testified to
the fact that the lower initial pH value did not suit microorganism growth (Hu et al.,
2007). In Run C, there was an obvious drop in the daily OUR on Day 4 with the
addition of NaAc, which reflects a short term of readaptation for microorganisms. The
profile of OUR rose again and secures the highest peak value.
72
Page 89
Run A 14
2
0 0
--*-- Daily 02 uptake
— — — Cumulative 02 uptake
.0 ,e
0,...
al.
.. ...
e e
e
e
OW 4.110.
O. 01..
3500
- 3000
- 2500
- 2000
- 1500
- 1000
- 500
5 10 15 Times (day)
20 25 0
Figure 4.3a Temporal variations of 0 2 uptake rate and cumulative
02 uptake during composting for Run A
73
Cum
ulat
ive
02 u
ptak
e (m
g/g-
ds)
Run A
- Daily 02 uptake
• Cumulative 02 uptake
- 1500
- 1000
- 500
0 5 10 15 Times (day)
Figure 4.3a Temporal variations of O2 uptake rate and cumulative
O2 uptake during composting for Run A
73
Page 90
Run B 14
2 -
o 0
—+— Daily 02 uptake
— — — Cumulative 02 uptake
i r 5 10 15
Times (day) 20
AM ••• ... •••
3500
- 3000
- 2500
- 2000
- 1500
- 1000
- 500
0 25
Figure 4.3b Temporal variations of 0 2 uptake rate and cumulative
0 2 uptake during composting for Run B
74
Cum
ulat
ive
02 u
ptak
e (m
g/g-
ds)
14
^ 12 a *
10 bl) 0* a 8
2 6 .£ a 4 <s ° 2
Run B r 3500
-•— Daily 02 uptake
- - Cumulative 02 uptake " 3000
- 2500
- 2000
- 1500
- 1000
• 5 0 0
- , , . n
0 5 10 15 20 25 Times (day)
Figure 4.3b Temporal variations of O2 uptake rate and cumulative
O2 uptake during composting for Run B
74
Page 91
Run C 14
12 -
10 - 04
El 8
yr 6 -
t 4 - esi 0 2-
0
Daily 02 uptake
— — — Cumulative 02 uptake
I
1
• 11.
3500
- 3000
- 2500
- 2000
- 1500
- 1000
- 500
10 15 Times (day)
20 25 0
Figure 4.3c Temporal variations of 0 2 uptake rate and cumulative
0 2 uptake during composting for Run C
75
Cum
ulat
ive
02 u
ptak
e (m
g/g-
ds)
Run C 14
~ 12 ja * w .. V 10
OA
<w •** 2 6 J2
a 4
O o
3500 -•— Daily 02 uptake
— — Cumulative 02 uptake - 3000
- 2500
- 2000
- 500
10 15 Times (day)
Figure 4.3c Temporal variations of O2 uptake rate and cumulative
O2 uptake during composting for Run C
"? is a •w
OS
a 3 fS 0 1 9 a s <J
75
Page 92
Run D 14
12 -.b
i io - to -a
E1 8 -
i 6 -
▪e s rs. 4 -o t'l 0 2 -
o 0
- -•— Daily 02 uptake
— — — Cumulative 02 uptake
3500
- 3000
- 2500
- 2000
- 1500
- 1000
- 500
I I I 0 10 15 20 25 Times (day)
Figure 4.3d Temporal variations of 0 2 uptake rate and cumulative
0 2 uptake during composting for Run D
76
Cum
ulat
ive
02 u
ptak
e (m
g/gd
s)
RunD
• Daily 02 uptake
• Cumulative 02 uptake
3500
- 3000 $
"S - 2500 a
M • 2000 -2 p< s
1500 O <u
V 1000 .2 9 a
- 500 u
10 15 Times (day)
I 20 25
Figure 4.3d Temporal variations of O2 uptake rate and cumulative
O2 uptake during composting for Run D
76
Page 93
The peak value of the oxygen uptake rate and the fmal value of the cumulative oxygen
uptake can be found in Table 4.1 According the table, the OUR peak value of Run B
was 1.86 mg/(g.h), which is much lower than the other three runs with peak values
larger than 9 mg/(g.h). This phenomenon testified that acidic additive will severely
inhibit the aerobic process of microorganisms. The differences between Run A and
Run C with control Run D are also statistically significant (p<0.05), which indicates
an alkaline additive can promote microbial activity in an aerobic composting process.
The significant higher rates are due to the favorable effects of buffer agents which can
alleviate inhibition effects under low pH. All four runs have a peak value after Day 10.
However, when referring to the temperature profile, the temperature rapidly rose to
the thermophilic stage on Day 5. The possible reason for this inconsistency may be
due to inhibition of the combined effects of low pH and higher temperatures because
the pH did not rise to 6 quickly after the temperature rose (Sundberg et al., 2004). The
highest aerobic reaction rate can only be found when the pH in the system is alkaline.
When the pH exceeded 6 and continued to increase, microbial activity was also
significantly enhanced. The positive effects could be due to the presence of buffer
salts which can prevent pH from dropping extensively when the temperature rose in
the initial stage. The peak OUR of Run A appeared several days later than the other
three runs. The possible reason is K2HPO4 had better buffer ability than NaAc in the
alkaline range, which can slow down the trend of rising pH.
77
The peak value of the oxygen uptake rate and the final value of the cumulative oxygen
uptake can be found in Table 4.1 According the table, the OUR peak value of Run B
was 1.86 mg/(g.h), which is much lower than the other three runs with peak values
larger than 9 mg/(g.h). This phenomenon testified that acidic additive will severely
inhibit the aerobic process of microorganisms. The differences between Run A and
Run C with control Run D are also statistically significant (p<0.05), which indicates
an alkaline additive can promote microbial activity in an aerobic composting process.
The significant higher rates are due to the favorable effects of buffer agents which can
alleviate inhibition effects under low pH. All four runs have a peak value after Day 10.
However, when referring to the temperature profile, the temperature rapidly rose to
the thermophilic stage on Day 5. The possible reason for this inconsistency may be
due to inhibition of the combined effects of low pH and higher temperatures because
the pH did not rise to 6 quickly after the temperature rose (Sundberg et al., 2004). The
highest aerobic reaction rate can only be found when the pH in the system is alkaline.
When the pH exceeded 6 and continued to increase, microbial activity was also
significantly enhanced. The positive effects could be due to the presence of buffer
salts which can prevent pH from dropping extensively when the temperature rose in
the initial stage. The peak OUR of Run A appeared several days later than the other
three runs. The possible reason is K2HPO4 had better buffer ability than NaAc in the
alkaline range, which can slow down the trend of rising pH.
77
Page 94
Table 4.1 Peak value of oxygen uptake rate and final value of cumulative oxygen
uptake for the four runs
peak value of OUR final cumulative
(mg/(g-ds*h)) oxygen uptake (mg/g)
Run A 10.02 (day 17)
Run B 1.82 (day 14)
Run C 12.40 (day 13)
Run D 9.06 (day 12)
3037
811
3209
2510
78
Table 4.1 Peak value of oxygen uptake rate and final value of cumulative oxygen
uptake for the four runs
peak value of OUR final cumulative
(mg/(g-ds*h)) oxygen uptake (mg/g)
Run A 10.02 (day 17) 3037
RunB 1.82 (day 14) 811
RunC 12.40 (day 13) 3209
RunD 9.06 (day 12) 2510
78
Page 95
After the runs showed their peak 0 2 consumption velocity, the 02 uptake rate began to
decrease extensively because of the reduced amount of degradable materials available.
OUR began to drop for Runs D, C and A on Day 13, Day 15 and Day 19, respectively.
The same order and time points could also be reflected in temperature profiles, which
imply the major reason for the cooling phase is a deficiency of nutrients could be
utilized by the microorganism in order to produce enough heat. After Day 25, the
daily OUR in all runs dropped to lower than 1 mg/(g.h), indicating the compost was
stable (Wong and Fang, 2000).
As for cumulative 0 2 uptake, similar results could be found. Run B also had the
lowest final cumulative 0 2 uptake, while Runs A and C, with an alkaline additive
exhibited higher cumulative 0 2 uptake values than the control run. It was obvious that
alkaline buffer agents stimulated microbial aerobic reaction and acidic buffer agents
severely inhibited the aerobic metabolism of microorganisms. All the aforementioned
differences are statistically significant (p<0.05)
4.2.2 Percentage of Organic Matter Degradation
Figure 4.4 depicts the temporal variations of the percentage of organic material
degradation profiles for the four reactors. During the first 12 days, the four runs had
other three runs after Day 12, and there is a skyrocketing stage for Run A after Day
16.
79
After the runs showed their peak O2 consumption velocity, the O2 uptake rate began to
decrease extensively because of the reduced amount of degradable materials available.
OUR began to drop for Runs D, C and A on Day 13, Day 15 and Day 19, respectively.
The same order and time points could also be reflected in temperature profiles, which
imply the major reason for the cooling phase is a deficiency of nutrients could be
utilized by the microorganism in order to produce enough heat. After Day 25, the
daily OUR in all runs dropped to lower than 1 mg/(g.h), indicating the compost was
stable (Wong and Fang, 2000).
As for cumulative O2 uptake, similar results could be found. Run B also had the
lowest final cumulative O2 uptake, while Runs A and C, with an alkaline additive
exhibited higher cumulative O2 uptake values than the control run. It was obvious that
alkaline buffer agents stimulated microbial aerobic reaction and acidic buffer agents
severely inhibited the aerobic metabolism of microorganisms. All the aforementioned
differences are statistically significant (p<0.05)
4.2.2 Percentage of Organic Matter Degradation
Figure 4.4 depicts the temporal variations of the percentage of organic material
degradation profiles for the four reactors. During the first 12 days, the four runs had
other three runs after Day 12, and there is a skyrocketing stage for Run A after Day
16.
79
Page 96
70
0 0 5 10 15
Times (day) 20
Figure 4.4 Degradation rate profiles during the compostingprocess
80
25
70
Run B Run A 60
Run C Run D
at 50
20
10
0 20 25 15 0 5 10
Times (day)
Figure 4.4 Degradation rate profiles during the compostingprocess
80
Page 97
Finally, Run A had the highest percentage of organic matter degradation, while there
was no significant difference between Run B and Run D in this parameter. The total
organic degradation rate for the four runs can be found in Table 4.2 Comparison
between final organic matters and cumulative 0 2 uptake in composting system. When
compared with Run D, far more organic matter decomposed in Runs A and C, and the
significant improvement is due to the help of alkaline additives (p<0.05). On the other
hand, Run B with acid amendment, also led the control run in this parameter, but the
improvement is not significant (p>0.05). This result indicated that the addition of
alkaline may effectively increase the extent of total organic material degradation.
Table 4.2 also contains the ratio of degradation percentage and cumulative 0 2 uptake
of Runs A, B and C to those parameters of control run, Run D. When
comparing the ratios, Run B has a relatively lower aerobic coefficient, which means
large portions of organic matters in Run B were degraded in anaerobic pathways. Run
A had a higher percentage of organic matter degradation but a lower cumulative OUR
value than Run C, which implies the portion of aerobic reaction and anaerobic
reaction is different in different runs, which is due to different amendments being
added. Thus, the aerobic coefficient can be defined in this study, which is the
result of the ratio of cumulative 0 2 uptake, divided by the ratio of organic
matter degradation. Because the percentage of degradation reflects the overall
reaction rate by measuring the decreased quantity of reactants, which include both
81
Finally, Run A had the highest percentage of organic matter degradation, while there
was no significant difference between Run B and Run D in this parameter. The total
organic degradation rate for the four runs can be found in Table 4.2 Comparison
between final organic matters and cumulative O2 uptake in composting system. When
compared with Run D, far more organic matter decomposed in Runs A and C, and the
significant improvement is due to the help of alkaline additives (p<0. OS). On the other
hand, Run B with acid amendment, also led the control run in this parameter, but the
improvement is not significant (p>0.05). This result indicated that the addition of
alkaline may effectively increase the extent of total organic material degradation.
Table 4.2 also contains the ratio of degradation percentage and cumulative O2 uptake
of Runs A, B and C to those parameters of control run, Run D. When
comparing the ratios, Run B has a relatively lower aerobic coefficient, which means
large portions of organic matters in Run B were degraded in anaerobic pathways. Run
A had a higher percentage of organic matter degradation but a lower cumulative OUR
value than Run C, which implies the portion of aerobic reaction and anaerobic
reaction is different in different runs, which is due to different amendments being
added. Thus, the aerobic coefficient can be defined in this study, which is the
result of the ratio of cumulative O2 uptake, divided by the ratio of organic
matter degradation. Because the percentage of degradation reflects the overall
reaction rate by measuring the decreased quantity of reactants, which include both
Page 98
Table 4.2 Comparison between final organic matters and cumulative 0 2 uptake in
composting system
Final percentage of OM
degradation ( % )
OM degradation ratio to
control run
Cumulative 0 2 uptake
ratio to control run
Aerobic
coefficient
Run A 58.2 1.20 1.21 1.01
Run B 49.2 1.01 0.32 0.32
Run C 54.4 1.12 1.18 1.14
Run D 48.7 1.00 1.00 1.00
82
Table 4.2 Comparison between final organic matters and cumulative O2 uptake in
composting system
Final percentage of OM OM degradation ratio to Cumulative O2 uptake Aerobic
degradation (%) control run ratio to control run coefficient
Run A 58.2 1.20 1.21 1.01
RunB 49.2 1.01 0.32 0.32
RunC 54.4 1.12 1.18 1.14
RunD 48.7 1.00 1.00 1.00
82
Page 99
aerobic and anaerobic reactions, while the cumulative 0 2 uptake reflects only the
aerobic activity of the microorganisms. The higher the value of the aerobic coefficient,
the more easily aerobic decomposition will take place in the composting system. In
this study, ICH2PO4/MgSO4 can severely decrease the value and NaAc can promote
this value significantly, while K2HPO4/MgSO4 seems unable to change the type of
microbial reactions. Microbial anaerobic metabolism would cause incomplete
degradation of nutrients so a decreased maturity and the intermediate products such as
organic acids were detrimental to the microorganism itself. Although it is a critical
problem in the composting process, complete elimination of an anaerobic reaction
would be impossible in an actual composting system because many factors may
trigger anaerobic degradation such as too much moisture, deficient inlet oxygen,
uneven turning, etc.
4.23 Changes in Ammonia Loss
Nitrogen loss is an important parameter in composting research, because it is also
closely related to the composting reaction rate. Theoretically, the loss of nitrogen
element was mainly through gaseous emission. The amount of leachate was negligible
during the composting process. In gas phase, NH3 accounts for nearly 80% of the total
gaseous loss, (besides N20, N2 and NO„ compounds) (Hu et al., 2007). Based on this
theory, only the ammonia emission was measured in this study and accounted for
nitrogen loss.
83
aerobic and anaerobic reactions, while the cumulative O2 uptake reflects only the
aerobic activity of the microorganisms. The higher the value of the aerobic coefficient,
the more easily aerobic decomposition will take place in the composting system. In
this study, KH2PC>4/MgS04 can severely decrease the value and NaAc can promote
this value significantly, while K2HPC>4/MgS04 seems unable to change the type of
microbial reactions. Microbial anaerobic metabolism would cause incomplete
degradation of nutrients so a decreased maturity and the intermediate products such as
organic acids were detrimental to the microorganism itself. Although it is a critical
problem in the composting process, complete elimination of an anaerobic reaction
would be impossible in an actual composting system because many factors may
trigger anaerobic degradation such as too much moisture, deficient inlet oxygen,
uneven turning, etc.
4.23 Changes in Ammonia Loss
Nitrogen loss is an important parameter in composting research, because it is also
closely related to the composting reaction rate. Theoretically, the loss of nitrogen
element was mainly through gaseous emission. The amount of leachate was negligible
during the composting process. In gas phase, NH3 accounts for nearly 80% of the total
gaseous loss, (besides N2O, N2 and NOx compounds) (Hu et al., 2007). Based on this
theory, only the ammonia emission was measured in this study and accounted for
nitrogen loss.
83
Page 100
Ammonia emission is affected by the following three factors: i), microbial reaction
activity, which is related to the amount of transformed inorganic nitrogen (mainly
ammonia) from organic matter; ii), pH, which decides the distribution of inorganic
nitrogen as a form of NH3- H2O and NH4+ in the aqueous phase. If NH3-1120 is
saturated in solvent, an ammonia emission can be observed; iii) anti-correlated to an
additive that would react with ammonia. However, it is necessary to realize the three
factors are not independent of each other. A change in one factor may cause variation
in other factors. For example, the buffer agent will change the pH in the system,
which also affects microbial activity; phosphates will absorb emitted ammonia, but
also stimulate microbial activity by providing nutrient.
Based on this theory, it is easy to understand the ammonia loss profile in this research.
Figure 4.5 depicted daily ammonia loss rates and cumulative ammonia loss in the four
runs, respectively. Both figures indicated that in the first 10 days, the ammonia
emission amount was negligible. There are two reasons for ammonia not emitting in
the beginning of the composting process. The first reason was microbial activity was
too low to produce enough inorganic nitrogen; the second reason was an acidic
environment in the starter could absorb more ammonia in the solution. When pH
arrived at the alkaline range, ammonia loss increased rapidly (K Ekinci et al., 2000).
In this stage, Runs C and D emitted ammonia earlier than Runs A and B. Table 4.3
also gives the peak daily ammonia loss and final cumulative amount of lost ammonia.
84
Ammonia emission is affected by the following three factors: i), microbial reaction
activity, which is related to the amount of transformed inorganic nitrogen (mainly
ammonia) from organic matter; ii), pH, which decides the distribution of inorganic
nitrogen as a form of NHa-HfeO and NH4+ in the aqueous phase. If NHh-HhO is
saturated in solvent, an ammonia emission can be observed; iii) anti-correlated to an
additive that would react with ammonia. However, it is necessary to realize the three
factors are not independent of each other. A change in one factor may cause variation
in other factors. For example, the buffer agent will change the pH in the system,
which also affects microbial activity; phosphates will absorb emitted ammonia, but
also stimulate microbial activity by providing nutrient.
Based on this theory, it is easy to understand the ammonia loss profile in this research.
Figure 4.5 depicted daily ammonia loss rates and cumulative ammonia loss in the four
runs, respectively. Both figures indicated that in the first 10 days, the ammonia
emission amount was negligible. There are two reasons for ammonia not emitting in
the beginning of the composting process. The first reason was microbial activity was
too low to produce enough inorganic nitrogen; the second reason was an acidic
environment in the starter could absorb more ammonia in the solution. When pH
arrived at the alkaline range, ammonia loss increased rapidly (K Ekinci et al., 2000).
In this stage, Runs C and D emitted ammonia earlier than Runs A and B. Table 4.3
also gives the peak daily ammonia loss and final cumulative amount of lost ammonia.
Page 101
0 5 10 15 Times (day)
Run A
I i 0 25 20
Figure 4.5a Temporal variations of ammonia loss rate and
cumulative ammonia loss in Run A
85
Run A
Daily NH3 loss
• Cumulative NH3 loss
5 10 Times (day)
Figure 4.5a Temporal variations of ammonia loss rate and
cumulative ammonia loss in Run A
85
Page 102
Run B
Am
mon
ia lo
ss r
ate
(mg/
h)
100
80 -
60 -
40 -
20 -
5 10 15 25 Times (day)
Figure 4.5b Temporal variations of ammonia loss rate and
cumulative ammonia loss in Run B
86
Cum
ulat
ive
Am
mon
ia lo
ss (
mg)
RunB 100 12000
- Daily NH3 loss
— Cumulative NH3 loss - 10000 £? 80
- 8000
- 6000 o OS
a o - 4000 «
< - 2000
25 15 20 10 5 Times (day)
Figure 4.5b Temporal variations of ammonia loss rate and
cumulative ammonia loss in Run B
86
Page 103
Run C
Am
mon
ia l
oss
rate
(m
g/h)
100 - -•-- Daily NH3 loss
— — — Cumulative NH3 loss 80 -
60 -
40 -
20 -
• • ♦ •
0 5
I
I I I
I I
10 15 Times (day)
20
•
•
12000
- 10000 1
- 8000 as 'S
- 6000 a
- 4000 1= es
- 2000 0
25 0
Figure 4.5c Temporal variations of ammonia loss rate and
cumulative ammonia loss in Run C
87
Run C
Daily NH3 loss
• Cumulative NH3 loss
15 Times (day)
Figure 4.5c Temporal variations of ammonia loss rate and
cumulative ammonia loss in Run C
87
Page 104
Run D 100
Daily NH3 loss
— — — Cumulative NH3 loss .174 80 -
60
.4 40 - os:1
a 20
12000
10000
- 8000 es
o
- 6000 El
- 4000 es
a - 2000
0 • • • , • 0 5 10 15 20 25
Times (day)
0
Figure 4.5d Temporal variations of ammonia loss rate and
cumulative ammonia loss in Run D
88
Run D
- Daily NH3 loss
• Cumulative NH3 loss
12000
10000
8000
- 6000
• 4000
- 2000
• • »
bt a, <n oi O
a 0 a 1
4> >
•o "3 a s
U
10 15 Times (day)
25
Figure 4.5d Temporal variations of ammonia loss rate and
cumulative ammonia loss in Run D
88
Page 105
Table 4.3 Peak value of oxygen uptake rate and final value of cumulative oxygen
uptake for the four runs
peak value of ammonia fmal cumulative
loss rate (mg/h) ammonia loss (mg)
Run A 91.73 (day 20)
Run B 27.84 (day 18)
Run C 93.88 (day 14)
Run D 76.1 (day 14)
9605
2783
10821
8060
89
Table 4.3 Peak value of oxygen uptake rate and final value of cumulative
uptake for the four runs
peak value of ammonia final cumulative
loss rate (mg/h) ammonia loss (mg)
Run A 91.73 (day 20) 9605
RunB 27.84 (day 18) 2783
RunC 93.88 (day 14) 10821
Run D 76.1 (day 14) 8060
89
Page 106
The daily peak of ammonia loss in Runs C and D appears on Day 14, while the daily
peak of ammonia loss in Runs A and B can be found on Day 17 and Day 18,
respectively. As for Run C, NaAc only changed the pH, while for Runs A and B,
because HP042" and H2PO4 could react with NH3 with the help of Mg2+, produced
struvite crystallized magnesium ammonium phosphate (MAP, MgNH4PO4.6H2O) to
stabilize the nitrogen element (Li et al., 2010). Only when the output rate of ammonia
by microbial was larger than absorption rate by absorbents, could ammonia emission
be detected. The reaction of struvite formation is shown below:
Mg + + NH4 + H2PO: + 6H 20 ---> MgNH4PO4 • 61120 + 2H+
When comparing Runs A and C in a cumulative 0 2 uptake rate and cumulative
ammonia release, some inconsistency could be found between the two alkaline
additives. Although Run A with ICH2PO4/MgSO4 had a higher ammonia loss and an
0 2 uptake rate better than Run C amended with NaAc, the two parameters are not
proportional. The final cumulative 0 2 uptake rate of Run A was 95% of the value of
Run C; while for the cumulative ammonia loss, the rate became 88%. This
phenomenon could be analyzed by the theory above. The OUR was proportional to
the reaction velocity while ammonia loss reflected the combined effects of the
reaction rate and the absorption of additive. K211130 4 and MgSO4 in Run A not only
affected the pH in the system, but could absorb ammonia by forming struvite, while
NaAc in Run C only changed the pH. That was why Run A had less of an ammonia
loss than expected. However, the difference between alkaline additives is relatively
90
The daily peak of ammonia loss in Runs C and D appears on Day 14, while the daily
peak of ammonia loss in Runs A and B can be found on Day 17 and Day 18,
respectively. As for Run C, NaAc only changed the pH, while for Runs A and B,
because HPO42" and H2PO4* could react with NH3 with the help of Mg2+, produced
struvite crystallized magnesium ammonium phosphate (MAP, MgNH4P04-6H20) to
stabilize the nitrogen element (Li et al., 2010). Only when the output rate of ammonia
by microbial was larger than absorption rate by absorbents, could ammonia emission
be detected. The reaction of struvite formation is shown below:
Mg2* + NH* + H2POR + 6H20 -» MgNH4P04 • 6H20+2H*
When comparing Runs A and C in a cumulative O2 uptake rate and cumulative
ammonia release, some inconsistency could be found between the two alkaline
additives. Although Run A with KH2PC>4/MgS04 had a higher ammonia loss and an
O2 uptake rate better than Run C amended with NaAc, the two parameters are not
proportional. The final cumulative O2 uptake rate of Run A was 95% of the value of
Run C; while for the cumulative ammonia loss, the rate became 88%. This
phenomenon could be analyzed by the theory above. The OUR was proportional to
the reaction velocity while ammonia loss reflected the combined effects of the
reaction rate and the absorption of additive. K2HPO4 and MgS04 in Run A not only
affected the pH in the system, but could absorb ammonia by forming struvite, while
NaAc in Run C only changed the pH. That was why Run A had less of an ammonia
loss than expected. However, the difference between alkaline additives is relatively
Page 107
slight, which indicated the pH may still be the predominant factor in deciding the
amount of ammonia release. This was also reflected by the fmal amount of oxygen
uptake and ammonia loss in the four reactors. The order of the two parameters was the
same: Run C, Run A, Run D and Run B, from highest to lowest, corresponding to the
pH from greatest to lowest. Because the amendment in Run B was acidic, the
microbial reaction rate was severely affected, presenting the lowest ammonia release
due to limited ammonia being produced. In addition, by comparing the three factors in
Runs A and B, it could be found that struvite was more likely to be formed under an
alkaline environment. With respect to OUR, the value of Run B was 27% of the value
of Run A; while the ratio changed to 29% for the cumulative ammonia loss,. The
difference should result in less struvite being produced in Run B amended with acidic
amendment, M.-12Pa4.
In summary, it showed the factors, including the changing distribution of NH3•H2O
and NH4+ because of the pH and the absorbance of NH3 due to P0.43" and Mg2+, did
affect ammonia emission amount, but it could not be used to support the ratio of the
two effects because it was based upon a comparison not an accurate measurement. In
a real system, it is impossible to divide every factor and obtain the ratio of every
factor for the fmal result.
43 Nitrogen Mass Balance in Composting System
91
slight, which indicated the pH may still be the predominant factor in deciding the
amount of ammonia release. This was also reflected by the final amount of oxygen
uptake and ammonia loss in the four reactors. The order of the two parameters was the
same: Run C, Run A, Run D and Run B, from highest to lowest, corresponding to the
pH from greatest to lowest. Because the amendment in Run B was acidic, the
microbial reaction rate was severely affected, presenting the lowest ammonia release
due to limited ammonia being produced. In addition, by comparing the three factors in
Runs A and B, it could be found that struvite was more likely to be formed under an
alkaline environment. With respect to OUR, the value of Run B was 27% of the value
of Run A; while the ratio changed to 29% for the cumulative ammonia loss,. The
difference should result in less struvite being produced in Run B amended with acidic
amendment, KH2PO4.
In summary, it showed the factors, including the changing distribution of NH3-H20
and NH4+ because of the pH and the absorbance of NH3 due to PO43" and Mg2+, did
affect ammonia emission amount, but it could not be used to support the ratio of the
two effects because it was based upon a comparison not an accurate measurement. In
a real system, it is impossible to divide every factor and obtain the ratio of every
factor for the final result.
43 Nitrogen Mass Balance in Composting System
91
Page 108
The above phenomenon states the conflict between a better aerobic degradation rate
under high pH and a less ammonia emission under low pH. In order to fully
investigate the optimum pH for a composting process, nitrogen mass balance in the
four runs is studied herein. Figure 4.6 shows the distribution of organic nitrogen.,
inorganic nitrogen in solution (NH4+-N) and emitted ammonia (NH3-N). The NH4+-N
containing nitrogen in both NH3•H2O and NH4+ and NH3-N which includes ammonia
nitrogen in exhaust gas. In these figures, NH3-N shared the same trend with ammonia
loss. Run B had a much less NH3—N component than the other 3 runs, but when
compared with other nitrogen component, NH3 only accounted for a small portion of
the total nitrogen element. Even the rate in Run C, with the highest ammonia emission,
was less than 15%. Unlike NH3-N, Organic N and NI14+-N were the major parts of
nitrogen in the composting system, and their timing distribution was different in the
four runs. Transformed inorganic N from organic matters is preferred because
inorganic N is more easily utilized by microorganisms. The organic N ratio in the final
product is 43%, 55%, 43% and 50% in Runs A, B, C and D, respectively. There is
obviously more inorganic nitrogen produced in Run A and Run C with alkaline
additives. Whereas, for Run B amended with acidic buffer salts, far more organic
nitrogen remains in the final composting products. The NH4-N percentages from the
four runs on Day 24 were 45%, 41%, 44% and 41%, respectively. Although the
difference was not as significant as that for organic nitrogen, Runs A and C retained
more inorganic nitrogen in the composting system despite further emitted ammonia.
Based on nitrogen mass balance data, alkaline additives in this research are beneficial
92
The above phenomenon states the conflict between a better aerobic degradation rate
under high pH and a less ammonia emission under low pH. In order to fully
investigate the optimum pH for a composting process, nitrogen mass balance in the
four runs is studied herein. Figure 4.6 shows the distribution of organic nitrogen,
inorganic nitrogen in solution (NH/-N) and emitted ammonia (NH3-N). The NHj+-N
containing nitrogen in both NH3-H2O and NKt+ and NH3-N which includes ammonia
nitrogen in exhaust gas. In these figures, NH3-N shared the same trend with ammonia
loss. Run B had a much less NH3-N component than the other 3 runs, but when
compared with other nitrogen component, NH3 only accounted for a small portion of
the total nitrogen element. Even the rate in Run C, with the highest ammonia emission,
was less than 15%. Unlike NH3-N, Organic N and NH4+-N were the major parts of
nitrogen in the composting system, and their timing distribution was different in the
four runs. Transformed inorganic N from organic matters is preferred because
inorganic N is more easily utilized by microorganisms. The organic N ratio in the final
product is 43%, 55%, 43% and 50% in Runs A, B, C and D, respectively. There is
obviously more inorganic nitrogen produced in Run A and Run C with alkaline
additives. Whereas, for Run B amended with acidic buffer salts, far more organic
nitrogen remains in the final composting products. The NH4-N percentages from the
four runs on Day 24 were 45%, 41%, 44% and 41%, respectively. Although the
difference was not as significant as that for organic nitrogen, Runs A and C retained
more inorganic nitrogen in the composting system despite further emitted ammonia.
Based on nitrogen mass balance data, alkaline additives in this research are beneficial
Page 109
(A) 100
e 80
g 60
40 tu)
'1"-' 20
0
6
•
• • •
0
6
606
6
6
• • 6 •
5
6 6
• • • •
• • • • • .•. • • •. • • • • •
•
oi° r0
10 15
Time (day)
Organic N p NH4-N • NH3-N
I
•
•
o°°
20
• •
'1°
Figure 4.6a Evolution of different nitrogen forms during composting (Run A)
93
100
80 -
§ 60 a a 0 a 40 4> WD
1 20 -I
(A)
T m
> * * * 11 * * *
10 15 Time (day)
20
Q Organic N E3NH4-N INH3-N
Figure 4.6a Evolution of different nitrogen forms during composting (Run A)
93
Page 110
(B)
100
80
,11 60
40
z 20
0
0 i /
11 • • • •
•
•
•
•
•
•
•
•
•
•
•
•
•
•
Pd
•• • •• .•• .•• •
w /PP
/ / 0
PdPd
0 0
0 •
0 5 10 15
Time (day)
Organic N 0 NH4-N ■ NH3-N
20
Figure 4.6b Evolution of different nitrogen forms during composting (Run B)
94
100
(B)
80
a 4) § 60 a a o ^ 4 0 V oe s
20 -
t * * * * * * *
* t * * t
10 Time (day)
15 20
a Organic N 0 NH4-N • NH3-N
Figure 4.6b Evolution of different nitrogen forms during composting (Run B)
94
Page 111
e 4.6c Evolution o
f different nitrogen forms during com
posting (Run C
)
0
0
A
00
a
cn
O
01
O
Nitrogen Component (%) 42% 0) 03
0 0 0 0 0 8 1 I
r
. ........ --MEM
(C)
100
§ 60
« 40 S
O
OA £ s 20 0
0
5
10
20
15 T
ime (day)
• O
rgan
ic N
ED
NH
4-N • N
H3-N
Figure 4.6c E
volution of different nitrogen forms during com
posting (Run C
)
95
Page 112
Figure 4.6d E
volution of different nitrogen forms during com
posting (Run D
)
0 Oct
n z
0 z
z
z
0
01
0
-24
O
Nitrogen component (%)
0 0 0
.......... ...... "Vq6.1104h.
IC • mai
\11:\1
101 1001 101 1•11011.71k:
gh.
Ne.16.1. ...... IE..... • •• •• ....
-a
100
a <U a o
a
a so o
o
(D)
a 4> an
I Z
*
* t * *
* I. 1
10
15
Tim
e (day)
20
B O
rgan
ic N
GJN
H4-N
•N
H3-N
Figure 4.6d E
volution of different nitrogen forms during com
posting (Run D
)
96
Page 113
to microorganism activity, which transfers organic nitrogen into inorganic forms.
4.4 Summary
In this section, the effects of different buffer agents, NaAc, K2HPO4 and KH2PO4, as
amendments for food waste composting were examined under well-controlled
experimental conditions. The effects of buffer salts were found to closely relate to
their initial pH level. As for alkaline buffer agents, NaAc and K2HPO4 in this study, a
higher final pH, a temperature in the thermophilic phase and the oxygen uptake rate
were monitored indicating positive evidence of an improving composting process.
However, an enhanced ammonia loss was also shown in the runs with alkaline
amendment, which would lower product quality. As for the run with acidic buffer
agents amended, the microbial activities were severely hampered which made
KH2PO4 an unsuitable additive for composting processes. The effects of struvite,
formed by phosphates and MgSO4, were also investigated. The results indicated
struvite was not an effective method with which to prevent NH3 emission; pH
remained the dominant factor to control ammonia emission in this study.
The study results demonstrated that amendment K2HPO4 with MgSO4 is the optimal
choice among the three buffer agents tested in this study. Because amendment
K2HPO4/MgSO4 had an obvious improvement in composting parameters as buffer
agents like NaAc, it could successfully help to avoid the adverse effects of organic
acids during the initial stage but would cause less ammonia release than NaAc.
97
to microorganism activity, which transfers organic nitrogen into inorganic forms.
4.4 Summary
In this section, the effects of different buffer agents, NaAc, K2HPO4 and KH2PO4, as
amendments for food waste composting were examined under well-controlled
experimental conditions. The effects of buffer salts were found to closely relate to
their initial pH level. As for alkaline buffer agents, NaAc and K2HPO4 in this study, a
higher final pH, a temperature in the thermophilic phase and the oxygen uptake rate
were monitored indicating positive evidence of an improving composting process.
However, an enhanced ammonia loss was also shown in the runs with alkaline
amendment, which would lower product quality. As for the run with acidic buffer
agents amended, the microbial activities were severely hampered which made
KH2PO4 an unsuitable additive for composting processes. The effects of struvite,
formed by phosphates and MgSC>4, were also investigated. The results indicated
struvite was not an effective method with which to prevent NH3 emission; pH
remained the dominant factor to control ammonia emission in this study.
The study results demonstrated that amendment K2HP04 with MgSC>4 is the optimal
choice among the three buffer agents tested in this study. Because amendment
K2HP04/MgS04 had an obvious improvement in composting parameters as buffer
agents like NaAc, it could successfully help to avoid the adverse effects of organic
acids during the initial stage but would cause less ammonia release than NaAc.
97
Page 114
CHAPTER 5
EFFECTS OF TEMPERATURE AND pH
5.1 Kinetics Model Development
5.1.1 Development of a Two-Term Monod Equation with Correction Factors of
Temperature and pH
With respect to a composting system without biomass recycle, Monod equation is
employed to express the rate of reaction as Equations (1) (Monod, 1949) :
dS max SX
dt Ks + S (5.1)
where the variables S and X indicate organic substrate (kg) and concentration of
microorganisms ( g I kgom ), respectively. The constant Pimu indicates maximum
specific degradation rate of organic substrate (day-I ) when microorganisms reach
their maximum activity, and K3 is called "half-saturation constant" (kg), which
indicates the concentration of organic substrate at one-half the maximum specific
substrate utilization rate.
Since /.1m,x is a measure of the overall efficiency of each composting process under
analysis, it is obviously dependent on the system design, type of material under
treatment, operational condition, and any other factors that may affect overall system
performance. As a result, p is the result of pm. multiplied by given environment
correction factors, which is a coefficient within 0 to 1 when environmental variables
98
CHAPTERS
EFFECTS OF TEMPERATURE AND pH
5.1 Kinetics Model Development
5.1.1 Development of a Two-Term Monod Equation with Correction Factors of
Temperature and pH
With respect to a composting system without biomass recycle, Monod equation is
employed to express the rate of reaction as Equations (1) (Monod, 1949) :
(5.1) dS M^SX dt Kt+S
where the variables S and X indicate organic substrate (kg) and concentration of
microorganisms ( g/kg0M ), respectively. The constant //max indicates maximum
specific degradation rate of organic substrate (day'1) when microorganisms reach
their maximum activity, and Ks is called "half-saturation constant" (kg), which
indicates the concentration of organic substrate at one-half the maximum specific
substrate utilization rate.
Since jumix is a measure of the overall efficiency of each composting process under
analysis, it is obviously dependent on the system design, type of material under
treatment, operational condition, and any other factors that may affect overall system
performance. As a result, //roai is the result of /Jmix multiplied by given environment
correction factors, which is a coefficient within 0 to 1 when environmental variables
98
Page 115
are in a certain range. The value of 1 represents no prohibitive effects on
microorganisms, while correction factors close to 0 represents an inhibition so strong
that microorganisms lose their activity. Because one of the major objectives in this
paper is to discuss the effects of different environment factors on the activities of
mesophiles and thermophiles, it is reasonable to believe temperature and pH are
among the variables which have remarkable differences in affecting two types of
microorganisms, respectively (Baptista et al., 2010). Thus, only correction factors for
temperature and pH are introduced in Equation (2) while the effects of other
operational conditions are neglected.
ft =- 4u. x f (T)x f(pH),0 < f (T), f(pH) <1 (5.2)
where f(T) and f(pH) are correction functions to evaluate the effects of
temperature and pH (Lin et al., 2008; Petric and Selimbasic, 2008; Baptista et al.,
2010).
Extensive sets of equations in the literature to describe the dependency of the
composting rate on temperature and pH (R.T. Haug, 1993). Quadratic forms apprear
to have strong experimental support and wide acceptance by composting researchers
(Lin et al., 2008). Equations (3) and (4) describe the correction functions of
temperature and pH, respectively.
f(T). aT2 +br + c (5.3)
f(pH)=o(pH)2 + p(pH) + q (5.4)
where a, b, c, o, p and q are parameters to be estimated through the experimental data.
99
are in a certain range. The value of 1 represents no prohibitive effects on
microorganisms, while correction factors close to 0 represents an inhibition so strong
that microorganisms lose their activity. Because one of the major objectives in this
paper is to discuss the effects of different environment factors on the activities of
mesophiles and thermophiles, it is reasonable to believe temperature and pH are
among the variables which have remarkable differences in affecting two types of
microorganisms, respectively (Baptista et al., 2010). Thus, only correction factors for
temperature and pH are introduced in Equation (2) while the effects of other
operational conditions are neglected.
Mmax = x f(T) X f ( P H) , 0 < f (T ) , f ( pH) < 1 (5.2)
where f {T ) and f ( pH) are correction functions to evaluate the effects of
temperature and pH (Lin et al., 2008; Petric and Selimbasic, 2008; Baptista et al.,
2010).
Extensive sets of equations in the literature to describe the dependency of the
composting rate on temperature and pH (R.T. Haug, 1993). Quadratic forms apprear
to have strong experimental support and wide acceptance by composting researchers
(Lin et al., 2008). Equations (3) and (4) describe the correction functions of
temperature and pH, respectively.
f (T ) = aT 2 +bT+c (5.3)
f ( pH) = o (pHf +p(pH) + q (5.4)
where a, b, c, o, p and q are parameters to be estimated through the experimental data.
99
Page 116
The transformation of quadratic functions in Equations (3) and (4) is designed for not
only directly assessing optimal temperature and pH, but decreasing the numbers of
parameters. As a result, the updated correlation factors for temperature and pH are
shown in Equation (5) and (6):
f (T) = 0.9
2 (Top, — + 1
( Topi — To .I )
Top: > 7 0.1
(5.5)
0.9 f (p11) = opH) _ (pin° OPH)„,,, (PHD' +1
(5.6)
(P11)0„, > (PH)0
where Too, and pH op, op, are the optimal temperature and pH values corresponding to
a maximum reaction rate for microorganisms ( f (Too) =1, f ((pH)„,,,) =1); To and
(pH)0 I are the inhibition values of temperature and pH in the quadratic function
when f (To ,) = 0.1 , f ((pH)01) = 0.1 . The constraints T op, > To , and
(p11)0„, > (PI00.1 ensure that the inhibition value is in the left side of the quadratic
functions. Because there is no clear-cut value with which to judge whether
microorganisms have lost their activity, a correction factor equal to 0.1 is considered
as the lower bound of microorganism activity in the model. It means the activity of
microorganisms can be neglected if environmental conditions are beyond this range.
In addition to the aforementioned considerations, since mesophilic and hemophilic
microorganisms might have different optimal kinetics parameters (Vogelaar et al.,
2003), Monod function has been modified into a two-term form as follows:
AS = PmakinesoSX meso PinakthermoSg thermo
+ S K„ h„,„0 + S
100
(5.7)
The transformation of quadratic functions in Equations (3) and (4) is designed for not
only directly assessing optimal temperature and pH, but decreasing the numbers of
parameters. As a result, the updated correlation factors for temperature and pH are
shown in Equation (5) and (6):
fCH = : 5- (7L - Tf +1 (Topl~T0i)2 Kop' (5.5)
Topt > T0,
f ( pH) = — T ( ( P H)OOI +1 (CpH) o p , - {pH\ A f K K P (5.6)
(PH) 0 P , > (pH\ ,
where Topl and pHopt are the optimal temperature and pH values corresponding to
a maximum reaction rate for microorganisms (/(7^,) = 1, /{{pH)opt) = 1); T0, and
(pH)0 l are the inhibition values of temperature and pH in the quadratic function
when f(T0i) = 0.1 , f((pH)0 l) = 0.1 . The constraints Topl > Tot and
(pH)opl > (pH)o, ensure that the inhibition value is in the left side of the quadratic
functions. Because there is no clear-cut value with which to judge whether
microorganisms have lost their activity, a correction factor equal to 0.1 is considered
as the lower bound of microorganism activity in the model. It means the activity of
microorganisms can be neglected if environmental conditions are beyond this range.
In addition to the aforementioned considerations, since mesophilic and hemophilic
microorganisms might have different optimal kinetics parameters (Vogelaar et al.,
2003), Monod function has been modified into a two-term form as follows:
Mwaj^mesomeso ^majLJhermo^^thermo /r -yx
K,,m,so + S Ks.,hermo + S
100
Page 117
where AS indicate daily organic matter degradation rate; Al.,. , pm...therm. ,
and Ichermo are the maximum specific degradation rate and the
half-saturation coefficient for mesophilic and thermophilic microorganisms
respectively. It is worth mentioning that the modification of the Monod function is
based on the assumption that both mesophiles and thermophiles utilize the same
substrates in a composting system, so that the two terms in Equation (7) share the
same parameter S, which represents the substrate concentration.
By integrating the transformed correction factors of temperature and pH with the
composting kinetics models, a two-term modified Monod function is obtained and can
be used to consider the combined effects of different temperatures and pH conditions
on thermophilic and mesophilic microorganisms, as shown in Equation (8):
p
SO x
mm, 0.9 As _ ,MeS SX
(T — T)2 +1)x Ks,meso S )2 " 1'mej°
0.9 (— ff P l Oopt,meso —03HW +1)-i-
kkpliu iopt,meso — (P H )0.1,mesol
Pinax,therinoSX thermo 0.9 ( T optAtenno — TY +10 X
lch enno + S ( T opt,thenno —70.1,thermo)
0.9 E., .1 OPH)opt,thermo — (PH))` +
1opt,thernto (P H )0.1,thermo)
(5.8)
where T wn,meso TO.1,meso s (P H )opr,meso (P 1 00.1,meso (P H )opt,meso 9 T opi,thermo 7 0.1,thenno
(pH) op, ,thermo and ( pH) 0.1,thenno are optimal and the lowest allowed temperature and
pH values for mesophilic and thermophilic microorganisms.
101
where AS" indicate daily organic matter degradation rate; /u^ , H^4hermo ,
K, mao ^-sjhermo arc maximum specific degradation rate and the
half-saturation coefficient for mesophilic and thermophilic microorganisms
respectively. It is worth mentioning that the modification of the Monod function is
based on the assumption that both mesophiles and thermophiles utilize the same
substrates in a composting system, so that the two terms in Equation (7) share the
same parameter S, which represents the substrate concentration.
By integrating the transformed correction factors of temperature and pH with the
composting kinetics models, a two-term modified Monod function is obtained and can
be used to consider the combined effects of different temperatures and pH conditions
on thermophilic and mesophilic microorganisms, as shown in Equation (8):
A o _ ^wx,meao^^meso .,/• 0.9 {rf, ^ ^ — 7?lJ0P,,mes0~J ) +l)X
V opt,meso OA,meso *
("TTIK 7Si - W)2 +1>+ ( ( P H)op,.n,e,o 0.1,m„0) (5.8)
mixjhermo^^thermo r 0.9 /m + llx tr n ^ /rp rjrt -y2 ^ OptjkermO ' ^
sjhermo v optjhermo OAjhermo'
+') \\pti Jopf^ermo \P** /QAjhermo)
WllCTC ^opt,meso ' ^0.1 ,meso ' (PH)* ,meso ' *opt,meso ' ^optjhermo ' ^0.1 Jhermo 1
(PH)op,Aermo and G^Oo..,*—.«* optimal and the lowest allowed temperature and
pH values for mesophilic and thermophilic microorganisms.
101
Page 118
5.1.2 Non-Linear Regression
In previous studies, the Lineweaver—Burk linear equation has been widely utilized to
linearize the single-term Monod equation (Lineweaver and Burk, 1934).
Unfortunately, linear transformations of a non-linear modeling equation alter the
errors and are always considered to have a low accuracy. Furthermore, linearization is
quite infeasible for some modified Monod equations or when several correction
factors exist (L. H. Smith et al., 1998). In order to achieve a fitting accuracy, the
Solver add-in function in Microsoft Excel was used in this non-linear data fitting
process. The model parameters were successfully estimated via trial and error analysis
to minimize the sum of the squared errors (SSE) in Equation (9):
SSE = E (Kb, —ntred )2 1=1
(5.9)
where k'b' is an observed value of parameter n in the ith observation, and nfred is
the predicted value of parameter n by the model corresponding to ith observation.
The best estimation of coefficients in Equation (8) was determined based on the
observed values for S , X „,no Xth o (pH) and T, together with the initial
experienced values located in the literature (Xi et al., 2005).
5.2 State-Variable Profiles
Figure 5.1 and Figure 5.2 show the temperature and pH profiles in the six runs.
According to these figures, all pairs of parallel samples shared the same trend in pH
and temperature profiles, which indicated our experiment was conducted under
102
5.1.2 Non-Linear Regression
In previous studies, the Lineweaver-Burk linear equation has been widely utilized to
linearize the single-term Monod equation (Lineweaver and Burk, 1934).
Unfortunately, linear transformations of a non-linear modeling equation alter the
errors and are always considered to have a low accuracy. Furthermore, linearization is
quite infeasible for some modified Monod equations or when several correction
factors exist (L. H. Smith et al., 1998). In order to achieve a fitting accuracy, the
Solver add-in function in Microsoft Excel was used in this non-linear data fitting
process. The model parameters were successfully estimated via trial and error analysis
to minimize the sum of the squared errors (SSE) in Equation (9):
SSE = YJ(nf -nr"? (5.9) 1=1
where n f ' is an observed value of parameter n in the ith observation, and nfr'd is
the predicted value of parameter n by the model corresponding to ith observation.
The best estimation of coefficients in Equation (8) was determined based on the
observed values for S, Xmao, Xthermo, (pH) and T, together with the initial
experienced values located in the literature (Xi et al., 2005).
5.2 State-Variable Profiles
Figure 5.1 and Figure 5.2 show the temperature and pH profiles in the six runs.
According to these figures, all pairs of parallel samples shared the same trend in pH
and temperature profiles, which indicated our experiment was conducted under
102
Page 119
well-controlled conditions. The ambient temperature was within a very narrow range
(around 22 °C) during the composting period so that the effects of ambient
temperature could be neglected. The temperature in all runs showed a typical trend:
temperature rose to around 60 °C during the first 5 days, which embarked upon the
beginning of thermophilic composting. This phase would last 15 to 20 days, at which
time tThe temperature dropped to ambient. However, there were slight differences
among the runs. It was obvious that Rims G1 and G2 could maintain a stable
temperature between 50 °C to 60 °C due to external heating. Due to the large specific
heat capacity of the added water, Runs F1 and F2 experienced a variation in a slower
temperature rising process and a later temperature decreasing phase due to high
energy consumption. The temperature of Runs Fl and F2 was the lowest before the
6th day and began to drop on the 14th day, while the cooling phase for Runs El and
E2 started on the 10th day. Furthermore, it seemed that water only affected the time in
which to reach thermophilic composting but not the efficiency of composting, which
could be reflected from similar highest temperatures among Runs El, E2, Fl and F2.
The pH of all six runs also followed a typical composting pattern: the pH dropped to
4.5 in the first stage due to produced organic acid from easily degradable matters,
which was toxic to microorganisms and inhibitive to the reaction rate; after the 5th
day, the pH began to rise because of produced ammonia when starch, proteins etc.
were decomposed accompanied by producing ammonia; during the final stage, pH
103
well-controlled conditions. The ambient temperature was within a very narrow range
(around 22 °C) during the composting period so that the effects of ambient
temperature could be neglected. The temperature in all runs showed a typical trend:
temperature rose to around 60 °C during the first 5 days, which embarked upon the
beginning of thermophilic composting. This phase would last 15 to 20 days, at which
time tThe temperature dropped to ambient. However, there were slight differences
among the runs. It was obvious that Runs G1 and G2 could maintain a stable
temperature between 50 °C to 60 °C due to external heating. Due to the large specific
heat capacity of the added water, Runs F1 and F2 experienced a variation in a slower
temperature rising process and a later temperature decreasing phase due to high
energy consumption. The temperature of Runs F1 and F2 was the lowest before the
6th day and began to drop on the 14th day, while the cooling phase for Runs El and
E2 started on the 10th day. Furthermore, it seemed that water only affected the time in
which to reach thermophilic composting but not the efficiency of composting, which
could be reflected from similar highest temperatures among Runs El, E2, F1 and F2.
The pH of all six runs also followed a typical composting pattern: the pH dropped to
4.5 in the first stage due to produced organic acid from easily degradable matters,
which was toxic to microorganisms and inhibitive to the reaction rate; after the 5th
day, the pH began to rise because of produced ammonia when starch, proteins etc.
were decomposed accompanied by producing ammonia; during the final stage, pH
103
Page 120
Run E 80
60
U
40 4,) a
20
0 5 10 15 Time (day)
20 25 30
Figure 5.1a Temperature profiles for Run E during the composting process
104
80 Run E
f —O-Run E1
1 15
Time (day)
—i—
20
-Run E2 —i— 25 10 30
Figure 5.1a Temperature profiles for Run E during the composting process
104
Page 121
Run F 80
60
LA 1 40 0 0., a
20
—0— Run Fl -•— Run F2
0 5 10 15 Time (day)
20 25 30
Figure 5.1b Temperature profiles of Run F during the composting process
105
Run F
Run F2 Run F1
10 15 20 Time (day)
25 30
Figure 5.1b Temperature profiles of Run F during the composting process
105
Page 122
Run G
0 5 10 15 Time (day)
Figure 5.1c Temperature profiles of Run G during the composting process
106
20 25 30
Run G 80
40 -
20 -
—o— Run G1
15 20 25 30 0 5 10 Time (day)
Figure 5.1c Temperature profiles of Run G during the composting process
106
Page 123
Run E 10
= a.
8
4
0 5 10 15 20 25 30 Time (day)
Figure 5.2a pH profiles for Run E during the composting process
107
Run E
RunE1
0 5 10 15 20 25 30 Time (day)
Figure 5.2a pH profiles for Run E during the composting process
107
Page 124
Run F
1
—0—Run Fl -+- Run F2
0 5 10 15 Time (day)
Figure 5.2b pH profiles for Run E during the composting process
108
20 25 30
Run F
-O—Run F1 Run F2
30 10 15 20 25 0 5 Time (day)
Figure 5.2b pH profiles for Run E during the composting process
108
Page 125
Run G
0 5 10 15 Time (day)
20 25
Figure 5.2c pH profiles of Run G during the composting process
109
30
Run G 10
8
X o.
6
RunG2 -0-RunG1
4 0 5 10 15 20 25 30
Time (day)
Figure 5.2c pH profiles of Run G during the composting process
109
Page 126
was stable around 8.5, which was a sign of a successful composting. For Runs El, E2,
Fl and F2, the change in pH from acidic to an alkaline environment coincided with
the change from mesophilic to thermophilic stage. This phenomenon was also
observed elsewhere (Beck-Friis et al., 2001). However, the pH of Runs Fl and F2,
was slightly higher on the Day 2 than that of Runs El and E2, which was due to the
added water served as a solvent to dilute organic acid. The pH of Runs Cl and C2
began to rise on the Day 8, which suggested a prolonged lag phase could occur based
on a condition of combined high temperature and low pH.
5.3 Model Calibration
Table 5.1 summarizes the values of the kinetics coefficients with respect to
mesophiles and thermophiles, as well as their 95% confidence intervals. Solutions i to
vi are best-fitted parameters obtained from six-time cross-validations. Solution vii,
which is treated as the fmal result of coefficients in this model, is the weighted mean
of the six result groups based on the sample size. In Solution vii, the maximum
specific growth rate for mesophilic and thermophilic microorganisms are 13.47 and
8.46 day, respectively. A higher specific growth rate implies that thermophilic
microorganisms have higher degradation ability when environmental conditions are
all optimized. This conclusion is also coherent with the fact that thermophilic
microorganisms are responsible for a large portion of degradation in a composting
system (Yu and Huang, 2009). As for half-saturation constants, Ki4„ , 3.64 is larger
than K, me o , 3.19. This result indicates inhibition effects on thermophilic
110
was stable around 8.5, which was a sign of a successful composting. For Runs El, E2,
F1 and F2, the change in pH from acidic to an alkaline environment coincided with
the change from mesophilic to thermophilic stage. This phenomenon was also
observed elsewhere (Beck-Friis et al., 2001). However, the pH of Runs F1 and F2,
was slightly higher on the Day 2 than that of Runs El and E2, which was due to the
added water served as a solvent to dilute organic acid. The pH of Runs CI and C2
began to rise on the Day 8, which suggested a prolonged lag phase could occur based
on a condition of combined high temperature and low pH.
5.3 Model Calibration
Table 5.1 summarizes the values of the kinetics coefficients with respect to
mesophiles and thermophiles, as well as their 95% confidence intervals. Solutions i to
vi are best-fitted parameters obtained from six-time cross-validations. Solution vii,
which is treated as the final result of coefficients in this model, is the weighted mean
of the six result groups based on the sample size. In Solution vii, the maximum
specific growth rate for mesophilic and thermophilic microorganisms are 13.47 and
8.46 day"1, respectively. A higher specific growth rate implies that thermophilic
microorganisms have higher degradation ability when environmental conditions are
all optimized. This conclusion is also coherent with the fact that thermophilic
microorganisms are responsible for a large portion of degradation in a composting
system (Yu and Huang, 2009). As for half-saturation constants, KiAermo, 3.64 is larger
than Ks meso ,3.19. This result indicates inhibition effects on thermophilic
110
Page 127
Table 5.1 Coefficients obtained from modified and original Monod models.
Solution i to Solution vi are six sets of parameters obtained by two-term Monod
model with cross-validation method. Solution vii is averaged final result. 95%
confidence intervals of parameters in Solution vii are included also. Solution viii is
result generated by two-term Monod model without cross-validation method. Solution
ix is result derived from original Monod model.
Solution i ii iii iv v vi vii 95% CI viii ix
No. of Samp. 64 67 64 65 65 65 78 78
Pmax.theno 12 12.28 14.97 14.45 14.59 12.55 13.47 13.4713.129 13.58
9.70
7.13 9.3 8.27 8.66 7.65 8.36 8.24 8.2411.786 8.36
Ks.thermo 3.36 3.5 3.93 3.94 3.15 3.99 3.64 3.6410.836 3.99
3.36
2.5 3.01 3.89 3.61 2.84 3.32 3.19 3.1911.203 2.84
Topco,„,„. 56.99 51.59 50.58 51.05 52.4 51.17 52.28 52.2815.584 52.05
44.36
Tom. 41.65 39.77 41.69 41.66 41.61 42.11 41.41 41.4111.94 41.73
To Lthenno 16.00 15.93 17.83 17.97 18.56 17.68 17.32 173212376 17.49
19.00
To.1.0 18.25 14.61 18.3 18.26 18.12 18.42 17.64 17.6413.514 18.40
(1311)00 ammo 9.3 7.8 7.68 7.76 8.75 7.91 8.2 8.211.556 8.01
6.84
(pH),,,,. 6.46 6.38 6.49 6.48 6.24 6.56 6.43 6.4310.262 6.56
(pH)0 2.89 3.75 3.64 3.81 3.83 3.68 3.6 3.6010.834 3.56
4.08
(PH) o.1. 50 3.58 3.83 3.48 3.57 3.28 3.68 3.57 3.5710.435 3.68
SSE (104) 43 3.92 4.76 5.01 4.09 4.69 4.44 N/A 4.71 17.54
111
Table 5.1 Coefficients obtained from modified and original Monod models.
Solution i to Solution vi are six sets of parameters obtained by two-term Monod
model with cross-validation method. Solution vii is averaged final result. 95%
confidence intervals of parameters in Solution vii are included also. Solution viii is
result generated by two-term Monod model without cross-validation method. Solution
ix is result derived from original Monod model.
Solution i ii iii iv V vi vii 95% CI viii ix
No. of Samp. 64 67 64 65 65 65 \ \ 78 78
Mmax,thamo 12 12.28 14.97 14.45 14.59 12.55 13.47 13.47±3.129 13.58
9.70
Mmax,meso 7.13 9.3 8.27 8.66 7.65 8.36 8.24 8.24±1.786 8.36
^s.IhcniK) 3.36 3.5 3.93 3.94 3.15 3.99 3.64 3.64±0.836 3.99
3.36
^s.mcso 2.5 3.01 3.89 3.61 2.84 3.32 3.19 3.19±1.203 2.84
Topl.thentio 56.99 51.59 50.58 51.05 52.4 51.17 52.28 52.28±5.584 52.05
44.36
Topuneso 41.65 39.77 41.69 41.66 41.61 42.11 41.41 41.41±1.94 41.73
To.l.thenno 16.00 15.93 17.83 17.97 18.56 17.68 17.32 17J2±2.576 17.49
19.00
TO.IJIMO 18.25 14.61 18.3 18.26 18.12 18.42 17.64 17.64±3.514 18.40
(pH)opt.thenno 9.3 7.8 7.68 7.76 8.75 7.91 8.2 8.2±1.556 8.01
6.84
(pH) oprmeso 6.46 6.38 6.49 6.48 6.24 6.56 6.43 6.43*0.262 6.56
(pH)o | ttenjQ 2.89 3.75 3.64 3.81 3.83 3.68 3.6 3.60±0.834 3.56
4.08
(pH) 0.1 jncso 3.58 3.83 3.48 3.57 3.28 3.68 3.57 3.57±0.435 3.68
SSE (10"4) 4.5 3.92 4.76 5.01 4.09 4.69 4.44 N/A 4.71 17.54
I l l
Page 128
microorganisms will be more severe than on mesophilic microorganisms, when the
substrate concentration is limited. Higher K, for thermophiles was also taken from
work obtained from other's (Borja et al., 1995).
Mesophiles and thermophiles reveal an obvious discrepancy of their optimized
temperature, (41.41 °C for mesophiles and 52.28 °C for thermophiles), compared with
a well-accepted mesophilic temperature (around 35 °C) and a thermophilic
temperature (around 55 °C). The results are not uncommon (Hashimoto, 1983).
However, the mesophilic temperature is a little higher than the literature stated which
may be caused by specific substrates and microorganisms in the experiments. This
deviation also reflects the importance of finding experiment-specific kinetics
parameters. The inhibitive low temperatures for both mesophilic and thermophilic
microorganisms are very close to each other, which are 17.32 °C and 17.64 °C
respectively. It was suggested if temperature in composting system falls below 17 °C,
both microorganisms are unable to grow properly. Based on the symmetrical
characteristic of quadratic function, it is easily deferred that the upper bounds of
activated temperatures for both mesophilic and thermophilic microorganisms are
65.50 °C and 87.24 °C, while in previous literature; the activity of microorganisms
will be impeded significantly if the temperature is 10 °C higher than its optimum
temperature. The inconsistent upper bounds of activated temperature are due to the
limitation of quadratic correction factors. Other expressions of correction factors with
which to solve this problem are desirable, but on the other hand, they would
112
microorganisms will be more severe than on mesophilic microorganisms, when the
substrate concentration is limited. Higher Ks for thermophiles was also taken from
work obtained from other's (Boija et al., 1995).
Mesophiles and thermophiles reveal an obvious discrepancy of their optimized
temperature, (41.41 °C for mesophiles and 52.28 °C for thermophiles), compared with
a well-accepted mesophilic temperature (around 35 °C) and a thermophilic
temperature (around 55 °C). The results are not uncommon (Hashimoto, 1983).
However, the mesophilic temperature is a little higher than the literature stated which
may be caused by specific substrates and microorganisms in the experiments. This
deviation also reflects the importance of finding experiment-specific kinetics
parameters. The inhibitive low temperatures for both mesophilic and thermophilic
microorganisms are very close to each other, which are 17.32 °C and 17.64 °C
respectively. It was suggested if temperature in composting system falls below 17 °C,
both microorganisms are unable to grow properly. Based on the symmetrical
characteristic of quadratic function, it is easily deferred that the upper bounds of
activated temperatures for both mesophilic and thermophilic microorganisms are
65.50 °C and 87.24 °C, while in previous literature; the activity of microorganisms
will be impeded significantly if the temperature is 10 °C higher than its optimum
temperature. The inconsistent upper bounds of activated temperature are due to the
limitation of quadratic correction factors. Other expressions of correction factors with
which to solve this problem are desirable, but on the other hand, they would
Page 129
complicate the model by increasing the numbers of parameters.
With respect to the optimum pH for mesophiles and thermophiles, it has similar result
with temperature, which is 6.43 for mesophiles and 8.20 for thermophiles. It is
interesting to argue as to, whether thermophilic microorganisms, which are named by
their optimum temperature, have an optimum pH? It has been found that, except some
for a few acidothermophiles which live in sulfur-rich regions such as volcanoes, the
majority of thermophiles have an optimum pH in the alkaline range (Madigan et al.,
2006). This is also coherent with this study. Lower pH limits for mesophilic and
thermophilic microorganism activity are 3.57 and 3.60, respectively. Lower optimum
pH for mesophiles implies it has better adaptability to an acidic environment during
the initial stage of composting.
Advantages of cross-validation can be reflected when comparing the Sum of Squared
Error (SSE) among Solutions i to viii. Solution viii is obtained by conducting
regression using all six runs without the cross-validation process. The average SSE of
Solutions i to vi is demonstrated on Equation (10).
±SSEiSSE,,,, = 5 =5.39x10"
• (10)
The reason that average SSE is obtained from the total SSE in six runs divided by 5 is
every data has been used 5 times as validation data. The average SSE is close to the
SSE of Solution viii obtained without the cross-validation process. However,
113
complicate the model by increasing the numbers of parameters.
With respect to the optimum pH for mesophiles and thermophiles, it has similar result
with temperature, which is 6.43 for mesophiles and 8.20 for thermophiles. It is
interesting to argue as to, whether thermophilic microorganisms, which are named by
their optimum temperature, have an optimum pH? It has been found that, except some
for a few acidothermophiles which live in sulfur-rich regions such as volcanoes, the
majority of thermophiles have an optimum pH in the alkaline range (Madigan et al.,
2006). This is also coherent with this study. Lower pH limits for mesophilic and
thermophilic microorganism activity are 3.57 and 3.60, respectively. Lower optimum
pH for mesophiles implies it has better adaptability to an acidic environment during
the initial stage of composting.
Advantages of cross-validation can be reflected when comparing the Sum of Squared
Error (SSE) among Solutions i to viii. Solution viii is obtained by conducting
regression using all six runs without the cross-validation process. The average SSE of
Solutions i to vi is demonstrated on Equation (10).
ilSSE, =•& = 5.39x10-"
5 (10)
The reason that average SSE is obtained from the total SSE in six runs divided by 5 is
every data has been used 5 times as validation data. The average SSE is close to the
SSE of Solution viii obtained without the cross-validation process. However,
113
Page 130
coefficients in solution vii, which is averaged from the previous six runs under
cross-validation, decrease SSE to 4.44x10⁴ (around a 20% improvement). A
reasonable explanation would be that the real values of the kinetics parameters are in
the range formed by the previous six solutions so that the averaged parameters would
be closer to the real parameters.
5.4 Test of Model Performance
The fitting curves of the degradation rate are drawn using the obtained two-term
Monod model. Figure 5.3 show an agreement between the experimental data and the
simulation results in the degradation rate from Runs El to G2. The most obvious
feature in our experiment is the two peaks in Runs El, E2, F1 and F2, which might be
caused by the recovery of mesophilic activity when easily degradable nutrients were
depleted and the temperature dropped slightly. As for Runs G1 and G2, external
heating maintained temperatures between 50 °C to 60 °C. The second peak of the
degradation rate is not observed and the degradation rate decreased smoothly after it
reached the maximum value on Day 14.
Mesophilic and thermophlic reaction rates for six runs are clearly depicted
respectively in Figure 5.4 (from El to G2). In the beginning, mesophilic activity
accounted for a major portion of the overall reaction rate because the system's
temperature was close to the optimum mesophilic temperature. As the temperature
increased, thermophilic microorganisms were activated and played a predominant role
114
coefficients in solution vii, which is averaged from the previous six runs under
cross-validation, decrease SSE to 4.44x10"4 (around a 20% improvement). A
reasonable explanation would be that the real values of the kinetics parameters are in
the range formed by the previous six solutions so that the averaged parameters would
be closer to the real parameters.
5.4 Test of Model Performance
The fitting curves of the degradation rate are drawn using the obtained two-term
Monod model. Figure 5.3 show an agreement between the experimental data and the
simulation results in the degradation rate from Runs El to G2. The most obvious
feature in our experiment is the two peaks in Rims El, E2, F1 and F2, which might be
caused by the recovery of mesophilic activity when easily degradable nutrients were
depleted and the temperature dropped slightly. As for Runs G1 and G2, external
heating maintained temperatures between 50 °C to 60 °C. The second peak of the
degradation rate is not observed and the degradation rate decreased smoothly after it
reached the maximum value on Day 14.
Mesophilic and thermophlic reaction rates for six runs are clearly depicted
respectively in Figure 5.4 (from El to G2). In the beginning, mesophilic activity
accounted for a major portion of the overall reaction rate because the system's
temperature was close to the optimum mesophilic temperature. As the temperature
increased, thermophilic microorganisms were activated and played a predominant role
114
Page 131
Run El 0.03
0 5 10 15 20 25
Time (day)
Figure 5.3a Degradation rate profiles by model prediction
and experiment measurement for Run El
115
30
Run El 0.03
Prodded Observed
« 0.02
•a
0
0 5 10 15 20 25 30
Time (day)
Figure 5.3a Degradation rate profiles by model prediction
and experiment measurement for Run El
115
Page 132
Run E2 0.03
.:-.N
41 2 0.02 es L.. a 0 = se ..o at
CZ at 41 0.01
0 5 10 15 20
Time (day)
Figure 5.3b Degradation rate profiles by model prediction
and experiment measurement for Run E2
116
25
Run E2 0.03
Predicted Observed
0.02
0.01
09
J 0.02 2 a o S8 •o A
J 0.01
-r 10 15 20 25
Time (day)
Figure 5.3b Degradation rate profiles by model prediction
and experiment measurement for Run E2
116
Page 133
Run Fl 0.03
—6— Predicted —NE— Observed
is' Ts 0.02
es i.. a o t= es ..es es Id
0
OA 41) 0.01
0 5 10 15 20 25 30
Time (day)
Figure 5.3c Degradation rate profiles by model prediction
and experiment measurement for Run Fl
117
Run F1 0.03
Predicted Observed
J 0.02
J; 0.01
25 0
30 10 15 20 0 5
Time (day)
Figure 5.3c Degradation rate profiles by model prediction
and experiment measurement for Run F1
117
Page 134
Run F2 0.03
—40— Predicted —NE— Observed
0 5 10 15 20 Time (day)
Figure 5.3d Degradation rate profiles by model prediction
and experiment measurement for Run F2
118
25 30
Run F2 0.03
Predicted —Observed
g 0.02
2 0.01
0
0 5 10 15 20 25 30 Time (day)
Figure 5.3d Degradation rate profiles by model prediction
and experiment measurement for Run F2
118
Page 135
Run G1 0.03
4",-• c, Sh es 0.02
.1
0 o = es 1 0.01 6 bs) A'
0 5 10 15 20 25
Time (day)
Figure 5.3e Degradation rate profiles by model prediction
and experiment measurement for Run G1
119
30
Run G1
Predicted hk-Observed
Time (day)
Figure 5.3e Degradation rate profiles by model prediction
and experiment measurement for Run G1
119
Page 136
Run G2 0.03
—•— Predicted -4—Observed
0 5 10 15 20 25 30
Time (day)
Figure 5.3f Degradation rate profiles by model prediction
and experiment measurement for Run G2
120
Run G2 0.03
Predicted Observed
£ 0.02 -
1 0.01 OA
0 5 10 20 15 25 30
Time (day)
Figure 5.3f Degradation rate profiles by model prediction
and experiment measurement for Run G2
120
Page 137
Run El
0 5 10 15 20 25
Time (day)
Figure 5.4a Temporal variations of mesophilic
and thermophilic degradation rate for Run El
121
30
Run El 0.03
Pre-thenmo
•t0.02
S0.01
oo
0
0 5 10 15 20 25 30
Time (day)
Figure 5.4a Temporal variations of mesophilic
and thermophilic degradation rate for Run El
121
Page 138
Run E2
0 5 10 15
Time (day)
20
Figure 5.4b Temporal variations of mesophilic
and thermophilic degradation rate for Run E2
122
25
Run E2 0.03
Pre-thermo -o-Pre-meso
T 0.02
0
0 5 10 15 20 25
Time (day)
Figure 5.4b Temporal variations of mesophiiic
and thermophilic degradation rate for Run E2
122
Page 139
Run Fl
0.03
4-. 0.02 a .a
E.
0 6- et
0 5 10 15 20 25
Time (day)
Figure 5.4c Temporal variations of mesophilic
and thermophilic degradation rate for Run Fl
30
Run F1 0.03
Pro-thermo -o-Pre-meso
"L.0.02
OA
0
15 20 25 30 0 5 10
Time (day)
Figure 5.4c Temporal variations of mesophilic
and thermophilic degradation rate for Run F1
4
123
Page 140
Run F2
0 5 10 15 20 25
Time (day)
Figure 5.4d Temporal variations of mesophilic
and thermophilic degradation rate for Run F2
124
30
Run F2 0.03
Pre-thermo -o-Pre-meso
0.02 •a
30.01
0
20 25 30 10 15 0 5
Time (day)
Figure 5.4d Temporal variations of mesophilic
and thermophilic degradation rate for Run F2
124
Page 141
Run G1
0 5 10 15 20 25
Time (day)
Figure 5.4e Temporal variations of mesophilic
and thermophilic degradation rate for Run G1
125
30
Run G1
0.03
Pre-thermo -o-Pre-meso
0.02 -
§0.01
20 25 30 10 15 0 5
Time (day)
Figure 5.4e Temporal variations of mesophilic
and thermophilic degradation rate for Run G1
125
Page 142
Run G2
0 5 10 15 20 25
Time (day)
Figure 5.4f Temporal variations of mesophilic
and thermophilic degradation rate for Run G2
126
30
Run G2 0.03
Pi»4henno -o-Pre-meso
£0.02
€ 0.01
0
10 20 25 30 0 5 15
Time (day)
Figure 5.4f Temporal variations of mesophilic
and thermophilic degradation rate for Run G2
126
Page 143
in the degradation in the thermophilic stage. After Day 15, mesophilic activity was
significantly prompted from 0.05 day' to above 0.1 day', again in Runs El to F2. On
the contrary, this phenomenon was not observed in Runs G1 and G2 under heating
conditions and the mesophilic rate was kept around 0.005 day'. All the analyses
demonstrate the significance of adopting the two-term Monod equation to depict
mesophilic and thermophilic activity respectively.
Table 5.2 records the coefficient of determination for all
parameters from Solution vii (R2). In non-linear regression,
original definition in Equation (11):
Ecy, so2 -- sS m.• 1— -- r =1 '
SS wi E (Y
where y, is the observed value under ith observation,
six runs based on the
R2 is calculated by its
(5.11)
is the mean observed data
and 5,, is the fitted value corresponding to y, . R2 varied from 0.66 to 0.87 in the six
runs, which implies the model is fitted well with the observed data.
Figure 5.5 is normal probability plots for residues for the six runs (from El to G2). In
These figures, basically all the plots form a straight line, except for one extreme low
value in Runs El and E2 individually. This phenomenon reveals good applicability of
the proposed model, although some plots deviate slightly from the straight line
(Montgomery, 2001). In Run GI, the distribution of residues is light tailed when
compared with normal distribution, which implied that residues are concise to their
127
in the degradation in the thermophilic stage. After Day 15, mesophilic activity was
significantly prompted from 0.05 day"1 to above 0.1 day"1, again in Runs El to F2. On
the contrary, this phenomenon was not observed in Runs G1 and G2 under heating
conditions and the mesophilic rate was kept around 0.005 day"1. All the analyses
demonstrate the significance of adopting the two-term Monod equation to depict
mesophilic and thermophilic activity respectively.
Table 5.2 records the coefficient of determination for all six runs based on the
parameters from Solution vii (R2). In non-linear regression, R2 is calculated by its
original definition in Equation (11):
w ZO'.-j,)2
= (5.11) ss„ ICk,-*)2
i
where y, is the observed value under ith observation, y, is the mean observed data
and y, is the fitted value corresponding to y,. R2 varied from 0.66 to 0.87 in the six
runs, which implies the model is fitted well with the observed data.
Figure 5.5 is normal probability plots for residues for the six runs (from El to G2). In
These figures, basically all the plots form a straight line, except for one extreme low
value in Runs El and E2 individually. This phenomenon reveals good applicability of
the proposed model, although some plots deviate slightly from the straight line
(Montgomery, 2001). In Run Gl, the distribution of residues is light tailed when
compared with normal distribution, which implied that residues are concise to their
127
Page 144
Table 5.2 Coefficients of determination values for six runs using cross-validation results.
Solution vii Run Al Run A2 Run B1 Run B2 Run Cl Run C2
R2 0.87 0.66 0.86 0.84 0.68 0.79
128
Table 5.2 CoeflBcients of determination values for six runs using cross-validation results.
Solution vii RunAl Run A2 RunBl RunB2 Run CI RunC2
R2 0.87 0.66 0.86 0.84 0.68 0.79
128
Page 145
Normal order statistic medians
Figure 5.5a Normal probability plot of residues
in modified Monod equation (Run El)
129
0.01
a 2 8 o.oo
£ "2 o
-0.01
0.00 0.20 0.40 0.60
Normal order statistic medians
0.80 1.00
Figure 5.5a Normal probability plot of residues
in modified Monod equation (Run El)
129
Page 146
0.01
-0.01
(E2)
•
•
• • •
0.00 0.20 0.40 0.60 0.80
Normal order statistic medians
Figure 5.5b Normal probability plot of residues
in modified Monod equation (Run E2)
130
1.00
0.01
L i L. 4> "E o
-0.01 0.00 0.20 0.40 0.60 0.80
Normal order statistic medians
1.00
Figure 5.5b Normal probability plot of residues
in modified Monod equation (Run E2)
130
Page 147
0.20 0.40 0.60 0.80
Normal order statistic medians
Figure 5.5c Normal probability plot of residues
in modified Monod equation (Run Fl)
131
1.00 0.00 0.20 0.40 0.60 0.80
Normal order statistic medians
1.00
Figure 5.5c Normal probability plot of residues
in modified Monod equation (Run Fl)
131
Page 148
0.01
o.00
0
-0.01
On)
* * * * #
0.00 0.20 0.40 0.60 0.80
Normal order statistic medians
Figure 5.5d Normal probability plot of residues
in modified Monod equation (Run F2)
132
1.00 0.00 0.20 0.40 0.60 0.80
Normal order statistic medians
1.00
Figure 5.5d Normal probability plot of residues
in modified Monod equation (Run F2)
132
Page 149
0.01
I 0.00 in
-0.01 0.00
(G1)
• * • * $ •
• *
•
•
0.20 0.40 0.60 0.80 Normal order statistic medians
Figure 5.5e Normal probability plot of residues
in modified Monod equation (Run G1)
133
1.00 0.00 0.20 0.40 0.60 0.80 Normal order statistic medians
Figure 5.5e Normal probability plot of residues
in modified Monod equation (Run Gl)
1.00
133
Page 150
0.01 (G2)
0
-0.01 0.00 0.20 0.40 0.60 0.80
Normal order statistic medians
Figure 5.5f Normal probability plot of residues
in modified Monod equation (Run G2)
134
1.00
0.01
4> 3
'O
i
i fc. •H
o.oo -
-0.01 0.00 0.20 0.40 0.60 0.80 1.00
Normal order statistic medians
Figure 5.5f Normal probability plot of residues
in modified Monod equation (Run G2)
134
Page 151
mean value with a relatively small variance. In Run F2, the distribution of residues
skews to the right when compared with normal distributions, which means the left
side of the distribution is light tailed while the right side is heavy tailed.
Figure 5.6 shows the relationships between the measured and observed degradation
rates for the six runs (from El to G2). Clearly, this two-term Monod equation can
predict the degradation rate quite successfully.
5.5 Discussion
5.5.1 Comparison with Original Monod Function
A comparison between the original and the modified Monod models' predictive
capacity can be found in Table 3.4. Solution ix contains kinetics parameters and
correction factors based on the original one-term Monod function. When compared
with solution vii without the cross-validation procedure, it is reasonable that •usurer
T optsingk and (PH)opiaingie fall between the interval of those parameters for
thermophilic and mesophilic. This is due to the one-term Monod function which only
accounts for the integrated effects of both types of microorganisms. The SSE from the
one-term Monod function (0.00178) is significantly larger than the value from
solution viii (0.00047) according to the modified two-term function proposed in this
paper. Simulated results from the original one-term Monod function are compared
with the observed degradation rate profiles for the six runs in Figure 5.7. The
135
mean value with a relatively small variance. In Run F2, the distribution of residues
skews to the right when compared with normal distributions, which means the left
side of the distribution is light tailed while the right side is heavy tailed.
Figure 5.6 shows the relationships between the measured and observed degradation
rates for the six runs (from El to G2). Clearly, this two-term Monod equation can
predict the degradation rate quite successfully.
5.5 Discussion
5.5.1 Comparison with Original Monod Function
A comparison between the original and the modified Monod models' predictive
capacity can be found in Table 3.4. Solution ix contains kinetics parameters and
correction factors based on the original one-term Monod function. When compared
with solution vii without the cross-validation procedure, it is reasonable that M)ingie >
Topumgie an<* (pH)op,Mngie foU between the interval of those parameters for
thermophilic and mesophilic. This is due to the one-term Monod function which only
accounts for the integrated effects of both types of microorganisms. The SSE from the
one-term Monod function (0.00178) is significantly larger than the value from
solution viii (0.00047) according to the modified two-term function proposed in this
paper. Simulated results from the original one-term Monod function are compared
with the observed degradation rate profiles for the six runs in Figure 5.7. The
135
Page 152
0.03
X
0.01 0.02
Observed degradation rate (day-1)
Figure 5.6a Comparison between predicted
and observed degradation rate (Run E1)
136
0.03
0.03
X X
X. X
X
0.00 0.01 0.02
Observed degradation rate (day*1) 0.03
Figure 5.6a Comparison between predicted
and observed degradation rate (Run El)
136
Page 153
0.03 (E2)
x 0.00 X
0.00
X
X
X
X
0.01 0.02 0.03
Observed degradation rate (day')
Figure 5.6b Comparison between predicted
and observed degradation rate (Run E2)
137
0.03 (E2)
•o
« 0.02 -
0.01
0.00 0.02 0.03 0.00 0.01
Observed degradation rate (day1)
Figure 5.6b Comparison between predicted
and observed degradation rate (Run E2)
137
Page 154
Observed degradation rate (day')
Figure 5.6c Comparison between predicted
and observed degradation rate (Run Fl)
138
0.03 (Fl)
0.01
XX
0.00 0.00 0.01 0.02
Observed degradation rate (day1)
0.03
Figure 5.6c Comparison between predicted
and observed degradation rate (Run Fl)
138
Page 155
0.03
0.00 0.00 0.01 0.02
Observed degradation rate (day-1)
Figure 5.6d Comparison between predicted
and observed degradation rate (Run F2)
139
0.03
0.03
0.00 0.00 0.01 0.02
Observed degradation rate (day1)
Figure 5.6d Comparison between predicted
and observed degradation rate (Run F2)
0.03
139
Page 156
Observed degradation rate (day-1)
Figure 5.6e Comparison between predicted
and observed degradation rate (Run G1)
140
0.00 *-*-0.00 0.01 0.02
Observed degradation rate (day1)
0.03
Figure 5.6e Comparison between predicted
and observed degradation rate (Run Gl)
140
Page 157
Pre
dict
ed d
egra
dati
on r
ate
(day
s)
0.03
0.02
0.01
0.01 0.02
Observed degradation rate (day')
Figure 5.6f Comparison between predicted
and observed degradation rate (Run G2)
141
0.03 0.00 0.01 0.02 0.03
Observed degradation rate (day1)
Figure 5.6f Comparison between predicted
and observed degradation rate (Run G2)
141
Page 158
Run El
0.03
,-, -",0.02 41
4... 0 1. 0 0
41) 0.01 es I.
A
0 5 10 15 20 Time (day)
25
Figure 5.7a Degradation rate profiles by original Monod model
prediction and experiment measurement for Run El
142
30
Run £1 0.03
Predicted original
Observed
1*0.02
30.01
0
0 5 10 15 20 25 30 Time (day)
Figure 5.7a Degradation rate profiles by original Monod model
prediction and experiment measurement for Run El
142
Page 159
Run E2
0 5 10 15 20
Time (day)
Figure 5.7b Degradation rate profiles by original Monod model
prediction and experiment measurement for Run E2
143
25
Run E2 0.03
Pretfctad original
Observed
0.02
0
20 0 5 10 15 25
Time (day)
Figure 5.7b Degradation rate profiles by original Monod model
prediction and experiment measurement for Run E2
143
Page 160
Run Fl
Time (day)
Figure 5.7c Degradation rate profiles by original Monod model
prediction and experiment measurement for Run Fl
144
Run F1 0.03
Predicted original
Observed
a 0.02
5 0.01 u ©JO
25 0
30 0 5 10 15 20
Time (day)
Figure 5.7c Degradation rate profiles by original Monod model
prediction and experiment measurement for Run F1
144
Page 161
Run F2
0.03
0 5 10 15 20 25
Time (day)
Figure 5.7d Degradation rate profiles by original Monod model
prediction and experiment measurement for Run F2
145
30
Run F2
Predicted cxiginal
Time (day)
Figure 5.7d Degradation rate profiles by original Monod model
prediction and experiment measurement for Run F2
145
Page 162
Run G1
0 5 10 15 20 25
Time (day)
Figure 5.7e Degradation rate profiles by original Monod model
prediction and experiment measurement for Run GI
146
30
Run G1 0.03
Predicted original
Observed
2 0.02
5 0.01 eo
0
0 5 10 15 20 25 30
Time (day)
Figure 5.7e Degradation rate profiles by original Monod model
prediction and experiment measurement for Run G1
146
Page 163
Run G2
0 5 10 15 20 25
Time (day)
Figure 5.7f Degradation rate profiles by original Monod model
prediction and experiment measurement for Run G2
147
30
Run G2 0.03
-•-Predicted original
Observed
2 0.02
3 0.01
0
30 10 15 20 25 0 5
Time (day)
Figure 5.7f Degradation rate profiles by original Monod model
prediction and experiment measurement for Run G2
147
Page 164
simulation data deviates from the observed value significantly. Normally, the profile
with two peaks cannot be obtained, which is due to the limitation of original the
Monod function. Thus, it can be concluded the modified two-term Monod equation is
preferred over the original Monod model to simulate the composting system because
it is not only better fitted with observed data but is also able to provide maximum
degradation rate, an optimum temperature and pH for mesophilic and thermophilic
microorganisms, separately.
5.5.2 Environmental Factors of Microorganism Growth
Sm1rs pointed out microbial respiration in composting reactors was seriously
inhibited if the temperature increased while the substrate was still acidic (Snuirs et al.,
2002). But few studied have been conducted to quantitatively investigate the
interaction between pH and temperature. The combined effects of pH and temperature
can be analyzed using a product of two correlation factors under the premise that the
effects of temperature and pH are independent with each other. For example, two
typical environment conditions at the initial stage when organic acid is produced are
considered herein: i), lower pH with higher temperature (pH=5, temperature=50 °C)
and ii), and higher pH with lower temperature (pH=6, temperature=40 °C). The
multiplied mesophilic and thermophilic correction factors under two conditions are:
0.68 and 0.56 under condition i and 0.98 and 0.71 under condition ii. It is obvious that
both types of microorganisms are inhibited under condition i. According to condition
148
simulation data deviates from the observed value significantly. Normally, the profile
with two peaks cannot be obtained, which is due to the limitation of original the
Monod function. Thus, it can be concluded the modified two-term Monod equation is
preferred over the original Monod model to simulate the composting system because
it is not only better fitted with observed data but is also able to provide maximum
degradation rate, an optimum temperature and pH for mesophilic and thermophilic
microorganisms, separately.
5.5.2 Environmental Factors of Microorganism Growth
Sm&rs pointed out microbial respiration in composting reactors was seriously
inhibited if the temperature increased while the substrate was still acidic (Sm&rs et al.,
2002). But few studied have been conducted to quantitatively investigate the
interaction between pH and temperature. The combined effects of pH and temperature
can be analyzed using a product of two correlation factors under the premise that the
effects of temperature and pH are independent with each other. For example, two
typical environment conditions at the initial stage when organic acid is produced are
considered herein: i), lower pH with higher temperature (pH=5, temperature=50 °C)
and ii), and higher pH with lower temperature (pH=6, temperature=40 °C). The
multiplied mesophilic and thermophilic correction factors under two conditions are:
0.68 and 0.56 under condition i and 0.98 and 0.71 under condition ii. It is obvious that
both types of microorganisms are inhibited under condition i. According to condition
148
Page 165
ii to condition i, mesophilic activity decreased by 31% but thermophilic activity only
dropped by 21%. Because of the low activity for mesophiles, the time it takes the
composting system to shift to the thermophilic stage is delayed, which is called the
"lag phase". It can be concluded that sufficient ventilation for cooling is critical to in
order to avoid the lag phase when organic acid is produced in the initial stage (Smirs
et al., 2002). On the other hand, thermophilic correction factors for temperature and
pH are: 0.89 and 0.79 under condition i along with 0.99 and 0.56 under condition ii.
This proves that thermophiles are more sensitive to the change in pH than to a change
in temperature. In other words, inhibition of low pH to thermophiles would be
dominant even though the temperature is close to its optimum range. All the results
above can be used to test the following hypothesis: microorganisms can only
withstand one extreme environmental factor, high temperature or low pH, but not both
simultaneously (Deacon, 1997). Last but not the least, it must be realized that
estimations of correction factors and their combinations are not very precise because:
1) interactions of pH, temperature and other factors exist in composting systems in
order to affect the performance of two types of microorganisms; 2) the quadratic form
is a rough approximation to evaluate the effects of temperature and pH.
5.6 Summary
In this section, a two-term modified Monod model has been proposed to
quantitatively depict the effects of temperature and pH on microorganism growth
simultaneously during the composting process. Six runs of food waste composting
149
ii to condition i, mesophilic activity decreased by 31% but thermophilic activity only
dropped by 21%. Because of the low activity for mesophiles, the time it takes the
composting system to shift to the thermophilic stage is delayed, which is called the
"lag phase". It can be concluded that sufficient ventilation for cooling is critical to in
order to avoid the lag phase when organic acid is produced in the initial stage (Sm&rs
et al., 2002). On the other hand, thermophilic correction factors for temperature and
pH are: 0.89 and 0.79 under condition i along with 0.99 and 0.56 under condition ii.
This proves that thermophiles are more sensitive to the change in pH than to a change
in temperature. In other words, inhibition of low pH to thermophiles would be
dominant even though the temperature is close to its optimum range. All the results
above can be used to test the following hypothesis: microorganisms can only
withstand one extreme environmental factor, high temperature or low pH, but not both
simultaneously (Deacon, 1997). Last but not the least, it must be realized that
estimations of correction factors and their combinations are not very precise because:
1) interactions of pH, temperature and other factors exist in composting systems in
order to affect the performance of two types of microorganisms; 2) the quadratic form
is a rough approximation to evaluate the effects of temperature and pH.
5.6 Summary
In this section, a two-term modified Monod model has been proposed to
quantitatively depict the effects of temperature and pH on microorganism growth
simultaneously during the composting process. Six runs of food waste composting
149
Page 166
reaction through bench-scale reactors in a laboratory were constructed to demonstrate
the performance of the proposed model. The effects of the addition of water and
external heating were considered. The observed data has been used to validate the
proposed model by employing nonlinear regression method with cross-validation to
reduce errors. The results indicate coefficients of determination in the six runs vary
from 0.65-0.87, which reflects a good performance of the proposed model. When
compared with the original Monod function, the modified function exhibits its
superiority in both a smaller SSE value and more information being provided
regarding mesophiles and thermophiles, respectively. The optimum temperature for
mesophiles and thermophiles, in this study, is 41 °C and 52 °C, and the optimum pH is
6.2 and 8.2 for mesophiles and thermophiles, respectively, which are close to
well-accepted mesophilic temperature (around 35 °C) and thennophilic temperature
(around 55 °C).
150
reaction through bench-scale reactors in a laboratory were constructed to demonstrate
the performance of the proposed model. The effects of the addition of water and
external heating were considered. The observed data has been used to validate the
proposed model by employing nonlinear regression method with cross-validation to
reduce errors. The results indicate coefficients of determination in the six runs vary
from 0.65-0.87, which reflects a good performance of the proposed model. When
compared with the original Monod function, the modified function exhibits its
superiority in both a smaller SSE value and more information being provided
regarding mesophiles and thermophiles, respectively. The optimum temperature for
mesophiles and thermophiles, in this study, is 41 °C and 52 °C, and the optimum pH is
6.2 and 8.2 for mesophiles and thermophiles, respectively, which are close to
well-accepted mesophilic temperature (around 35 °C) and thermophilic temperature
(around 55 °C).
150
Page 167
CHAPTER 6
CONCLUSIONS
6.1 Summary
In this thesis research, ten runs of bench-scale in-vessel food-waste composting
experiments were operated with the objective of investigating the effects of
buffer salts, temperature and pH on composting process. Meanwhile, a
modified two-term Monod equation was proposed to quantify the growth of
mesophiles and thermophiles simultaneously.
The first part of this research was to compare the effects of three types of buffer
salts (K2HPO4/MgSO4, KH2PO4/MgSO4 and NaAc) with different initial pH.
Temperature, pH, percentage of organic matter degradation, 0 2 uptake and NH3
emission were examined in this study. The results indicated that alkaline
additives (K2HPO4/MgSO4 and NaAc) could alleviate the negative influence of
organic acids in the initial stage, but would emit more ammonia, in
comparision, acidic amendment (KH2PO4/MgSO4) could hold more ammonia
in the system but would inhibit microorganism activity. Moreover, produced
Mg2+ and P043" could form struvite to prevent the ammonia from releasing.
Thus, K2HPO4/MgSO4 and proved to be the best buffer agent because it could
transfer more organic nitrogen into an inorganic form so as to retain more
nitrogen in the system.
151
CHAPTER 6
CONCLUSIONS
6.1 Summary
In this thesis research, ten runs of bench-scale in-vessel food-waste composting
experiments were operated with the objective of investigating the effects of
buffer salts, temperature and pH on composting process. Meanwhile, a
modified two-term Monod equation was proposed to quantify the growth of
mesophiles and thermophiles simultaneously.
The first part of this research was to compare the effects of three types of buffer
salts (K2HP04/MgS04, KH2P04/MgS04 and NaAc) with different initial pH.
Temperature, pH, percentage of organic matter degradation, 02 uptake and NH3
emission were examined in this study. The results indicated that alkaline
additives (K2HP04/MgS04 and NaAc) could alleviate the negative influence of
organic acids in the initial stage, but would emit more ammonia, in
comparision, acidic amendment (KH2P04/MgS04) could hold more ammonia
in the system but would inhibit microorganism activity. Moreover, produced
Mg2+ and PO43" could form struvite to prevent the ammonia from releasing.
Thus, K2HP04/MgS04 and proved to be the best buffer agent because it could
transfer more organic nitrogen into an inorganic form so as to retain more
nitrogen in the system.
151
Page 168
The second part considered modification of the original Monod equation. A
modified two-term Monod equation was proposed to analyze the growth of
mesophiles and thermophiles, simultaneously. The effects of temperature and
pH were also taken into consideration. Unlike the original Monod equation
which provides an overall degradation rate and the half-saturation constant, the
new model could predict the parameters for both mesophiles and thermophiles.
The simulation results fitted well with the observed data, with coefficients of
determination being around 0.7. Thermophiles had a higher maximum
degradation rate (13.47 day"') than mesophiles, which implied thermophiles
played a major role during the investigated composting experiments. The
optimum temperature for mesophiles and thennophiles was 41 °C and 52 °C, and the
optimum pH was 6.2 and 8.2 for mesophiles and thermophiles respectively. Both
types of microorganisms would be inhibited under a low-pH, high-temperature
environment. However, thermophiles were more sensitive in the pH change, which
caused the lag phase during the initial stage of composting.
6.2 Contributions
This thesis provides experimental and modeling analyses regarding the effects
of buffer salts, temperature and pH on food waste composting processes. The
study produces the following achievements from the engineering perspective:
152
The second part considered modification of the original Monod equation. A
modified two-term Monod equation was proposed to analyze the growth of
mesophiles and thermophiles, simultaneously. The effects of temperature and
pH were also taken into consideration. Unlike the original Monod equation
which provides an overall degradation rate and the half-saturation constant, the
new model could predict the parameters for both mesophiles and thermophiles.
The simulation results fitted well with the observed data, with coefficients of
determination being around 0.7. Thermophiles had a higher maximum
degradation rate (13.47 day"1) than mesophiles, which implied thermophiles
played a major role during the investigated composting experiments. The
optimum temperature for mesophiles and thermophiles was 41 °C and 52 °C, and the
optimum pH was 6.2 and 8.2 for mesophiles and thermophiles respectively. Both
types of microorganisms would be inhibited under a low-pH, high-temperature
environment. However, thermophiles were more sensitive in the pH change, which
caused the lag phase during the initial stage of composting.
6.2 Contributions
This thesis provides experimental and modeling analyses regarding the effects
of buffer salts, temperature and pH on food waste composting processes. The
study produces the following achievements from the engineering perspective:
152
Page 169
(i) Interactions between organic production in the initial stage and ammonia
release in the alkaline stage were investigated under different pH
conditions. A comprehensive understanding is helpful in selecting
pH-control amendments.
(ii) Three buffer salts with different initial pH were compared. K2HPO4/MgSO4
was selected as the best buffer salt based on an examination of nitrogen
transformation in the system.
(iii)The original Monod equation was modified into a two-term form, which
took into consideration the activity of mesophiles and thermophiles,
separately. Nonlinear regression and cross-validation were used to find
accurate parameters.
(iv) The effects of temperature and pH in mesophiles and thermophiles were
studied. The reasoning behind the lag phase was established based on the
model results.
The results of this research will benefit composting industry, end-users and
academic researchers in various aspects: the optimum temperature and pH for
mesophiles and thermophiles obtained in Chapter 5 will facilitate the process
control in composting plant; buffer salts have their potential to be employed in
153
(i) Interactions between organic production in the initial stage and ammonia
release in the alkaline stage were investigated under different pH
conditions. A comprehensive understanding is helpful in selecting
pH-control amendments.
(ii) Three buffer salts with different initial pH were compared. K2HP04/MgS04
was selected as the best buffer salt based on an examination of nitrogen
transformation in the system.
(iii)The original Monod equation was modified into a two-term form, which
took into consideration the activity of mesophiles and thermophiles,
separately. Nonlinear regression and cross-validation were used to find
accurate parameters.
(iv)The effects of temperature and pH in mesophiles and thermophiles were
studied. The reasoning behind the lag phase was established based on the
model results.
The results of this research will benefit composting industry, end-users and
academic researchers in various aspects: the optimum temperature and pH for
mesophiles and thermophiles obtained in Chapter 5 will facilitate the process
control in composting plant; buffer salts have their potential to be employed in
153
Page 170
industry; the substrate ratio and the experiment set-up will guide the people
who want to conduct composting in their gardens or yards; the data obtained in
this study is also a precious reference for other researchers who focus on
composting.
63 Recommendations for Future Studies
(i) In this study, the population of microorganisms was examined via the
colony counting method, which mainly focused upon bacteria. It is desired
that advanced equipment can be used to detect not only the amount of
bacteria, but also the amounts of fungi and actinomyces in an accurate and
straightforward manner. In that case, a more comprehensive analysis of
composting microbiology can be provided, which in turn could benefit both
experimental and modeling work.
(ii) Three types of buffer agents are investigated in this study. Alkaline buffer
salts were proven to function but with less efficiency. In future studies,
different types of buffer agents (e.g. organic acids) can be considered. The
manipulation of the C/N ratio may also be a feasible way to avoid organic
acids production and ammonia emission.
(iii) In the developed kinetics model, temperature and pH are considered as two
state variables. It is desired that more factors such as moisture content and
154
industry; the substrate ratio and the experiment set-up will guide the people
who want to conduct composting in their gardens or yards; the data obtained in
this study is also a precious reference for other researchers who focus on
composting.
6.3 Recommendations for Future Studies
(i) In this study, the population of microorganisms was examined via the
colony counting method, which mainly focused upon bacteria. It is desired
that advanced equipment can be used to detect not only the amount of
bacteria, but also the amounts of fungi and actinomyces in an accurate and
straightforward manner. In that case, a more comprehensive analysis of
composting microbiology can be provided, which in turn could benefit both
experimental and modeling work.
(ii) Three types of buffer agents are investigated in this study. Alkaline buffer
salts were proven to function but with less efficiency. In future studies,
different types of buffer agents (e.g. organic acids) can be considered. The
manipulation of the C/N ratio may also be a feasible way to avoid organic
acids production and ammonia emission.
(iii) In the developed kinetics model, temperature and pH are considered as two
state variables. It is desired that more factors such as moisture content and
154
Page 171
C/N ratio be involved to create a more applicable model. The
multi-dimensional interactions among these parameters could be
investigated. The empirical expression for the correction coefficients in the
model could be improved through additional experimental work, which
could bring about a more accurate prediction model.
155
Page 172
REFERENCE
Abu Qdais H. A., and Hamoda M. F. (2004) Enhancement of carbon and nitrogen
transformations during composting of municipal solid waste. Journal of
Environmental Science and Health Part A-Toxic/Hazardous substance &
environmental engineering, A39(2), 409-420.
Albert J. E., Hernandez M., and Soto Y. (2002) Process and structural upgrades -
improving a state-of-the-art composting facility. Biocycle, 43(5), 40-42.
An K. (2006). Amendment for pH control in food-waste composting. University of
Regina,
Antler S. (2000). Composting Grows Stronger.
Atlas R. M., and Bartha R. (1998). Microbial Ecology: fundamentals and applications:
Menlo Park,.
Bach D. B., Shoda M., and Kubota H. (1985) Composting reaction rate of sewage
sludge in an autothermal packed bed reactor. Journal of fermentation
technolog, 63(3), 271-278.
Baker J. M., and Allmaras R. R. (1990) System for automating and multiplexing soil
moisture measurement by time-domain reflectometry. Soil science society of
America journal, 54, 1-6.
Bakshi M., Gupta V. K., and Langar P. N. (1987) Effect of moisture level on the
chemical composition and nutritive value of fermented straw. Biological wasts,
21, 283-290.
156
REFERENCE
Abu Qdais H. A., and Hamoda M. F. (2004) Enhancement of carbon and nitrogen
transformations during composting of municipal solid waste. Journal of
Environmental Science and Health Part A-Toxic/Hazardous substance &
environmental engineering, A39(2), 409-420.
Albert J. E., Hernandez M., and Soto Y. (2002) Process and structural upgrades -
improving a state-of-the-art composting facility. Biocycle, 43(5), 40-42.
An K. (2006). Amendment for pH control in food-waste composting. University of
Regina,
Antler S. (2000). Composting Grows Stronger.
Atlas R. M., and Bartha R. (1998). Microbial Ecology: fundamentals and applications:
Menlo Park,.
Bach D. B., Shoda M., and Kubota H. (1985) Composting reaction rate of sewage
sludge in an autothermal packed bed reactor. Journal of fermentation
technolog, 63(3), 271-278.
Baker J. M., and Allmaras R. R. (1990) System for automating and multiplexing soil
moisture measurement by time-domain reflectometry. Soil science society of
America journal, 54,1-6.
Bakshi M., Gupta V. K., and Langar P. N. (1987) Effect of moisture level on the
chemical composition and nutritive value of fermented straw. Biological wasts,
21,283-290.
Page 173
Baptista M., Antunes F., Gonsalves M. S., Morvan B., and Silveira A. (2010)
Composting kinetics in full-scale mechanical-biological treatment plants.
Waste Management, 30(10), 1908-1921.
Barakzai A., and Mengel K. (1993) Effect of microbial decomposition of mature
leaves on soil-pH. Zeitschrift Fur Pflanzenernahrung Und Bodenkunde, 156(1),
93-94.
Ban Q. H., and Koening A. (2001) Effect of air recirculation and reuse on
compostging of organic solid waste. Resources, Conservation and Recycling,
33(2), 93-111.
Beck-Friis B., SmArs S., Jonsson H., Eklind Y., and Kirchmann H. (2003) Composting
of source-separated household organics at different oxygen levels: gaining an
understanding of the emission dynamics. Compost Science and Utilization.,
11(1), 41-50.
Beck-Friis B., Smars S., Jonsson H., and Kirchmann H. (2001) SE—structures and
environment: gaseous emissions of carbon dioxide, ammonia and nitrous
oxide from organic household waste in a compost reactor under different
temperature regimes. Journal of Agricultural Engineering Research, 78(4),
423-430.
Beck M. B. (1979). Model structure identification from experimental data. In E.
Halfon (Ed.), Theoretical Systems Ecology: advances and case studies (pp.
259-298). London: Academic press.
Beck M. B. (1984). Understanding environmental systems. In J. Grassman, & G.
157
Baptista M., Antunes F., Gon^alves M. S., Morvan B., and Silveira A. (2010)
Composting kinetics in full-scale mechanical-biological treatment plants.
Waste Management, 30(10), 1908-1921.
Barakzai A., and Mengel K. (1993) Effect of microbial decomposition of mature
leaves on soil-pH. Zeitschrift Fur Pflanzenemahrung Und Bodenkunde, 156(1),
93-94.
Bari Q. H., and Koening A. (2001) Effect of air recirculation and reuse on
compostging of organic solid waste. Resources, Conservation and Recycling,
33(2), 93-111.
Beck-Friis B., Smars S., Jonsson H., Eklind Y., and Kirchmann H. (2003) Composting
of source-separated household organics at different oxygen levels: gaining an
understanding of the emission dynamics. Compost Science and Utilization.,
11(1), 41-50.
Beck-Friis B., Sm&rs S., Jonsson H., and Kirchmann H. (2001) SE—structures and
environment: gaseous emissions of carbon dioxide, ammonia and nitrous
oxide from organic household waste in a compost reactor under different
temperature regimes. Journal of Agricultural Engineering Research, 78(4),
423-430.
Beck M. B. (1979). Model structure identification from experimental data. In E.
Halfon (Ed.), Theoretical Systems Ecology: advances and case studies (pp.
259-298). London: Academic press.
Beck M. B, (1984). Understanding environmental systems. In J. Grassman, & G.
157
Page 174
Straten (Eds.), Predictability and nonlinear modeling in natural sciences and
economics (pp. 294-311). Kluwer: Kluwer Academic Pulishers.
Bemal M. P., Navarro A. F., Roig A., Cegarra J., and Garcia D. (1996) Carbon and
nitrogen transformation during composting sweet sorghum bagasse. Biology
and Fertility of Soils, 22(1-2), 141-148.
Bhunia P., and Ghangrekar M. M. (2008) Analysis, evaluation, and optimization of
kinetic parameters for performance appraisal and design of UASB reactors.
Bioresource Technology, 99(7), 2132-2140.
Bishop P. L., and Godfrey C. (1983) Nitrogen transformation during sludge
composting. Biocycle, 24, 34-39.
Black C. A. (Ed.). (1965). methods of soil analysis, part 1, physical and mineralogical
properties. Madison: American Society of Agronomy.
Bodelier P. L., and Laanbroek H. J. (1997) Oxygen uptake kinetics of pseudomonas
chlororaphis grown in glucose- or glatamate- limited continuous cultures.
Archives microbiology, 167, 392-395.
Boltze U., and de Freitas M. H. (1997) Monitoring gas emissions from landfill sites.
Waste Management and Research, 15(5), 463-476.
Borja R., Martin A., Banks C. J., Alonso V., and Chica A. (1995) A kinetic study of
anaerobic digestion of olive mill wastewater at mesophilic and thermophilic
temperatures. Environmental Pollution, 88(1), 13-18.
Brewer L. J. (2001). Maturity and stability evaluation of composted yard debris.,
Oregon State University, Corvallis.
158
Straten (Eds.), Predictability and nonlinear modeling in natural sciences and
economics (pp. 294-311). Kluwer: Kluwer Academic Pulishers.
Bernal M. P., Navarro A. F., Roig A., Cegarra J., and Garcia D. (1996) Carbon and
nitrogen transformation during composting sweet sorghum bagasse. Biology
and Fertility of Soils, 22(1-2), 141-148.
Bhunia P., and Ghangrekar M. M. (2008) Analysis, evaluation, and optimization of
kinetic parameters for performance appraisal and design of UASB reactors.
Bioresource Technology, 99(7), 2132-2140.
Bishop P. L., and Godfrey C. (1983) Nitrogen transformation during sludge
composting. Biocycle, 24, 34-39.
Black C. A. (Ed.). (1965). methods of soil analysis, part 1, physical and mineralogical
properties. Madison: American Society of Agronomy.
Bodelier P. L., and Laanbroek H. J. (1997) Oxygen uptake kinetics of pseudomonas
chlororaphis grown in glucose- or glatamate- limited continuous cultures.
Archives microbiology, 167, 392-395.
Boltze U., and de Freitas M. H. (1997) Monitoring gas emissions from landfill sites.
Waste Management and Research, 15(5), 463-476.
Boija R., Martin A., Banks C. J., Alonso V., and Chica A. (1995) A kinetic study of
anaerobic digestion of olive mill wastewater at mesophilic and thermophilic
temperatures. Environmental Pollution, 88(1), 13-18.
Brewer L. J. (2001). Maturity and stability evaluation of composted yard debris.,
Oregon State University, Corvallis.
158
Page 175
Brink N. (1995) Composting of Food Waste with Straw and other Carbon Sources for
Nitrogen Catching. Acta Agriculturae Scandinavica, Section B - Soil & Plant
Science, 45(2), 118-123.
Brinton W. F. (1998) Volatile organic acids in compost: production and odorant
aspects. Compost Science and Utilization, 6(1), 75-82.
Buchannan M., and Gliessman S. R. (1991) How compost fertilization affects
soil-nitrogen and crop yield. Biocycle, 32(12), 72-76.
Campbell A. G., Folk R. L., and Tripepi R. R. (1997) Wood ash as an amendment in
municipal sludge and yard waste composting process. Compost Science and
Utilization, 5(1), 62-73.
Campbell J. E. (1990) Dielectric properties and influence of conductivity in soils at
one to fifty megahertz. Soil science society of America journal, 54, 332-341.
Castillo A., Ilabres P., and Mata-Alvarez J. (1999) A kinetic study of a combined
anaerobic-aerobic system for treatment of domestic sewage. Water Research,
33(7), 1742-1747.
Cathcart T. P., Wheaton E W., and Brinsfield R. B. (1986) Optimizing variables
affecting composting of blue-crab scrap. Agricultural Waters, 15(4), 269-287.
Cekmecelioglu D. (2004). Fate of pathogenic microorganisms in food waste
composting. The pennsylvania state university, Pennsylvania.
Chang J. I., Tsai J. J., and Wu K. H. (2006) Thermophilic composting of food waste.
Bioresource Technology, 97(1), 116-122.
Characklis W. G., and Gujer W. (1979) Temperature dependency of microbial
159
Brink N. (1995) Composting of Food Waste with Straw and other Carbon Sources for
Nitrogen Catching. Acta Agriculturae Scandinavica, Section B - Soil & Plant
Science, 45(2), 118-123.
Brinton W. F. (1998) Volatile organic acids in compost: production and odorant
aspects. Compost Science and Utilization, 6(1), 75-82.
Buchannan M., and Gliessman S. R. (1991) How compost fertilization affects
soil-nitrogen and crop yield. Biocycle, 32(12), 72-76.
Campbell A. G., Folk R. L., and Tripepi R. R. (1997) Wood ash as an amendment in
municipal sludge and yard waste composting process. Compost Science and
Utilization, 5(1), 62-73.
Campbell J. E. (1990) Dielectric properties and influence of conductivity in soils at
one to fifty megahertz. Soil science society of America journal, 54, 332-341.
Castillo A., llabres R, and Mata-Alvarez J. (1999) A kinetic study of a combined
anaerobic-aerobic system for treatment of domestic sewage. Water Research,
33(7), 1742-1747.
Cathcart T. R, Wheaton F. W., and Brinsfield R. B. (1986) Optimizing variables
affecting composting of blue-crab scrap. Agricultural Waters, 15(4), 269-287.
Cekmecelioglu D. (2004). Fate of pathogenic microorganisms in food waste
composting. The Pennsylvania state university, Pennsylvania.
Chang J. I., Tsai J. J., and Wu K. H. (2006) Thermophilic composting of food waste.
Bioresource Technology, 97(1), 116-122.
Characklis W. G., and Gujer W. (1979) Temperature dependency of microbial
159
Page 176
reactions. Progress water technology supply, 1, 111-130.
Cheung H. (2008). Bacterial Growth Inhibition During Composting of Food Waste:
Effects of Organic Acids. University of Regina,
Choi M. H., and Park Y. H. (1998) The inflence of yeast on thermophilic composting
of food waste. Letters in applied microbiology, 26, 175-178.
Conghos M. M., Aguirre M. E., and Santamaria R. M. (2003) Biodegradation of
sunflower hulls with different nitrogen sources under mesophilic and
thermophilic incubations. Biology and Fertility of Soils, 38(5), 282-287.
Cooney C. L., and Wise D. L. (1975) Therrnophilic anaerobic digestion of solid waste
for fuel gas production. Biotechnology and Bioengineering, 17, 1119-1135.
Czepiel P., Douglas E., Harriss R., and Call P. (1996) Measurements of N20 from
composted organic wastes. Environmental Science & Technology, 30,
2519-2525.
Das K. C., and Keener H. M. (1996). Process control based on dynamic properties in
composting: moisture and compaction considerations. In M. Debertoldi, B.
Lemmes, & T. Papi (Eds.), The science of composting (pp. 116-125). London:
Mackie Academic and professional.
Das K. C., Tolhier E. W., and Eiteman M. A. (2003) Comparison of synthetic and
natural bulking agents in food waste composting. Compost Science &
Utilization, 11(1), 27-35.
Day M., Krzymien M., SHaw K., Zaremba L., Wilson W. R., Botden C., et al. (1998)
An investigation of the chemical and physical changes occuring during
160
reactions. Progress water technology supply, 1,111 -130.
Cheung H. (2008). Bacterial Growth Inhibition During Composting of Food Waste:
Effects of Organic Acids. University of Regina,
Choi M. H., and Parte Y. H. (1998) The inflence of yeast on thermophilic composting
of food waste. Letters in applied microbiology, 26, 175-178.
Conghos M. M., Aguirre M. E., and Santamaria R. M. (2003) Biodegradation of
sunflower hulls with different nitrogen sources under mesophilic and
thermophilic incubations. Biology and Fertility of Soils, 38(5), 282-287.
Cooney C. L., and Wise D. L. (1975) Thermophilic anaerobic digestion of solid waste
for fuel gas production. Biotechnology and Bioengineering, 17, 1119-1135.
Czepiel P., Douglas E., Harriss R., and Call P. (1996) Measurements of N20 from
composted organic wastes. Environmental Science & Technology, 30,
2519-2525.
Das K. C., and Keener H. M. (1996). Process control based on dynamic properties in
composting: moisture and compaction considerations. In M. Debertoldi, B.
Lemmes, & T. Papi (Eds.), The science of composting (pp. 116-125). London:
Blackie Academic and professional.
Das K. C., Tollner E. W., and Eiteman M. A. (2003) Comparison of synthetic and
natural bulking agents in food waste composting. Compost Science &
Utilization, 11(1), 27-35.
Day M., Krzymien M., SHaw K., Zaremba L., Wilson W. R., Botden C., et al. (1998)
An investigation of the chemical and physical changes occuring during
160
Page 177
commercial. Compost Science and Utilization, 6, 44-66.
de Bertoldi M., Citernesi U., and Gricelli M. (1980) Bulking agents in sludge
composting. COmpost science and land utilization, 21(1), 32-35.
de Bertoldi M., Vallini G., and Pera A. (1983) The biology of composting. Waste
Management and Research, 1, 157-176.
de Bertoldi M., Vallini G., and Zucconi F. (1985). technological aspects of composting
including modelling and microbiology. In Composting of agricultural and
other wastes. London: Elsevier applied science publishers.
Deacon J. W. (1997). Modern mycology (Vol. 7): Wiley-Blackwell.
deBertoldi M., Rutili A., Citterio B., and Civilini M. (1988) composting management
a new process control through 02 feedback. Waste Management and Research,
6, 239-259.
Deniz C. (2004). Fate of pathogenic microorgisms in food waste composting. the
Pennsylvania State University,
Derikx P. J. L., Camp H. J. M. 0. D., Drift C. V. D., Griensven L. J. L. D. V., and
vogel G. D. (1990) Biomass and biological activity during the production of
compos used as a substrate in the mushroom cultivation. Applied and
Environmental Microbiology, 56, 3029-3034.
Dirksen C., and Dasberg S. (1993) Improved calibration of time domain reflectometry
soil water content measurements. Soil science society of America journal,
57(258-264)
Donahue D. W., Chalmers J. A., and Storey J. A. (1998) Evaluation of in-vessel
161
commercial. Compost Science and Utilization, 6,44-66.
de Bertoldi M., Citernesi U., and Gricelli M. (1980) Bulking agents in sludge
composting. COmpost science and land utilization, 21(1), 32-35.
de Bertoldi M., Vallini G., and Pera A. (1983) The biology of composting. Waste
Management and Research, 1,157-176.
de Bertoldi M., Vallini G., and Zucconi F. (1985). technological aspects of composting
including modelling and microbiology. In Composting of agricultural and
other wastes. London: Elsevier applied science publishers.
Deacon J. W. (1997). Modern mycology (Vol. 7): Wiley-Blackwell.
deBertoldi M., Rutili A., Citterio B., and Civilini M. (1988) composting management
a new process control through 02 feedback. Waste Management and Research,
6, 239-259.
Deniz C. (2004). Fate of pathogenic microorgisms in food waste composting, the
Pennsylvania State University,
Derikx P. J. L., Camp H. J. M. O. D., Drift C. V. D., Griensven L. J. L. D. V., and
vogel G. D. (1990) Biomass and biological activity during the production of
compos used as a substrate in the mushroom cultivation. Applied and
Environmental Microbiology, 56, 3029-3034.
Dirksen C., and Dasberg S. (1993) Improved calibration of time domain reflectometry
soil water content measurements. Soil science society of America journal,
57(258-264)
Donahue D. W,, Chalmers J. A., and Storey J. A. (1998) Evaluation of in-vessel
Page 178
composting of university postconsumer food wastes. Compost Science &
Utilization, 6(2), 75-81.
Droffiner M. L., and Brinton W F. (1995) Survival of E. coli and Salmonella
population in aerobic thermophilic composts as measured with DNA gene
probes. Zentralbl Hygiene, 197, 387-397.
Edwards D. R., and Daniel T. C. (1992) Environmental impacts of on-farm poultry
waste disposal, a review. Bioresource Technology, 41(1), 9-33.
Ekinci K. (2001). Theoretical and experimental studies on the effects of aeration
strategies on the composting process., the Ohio State University, Columbus.
Ekinci K., Keener H., and Elwell D. (2000) Composting Short Paper Fiber with
Broiler Litter and Additives Part I: Effects of Initial pH and Carbon/Nitrogen
Ratio On Ammonia Emission. Compost Science & Utilization, 8(2), 167-172.
Eklind Y., and Kirchmann H. (2000) Composting and storage of organic household
waste with different litter amendments. H: nitrogen turnover and losses.
Bioresource Technology, 74(2), 125-133.
Elwell D. L., Keener H. M., and Hansen R. C. (1996) Controlled high rate composting
of mixtures of food residuals, yard trimmings and chicken manure. Compost
Science & Utilization, 4(1), 6-15.
Erickson L. E., and Fung D. Y. C. (1988). Handbook on anaerobic fermentations. New
York.
Fang M., and Wong J. W. C. (1999) Effects of lime amendment on availability of
heavy metals and maturation in sewage sludge composting. Environmental
162
composting of university postconsumer food wastes. Compost Science &
Utilization, 6(2), 75-81.
Droffiner M. L., and Brinton W. F. (1995) Survival of E. coli and Salmonella
population in aerobic thermophilic composts as measured with DNA gene
probes. Zentralbl Hygiene, 197, 387-397.
Edwards D. R., and Daniel T. C. (1992) Environmental impacts of on-farm poultry
waste disposal, a review. Bioresource Technology, 41(1), 9-33.
Ekinci K. (2001). Theoretical and experimental studies on the effects of aeration
strategies on the composting process., the Ohio State University, Columbus.
Ekinci K., Keener H., and Elwell D. (2000) Composting Short Paper Fiber with
Broiler Litter and Additives Part I: Effects of Initial pH and Carbon/Nitrogen
Ratio On Ammonia Emission. Compost Science & Utilization, 8(2), 167-172.
Eklind Y., and Kirchmann H. (2000) Composting and storage of organic household
waste with different litter amendments. II: nitrogen turnover and losses.
Bioresource Technology, 74(2), 125-133.
Elwell D. L., Keener H. M., and Hansen R. C. (1996) Controlled high rate composting
of mixtures of food residuals, yard trimmings and chicken manure. Compost
Science & Utilization, 4(1), 6-15.
Erickson L. E., and Fung D. Y. C. (1988). Handbook on anaerobic fermentations. New
York.
Fang M., and Wong J. W. C. (1999) Effects of lime amendment on availability of
heavy metals and maturation in sewage sludge composting. Environmental
162
Page 179
Pollution, 106(83-89)
Fang M., Wong J. W. C., Ma K. K., and Wong M. H. (1999) Co-composting of
sewage sludge and coal fly ash: nutrient transformations. Bioresource
Technology, 67(1), 19-24.
Faucette B., Das K. C., and Risse M. (2001) University tests in-vessel composting of
food residuals. Biocycle, 42(1), 68-70.
Filippi C., Bedini s., Levi-Minzi R., Cardelli R., and Saviozzi A. (2002)
Cocomposting of olive oil mill by-products: chemical and microbiological
evaluations. Compost Science & Utilization, 10(1), 63-71.
Finger S. M., Hatch R. T., and Regan T. M. (1976) Aerobic microbial growth in
semisolid matrices: heat and mass transfer limitation. . Biotechnology and
Bioengineering, 18, 1193-1218.
Finstein M. S., and Hogan J. A. Integration of composting process microbiology,
facility structure and decision-making. In Proceeding of the international
composting research symposium, 1992: Renaissance publications
Finstein M. S., and Moths M. L. (1975) Microbiology of Municipal Solid Waste
Composting. Applied Microbiology, 19, 113-151.
Fogarty A. M., and Tuovinen 0. H. (1991) Microbiological degradation of pestcides
in yard waste composting. Microbiological reviews, 55(2), 225-233.
Fromme W. R. (1999). Characterization of changes occurring in natural organic
matter during the composting of a synthetic compost and a municipal solid
waste. University of Cincinnati, Cincinnati.
163
Pollution, 106(83-89)
Fang M., Wong J. W. C., Ma K. K., and Wong M. H. (1999) Co-composting of
sewage sludge and coal fly ash: nutrient transformations. Bioresource
Technology, 67(1), 19-24.
Faucette B., Das K. C., and Risse M. (2001) University tests in-vessel composting of
food residuals. Biocycle, 42(1), 68-70.
Filippi C., Bedini s., Levi-Minzi R., Cardelli R., and Saviozzi A. (2002)
Cocomposting of olive oil mill by-products: chemical and microbiological
evaluations. Compost Science & Utilization, 10(1), 63-71.
Finger S. M., Hatch R. T., and Regan T. M. (1976) Aerobic microbial growth in
semisolid matrices: heat and mass transfer limitation. . Biotechnology and
Bioengineering, 18, 1193-1218.
Finstein M. S., and Hogan J. A. Integration of composting process microbiology,
facility structure and decision-making. In Proceeding of the international
composting research symposium, 1992: Renaissance publications
Finstein M. S., and Morris M. L. (1975) Microbiology of Municipal Solid Waste
Composting. Applied Microbiology, 19, 113-151.
Fogarty A. M., and Tuovinen O. H. (1991) Microbiological degradation of pestcides
in yard waste composting. Microbiological reviews, 55(2), 225-233.
Fromme W. R. (1999). Characterization of changes occurring in natural organic
matter during the composting of a synthetic compost and a municipal solid
waste. University of Cincinnati, Cincinnati.
Page 180
Fu Z. (2004). A Fuzzy Inference System for Synthetic Evaluation of Compost
Maturity and Stability University of regina,
Garcia C., Hernandez T., and Costa F. (1992) crop growth impact composted vs
uncomposted organics. Biocycle, 33(11), 70-72.
Gellens V., Boelens J., and Verstraete W. (1995) Source separation, selective
collection and in reactor digestion of biowaste. Antonie van Leeuwenhoek, 67,
79-89.
Genevini P., Adani F., and Villa C. (1997) Rich hull degradation by co-composting
with dairy cattle slurry. Soil science and plant nutrition, 43(1), 135-147.
Godden B. (1983) Evolution of enzyme activities and microbial populations during
composting of cattle manure. European journal of applied microbiology and
biotechnology, 17, 306-310.
Golueke C. (1977). Biological Reclamation of Solid Wastes. Emmaus, Pennsylvania:
Rodale Press.
Golueke C. G. (1973). Composting: a study of the process and its principles. Emmaus:
Rodale Press.
Gray K. R., Sherman K., and Biddlestone A. J. (1971) A Review of Composting - Part
1. Process Biochemistry, 6, 32-36.
Groenestein C. M., and Van Faassen H. G. (1996) Volatilization of Ammonia, Nitrous
Oxide and Nitric Oxide in Deep-litter Systems for Fattening Pigs. Journal of
Agricultural Engineering Research, 65(4), 269-274.
Haga K. (1998) Animal waste problems and their solution from the technological
164
Page 181
point of view in Japan. Jarq-Japan agricultural research quarterly, 32(3),
203-210.
Hall S. C. (1998). Temperature feedback and control via aeration rate regulation in
biological composting systems., Cornell University, Ithaca.
Hamelers H. V. M. (2001). A mathematical model for composting kinetics.
Wageningen University, Wageningen.
Hanajima D., Kuroda K., and Haga K. (2001) Enhancement of the thermophilic stage
in cattle waste composting by addition of tofu residue. Bioresource
Technology, 78(2), 213-216.
Hansen R. C., Keener H. M., Marugg C., Dick C. A., and Hoitink H. A. J. (1992).
Composting of poultry manure. In H. A. J. Hoitink (Ed.), Science and
engineering of composting: design, environmental, microbiological and
utilization aspects, ed.
(pp. 131-153). Columbus: Renaissance Publications.
Hansen R. C., Keener H. M., Marugg C., Dick W. A., and Hoitink H. A. J. (1993).
Composting of poultry manure. In The science and engineering of
composting. Wooster: Ohio agricultural research and development center.
Hashimoto A. G. (1983) Conversion of straw—manure mixtures to methane at
mesophilic and thermophilic temperatures. Biotechnology and Bioengineering,
25(1), 185-200.
Haug R. T. (1980). Compost engineering: principles and practice. Ann Arbor: Ann
Arbor Science.
165
point of view in Japan. Jarq-Japan agricultural research quarterly, 32(3),
203-210.
Hall S. C. (1998). Temperature feedback and control via aeration rate regulation in
biological composting systems., Cornell University, Ithaca.
Hamelers H. V. M. (2001). A mathematical model for composting kinetics.
Wageningen University, Wageningen.
Hanajima D., Kuroda K., and Haga K. (2001) Enhancement of the thermophilic stage
in cattle waste composting by addition of tofii residue. Bioresource
Technology, 78(2), 213-216.
Hansen R. C., Keener H. M., Marugg C., Dick C. A., and Hoitink H. A. J. (1992).
Composting of poultry manure. In H. A. J. Hoitink (Ed.), Science and
engineering of composting: design, environmental, microbiological and
utilization aspects, ed.
(pp. 131-153). Columbus: Renaissance Publications.
Hansen R. C„ Keener H. M., Marugg C., Dick W. A., and Hoitink H. A. J. (1993).
Composting of poultry manure. In The science and engineering of
composting. Wooster: Ohio agricultural research and development center.
Hashimoto A. G. (1983) Conversion of straw-manure mixtures to methane at
mesophilic and thermophilic temperatures. Biotechnology and Bioengineering,
25(1), 185-200.
Haug R. T. (1980). Compost engineering: principles and practice. Ann Arbor: Ann
Arbor Science.
165
Page 182
Haug R. T. (1986) Composting process design criteria part I: feed conditioning.
Biocycle, 27, 38-43.
Haug R. T. (1993). The practical handbook of compost engineering. In (pp.
385-436). Boca Raton: Lewis Publishers.
Haug R. T. (1996). Composting plant design and process management. In M.
Debertoldi, P. Sequi, B. Lemmes, & T. Papi (Eds.), The science of composting
(pp. 60-70). London: Blackie Academic and Professional.
Hauhs M. (1996) Summary of a workshop on ecosystem modeling: the end of an era.
The science of the total environment, 183(1-2), 1-5.
Heijnen J. J., and Roele J. A. (1981) A macroscopoc model describing yield and
maintanance relationship in aerobic fermentation processes. Biotechnology
and Bioengineering, 23, 739-763.
Hellebrand H. J. (1998) Emission of nitrous oxide and other trace gases during
composting of grass and green waste. Journal of Agricultural Engineering
Research, 69, 365-375.
Henis Y. (1987). Survival and Dormancy of microorganisms. New York: John Wiley
& Sons Inc.
Herrmann R. F., and Shann J. F. (1997) Microbial community changes during the
composting of municipal solid waste. Microbial Ecology, 33(1), 78-85.
Hoitink H. A. J., and Keener H. M. (1993). Science and engineering of composting:
design, environmental microbiological and utilization aspects. Columbus:
Renaissance publications.
166
Haug R. T. (1986) Composting process design criteria part I: feed conditioning.
Biocycle, 27, 38-43.
Haug R. T. (1993). The practical handbook of compost engineering. In (pp.
385-436). Boca Raton: Lewis Publishers.
Haug R. T. (1996). Composting plant design and process management. In M.
Debertoldi, R Sequi, B. Lemmes, & T. Papi (Eds.), The science of composting
(pp. 60-70). London: Blackie Academic and Professional.
Hauhs M. (1996) Summary of a workshop on ecosystem modeling: the end of an era.
The science of the total environment, 183(1-2), 1-5.
Heijnen J. J., and Roele J. A. (1981) A macroscopoc model describing yield and
maintanance relationship in aerobic fermentation processes. Biotechnology
and Bioengineering, 23, 739-763.
Hellebrand H. J. (1998) Emission of nitrous oxide and other trace gases during
composting of grass and green waste. Journal of Agricultural Engineering
Research, 69, 365-375.
Henis Y. (1987). Survival and Dormancy of microorganisms. New York: John Wiley
& Sons Inc.
Herrmann R. F., and Shann J. F. (1997) Microbial community changes during the
composting of municipal solid waste. Microbial Ecology, 33(1), 78-85.
Hoitink H. A. J., and Keener H. M. (1993). Science and engineering of composting:
design, environmental microbiological and utilization aspects. Columbus:
Renaissance publications.
166
Page 183
Hu T.-J., Zeng G.-M., Huang D.-L., Yu H.-Y., Jiang X.-Y., Dai F., et al. (2007) Use of
potassium dihydrogen phosphate and sawdust as adsorbents of ammoniacal
nitrogen in aerobic composting process. Journal of Hazardous Materials,
141(3), 736-744.
Huang G. F., Wong J. W. C., Wu Q. T., and Nagar B. B. (2004) Effect of C/N on
composting of pig manure with sawdust. Waste Management, 24, 805-813.
Iannotti D. A., Grebus M. E., Toth B. L., Madden L. V., and Hoitink H. A. J. Oxygen
Respirometry to Assess Stability and Maturity of Composted Municipal Solid
Waste. J. Environ. Qual., 23(6), 1177-1183.
Inbar Y. (1990) New approaches to compost maturity. Biocycle, 31, 64-69.
Iriarte M. L., and Ciria P. (2001) Performance characteristics of three aeration systems
in the composting of sheep manure and straw. Journal of Agricultural
Engineering Research, 79(3), 317-330.
Isik M., and Sponza D. T. (2005) Substrate removal kinetics in an upflow anaerobic
sludge blanket reactor decolorising simulated textile wastewater. Process
Biochemistry, 40(3-4), 1189-1198.
Jacobowitz L. A., and Steenhuis T. S. (1984) Compost impact on soil moisture and
temperature. Biocycle, 25(56-60)
Jeong Y. K., and Hwang S. J. (2005) Optimum doses of Mg and P salts for
precipitating ammonia into struvite crystals in aerobic composting.
Bioresource Technology, 96(1), 1-6.
Jeong Y. K., and Kim J. .S. (2001) A new method for conservation of nitrogen in
167
Hu T.-J., Zeng G.-M., Huang D.-L., Yu H.-Y., Jiang X.-Y., Dai F., et al. (2007) Use of
potassium dihydrogen phosphate and sawdust as adsorbents of ammoniacal
nitrogen in aerobic composting process. Journal of Hazardous Materials,
141(3), 736-744.
Huang G. F., Wong J. W. C., Wu Q. T., and Nagar B. B. (2004) Effect of C/N on
composting of pig manure with sawdust. Waste Management, 24, 805-813.
Iannotti D. A., Grebus M. E., Toth B. L., Madden L. V., and Hoitink H. A. J. Oxygen
Respirometry to Assess Stability and Maturity of Composted Municipal Solid
Waste. J. Environ. Qual., 23(6), 1177-1183.
Inbar Y. (1990) New approaches to compost maturity. Biocycle, 31, 64-69.
Iriarte M. L., and Ciria P. (2001) Performance characteristics of three aeration systems
in the composting of sheep manure and straw. Journal of Agricultural
Engineering Research, 79(3), 317-330.
Isik M., and Sponza D. T. (2005) Substrate removal kinetics in an upflow anaerobic
sludge blanket reactor decolorising simulated textile wastewater. Process
Biochemistry, 40(3-4), 1189-1198.
Jacobowitz L. A., and Steenhuis T. S. (1984) Compost impact on soil moisture and
temperature. Biocycle, 25(56-60)
Jeong Y. K., and Hwang S. J. (2005) Optimum doses of Mg and P salts for
precipitating ammonia into struvite crystals in aerobic composting.
Bioresource Technology, 96(1), 1-6.
Jeong Y. K., and Kim J. .S. (2001) A .new method for conservation of nitrogen in
167
Page 184
aerobic composting processes. Bioresource Technology, 79(2), 129-133.
Jeris J. S., and Regan R. W. (1973a) Controlling environmental parameters for
optimum composting (I): experimental procedures and temperature. Compost
science, 14(1), 10-15.
Jeris J. S., and Regan R. W. (1973b) Controlling environmental parameters for
optimum composting (II): moisture, free air space and recycle. Compost
science, 14(2), 8-15.
Jeris J. S., and Regan R. W. (1973c) Controlling environmental parameters for
optimum composting (III). Compost science, 14(3), 16-22.
Johannessen G. S., James C. E., Allison H. E., Smith D. L., Saunders J. R., and
Mccarthy A. J. (2005) Survival of a shiga toxin-incoding bacteriophage in a
compost model. FEMs micobiology letters, 245(2), 369-377.
Joshua R. S., Macauley B. J., and Mitchell H. J. (1998) Characterization of
temperature and oxygen profiles in widrow processing systems. Compost
Science & Utilization, 6(4), 15-28.
Kayragian M., and Tchobanogious G. (1992) Computation of C/N ratios for various
organic fractions. Biocycle, 33(5), 58-60.
Keeney D. R., and Nelson D. W. (Eds.). (1982). Nitrogen-inorganic forms. Methods
of soil analysis, Part 2, Chemial and microbiological properties. Madison: Soil
Science Society of America.
Kirchmann H., and Widen P. (1994) Separately collected organic household wastes:
chemical composition and composting characteristics. Swedish . journal
168
aerobic composting processes. Bioresource Technology, 79(2), 129-133.
Jeris J. S., and Regan R. W. (1973a) Controlling environmental parameters for
optimum composting (I): experimental procedures and temperature. Compost
science, 14(1), 10-15.
Jeris J. S., and Regan R. W. (1973b) Controlling environmental parameters for
optimum composting (II): moisture, free air space and recycle. Compost
science, 14(2), 8-15.
Jeris J. S., and Regan R. W. (1973c) Controlling environmental parameters for
optimum composting (III). Compost science, 14(3), 16-22.
Johannessen G. S., James C. E., Allison H. E., Smith D. L., Saunders J. R., and
Mccarthy A. J. (2005) Survival of a shiga toxin-incoding bacteriophage in a
compost model. FEMs micobiology letters, 245(2), 369-377.
Joshua R. S., Macauley B. J., and Mitchell H. J. (1998) Characterization of
temperature and oxygen profiles in widrow processing systems. Compost
Science & Utilization, 6(4), 15-28.
Kayragian M., and Tchobanogjous G. (1992) Computation of C/N ratios for various
organic fractions. Biocycle, 33(5), 58-60.
Keeney D. R., and Nelson D. W. (Eds.). (1982). Nitrogen-inorganic forms. Methods
of soil analysis, Part 2, Chemial and microbiological properties. Madison: Soil
Science Society of America.
Kirchmann H., and Widen P. (1994) Separately collected organic household wastes:
chemical composition and composting characteristics. Swedish journal
168
Page 185
agricultural research, 24, 3-12.
Kirchmann H., and Witter E. (1989) Ammonia volatilization during aerobic and
anaerobic manure decomposition. Plant and Soil, 115, 35-41.
Kishimoto M., Preechaphan C., Yoshida T., and Taguchi H. (1987) Simulation of an
aerobic composting of activated sludge using a statistical procedure.
MICRCEN journal of applied microbiology and biotechnology, 3, 113-124.
Kjeldsen P., and Fischer E. V. (1995) Landfill gas migration-field investigations at
Skellingsted landfill, Denmark. Waste Management and Research, 13(5),
467-484.
Klamer M., and Bath E. (1998) Microbial community dynamics during composting
of straw material studied using phospholipid fatty acid analysis. Ferns
microbiology ecology, 27(1), 9-20.
Koivula N., Raikkonen T., Urpilainen S., Ranta J., and Hanninen K. (2004) Ash in
composting of source-separated catering waste. Bioresource Technology, 93(3),
291-299.
Kubota H., and Kakasaki K. (1991) Accelerated thermophilic composting of garbage.
Biocycle, 6, 66-68.
Kwon S.-H., and Lee D.-H. (2004) Evaluation of Korean food waste composting with
fed-batch operations II: using properties of exhaust gas condensate. Process
Biochemistry, 39(9), 1047-1055.
Laos F., Mazzarino M. J., Walter I., and Roselli L. (1998) Composting of fish waste
with wood by-products and testing compost quality as a soil amendment:
169
agricultural research, 24, 3-12.
Kirchmann H., and Witter E. (1989) Ammonia volatilization during aerobic and
anaerobic manure decomposition. Plant and Soil, 115, 35-41.
Kishimoto M., Preechaphan C., Yoshida T., and Taguchi H. (1987) Simulation of an
aerobic composting of activated sludge using a statistical procedure.
MICRCEN journal of applied microbiology and biotechnology, 3,113-124.
Kjeldsen P., and Fischer E. V. (1995) Landfill gas migration-field investigations at
Skellingsted landfill, Denmark. Waste Management and Research, 13(5),
467-484.
Klamer M., and BMth E. (1998) Microbial community dynamics during composting
of straw material studied using phospholipid fatty acid analysis. Fems
microbiology ecology, 27(1), 9-20.
Koivula N., Raikkonen T., Urpilainen S., Ranta J., and Hanninen K. (2004) Ash in
composting of source-separated catering waste. Bioresource Technology, 93(3),
291-299.
Kubota H., and Kakasaki K. (1991) Accelerated thermophilic composting of garbage.
Biocycle, 6, 66-68.
Kwon S.-H., and Lee D.-H. (2004) Evaluation of Korean food waste composting with
fed-batch operations II: using properties of exhaust gas condensate. Process
Biochemistry, 39(9), 1047-1055.
Laos F., Mazzarino M. J., Walter I., and Roselli L. (1998) Composting of fish waste
with wood by-products and testing compost quality as a soil amendment:
169
Page 186
experiences in the Patagonia Region of Argentina. Compost Science &
Utilization, 6(1), 59-66.
Lei F., and Vander-Gheynst J. S. (2000) The effect of microbial inoculation and pH on
microbial community structure changes during composting. Process
Biochemistry, 35(9), 923-929.
Lester J. N., and Birkett J. W. (1999). Microbiology and chemistry for environmental
scientist and engineers. In (pp. 184-185). New York: E & FN SPON.
Li Y., Du X. Y., Liu J. L., and Huang G. H. (2010) Formation of Struvite Crystals in a
Simulated Food Waste Aerobic Composting Process. Chemical Research in
Chinese Universities, 26(2), 210-216.
Liang C., Das K. C., and McClendon R. W. (2003) The influence of temperature
andmoisture contents regimes on the aerobic microbial activity of a biosolids
composting blend. Bioresource Technology, 86, 131-137.
Liang Y., Leonard J. J., Feddes J. J. R., and McGill W. B. (2006) Influence of carbon
and buffer amendment on ammonia volatilization in composting. Bioresource
Technology, 97(5), 748-761.
Lin Y. (2006). Simulation Modeling and Process Control of Composting Systems
under Complexity and Uncertainty. University of Regina,
Lineweaver H., and Burk D. (1934) The determination of enzyme dissociation
constants. Journal of the American Chemical Society, 56(3), 658-666.
Ljung L., and Glad T. (1994). Modeling of dynamic systems. New Jersy: Prentice
Hall.
170
Page 187
Lyles S. T. (1969). Biology of microorganisms. St. Louis: The C. V. Mosby Co.
MacGregor S. T., Miller F. C., Psarianos K. M., and Finstein M. S. (1981)
Composting process control based on interaction between microbial heat
output and temperature. Applied and Environmental Microbiology, 41(6),
1321-1330.
Madigan M. T., Martinko J. M., Stahl D. A., and Clark D. P. (2006). Brock biology of
microorganisms. In (11 ed., pp. 136): Pearson College Div.
Mahimairaja S., Bolan N. S., Hedley M. J., and Macgregor A. N. (1994) Losses and
transformation of nitrogen during composting of poultry manure with different
amendments-An incubation experiment. Bioresource Technology, 47(3),
265-273.
Marugg C. (1993) A kinetic model of the yard waste composting process. Compost
Science and Utilization, 1(1), 38-51.
Mathur S. P. (1991). Composting process. In Bioconversion of waste materials to
industrial products. New York.
McDonnell E. M. (1993). Evaluation of the Metricor refractive index probe with
fiberoptic cable in simple food systems (Vol. x, 97 leaves).
McDonnell E. M. (1999). Process characterization, and stability and maturity testing
of forced air, static pile processed food scrap and wood chip compost. Cornell
University,
Michel F. C., Pecchia J. A., Rigot J., and Keener H. M. (2004) Mass and nutrient
losses during the composting of dairy manure amended with sawdust or straw.
171
Lyles S. T. (1969). Biology of microorganisms. St. Louis: The C. V. Mosby Co.
MacGregor S. T., Miller F. C., Psarianos K. M., and Finstein M. S. (1981)
Composting process control based on interaction between microbial heat
output and temperature. Applied and Environmental Microbiology, 41(6),
1321-1330.
Madigan M. T., Martinko J. M., Stahl D. A., and Clark D. P. (2006). Brock biology of
microorganisms. In (11 ed., pp. 136): Pearson College Div.
Mahimairaja S., Bolan N. S., Hedley M. J., and Macgregor A. N. (1994) Losses and
transformation of nitrogen during composting of poultry manure with different
amendments-An incubation experiment. Bioresource Technology, 47(3),
265-273.
Marugg C. (1993) A kinetic model of the yard waste composting process. Compost
Science and Utilization, 1(1), 38-51.
Mathur S. P. (1991). Composting process. In Byconversion of waste materials to
industrial products. New York.
McDonnell E. M. (1993). Evaluation of the Metricor refractive index probe with
fiberoptic cable in simple food systems (Vol. x, 97 leaves).
McDonnell E. M. (1999). Process characterization, and stability and maturity testing
of forced air, static pile processed food scrap and wood chip compost. Cornell
University,
Michel F. C., Pecchia J. A., Rigot J., and Keener H. M. (2004) Mass and nutrient
losses during the composting of dairy manure amended with sawdust or straw.
171
Page 188
Compost Science and Utilization, 12(4), 323-334.
Miller F. C. (1989) Matric water potential as an ecological determinant in compost a
substrate dense system. Microbial Ecology, 18, 59-71.
Miller F. C. (1996). Composting of municipal solid waste and its components. In A. C.
Palmisano, & M. A. Barlaz (Eds.), Microbiology of solid waste (pp. 116-154).
Boca Raton: CRC press.
Molla A., Frakhru'l-Razi A., Hanafi M., and Alam M. (2005) Compost produced by
solid state bioconversion of biosolids: a potential resource for plant growth
and environmental friendly disposal. Communications in soil science and plant
analysis, 36(11&12), 1435-1447.
Monod J. (1949) The growth of bacterial cultures. Annual Review of Microbiology, 3,
371-394.
Montgomery D. C. (2001). experiments with a single factor: the analysis of variance.
In D. C. Montgomery (Ed.), Design and analysis of experiments. 5th ed. New
York: Wiley & Sons, INC.
Mosteller F. (1948) A k-sample slippage test for an extreme population. Annals of
mathematical statistics, 19(1), 58-65.
Mysliwiec M. J., VanderGheynst J. S., and Rashid M. (2001) Dynamic volume
averaged model of heat and mass transport within a compost biofilter (I):
model development. Biotechnology and Bioengineering, 73(4), 282-295.
Nakasaki K. (1987) a new composting model and assessment of optimum operation
for effective drying of composting material. Journal of termentation
172
Page 189
technology, 65(4), 441-447.
Nakasaki K., Nag K., and Ariga 0. (2004) Degradation of fats during thermophilic
composting of organic waste. Waste Management and Research, 22(4),
276-282.
Nakasaki K., Nag K., and Karita S. (2005) Microbial succession associated with
organic matter decomposition during thermophilic composting of organic
waste. Waste management research, 23(1), 48-56.
Nakasaki K., and Shoda M. (1987) Oxygen diffusion and microbial activity in the
composting of dehydrated sewage sludge cakes. Journal of fermentation
technology, 56(1), 43-48.
Nakasaki K., Shoda M., and Kubota H. (1985) Comparison of composting of two
sewage sludges. Journal of fermentation and bioengineering, 63(537-543)
Nakasaki K., Yaguchi H., Sasaki Y., and Kubota H. (1992) effect of C/N ratio on
thermophilic composting of garbage. Journal of fermentation and
bioengineering, 73, 43-45.
Nakasaki K., Yaguchi H., Sasaki Y., and Kubota H. (1993) Effects Of pH Control On
Composting Of Garbage. Waste Management & Research, 11(2), 117-125.
Nakhla G., Liu V., and Bassi A. (2006) Kinetic modeling of aerobic biodegradation of
high oil and grease rendering wastewater. Bioresource Technology, 97(1),
131-139.
Namkoong W., Hwang E.-Y., Cheong J.-G., and Choi J.-Y. (1999) A comparative
evaluation of maturity parameters for food waste composting. Compost
173
technology, 65(4), 441-447.
Nakasaki K., Nag K., and Ariga O. (2004) Degradation of fats during thermophilic
composting of organic waste. Waste Management and Research, 22(4),
276-282.
Nakasaki K., Nag K., and Karita S. (2005) Microbial succession associated with
organic matter decomposition during thermophilic composting of organic
waste. Waste management research, 23(1), 48-56.
Nakasaki K., and Shoda M. (1987) Oxygen diffusion and microbial activity in the
composting of dehydrated sewage sludge cakes. Journal of fermentation
technology, 56(1), 43-48.
Nakasaki K., Shoda M., and Kubota H. (1985) Comparison of composting of two
sewage sludges. Journal of fermentation and bioengineering, 63(537-543)
Nakasaki K., Yaguchi H., Sasaki Y., and Kubota H. (1992) effect of C/N ratio on
thermophilic composting of garbage. Journal of fermentation and
bioengineering, 73,43-45.
Nakasaki K., Yaguchi H., Sasaki Y., and Kubota H. (1993) Effects Of pH Control On
Composting Of Garbage. Waste Management & Research, 11(2), 117-125.
Nakhla G., Liu V., and Bassi A. (2006) Kinetic modeling of aerobic biodegradation of
high oil and grease rendering wastewater. Bioresource Technology, 97(1),
131-139.
Namkoong W., Hwang E.-Y., Cheong J.-G., and Choi J.-Y. (1999) A comparative
evaluation of maturity parameters for food waste composting. Compost
173
Page 190
Science & Utilization, 7(2), 55.
Nelson M. I., Balakrishnan E., and Chen X. D. (2003) A Semenov model of
self-heating in compost piles. Process safety and environmental protection,
81(5), 375-383.
Nergo M. J., Solano M. L., Ciria P., and Carrasco J. (1999) Composting of sweet
sorghum bagasse with other wastes. Bioresource Technology, 67(1), 89-92.
Nobuyuki Y., H. J., and M. T. (2001) Monitoring of the composting process using a
mediator-type biochemical oxygen demand sensor. The analyst, 126(10),
1751-1755.
Pare T., Dinel H., Schnitzer M., and Dumontet S. (1998) Transformations of carbon
and nitrogen during composting of animal manure and shredded paper.
Biology and Fertility of Soils, 26(3), 173-178.
Park M., Singvilay 0., Shin W., Kim E., Chung J., and Sa T. (2004) Effects of
long-term compost and fertilizer application on soil phosphorus status under
paddy cropping system. Communications in soil science and plant analysis,
35(11&12), 1635-1648.
Pascual J. A., Garcia C., Hernandez T., Lerma S., and Lynch J. M. (2002)
Effectiveness of municipal waste compost and its humic fraction in
suppressing Pythium ultimum. Microbial Ecology, 44, 59-68.
Petrie I., and Selimbasic V. (2008) Development and validation of mathematical
model for aerobic composting process. Chemical Engineering Journal, 139(2),
• 304-317.
174
Science & Utilization, 7(2), 55.
Nelson M. I., Balakrishnan E., and Chen X. D. (2003) A Semenov model of
self-heating in compost piles. Process safety and environmental protection,
81(5), 375-383.
Nergo M. J., Solano M. L., Ciria P., and Carrasco J. (1999) Composting of sweet
sorghum bagasse with other wastes. Bioresource Technology, 67(1), 89-92.
Nobuyuki Y., H. J., and M. T. (2001) Monitoring of the composting process using a
mediator-type biochemical oxygen demand sensor. The analyst, 126(10),
1751-1755.
Pare T., Dinel H., Schnitzer M., and Dumontet S. (1998) Transformations of carbon
and nitrogen during composting of animal manure and shredded paper.
Biology and Fertility of Soils, 26(3), 173-178.
Park M., Singvilay O., Shin W., Kim E., Chung J., and Sa T. (2004) Effects of
long-term compost and fertilizer application on soil phosphorus status under
paddy cropping system. Communications in soil science and plant analysis,
35(11&12), 1635-1648.
Pascual J. A., Garcia C., Hernandez T., Lerma S., and Lynch J. M. (2002)
Effectiveness of municipal waste compost and its humic fraction in
suppressing Pythium ultimum. Microbial Ecology, 44, 59-68.
Petric I., and Selimbasic V. (2008) Development and validation of mathematical
model for aerobic composting process. Chemical Engineering Journal, 139(2),
• 304-317.
174
Page 191
Picard R., and Cook D. (1984) Cross-validation of regression models. Journal of
American Statistical Association, 79(387), 575-583.
Poincelot R. P. (1974) A scientific examination of the principles and practices of
composting. Compost science, 15, 24-31.
Polprasert C. (1989). Organic waste recycling. New York: John wiley & sons.
Rao Bhamidimarri S. M., and Pandey S. P. (1996) Aerobic thennophilic composting
of piggery solid wastes. Water Science and Technology, 33(8), 89-94.
Richard T. L. (1997). The kinetics of soid state aerobic biodegradation. Cornell
University, Ithaca.
Richard T. L., Hamelers H. V. M., Veeken A., and Sliva T. (2002) Moisture
relationships in composting processes. Compost Science and Utilization, 10(4),
286-302.
Richard T. L., and Walker L. P. (2006) Modeling the temperature kinetics of aerobic
solid-state biodegradation. Biotechnology Progress, 22(1), 70-77.
Richard T. L., Walker L. P., and Gosser J. M. the effects of oxygen on solid-state
biodegradation kinetics. In Proceedings of the IBE, 1999 (Vol. 2, pp.
A22-A39)
Robertsson M. (2002). Effects of interrupted air supply on the composting process -
composition of volatile organic acids. In R. N. Insam H., Klammer S. (Ed.),
Microbiology of Composting (pp. 189-201). Berlin-Heidelberg, New York:
Springer-Verlag.
Robinson P., and Stentiford E. I. (1993) Improving the aerated static pile composting
175
Picard R., and Cook D. (1984) Cross-validation of regression models. Journal of
American Statistical Association, 79(387), 575-583.
Poincelot R. P. (1974) A scientific examination of the principles and practices of
composting. Compost science, 15, 24-31.
Polprasert C. (1989). Organic waste recycling. New York: John wiley & sons.
Rao Bhamidimarri S. ML, and Pandey S. P. (1996) Aerobic thermophilic composting
of piggery solid wastes. Water Science and Technology, 33(8), 89-94.
Richard T. L. (1997). The kinetics of soid state aerobic biodegradation. Cornell
University, Ithaca.
Richard T. L., Hamelers H. V. M., Veeken A., and Sliva T. (2002) Moisture
relationships in composting processes. Compost Science and Utilization, 10(4),
286-302.
Richard T. L., and Walker L. P. (2006) Modeling the temperature kinetics of aerobic
solid-state biodegradation. Biotechnology Progress, 22(1), 70-77.
Richard T. L., Walker L. P., and Gosser J. M. the effects of oxygen on solid-state
biodegradation kinetics. In Proceedings of the IBE, 1999 (Vol. 2, pp.
A22-A39)
Robertsson M. (2002). Effects of interrupted air supply on the composting process -
composition of volatile organic acids. In R. N. Insam H., Klammer S. (Ed.),
Microbiology of Composting (pp. 189-201). Berlin-Heidelberg, New York:
Springer-Verlag.
Robinson P., and Stentiford E. I. (1993) Improving the aerated static pile composting
175
Page 192
method by the incorporation of moisture control. Compost Science and
Utilization, 1, 53-69.
Ryckeboer J., and J. M. (2003) Microbiological aspects of biowaste during
composting in a monitored compost bin. Journal of applied microbiology,
94(1), 127-137.
Ryckeboer J., Mergae J., Vaes K., Klammer S., Clercq D. d., Coosemans J., et al.
(2003a) A survey of bacteria and fungi occurring during composting and
self-heating process. Annals of microbiology, 53(4), 349-410.
Ryckeboer J., Mergaert J., Coosemans J., Deprins K., and Swings J. (2003b)
Microbiological aspects of biowaste during composting in a monitored
compost bin. Journal of applied microbiology, 94, 127-137.
Sasaki N., Suehara K. I., Kohda J., Nakano Y., and T.Yano (2003) Effects of C/N ratio
and pH of raw materials on oil degradation efficiency in a compost
fermentation process. Journal of bioscience and bioengineering, 96(1), 47-52.
Schlegel A. J. (1992) Effect of composted manure on soil chemical-preperties and
nitrogen use by grain-sorghum. Journal of production agriculture, 5(1),
153-157.
Schloss P. D., and Walker L. P. (2000) Measurement of process performance and
variability in inoculated composting reactors using ANOVA and power
analysis. Process Biochemistry, 35(9), 931-942.
Schwab B. S., Ritchie C. J., Kain D. J., Dobrin G. D., Long L. W., and Palmisano A.
C. (1994) Characterization of compost from a pilot plant-scale composting
176
method by the incorporation of moisture control. Compost Science and
Utilization, 1,53-69.
Ryckeboer J., and J. M. (2003) Microbiological aspects of biowaste during
composting in a monitored compost bin. Journal of applied microbiology,
94(1), 127-137.
Ryckeboer J., Mergae J., Vaes K., Klammer S., Clercq D. d., Coosemans J., et al.
(2003a) A survey of bacteria and fungi occurring during composting and
self-heating process. Annals of microbiology, 53(4), 349-410.
Ryckeboer J., Mergaert J., Coosemans J., Deprins K., and Swings J. (2003b)
Microbiological aspects of biowaste during composting in a monitored
compost bin. Journal of applied microbiology, 94, 127-137.
Sasaki N., Suehara K. I., Kohda J., Nakano Y., and T.Yano (2003) Effects of C/N ratio
and pH of raw materials on oil degradation efficiency in a compost
fermentation process. Journal of bioscience and bioengineering, 96(1), 47-52.
Schlegel A. J. (1992) Effect of composted manure on soil chemical-preperties and
nitrogen use by grain-sorghum. Journal of production agriculture, 5(1),
153-157.
Schloss P. D., and Walker L. R (2000) Measurement of process performance and
variability in inoculated composting reactors using ANOVA and power
analysis. Process Biochemistry, 35(9), 931-942.
Schwab B. S., Ritchie C. J., Kain D. J., Dobrin G. D., Long L. W., and Palmisano A.
C. (1994) Characterization of compost from a pilot plant-scale composting
176
Page 193
utilizing simulated solid waste. Waste Management and Research, 123,
289-303.
Seo J. Y., Heo J. S., Kim T. H., Joo W. II., and Crohn D. M. (2004) Effect of
vermiculite addition on compost produced from Korean food wastes. Waste
Management, 24(10), 981-987.
Sequi P. (1996). The role of composting in sustainable agriculture. In M. DeBertoldi,
P. Sequi, B. Lemmes, & T. Papi (Eds.), The science of composting (pp. 23-29).
London: Blackie academic and professional.
Seymour R. M., Donahue D., Bourdon M., Evans J. R., and Wentworth D. (2001)
Intermittent aeration for in-vessel composting of crab processing waste.
Compost Science & Utilization, 9(2), 98-106.
Sikora L. J. (1999) MSW compost reduces nitrogen volatilization during dairy manure
composting. Compost Science and Utilization, 7(4), 34-41.
SmArs S., Gustafsson L., Beck-Friis B., and Jonsson H. (2002) Improvement of the
composting time for household waste during an initial low pH phase by
mesophilic temperature control. Bioresource Technology, 84(3), 237-241.
Smith L. H., McCarty P. L., and Kitanidis P. K. (1998) Spreadsheet method for
evaluation of biochemical reaction rate coefficients and their uncertainties by
weighted nonlinear least-squares analysis of the integrated Monod Equation.
Appllied and Environmental Microbiology, 64(6), 2044-2050.
Smith R., and Eilers R. G. (1980). Numerical simulation of aerated sludge composting
reported to USEPA.
177
utilizing simulated solid waste. Waste Management and Research, 123,
289-303.
Seo J. Y., Heo J. S., Kim T. H., Joo W. H., and Crohn D. M. (2004) Effect of
vermiculite addition on compost produced from Korean food wastes. Waste
Management, 24(10), 981-987.
Sequi P. (1996). The role of composting in sustainable agriculture. In M. DeBertoldi,
P. Sequi, B. Lemmes, & T. Papi (Eds.), The science of composting (pp. 23-29).
London: Blackie academic and professional.
Seymour R. M., Donahue D., Bourdon M., Evans J. R., and Wentworth D. (2001)
Intermittent aeration for in-vessel composting of crab processing waste.
Compost Science & Utilization, 9(2), 98-106.
Sikora L. J. (1999) MSW compost reduces nitrogen volatilization during dairy manure
composting. Compost Science and Utilization, 7(4), 34-41.
Sm&rs S., Gustafsson L., Beck-Friis B., and Jonsson H. (2002) Improvement of the
composting time for household waste during an initial low pH phase by
mesophilic temperature control. Bioresource Technology, 84(3), 237-241.
Smith L. H., McCarty P. L., and Kitanidis P. K. (1998) Spreadsheet method for
evaluation of biochemical reaction rate coefficients and their uncertainties by
weighted nonlinear least-squares analysis of the integrated Monod Equation.
Appllied and Environmental Microbiology, 64(6), 2044-2050.
Smith R., and Eilers R. G. (1980). Numerical simulation of aerated sludge composting
reported to USEPA.
Page 194
Soares H. M., Cardenas B., Weir D., and Switzenbaum M. S. (1995) Evaluating
pathogen regrowth in biosolids compost. Biocycle, 36, 70-75.
Solano M. L., Iriarte F., Ciria P., and Negro M. J. (2001a) Performance characteristics
of three aeration systems in the composting of sheep manure and straw.
Journal of Agricultural Engineering Research, 79(3), 317-329.
Solano M. L., Iriarte F., Ciria P., and Nergo M. J. (2001b) Performance characteristics
of three aeration systems in the composting of sheep manure and straw.
Journal of Agricultural Engineering Research, 79(3), 317-329.
Stabnikova 0., Ding H. B., Tay J. H., and Wang J. Y. (2005) Biotechnology for
aerobic conversion of food waste into organic fertilizer. Waste Management
and Research, 23(1), 39-47.
Stentiford E. I. (1993). Diversity of composting systems. In A. J. Hoitink, & H. M.
Keener (Eds.), Science and engineering of composting: design environmental,
microbiological and utilization aspects (pp. 100). Worthington: Renaissance
Publications.
Stentiford E. I. (1996). Composting control: principles and practice. In M. Debertoldi,
P. Sequi, B. Lemes, & T. Papi (Eds.), In: The science of composting. (pp.
49-59). London: Blackie academic and professional.
Stombaugh D. P., and Nokes S. E. (1996) Development of a biologically based
aerobic composting simulation model. Transactions of the ASAE, 39(1),
239-250.
Storm P. E. (1985) Effects of temperature on bacterial species-diversity in
178
Soares H. M., Cardenas B., Weir D., and Switzenbaum M. S. (1995) Evaluating
pathogen regrowth in biosolids compost. Biocycle, 36, 70-75.
Solano M. L., Iriarte F., Ciria P., and Negro M. J. (2001a) Performance characteristics
of three aeration systems in the composting of sheep manure and straw.
Journal of Agricultural Engineering Research, 79(3), 317-329.
Solano M. L., Iriarte F., Ciria P., and Nergo M. J. (2001b) Performance characteristics
of three aeration systems in the composting of sheep manure and straw.
Journal of Agricultural Engineering Research, 79(3), 317-329.
Stabnikova O., Ding H. B., Tay J. H., and Wang J. Y. (2005) Biotechnology for
aerobic conversion of food waste into organic fertilizer. Waste Management
and Research, 23(1), 39-47.
Stentiford E. I. (1993). Diversity of composting systems. In A. J. Hoitink, & H. M.
Keener (Eds.), Science and engineering of composting: design environmental,
microbiological and utilization aspects (pp. 100). Worthington: Renaissance
Publications.
Stentiford E. I. (1996). Composting control: principles and practice. In M. Debertoldi,
P. Sequi, B. Lemes, & T. Papi (Eds.), In: The science of composting, (pp.
49-59). London: Blackie academic and professional.
Stombaugh D. P., and Nokes S. E. (1996) Development of a biologically based
aerobic composting simulation model. Transactions of the ASAE, 39(1),
239-250.
Storm P. E. (1985). Effects of temperature on bacterial species-diversity in
178
Page 195
thermophilic solid waste composting. Applied and Environmental
Microbiology, 50(4), 899-905.
Strom P. F. (1985) Effect of temperature on bacterial species-diversity in thermphilic
solid-waste composting. Applied and Environmental Microbiology, 50(4),
899-905.
Suler D. J., and Finstein M. S. (1977) Effects of temperature, aeration, and moisture
on CO2 formation in bench-scale, continuously thermophilic composting of
solid waste. Applied and Environmental Microbiology, 33(2), 345-350.
Sun X. (2006). Nitrogen Transformation in Food-Waste Composting. University of
Regina,
Sundberg C., and Jonsson H. (2005) Process inhibition due to organic acids in
fed-batch composting of food waste — influence of starting culture.
Biodegradation, 16(3), 205-213.
Sundberg C., Smars S., and Jonsson H. (2004) Low pH as an inhibiting factor in the
transition from mesophilic to thermophilic phase in composting. Bioresource
Technology, 95(2), 145-150.
Suzuki T., Ikumi Y, Okamoto S., Watanabe I., Fujitake N., and Otsuka H. (2004)
Aerobic composting of chips from clear-cut trees with various co-materials.
Bioresource Technology, 95(2), 121-128.
Svensson K., Odlare M., and Pell M. (2004) The fertilizing effect of compost and
biogas residues from source separated household waste. The Journal of
Agricultural Science, 142(04), 461-467..
179
thermophilic solid waste composting. Applied and Environmental
Microbiology, 50(4), 899-905.
Strom P. F. (1985) Effect of temperature on bacterial species-diversity in thennphilic
solid-waste composting. Applied and Environmental Microbiology, 50(4),
899-905.
Suler D. J., and Finstein M. S. (1977) Efffects of temperature, aeration, and moisture
on C02 formation in bench-scale, continuously thermophilic composting of
solid waste. Applied and Environmental Microbiology, 33(2), 345-350.
Sun X. (2006). Nitrogen Transformation in Food-Waste Composting. University of
Regina,
Sundberg C., and Jonsson H. (2005) Process inhibition due to organic acids in
fed-batch composting of food waste — influence of starting culture.
Biodegradation, 16(3), 205-213.
Sundberg C., SmSrs S., and Jonsson H. (2004) Low pH as an inhibiting factor in the
transition from mesophilic to thermophilic phase in composting. Bioresource
Technology, 95(2), 145-150.
Suzuki T., Ikumi Y., Okamoto S., Watanabe I., Fujitake N., and Otsuka H. (2004)
Aerobic composting of chips from clear-cut trees with various co-materials.
Bioresource Technology, 95(2), 121-128.
Svensson K., Odlare M., and Pell M. (2004) The fertilizing effect of compost and
biogas residues from source separated household waste. The Journal of
Agricultural Science, 142(04), 461-467..
Page 196
Swatek F. E. (1967). Textbook of microbiology. St. Louis: The C. V. Mosby Co.
Szmidt R., and Fox C. (2001) Compost processes - interdependencies for process
control and compost quality. Acta horticulture, 549, 55-61.
Tam N. F. Y., and Tiquia S. M. (1999) Nitrogen transformation during co-composting
of spent pig manure, saw dust litter and sludge under forced -aerated system.
Environmental Technology, 20(3), 259-267.
Thambirajah J. J., Zullcali M. D., and M. A. Hashi (1995) Microbiological and
biochemical changes during the composting of oil palm
empty-fruit-bunches-effect of nitrogen supplementation on the substrate.
Bioresource Technology, 52(2), 133-144.
Tiquia S. M., and Tam N. F. Y. (1998) Elimination of phytotoxicity during
co-composting of spent pig-manure sawdust litter and pig sludge. Bioresource
Technology, 65(1&2), 43-49.
Tiquia S. M., and Tam N. F. Y. (2000) Fate of nitrogen during composting of chicken
litter. Environmental Pollution, 110, 535-541.
Tomati U., Madejon E., Galli E., Capitani D., and Segre A. L. (2001) structural
changes of humic acids during olive mill pomace composting. Compost
Science & Utilization, 9(2), 134-142.
Trefry M. G., and Franzmann P. D. (2003) An extended kinetic model accounting for
nonideal microbial substrate mineralization in environmental samples.
Geomicrobiology Journal, 20(2), 113-129.
Uif S. (1998). Systems analysis of waste management-the ORWARE model, transport
180
Swatek F. E. (1967). Textbook of microbiology. St. Louis: The C. V. Mosby Co.
Szmidt R., and Fox C. (2001) Compost processes - interdependences for process
control and compost quality. Acta horticulture, 549, 55-61.
Tam N. F. Y., and Tiquia S. M. (1999) Nitrogen transformation during co-composting
of spent pig manure, saw dust litter and sludge under forced -aerated system.
Environmental Technology, 20(3), 259-267.
Thambirajah J. J., Zulkali M. D., and M. A. Hashi (1995) Microbiological and
biochemical changes during the composting of oil palm
empty-fruit-bunches-effect of nitrogen supplementation on the substrate.
Bioresource Technology, 52(2), 133-144.
Tiquia S. M., and Tam N. F. Y. (1998) Elimination of phytotoxicity during
co-composting of spent pig-manure sawdust litter and pig sludge. Bioresource
Technology, 65(1 &2), 43-49.
Tiquia S. M., and Tam N. F. Y. (2000) Fate of nitrogen during composting of chicken
litter. Environmental Pollution, 110,535-541.
Tomati U., Madejon E., Galli E., Capitani D., and Segre A. L. (2001) structural
changes of humic acids during olive mill pomace composting. Compost
Science & Utilization, 9(2), 134-142.
Trefry M. G., and Franzmann R D. (2003) An extended kinetic model accounting for
nonideal microbial substrate mineralization in environmental samples.
Geomicrobiology Journal, 20(2), 113-129.
Uif S. (1998). Systems analysis of waste management-the ORWARE model, transport
180
Page 197
and compost sub-models. Swedish university of agricultural science, Uppsala.
Van Lier J. J. C., Ginkel J. T. V., Straatsma G., Gerrits J. P. G., and Griensven L. J. L.
D. V. (1994) Composting of mushroom substate in a fermentation tunnel:
compost parameters and a mathmatical model. Netherlands journal of
agricultural science, 42(4), 271-292.
VanderGheynst J. S. (1997). Experimentation, modeling and analysis of a high-solids
aerobic decomposition process. Cornell University, Ithaca.
VanderGheynst J. S., Gossett J. M., and Walker L. P. (1996) HIgh-solids aerobic
decomposition: pilot-scale reactor development and experimentation. Process
Biochemistry, 32(5), 361-375.
VanderGheynst J. S., and Lei F. (2000) The effect of microbial inoculation and pH on
microbial community structure changes during composting. Process
Biochemistry, 35, 923-940.
Venglovsky J., Sasakova N., Vargova M., Pacajova Z., Placha I., Petrovsky M., et al.
(2005) Evolution of temperature and chemical parameters during composting
of the pig slurry solid fraction amended with natural zeolite. Bioresource
Technology, 96(2), 181-189.
Vinci B. J., Summerfelt S. T., Timmons M. B., and Watten B. J. Carbon dioxide
control in intensive aquaculture: design tool development. In Proceedings of
the Aquacultural Engineering Society, 1996 (Vol. 2, pp. 399-419)
Vogelaar J. C. T., Klapwijk B., Temmink H., and van Lier J. B. (2003) Kinetic
comparisons of mesophilic and thermophilic aerobic biomass. Journal of
181
and compost sub-models. Swedish university of agricultural science, Uppsala.
Van Lier J. J. C., Ginkel J. T. V., Straatsma G., Gerrits J. P. G., and Griensven L. J. L.
D. V. (1994) Composting of mushroom substate in a fermentation tunnel:
compost parameters and a mathmatical model. Netherlands journal of
agricultural science, 42(4), 271-292.
VanderGheynst J. S. (1997). Experimentation, modeling and analysis of a high-solids
aerobic decomposition process. Cornell University, Ithaca.
VanderGheynst J. S., Gossett J. M., and Walker L. P. (1996) High-solids aerobic
decomposition: pilot-scale reactor development and experimentation. Process
Biochemistry, 32(5), 361-375.
VanderGheynst J. S., and Lei F. (2000) The effect of microbial inoculation and pH on
microbial community structure changes during composting. Process
Biochemistry, 35,923-940.
Venglovsky J., Sasakova N., Vargova M., Pacajova Z., Placha I., Petrovsky M., et al.
(2005) Evolution of temperature and chemical parameters during composting
of the pig slurry solid fraction amended with natural zeolite. Bioresource
Technology, 96(2), 181-189.
Vinci B. J., Summerfelt S. T., Timmons M. B., and Watten B. J. Carbon dioxide
control in intensive aquaculture: design tool development. In Proceedings of
the Aquacultural Engineering Society, 1996 (Vol. 2, pp. 399-419)
Vogelaar J. C. T., Klapwijk B., Temmink H., and van Lier J. B. (2003) Kinetic
comparisons of mesophilic and thermophilic aerobic biomass. Journal of
181
Page 198
Industrial Microbiology & Biotechnology, 30(2), 81-88.
Waksman S. A., Cordon T. C., and Hulpoi N. (1939) Influence of temperature upon
the microbiological population and decompostition Soil Science, 47, 83-98.
Walker P. (2008). Food Residuals: Waste Product, By-Product, or Coproduct. In
Food Waste to Animal Feed (pp. 17-30): Iowa State University Press.
Weppen P. (2001) Process calorimetry on composting of municipal organic wastes.
Biomass and bioenergy, 21(4), 289-299.
Whang D. S., and Meenaghan G. F. (1980) Kinetic model of composting process.
Compost science, 21, 44-46.
Wilson G. B. (1989) Combining raw materials for composting. Biocycle, 30(8),
82-85.
Wilson G. B., and Dalmat (1986) Process Control: Measuring Composting Stability.
Biocycle, 27(7), 34-37.
Witter E., and Lopez-Real J. (1987) The potential of sewage sludge and composting in
a nitrogen recyling strategy for agriculture. Biological agriculture and
horticulture, 5, 1-23.
Witter E., and Lopez-Real J. (1988) Nitrogen losses during the composting of sewage
sludge, and the effectiveness of clay soil, zeolite, and compost in adsorbing the
volatilized ammonia. Biological Wastes, 23(4), 279-294.
Wong J. W. C., and Fang M. (2000) Effects of lime addition on sewage sludge
composting process. Water Research, 34(15), 3691-3698.
Wong J. W. C., Li S. W. Y., and Wong M. H. (1995) Coal Fly Ash as a Composting
182
Industrial Microbiology & amp; Biotechnology, 30(2), 81-88.
Waksman S. A., Cordon T. C., and Hulpoi N. (1939) Influence of temperature upon
the microbiological population and decompostition Soil Science, 47, 83-98.
Walker P. (2008). Food Residuals: Waste Product, By-Product, or Coproduct. In
Food Waste to Animal Feed (pp. 17-30): Iowa State University Press.
Weppen P. (2001) Process calorimetry on composting of municipal organic wastes.
Biomass and bioenergy, 21(4), 289-299.
Whang D. S., and Meenaghan G. F. (1980) Kinetic model of composting process.
Compost science, 21,44-46.
Wilson G. B. (1989) Combining raw materials for composting. Biocycle, 30(8),
82-85.
Wilson G. B., and Dalmat (1986) Process Control: Measuring Composting Stability.
Biocycle, 27(7), 34-37.
Witter E., and Lopez-Real J. (1987) The potential of sewage sludge and composting in
a nitrogen recyling strategy for agriculture. Biological agriculture and
horticulture, 5, 1-23.
Witter E., and Lopez-Real J. (1988) Nitrogen losses during the composting of sewage
sludge, and the effectiveness of clay soil, zeolite, and compost in adsorbing the
volatilized ammonia. Biological Wastes, 23(4), 279-294.
Wong J. W. C., and Fang M. (2000) Effects of lime addition on sewage sludge
composting process. Water Research, 34(15), 3691-3698.
Wong J. W. C„ Li S. W. Y., and Wong M. H. (1995) Coal Fly Ash as a Composting
Page 199
Material for Sewage Sludge: Effects on Microbial Activities. Environmental
Technology, 16(6), 527-537.
Wong J. W. C., Mak K. F., Chan N. W., Lam A., Fang M., Zhou L. X., et al. (2001)
Co-composting of soybean residues and leaves in Hong Kong. Bioresource
Technology, 76(2), 99-106.
Xi B., Zhang G., and Liu H. (2005) Process kinetics of inoculation composting of
municipal solid waste. Journal of Hazardous Materials, 124(1-3), 165-172.
Yan F., Schubert S., and Mengel K. (1996) Soil pH increase due to biological
decarboxylation of organic anions. Soil biology and Biochemistry, 28(4-5),
617-624.
Yoshida N., Hoashi J., Morita T., McNiven S. J., Yano K., Yoshida A., et al. (2001)
Monitoring of the composting process using a mediator-type biochemical
oxygen demand sensor. Analyst, 126(10), 1751-1755.
Yu H., and Huang G. H. (2009) Effects of sodium acetate as a pH control amendment
on the composting of food waste. Bioresource Technology, 100(6), 2005-2011.
Zhang Z. (2000). The effects of moisture and free air space on composting rates. Iowa
state university, Ames.
Zucconi F., Pera A., Forte M., and Debertoldi M. (1981) Evaluating toxicity of
immature compost. Biocycle, 22(2), 54-57.
183