Original Research Effects of Combined Power Band Resistance Training on Sprint Speed, Agility, Vertical Jump Height, and Strength in Collegiate Soccer Players EDGAR T. KATUSHABE †1 and MARK KRAMER ‡1,2 1 Department of Human Movement Science, Nelson Mandela University, Port Elizabeth, Eastern Cape, SOUTH AFRICA; 2 Physical Activity, Sport, and Recreation Unit, North-West University, Potchefstroom, North West, SOUTH AFRICA † Denotes graduate student author, ‡ Denotes professional author ABSTRACT International Journal of Exercise Science 13(4): 950-963, 2020. Soccer involves explosive physical actions requiring strength, power, and agility for optimal performance. Such attributes may be trained several ways, of which power-band resistance training has received limited attention regarding the potential for performance improvement in soccer players. This study serves to determine the effect of power-band resistance training on 1-repetition maximal (1RM) strength, speed, standing vertical jump (SVJ) height, and agility of collegiate soccer players. Seventeen male players (age: 20.47 ± 1.85 years, height: 1.77 ± 0.08 m, mass: 70.49 ± 4.15 kg) were matched and randomly allocated into either a conventional resistance group (CON, n = 8), or a power- band resistance training group (EXP, n = 9). Following a 6-week intervention, participants were re-assessed relative to their baseline values, showing improvements in 1RM squat mass (CON: +31.57%; EXP: +34.61%), 1RM deadlift mass (CON: +15.44%; EXP: +13.72%), and SVJ height (CON: +4.15%; EXP: +6.35%). Power-band resistance training produced greater results compared to conventional training in 1RM squat mass, even when between-group baseline values were controlled for (ANCOVA, F(1,14)=5.32, p = 0.037, ! " # = .28). No other between-group differences were evident, showing no clear methodological superiority. Power-band resistance training shows potential as an effective training methodology compared to conventional resistance training to improve performance variables in university soccer players. KEY WORDS: Coefficient of elasticity, eccentric, fitness testing INTRODUCTION During 90-minutes of match play, professional soccer players engage in 1000-1400 unpredictable changes in locomotor activity, resulting in an approximate change every 3-6 seconds (5, 10). Soccer players, depending on level, cover distances of between 8500-13000 m at varying movement intensities (standing and walking [0-11 km/hr], low-intensity running [11.1-14 km/hr], moderate-intensity running [14.1-17 km/hr], high intensity-running [17.1-21 km/hr], very-high intensity running [21.1-24 km/hr], and sprinting [>24 km/hr]) (5, 10, 27, 31, 34, 39). Therefore, approximately 80-90% of performances during match-play are spent in low-to- moderate activities, with the remaining 10-20% being completed at high-intensity (10, 34).
Transcript
Original Research Effects of Combined Power Band Resistance Training on Sprint Speed, Agility, Vertical Jump Height, and Strength in Collegiate Soccer Players EDGAR T. KATUSHABE†1 and MARK KRAMER‡1,2 1Department of Human Movement Science, Nelson Mandela University, Port Elizabeth, Eastern Cape, SOUTH AFRICA; 2Physical Activity, Sport, and Recreation Unit, North-West University, Potchefstroom, North West, SOUTH AFRICA †Denotes graduate student author, ‡Denotes professional author
ABSTRACT International Journal of Exercise Science 13(4): 950-963, 2020. Soccer involves explosive physical actions requiring strength, power, and agility for optimal performance. Such attributes may be trained several ways, of which power-band resistance training has received limited attention regarding the potential for performance improvement in soccer players. This study serves to determine the effect of power-band resistance training on 1-repetition maximal (1RM) strength, speed, standing vertical jump (SVJ) height, and agility of collegiate soccer players. Seventeen male players (age: 20.47 ± 1.85 years, height: 1.77 ± 0.08 m, mass: 70.49 ± 4.15 kg) were matched and randomly allocated into either a conventional resistance group (CON, n = 8), or a power-band resistance training group (EXP, n = 9). Following a 6-week intervention, participants were re-assessed relative to their baseline values, showing improvements in 1RM squat mass (CON: +31.57%; EXP: +34.61%), 1RM deadlift mass (CON: +15.44%; EXP: +13.72%), and SVJ height (CON: +4.15%; EXP: +6.35%). Power-band resistance training produced greater results compared to conventional training in 1RM squat mass, even when between-group baseline values were controlled for (ANCOVA, F(1,14)=5.32, p = 0.037, !"# = .28). No other between-group differences were evident, showing no clear methodological superiority. Power-band resistance training shows potential as an effective training methodology compared to conventional resistance training to improve performance variables in university soccer players. KEY WORDS: Coefficient of elasticity, eccentric, fitness testing INTRODUCTION During 90-minutes of match play, professional soccer players engage in 1000-1400 unpredictable changes in locomotor activity, resulting in an approximate change every 3-6 seconds (5, 10). Soccer players, depending on level, cover distances of between 8500-13000 m at varying movement intensities (standing and walking [0-11 km/hr], low-intensity running [11.1-14 km/hr], moderate-intensity running [14.1-17 km/hr], high intensity-running [17.1-21 km/hr], very-high intensity running [21.1-24 km/hr], and sprinting [>24 km/hr]) (5, 10, 27, 31, 34, 39). Therefore, approximately 80-90% of performances during match-play are spent in low-to-moderate activities, with the remaining 10-20% being completed at high-intensity (10, 34).
Int J Exerc Sci 13(4): 950-963, 2020
International Journal of Exercise Science http://www.intjexersci.com 951
Match-play requirements for soccer necessitate the ability of players to engage in maximal accelerations during sprints, engage in approximately 726±203 turns at various angles, coupled with the ability to resist fatigue as intermittent activities progress (3, 11, 29). The principle of specificity dictates that a body/tissue adapts to the demands imposed on it, with the same principle applying to metabolic and neuromuscular loading (25). Stated differently, bioenergetic pathways and neuromuscular tissues adapt when trained at explicit intensities, durations and training modalities to induce desired changes (22, 32). Soccer performance is thus reliant on well-trained individuals exhibiting optimal combinations of speed, strength, power, agility, flexibility and fitness (38). During match-play, a sprint speed impairment of only ~0.8% can substantially increase the probability of losing ball possession against an opponent when both players are sprinting for the ball (29). Similarly, higher fatigue resistance and greater eccentric strength is coupled with lower incidences of injury, specifically those associated with the knee joint (25). Consequently, although the effects of fatigue are multifaceted and complex, the implications of fatigue on performance are clear. The level of soccer performance is thus defined by the ability to develop high forces with rapid contraction velocities, while executing explosive movements such as jumping, running, directional changes and tackling (18). By increasing the amount of available force for muscular contractions as well as the contraction velocity itself, variables such as acceleration, agility and speed can be optimized which may translate to improved performance in skills such as turning, sprinting and acceleration (39). A popular method for increasing the available muscular force is resistance training (RT) which can augment muscular strength and power by influencing the size of the muscle as well as the neuronal activation (1, 2, 7, 9, 15, 17, 23, 24, 41). More specifically, a combination of free-weight and power band training has gained traction in recent years due to the variable resistance provided throughout the range of motion of movement with a particular emphasis on enhanced eccentric loading (42). Power bands are advantageous on two fronts; firstly, the bands increase the relative load towards the end range-of-motion where traditional lifts would experience deceleration, thus requiring a greater average movement speed. Secondly, since the lifting load increases in proportion to band elongation, a lower initial RT mass may be used thus allowing for greater initial lifting velocity due to the lower inertia that must be overcome (13, 33). Evidence suggests that the combination of power bands and free-weights potentially provides a greater force during the final 10% of the concentric phase of the movement as well as the first 25% of the eccentric phase of the movement compared to free-weights only training (29). The use of bands may also serve to reduce the effect of a ‘sticking point’ during a movement by enabling the lifter to pass this point with greater movement speed (1). Consequently, a training stimulus with a less acute sticking point may invoke greater type II muscle fiber recruitment and therefore greater adaptation in these fibers which may be beneficial in optimizing performance in soccer players (1, 15). Few research articles have however focused on the use of power band RT as an effective tool for improvement in muscular strength, speed, agility and power in soccer players (2, 37). The focus of the present study was thus two-fold. Firstly, to explore the effect of customized power band
Int J Exerc Sci 13(4): 950-963, 2020
International Journal of Exercise Science http://www.intjexersci.com 952
training on the strength and power output in soccer players. Secondly, to determine whether these changes can elicit a positive effect on performance variables such as sprinting speed, vertical jump height, and agility. METHODS Participants A total of 22 healthy male soccer players were recruited for the study, all of which completed baseline testing. However, due to attrition (n = 4) or not meeting the minimum number of sessions for the intervention period (i.e. 90% attendance, n = 3), the final number retained for analysis was 17 participants (age: 20.47 ± 1.85 years, height: 1.77 ± 0.08 m, mass: 70.49 ± 4.15 kg). Inclusion criteria for participant selection required that participants were between 18-25 years, be collegiate soccer players that were actively engaged in soccer training and competition for a minimum of one year prior to the study, and to be healthy and injury free at the beginning of the testing and intervention period by completing a simple four question questionnaire (8). Approval for the study was granted by the Research Ethics Committee. Subjects were informed of the benefits and potential risks of the study and were required to complete an informed consent form prior to study commencement. Moreover, all participants were instructed to: (i) arrive for testing in a well rest and fully hydrated state, (ii) avoid caffeine, alcohol or strenuous exercise for 48-hours prior to testing, and (iii) be at least 3-hours post-prandial on the day of testing. This research was carried out in full accordance with the ethical standards of the International Journal of Exercise Science (28). Protocol The present study used a repeated measures design, conducted over an 8-week off-season period. Baseline testing was completed within one week, followed by a 6-week intervention period, after which participants returned for post-testing. The intervention period consisted of bi-weekly strength training sessions where participants were randomly separated into one of two groups (control = CON, n = 8; experimental = EXP, n = 9), based on equivalent pre-intervention strength data. All testing and training sessions occurred in the morning (i.e. between 9-11 am) to minimize day-to-day biological fluctuations. Baseline testing was divided into two phases, each separated by 48 hours. Participants were required to complete a series of five tests within the first phase, with the testing order being counterbalanced to avoid an order-effect. During the first phase, anthropometric measurements were taken (i.e. height and weight), followed by 40-m straight-line sprints, agility and standing vertical jump height testing. A 5-10-minute dynamic warm-up period preceded testing which incorporated jogging and dynamic stretching to prevent any risk for injury. Furthermore, participants were given familiarization bouts prior to testing to become accustomed to each test. Regardless of testing order, a mandatory 5-min rest period would follow between testing stations. The second phase required subjects to complete a 1-repetition maximum (1RM) deadlift and squat maneuver. For the sprint, jump and agility tests only 2 trials were recorded, the best of which being retained for analysis, due to a technical error that occurred after the second round of testing.
Int J Exerc Sci 13(4): 950-963, 2020
International Journal of Exercise Science http://www.intjexersci.com 953
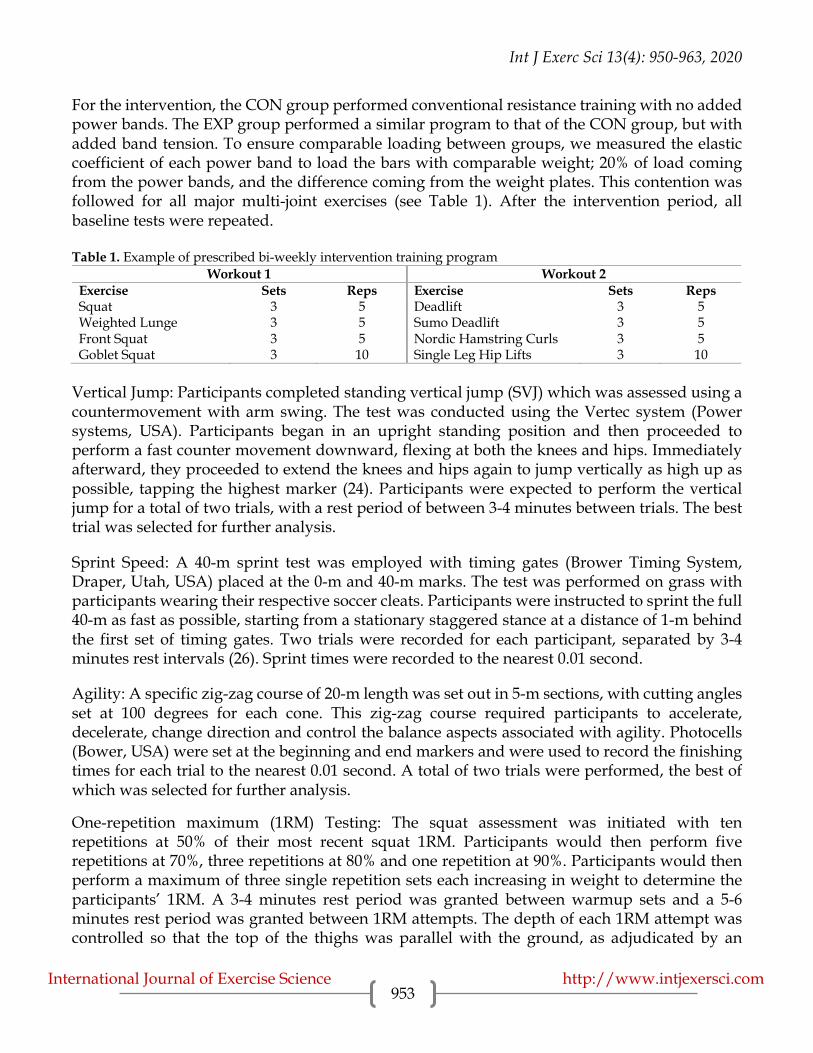
For the intervention, the CON group performed conventional resistance training with no added power bands. The EXP group performed a similar program to that of the CON group, but with added band tension. To ensure comparable loading between groups, we measured the elastic coefficient of each power band to load the bars with comparable weight; 20% of load coming from the power bands, and the difference coming from the weight plates. This contention was followed for all major multi-joint exercises (see Table 1). After the intervention period, all baseline tests were repeated. Table 1. Example of prescribed bi-weekly intervention training program
Vertical Jump: Participants completed standing vertical jump (SVJ) which was assessed using a countermovement with arm swing. The test was conducted using the Vertec system (Power systems, USA). Participants began in an upright standing position and then proceeded to perform a fast counter movement downward, flexing at both the knees and hips. Immediately afterward, they proceeded to extend the knees and hips again to jump vertically as high up as possible, tapping the highest marker (24). Participants were expected to perform the vertical jump for a total of two trials, with a rest period of between 3-4 minutes between trials. The best trial was selected for further analysis.
Sprint Speed: A 40-m sprint test was employed with timing gates (Brower Timing System, Draper, Utah, USA) placed at the 0-m and 40-m marks. The test was performed on grass with participants wearing their respective soccer cleats. Participants were instructed to sprint the full 40-m as fast as possible, starting from a stationary staggered stance at a distance of 1-m behind the first set of timing gates. Two trials were recorded for each participant, separated by 3-4 minutes rest intervals (26). Sprint times were recorded to the nearest 0.01 second.
Agility: A specific zig-zag course of 20-m length was set out in 5-m sections, with cutting angles set at 100 degrees for each cone. This zig-zag course required participants to accelerate, decelerate, change direction and control the balance aspects associated with agility. Photocells (Bower, USA) were set at the beginning and end markers and were used to record the finishing times for each trial to the nearest 0.01 second. A total of two trials were performed, the best of which was selected for further analysis.
One-repetition maximum (1RM) Testing: The squat assessment was initiated with ten repetitions at 50% of their most recent squat 1RM. Participants would then perform five repetitions at 70%, three repetitions at 80% and one repetition at 90%. Participants would then perform a maximum of three single repetition sets each increasing in weight to determine the participants’ 1RM. A 3-4 minutes rest period was granted between warmup sets and a 5-6 minutes rest period was granted between 1RM attempts. The depth of each 1RM attempt was controlled so that the top of the thighs was parallel with the ground, as adjudicated by an
Int J Exerc Sci 13(4): 950-963, 2020
International Journal of Exercise Science http://www.intjexersci.com 954
experienced powerlifting judge. A 15-minute rest period was then given to allow for complete recovery and then the same procedure was repeated for the deadlift testing. For the deadlift, each 1RM attempt was controlled until the participant was standing fully erect with the shoulders pinned back (36, 42). Correct movement was adjudicated by an experienced powerlifting judge.
Statistical Analysis All data are presented as mean ± SD. Data were analyzed using analysis of covariance (ANCOVA) on change scores (post – pre), with group as the predictor variable, and pre-intervention data as the covariate to adjust for baseline values. Normality of the data were evaluated using the Shapiro-Wilk test. The ANVOCA effect sizes were expressed using partial eta-squared (&'(). In case of significant differences, post-hoc testing was completed using the post-hoc Tukey test, where effect sizes were evaluated using Cohen’s d which was interpreted on the following criteria: < 0.20 trivial; 0.20 – 0.49, small; 0.50-0.79, medium; and >0.8, large (19). Analyses were performed using Jamovi (The Jamovi Project, 2020, Version 1.2, [Computer Software], retrieved from https://www.jamovi.org), and significance was established a-priory at an alpha level of p < 0.05. RESULTS Within-group differences following the intervention were successful for substantially improving 1RM squat (CON wMdiff: 29.75 kg (31.57%); EXP wMdiff: 38.00 kg (34.61%)), 1RM deadlift (CON wMdiff: 18.13 kg (15.44%); EXP wMdiff: 17.78 kg (13.72%)), SVJ height (EXP wMdiff: 2.67 kg (6.35%)). Meaningful between-group differences were also present following the intervention, but only for 1RM squat (bMdiff: 23.96 kg (16.95%)). When post-intervention differences were controlled for in terms of baseline values (i.e. pre-intervention), only the increase in 1RM squat mass showed a meaningful between-group differences with a moderately large effect size (p = .037; &'( = .28). The main effect for the SVJ showed no meaningful between-group differences following the intervention (p = .055, &'( = .24) when controlled for baseline values, although the improvement for the EXP group (6.35%) was marginally larger than that of the CON group (4.15%). All ANCOVA results are shown in Table 2 for reference. Individual post-pre group data are presented in Figures 1-3.
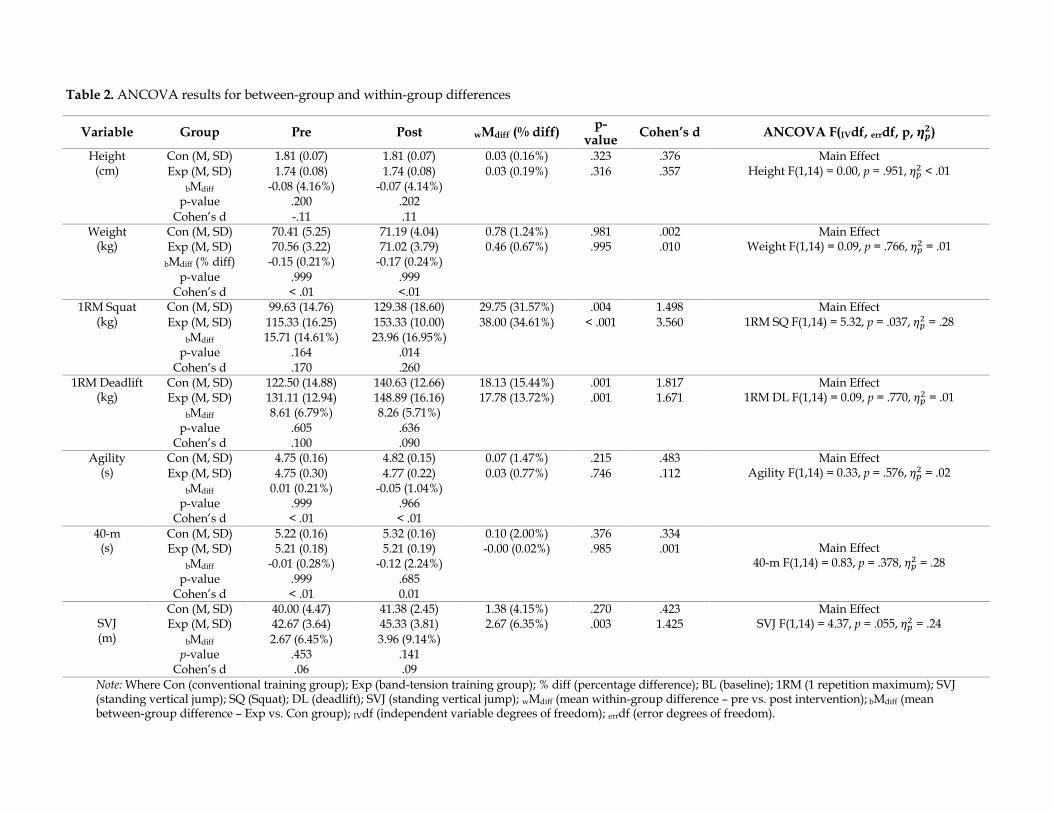
Table 2. ANCOVA results for between-group and within-group differences
Note: Where Con (conventional training group); Exp (band-tension training group); % diff (percentage difference); BL (baseline); 1RM (1 repetition maximum); SVJ (standing vertical jump); SQ (Squat); DL (deadlift); SVJ (standing vertical jump); wMdiff (mean within-group difference – pre vs. post intervention); bMdiff (mean between-group difference – Exp vs. Con group); IVdf (independent variable degrees of freedom); errdf (error degrees of freedom).
Variable Group Pre Post wMdiff (% diff) p-value Cohen’s d ANCOVA F(IVdf, errdf, p, !"#)
International Journal of Exercise Science http://www.intjexersci.com 956
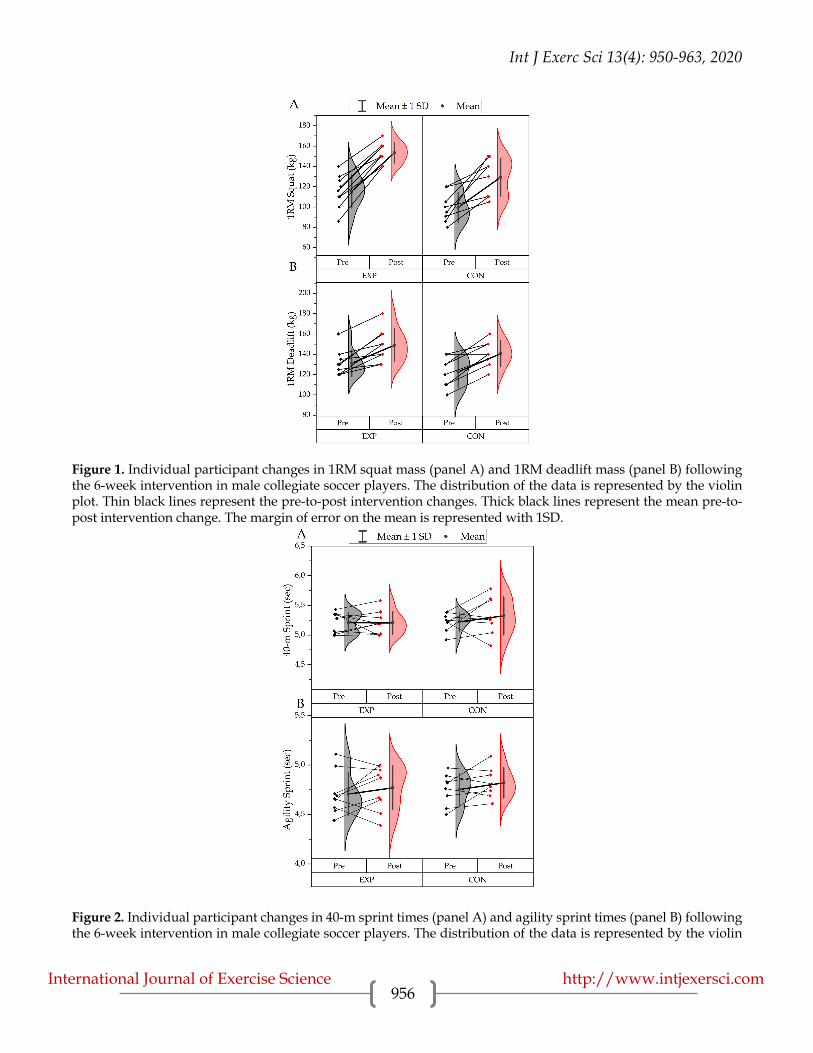
Figure 1. Individual participant changes in 1RM squat mass (panel A) and 1RM deadlift mass (panel B) following the 6-week intervention in male collegiate soccer players. The distribution of the data is represented by the violin plot. Thin black lines represent the pre-to-post intervention changes. Thick black lines represent the mean pre-to-post intervention change. The margin of error on the mean is represented with 1SD.
Figure 2. Individual participant changes in 40-m sprint times (panel A) and agility sprint times (panel B) following the 6-week intervention in male collegiate soccer players. The distribution of the data is represented by the violin
Int J Exerc Sci 13(4): 950-963, 2020
International Journal of Exercise Science http://www.intjexersci.com 957
plot. Thin black lines represent the pre-to-post intervention changes. Thick black lines represent the mean pre-to-post intervention change. The margin of error on the mean is represented with 1SD.
Figure 3. Individual participant changes in standing vertical jump height following the 6-week intervention in male collegiate soccer players. The distribution of the data is represented by the violin plot. Thin black lines represent the pre-to-post intervention changes. Thick black lines represent the mean pre-to-post intervention change. The margin of error on the mean is represented with 1SD. DISCUSSION The main findings of the present study showed that power-band resistance training, when compared to conventional free-weight training, produced meaningful results for improving maximal 1RM performance in the squat (CON: +31.57%, p =.004, d = 1.45; EXP: +34.61%, p < .001, d = 3.56), even when controlling for baseline between-group differences (p = .037, !"# = .28). Additionally, both power-band and free-weight resistance training produced comparably effective improvements in performance of the 1RM deadlift (CON: +15.44%, p = .001, d = 1.82; EXP: +13.72%, p = .001, d = 1.67), with no method proving to be more effective than the other (p = .770, !"# = .01). Marginal improvements were also noted for SVJ (CON: +4.15%, p = .270, d = .423; EXP: +6.35%, p = .003, d = 1.43), although no method proved to be superior to the other (p = .055, !"# = .24). The improvements in strength were independent of changes in body mass as no significant differences in body mass were observed following post-testing (CON: wMdiff: +1.24%, p = .981, d < .01; EXP: wMdiff: +0.67%, p = .995, d = .01). Thus, neural mechanisms and muscular innervation, such as adaptations in activation, synchronization, and rate coding, rather than muscular hypertrophy, seem the most likely reasons for the performance improvement of the strength variables (16, 33). Improved strength in the absence of muscular hypertrophy or added body mass is an expected finding especially in more novice lifters as improvements in strength, especially in the first 8-weeks of a strength training program, are typically ascribed to neural adaptations rather than changes in muscle cross-sectional areas (7, 16). Greater neuromuscular
Int J Exerc Sci 13(4): 950-963, 2020
International Journal of Exercise Science http://www.intjexersci.com 958
innervation and muscle fiber recruitment may allow for the activation of faster and more powerful muscle fibers (2).
According to Andersen et al., (1), it is well understood that neuromuscular adaptations are specific to the nature of the load imposed on the system during prolonged training periods and, as a result, it is conceivable that the unique load distribution characteristics during combined power-band resistance training could alter muscle recruitment patterns. Additionally, there is speculation about the ability of combined power-band resistance training to cause distinct fiber recruitment or adaptation patterns, due to its ability to increase muscular strength without obvious increases in lean body mass. More sophisticated imaging techniques and/or electromyographic (EMG) analyses would however be required to more definitively determine the mechanisms by which the obtained results could be achieved (2).
A definitive argument for the effectiveness of combined power-band training over free-weight resistance training is presently unclear, although it may, in part, be attributable to greater peak power and peak force production, with increases in velocity of eccentric muscular contraction due to the downward pull of the bands during the eccentric portion of the loading phase (42). According to Ghigiarelli, et al., (17), it is hypothesized that long-term training adaptations from this type of eccentric loading would result in increased muscular strength and impulse.
A primary factor that differentiates the two methods is that combined power-band training is characterized as having a lower initial lifting mass which progressively increases (due to coefficient of elasticity), thus exhibiting a lower inertia during the early phases of a lift. Performers can thus often achieve higher movement or contraction velocities while performing with an equivalent load and are forced to maintain constant muscular effort throughout a more complete range of motion (13). This may be since with conventional resistance training exercise the load is accelerated during muscle shortening until a sticking point of minimal leverage, and hence reduced movement speed, is reached. Once the sticking point is overcome, the force needed to complete the contraction becomes submaximal and the load will naturally decelerate. Alternatively, with combined power-band resistance the bar decelerates less through the full range motion because of increasing elastic resistance, which does not exist with free-weights alone. During power-band resistance training, it is likely that acceleration remains constant for a longer period during a repetition, which may result in different fiber recruitment compared to free-weight resistance training. Such a difference may contribute to a more favorable neuromuscular adaptation which may, in part, explain the results of the present study (1, 14, 21). As such, instead of the lifter exhibiting nervous system inhibition to decelerate the bar towards the end range of motion, the lifter continues to maximally recruit motor units until lockout is completed. The deceleration to stop the load at the end range of motion thus results from the increased mechanical load rather than the diminishing nervous system stimulus (37).
The results of this study show that power band training can elicit greater increases in strength, associated with improved 1RM performance in the squat, but that this increase in strength was not associated with improved straight-line sprinting times. This is at odds with findings by Wisløff et al., (43) who showed similar improvements in sprint speed due to accrued changes specifically in muscular strength. It is therefore feasible that the loading parameters elicited by band-tension training may allow for better force production through a greater range of motion,
Int J Exerc Sci 13(4): 950-963, 2020
International Journal of Exercise Science http://www.intjexersci.com 959
as well as higher contraction velocities due to the higher movement speeds and longer force application times required by band-tension training. Stated differently, the force-velocity relationship dictates that lower loads allow for greater movement/contraction speeds, and conversely that higher loads lead to slower contraction velocities (13). To elicit improvements in sprinting speeds as a function of increases in lower body strength, as related to the present study, lower loads and faster movement times may have been necessary to increase the straight-line sprinting speeds.
There is evidence that there are strong correlations between the one repetition maximum squat and power during countermovement vertical jumping (4, 40). The present study demonstrated that combined power-band resistance training appeared to produce marginally better improvements in vertical jump height compared to conventional methods (CON: +4.15%; EXP: +6.35%). This may be due to the nature of power-band training in eliciting improvements in the rate of force production, by allowing for force production through a greater range of motion. The power-band training may also allow for an enlarged capacity for higher contraction velocity development (13), which when coupled with the specificity of training may also play a role in performance improvement given that vertical jumping mechanics tend to mimic the mechanics of squatting (20). Further research in this regard is warranted, especially with larger sample sizes and across more varied sports. No significant differences were observed between conventional strength training and combined power-band training in their ability to improve agility of subjects in the present study (p = .576, !"# = .02). These findings align with those of other studies which have also shown that straight-line sprinting is not related to agility or maximal strength development (6, 43). Thus, it cannot be inferred that the apparent relationship between strength and straight-line sprinting can be extended to agility (44). Such a finding suggests that agility may arguably be more dependent on coordinative aspects of performance as opposed to any pure strength or neuromuscular variables (36). Other forms of training, such as multi-directional movements or force application, may therefore need to be considered to elicit agility-specific improvements, although the exact combination of exercises and training volumes would need to be more carefully considered. Recent studies have found that combined power-band training produced greater advances in strength when compared to traditional barbell training alone (1, 17, 30, 42). The present study added to the present literature by showing that combined power-band training proved to be more effective in increasing lower extremity strength compared to conventional strength training for the 1RM squat (p = .037, !"# = .28), although both methods elicited comparable muscular strength gains in the 1RM deadlift (p = .770, !"# = .01). The reason that power-band method was not more effective than the conventional method in increasing deadlift strength may partially be due to the loading parameters used in the present study. The loading percentage from the bands for both the squat and the deadlift was kept at 20% (i.e. approximately 20% of the total load on the bar came from the tension in the bands). It is therefore feasible that such loading may need to be reconsidered for future studies whereby higher or lower percentage loads may prove to be more effective for deadlift-specific movements. Elastic loading has been shown to lead to higher eccentric loading which, when performed at high intensities, has been associated with greater improvements in total and eccentric strength
Int J Exerc Sci 13(4): 950-963, 2020
International Journal of Exercise Science http://www.intjexersci.com 960
compared with concentric training (35). Multi-directional movement patterns in combination with power-band training should also be considered, given the link between movement specificity and sport-specific movement patterns such as agility and rapid changes of direction. Future studies should also focus on the long-term effectiveness of combined power-band training compared with conventional strength training for strength and power exercises. Coaches and researchers alike will need to have an appreciation for the potential advantages and disadvantages of each resistance type to develop a mixed-method training strategy to best suit the particular velocity, force- and momentum-related demands of the sport and athlete. Clearly more research in this field and its links to both performance enhancements and injury prevention need to be considered for the strength and conditioning coach and various sporting codes.
Conclusion: The results indicate that both power band and conventional training are effective methods for improving strength, and to some extent lower body explosiveness, despite differences in the loading mechanism. When using power bands to supplement strength training it is important to be cognizant of the loading offered by different bands as well as the different anthropometric profiles of athletes so that programming can be conducted in an accurate and objective manner. The latter point is important given that band loading is proportional to band deformation, which in turn is proportional to athlete height and/or limb length. ACKNOWLEDGEMENTS We would like to thank the coaches, Mr. Wayne Ivason and Ms. Jayde Howitz, for their willingness, enthusiasm and support for the research. We would also like to thank all the participants for their hard work, effort and dedication to both sport and research. REFERENCES 1. Anderson CE, Sforzo GA, Sigg JA. The effects of combining elastic and free weight resistance on strength and
power in athletes. J Strength Cond Res 22(2): 567-574, 2008.
2. Ataee J, Koozehchian MS, Kreider RB, Zuo L. Effectiveness of accommodation and constant resistance training on maximal strength and power in trained athletes. Peer J 2: e441, 2014.
3. Bloomfield J, Polman R, O’Donoghue P. Physical demands of different positions in FA Premier League soccer.
J Sport Sci Med 6: 63-70, 2007. 4. Carlock JM, Smith SL, Hartman MJ, Morris RT, Ciroslan DA, Pierce KC, Stone MH. The relationship between
vertical jump power estimates and weightlifting ability: a field-test approach. J Strength Cond Res 18(3): 534–539, 2004.
5. Castellano J, Blanco-Villasenor A, Alvarez D. Contextual variables and time-motion analysis in soccer. Int J
Sport Med 32: 415-421, 2011.
Int J Exerc Sci 13(4): 950-963, 2020
International Journal of Exercise Science http://www.intjexersci.com 961
6. Chaouachi A, Brughelli M, Chamari K, Levin GT, Abdelkrim NB, Laurencelle L, Castagna C. Lower limb maximal dynamic strength and agility determinants in elite basketball players. J Strength Cond Res 23(5): 1570-1577, 2009.
7. Chelly MS, Fathloun CM, Ben Amar N, Tabka Z, Van Praagh E. Effects of a back squat training program on leg
power, jump, and sprint performances in junior soccer players. J Strength Cond Res 23(8): 2241-2249, 2009. 8. Clarsen B, Myklebust G, Bahr R. Development and validation of a new method for the registration of overuse
injuries in sports injury epidemiology: the Oslo sports trauma research center (OSTRC) overuse injury questionnaire. Br J Sports Med 47: 495-502, 2012.
9. Cronin J, McNair PJ, Marshall RN. The effects of bungy weight training on muscle function and functional
performance. J Sports Sci 21(1): 59-71, 2009. 10. Cunniffe B, Practor W, Baker JS, Davies B. An evaluation of the physiological demands of elite rugby union
using global positioning system tracking software. J Strength Cond Res 23(4): 1195-1203, 2009. 11. Delaney JA, Scott TJ, Ballard DA, Duthie GM, Hickmans JA, Lockie RG, Dascombe BJ. Contributing factors to
change-of-direction ability in professional rugby league players. J Strength Cond Res 29(10): 2688-2696, 2015. 12. Delecluse C. Influence of strength training on sprint running performance current findings and implications
for training. Sports Med 24(3): 147-156, 1997. 13. Frost DM, Bronson S, Cronin JB, Newton RU. Changes in maximal strength, velocity, and power after 8 weeks
of training with pneumatic or free weight resistance. J Strength Cond Res 30(4): 934-944, 2015. 14. Frost DM, Cronin JB, Newton RU. A comparison of the kinematics, kinetics, and muscle activity between
pneumatic and free weight resistance. Eur J Appl Physiol 104(6): 937-956, 2008. 15. Frost DM, Cronin JB, Newton, RU. A biomechanical evaluation of resistance fundamental concepts for training
and sports performance. Sports Med 40(4): 303-326, 2010. 16. Gardiner PF. Advanced neuromuscular exercise physiology. Champaign, IL: Human Kinetics; 2011. 17. Ghigiarelli J, Nagle E, Gross F, Robertson R, Irrgang J, Myslinski T. The effects of a 7-week heavy elastic band
and weight chain program on upper-body strength and upper-body power in a sample of division 1-AA football players. J Strength Cond Res 23(3): 756-764, 2009.
18. Gorostiaga EM, Izquierdo M, Ruesta M., Iribarren J, Gonzalez-Badillo JJ, Ibáñez, J. Strength training effects on
physical performance and serum hormones in young soccer players. Eur J Appl Physiol 91(5): 698–700, 2004. 19. Gravetter FJ, Wallnau LB. Statistics for the behavioral sciences. 8th ed. Belmont, CA: Cengage; 2009. 20. Grimshaw P, Lees A, Fowler N, Burden A. Sport and exercise biomechanics. New York, NY: Taylor and Francis;
2007. 21. Hales ME, Johnson BF, Johnson JT. Kinematic analysis of the powerlifting style squat and the conventional
deadlift during competition: is there a cross-over effect between lifts? J Strength Cond Res 29(9): 25-29, 2009. 22. Hawley JA. Specificity of training adaptation: time for a rethink? J Physiol 586(Pt. 1): 1-2, 2008. 23. Komi P. Strength and power in sport. 2nd ed. Oxford, UK: Wiley-Blackwell; 2002.
Int J Exerc Sci 13(4): 950-963, 2020
International Journal of Exercise Science http://www.intjexersci.com 962
24. Kotzamanidis C, Chatzopoulos D, Michailidis C, Papaiakovou G, Patikas, D. The effect of a combined high-intensity strength and speed training program on the running and jumping ability of soccer players. J Strength Cond Res 19(2): 396-375, 2005.
their contribution to injury, prevention, rehabilitation, and sport. J Orthop Sports Phy Ther 33: 557-571, 2003. 26. Little T, Williams AG. Specificity of acceleration, maximum speed, and agility in professional soccer players. J
Strength Cond Res 19(1): 76-78, 2005. 27. Mohr M., Krustrup P, Bangsbo J. Match performance of high-standard soccer players with special reference to
development of fatigue. J Sports Sci 21: 519-528. 2004. 28. Navalta JW, Stone WJ, Lyons, TS. Ethical issues relating to scientific discovery in exercise science. Int J Exerc
Sci, 12(1): 1-8, 2019. 29. Paton CD, Hopkins WG, Vollebregt L. Little effect of caffeine ingestion on repeated sprints in team-sport
athletes. Med Sci Sports Exerc. 33(5): 822-825, 2001. 30. Prejean S, Judge LW, Patrick TJ, Bellar D. Acute effects of combined elastic and free-weight tension on power
in the bench press lift. Sport J 15: 1, 2012. 31. Reardon C, Tobin DP, Delahunt E. Application of individualized speed thresholds to interpret position specific
running demands in elite professional rugby union: a GPS study. PLoS One 10(7): e0133410, 2015. 32. Reilly T, Morris T, Whyte G. The specificity of training prescription and physiological assessment: a review. J
Sports Sci 27(6): 575-589, 2009. 33. Rhea MR, Kenn JG, Dermody BM. Alterations in speed of squat movement and the use of accommodated
resistance among college athletes training for power. J Strength Cond Res 23(9): 2645–2650, 2009. 34. Rienzi E, Drust B, Reilly T, Carter JE, Martin A. Investigation of anthropometric and work-rate profiles of elite
South American international soccer players. J Sports Med Phys Fit 40(2): 162-169, 2000. 35. Roig M, O’Brien K, Kirk G, Murray R, McKinnon P, Shadgan B, Reid W. The effects of eccentric versus
concentric resistance training on muscle strength and mass in healthy adults: a systematic review with meta-analysis. Br J Sports Med 43(8): 556-568, 2009.
36. Sheppard JM, Young WB, Doyle TL, Sheppard TA, Newton RU. An evaluation of a new test of reactive agility
and its relationship to sprint speed and change of direction speed. J Sci Med Sport 9(4): 342–349, 2006. 37. Shoepe TC, Ramirez DA, Rovetti RJ, Kohler DR, Almstedt HC. The effects of 24 weeks of resistance training
with simultaneous elastic and free weight loading on muscular performance of novice lifters. J Hum Kinet 29: 93-106, 2011.
38. Silva JR, Nassis GP, Rebelo A. Strength training in soccer with a specific focus on highly trained players. Sports
Med Open 1: 17, 2015. 39. Stølen T, Chamari K, Castagna C, Wisløff U. Physiology of soccer: an update. Sports Med 35(6): 501-536, 2005. 40. Stone M, O’Bryant H, McCoy L, Coglianese R, Lehmkuhl M, Schilling B. Power and maximum strength
relationships during performance of dynamic and static weighted jumps. J Strength Cond Res 17(1): 140–147, 2003.
Int J Exerc Sci 13(4): 950-963, 2020
International Journal of Exercise Science http://www.intjexersci.com 963
41. Thompson BJ, Stock MS, Shields JE, Luera MJ, Munayer IK, Mota JA, Olinghouse KD. Barbell deadlift training increases the rate of torque development and vertical jump performance in novices. J Strength Cond Res 29(1): 1-10, 2015.
42. Wallace BJ, Winchester JB, McGuigan MR. Effects of elastic bands on force and power characteristics during
the back squat exercise. J Strength Cond Res 20(2): 268-272, 2006. 43. Wisløff U, Castagna C, Helgerud J, Jones R, Hoff J. Strong correlation of maximal squat strength with sprint
performance and vertical jump height in elite soccer players. Br J Sports Med 38(3): 285–288, 2004. 44. Young WB, McDowell MH, Scarlett BJ. Specificity of sprint and agility training methods. J Strength Cond Res