Page 1
RAPID COMMUNICATION
Effects of contact resistance on the evaluation of charge carriermobilities and transport parameters in amorphous zinc tin oxidethin-film transistors
Leander Schulz • Eui-Jung Yun • Ananth Dodabalapur
Received: 4 March 2014 / Accepted: 7 April 2014 / Published online: 23 April 2014
� Springer-Verlag Berlin Heidelberg 2014
Abstract Accurate determination of the charge transport
characteristics of amorphous metal-oxide transistors
requires the mitigation of the effects of contact resistance.
The use of additional electrodes as voltage probes can
overcome contact resistance-related limitations and yields
accurate charge carrier mobility values, trap depths and
temperature and carrier density dependencies of mobility
as well as trap depths. We show that large differences in
measured charge carrier mobility values are obtained
when such contact resistances are not factored out. Upon
exclusion of the contact resistance, the true temperature
dependence of charge carrier mobility appears in the form
of two clearly distinct mobility regimes. Analyzing these
revealed mobility regions leads to a more accurate
determination of the underlying transport physics, which
shows that contact resistance-related artefacts yield
incorrect trends of trap depth with gate voltage, poten-
tially leading to a misconstruction of the charge transport
picture. Furthermore, a comparison of low- and high-
mobility samples indicates that the observed effects are
more general.
1 Introduction
Transparent amorphous oxide semiconductors are
actively investigated for a range of applications
including sensors [4], memristors [18], active matrix
displays [21] and flexible electronics [11, 19]. The
active semiconductor materials can be deposited by a
variety of methods such as sputtering [8], pulsed laser
deposition [3], ink-jet printing [13], and other types of
solution-processing [14]. Electrical characterization of
these materials usually involves the fabrication of thin-
film transistor (TFT) structures which are then tested for
their linear and saturation characteristics, from which
key parameters such as the field-effect mobility, sub-
threshold swing and their temperature dependencies can
be evaluated.
One of the most promising amorphous oxide semicon-
ductors is solution-processable [7, 14, 22] zinc tin oxide
(ZTO) whose charge carrier mobilities can exceed 25 cm2/
Vs [2, 15, 20].
In this letter we report on the detailed current-voltage
characteristics of ZTO-based thin-film transistors (TFT)
and on the importance of gated 4-terminal measurements
as they reveal otherwise hidden energy and transport
regimes. A comparison of 2-terminal and 4-terminal
measurements shows that factoring out the effects of
contact resistance from the electrical measurement can be
vitally important in identifying the various trap-release
energy regimes, especially when the involved energy
values are small.
L. Schulz (&) � E.-J. Yun � A. Dodabalapur
Microelectronics Research Center, The University of Texas at
Austin, Austin, TX 78758, USA
e-mail: [email protected]
A. Dodabalapur
e-mail: [email protected]
Present Address:
L. Schulz
School of Physical Science and Technology, Sichuan University,
Chengdu, Sichuan 610064, China
Present Address:
E.-J. Yun
College of IT Engineering and Department of System Control
Engineering, Hoseo University, Asan, Choongnam 336-795,
South Korea
123
Appl. Phys. A (2014) 115:1103–1107
DOI 10.1007/s00339-014-8422-3
Page 2
2 Results and discussion
We characterized the devices at various temperatures in the
range 69–330 K and extracted trap release energies. We
employ the term trap release energy instead of activation
energy as it more accurately describes the physical pro-
cesses in this system. To analyze data from these mea-
surements, we apply a charge transport model that is
applicable to ZTO and related amorphous oxide materials.
We compare measurements of a field-effect transistor
(FET) with a conventional 2-terminal configuration and
one that includes additional electrodes to factor out the
effects of contact resistance (4-terminal). The additional
electrodes are necessary to accurately characterize trans-
port in the linear regime of device operation. This config-
uration also allows for the correct determination of the trap
energies values as more than one energy regime is
revealed.
A bottom gate, top contact device structure was
employed, consisting of a platinum (Pt) gate, zirconium
dioxide (ZrO2) gate insulator, ZTO semiconductor and
patterned aluminum electrodes, and is illustrated in Fig. 1a.
The substrates on which these devices were constructed
were p-type silicon wafers. The detailed device fabrication
process has already been reported [14, 16].
The channel length, L, and width, W, of the TFTs are 75
and 750 lm, respectively. The two voltage probes, V1 and
V2 reach 10 lm into the channel from the source/drain and
result in an effective channel length, Leff = 30 lm. These
two additional electrodes are symmetrically located in the
channel with respect to the source and drain electrodes.
Such a configuration is ideally suited to evaluate the linear
characteristics of the transistor. The carrier density varia-
tion between these additional electrodes is relatively small,
allowing us to make a very reasonable assumption that the
carrier density is approximately constant. This is especially
true for small, applied source-drain biases. Measurements
involving the use of these additional electrodes V1 and V2
are designated 4-terminal (4T) measurements, whereas
measurements that involve only the source and drain (apart
from the gate) are designated as two-terminal (2T) mea-
surements. All measurements were performed with a
Desert Cryogenics Cryoprobe station at a pressure of the
order of 10-4 mbar. Typical room temperature output
characteristics are shown in Fig. 1b.
b 1.0
0.8
0.6
0.4
0.2
0.07
I DS (
µA)
VG10 V
9.5 V . . . .0.0 V
VDS (V)
a
PtZrO2
ZTO
S D
Leff
L
V1 V2
6543210
Fig. 1 a Schematic structure of the sample: Pt = platinum (gate),
ZrO2 = zirconium dioxide (gate dielectric), ZTO = zinc tin oxide and
Al = aluminum. The probes V1 and V2 were used to measured the
potential difference within the channel and thereby avoiding the
contact resistance and other issues at the electrode-ZTO interface.
The effective channel length, L, reduces to Leff. b Typical output
characteristics of a ZTO TFT
0.020
0.015
0.010
0.005
0.0002T LIN
0.14
0.12
0.10
0.08
0.06
0.04
0.02
0.00
67 K 132 K 70 K 141 K 73 K 150 K 76 K 160 K 79 K 170 K 82 K 181 K 85 K 192 K 90 K 212 K 95 K 233 K 102 K 254 K 109 K 275 K 116 K 300 K 124 K 330 K
2T SATµ 4
T, L
IN (
cm2 /V
s)µ 2
T, L
IN (
cm2 /V
s)µ 2
T, S
AT (
cm2 /V
s)
0.30
0.25
0.20
0.15
0.10
0.05
0.00
7654321
4T LIN
VG - VON (V)
a
b
c
Fig. 2 Device mobilities at different temperatures calculated as
explained in the text for the low mobility sample. a The 2T saturation
mobility, b the 2T linear mobility, and c 4T linear mobility. The
temperature dependences are similar. Note that l4T�lin [l2T�sat [l2T�lin
1104 L. Schulz et al.
123
Page 3
The transfer curves were measured in the linear region
employing the 2T and 4T configurations at VDS = 1 V
values. The saturation characteristics, which are less sen-
sitive to the potential drops at the source and drain elec-
trodes, were measured in the 2T configuration at
VDS = 7 V. From these transfer curves, the mobilities
under different conditions are determined.
In the case of the 2T measurements, the 2T linear
mobility, l2T�lin, where the difference of the gate voltage and
the onset voltage, VG-VON, is[VDS, is given by: [10, 23]
l2T�lin ¼oIDS
oVG
L
W
1
CZrO2
1
VDSð1Þ
IDS and CZrO2ð210 nF/cm2 [16]) are the current between drain
and source, and the capacitance per unit area of the ZrO2
dielectric. If VG � VON\VDS, then the device operates in the
saturation mode and the mobility is calculated from: [10]
l2T�sat ¼offiffiffiffiffiffiffi
IDS
p
oVG
� �
2L
W
1
CZrO2
ð2Þ
For the 4T measurements, only the voltage difference
within the effective channel is considered, thereby
excluding the contact resistance at the aluminum-ZTO
interfaces. This leads to a modification of the standard FET
linear regime mobility equation and can be expressed as:
l4T�lin ¼oIDS
oVG
Leff
W
1
CZrO2
1
ðV2 � V1Þð3Þ
The different device mobilities described above are shown
in Fig. 2 as a function of VG � VON for temperatures
ranging from 69 K to 330 K. The applied gate voltage, VG,
was corrected by the onset voltage, VON, at which the
mobile carriers start to accumulate in the channel, to ensure
that the temperature dependence of the mobilities is
accurately determined [10, 15, 23].
The linear and saturation mobility values increase with
temperature as shown in Fig. 2. The room temperature 2T
linear and saturation mobilities are approximately 0.02 and
0.14 cm2/Vs, respectively, and are considerably lower than
the 4T linear mobility of 0.25 cm2/Vs. The difference
between 2T linear and saturation mobilities can be
explained by the different average electric fields in the
channel in the linear and saturation regimes. Under satu-
ration, the higher drain-source voltages result in improved
charge carrier injection from the electrodes and a larger
measured mobility value, whereas in the linear regime,
contact resistance effects reduce the measured mobility
considerably. Use of the 4T configuration factors out the
influence of contact resistance on the measured mobility
and hence we get the highest mobility values at a given
temperature. It must also be noted that the average charge
carrier density in the channel in the linear regime is higher
than in the saturation regime for a given gate voltage,
which leads to higher measured mobilities when contact
resistance effects are absent. Similar observations have
been reported for InGaZnO FETs by Abe et al. and Jeong
et al. [1, 9].
In many small channel length TFTs, the linear mobility
values determined with the conventional 2T methods are
significantly underestimated because of the high contact
resistance at the metal-semiconductor interface. This leads
to a large disparity between the 2T linear and saturation
mobility. This is often the case in other TFTs where contact
resistance plays a key role, such as organic TFTs. After
correcting for contact resistance, the linear mobility
increases steadily with gate voltage before saturating or
decreasing slightly at the highest gate voltages. The latter
behavior is also observed in TFTs with other semicon-
ductor active layers and is attributed to the charge carriers
being drawn closer to the interface with the gate insulator.
Interfacial roughness and enhanced trapping at the inter-
face can lead to lower mobilities [6, 17]. The increasing
mobility with carrier density is one of the signatures of
multiple trap and release (MTR) type transport [12].
0.18
0.16
0.14
0.12
0.10
141210864
1000/T (1/K)
4T LIN
ETR = 6.9±0.2 meV
Regime 1 Regime 2
µ 4T
, LIN
(cm
2 /Vs)
µ 2T
, LIN
(cm
2 /Vs)
EC
E
N(E)
tail states
N2D
EF,2
EF,1
b
a0.015
0.014
0.013
0.012
2T LIN
ETR = 3.4±0.2 meV
Fig. 3 a The 2T linear and b 4T linear mobility as a function of
reciprocal temperature for VG - VON = 1 V. Once the contact
resistance has been factored out, two distinct regimes appear
Effects of contact resistance 1105
123
Page 4
The MTR model describes the behavior of charge car-
riers close to the mobility edge, an energy threshold that
separates localized and extended states [12]. The inset of
Fig. 3a illustrates the schematic energy versus the density
of states, N(E), near the conduction band edge, EC, of a
semiconductor. A two-dimensional density of states is
assumed, since the channel electrons are confined to a few
nm thick layer. The band tail states represent the localized
states. For charge carriers that are excited from the local-
ized states into the extended states beyond EC, the tem-
perature-dependent mobilities are calculated using Fermi-
Dirac statistics:
leff /1
1þ eETR=kBTð4Þ
where ETR ¼ EC � ET is the energetic difference between
the mobility edge and the trap energy. It is very important
to employ Fermi-Dirac statistics in calculating trap depths,
when the trap depths are lower than kBT : Use of Boltzmann
statistics can lead to substantial errors.
In addition to the large difference between the values of
the linear 2T and 4T mobilities, the comparison of the
temperature-dependent mobility for a given voltage, VG -
VON, also demonstrates the importance of 4T measurements
in the determination of the energies involved in charge
transport. Fig. 3a shows the 2T linear mobility for VG -
VON = 5 V. The 2T linear mobility monotonically decrea-
ses as the temperature decreases. A typical approach [7, 15]
would be to apply an exponential function or Fermi-Dirac
statistics (Eq. 4) to fit the data and extract the trap release
energies as indicated by the dashed line. However, the
contact resistance can hide the true temperature dependence
of the mobility. Equivalent to Fig. 3a, Fig. 3b shows the 4T
linear mobility as a function of the inverse temperature for
VG - VON = 5 V. It is clear that two distinct mobility
regimes appear; a nearly constant regime and a thermally
activated regime, denoted as regime 1 and regime 2. The
slope of the thermally activated regime (regime 2) represents
again the trap release energy. In semiconductors such as
ZTO, however, the trap energies are very small, and con-
sequently ETR are calculated using Fermi-Dirac statistics
(Eq. 4) instead of the Boltzmann approximation. Since the
trap release energy, ETR, of 6.9 ± 0.2 meV is relatively low,
most charge carriers spend a considerable fraction of time in
the conduction band. Similar trap energies near 10 meV
below EC have been reported for ZTO by using a modulated
photocurrent measurement technique [5]. The nearly con-
stant mobility regime is likely due to a very large density of
electronic states close to the conduction band edge. The
corresponding energy value is too small to be determined
but is less than 1 meV.
Figure 4 shows the trap depths as a function of
VG - VON for both the 2 and 4-terminal configurations.
8
6
4
2
76543
4-Terminal 2-Terminal
Fermi-Dirac statistics
VG - VON (V)
E T
R (
meV
)
Fig. 4 Trap-release energies, ETR, determined using the Fermi-Dirac
distribution function for the 2T and 4T configurations
7
6
5
4
3
2
µ 4T
,Lin (
cm2 /V
s)
1210864
1000/T (1/K)
VDS = 5.5 V: ETR = 10.1±0.7 meVVDS = 4.5 V: ETR = 15±1 meV
1.4
1.2
1.0
0.8
0.6
0.4
µ 2T
,Lin (
cm2 /V
s)
VDS = 1.5 VVG - VON
4.5 V 5.0 V5.5 V 6.0 V6.5 V 7.0 V
a
b
Fig. 5 The 2T and 4T linear mobility for a sample with higher
mobility than the sample described in Fig. 3
1106 L. Schulz et al.
123
Page 5
The trap depth is approximately constant for the 4T con-
figuration, possessing a value of 6–7 meV. The trap depths
evaluated from the 2T configuration monotonically
decreases, with increasing gate voltage, from 7 meV to
below 2 meV. This misleading trend has its origin in an
artefact arising from the contact resistance. With increasing
gate voltage, the contact resistance decreases leading to
enhanced drain currents. This effect is stronger at lower
temperatures, and is responsible for the apparent decrease
in trap depth with increasing gate voltage. It would be very
easy to conclude from the 2T characteristics that the trap
depth decreases because the Fermi level is moving signif-
icantly closer to the conduction band edge. This would
result in erroneous interpretation of the transport charac-
teristics. This example underlines the importance of mak-
ing artefact-free measurements when evaluating charge
transport phenomena in these amorphous oxide TFTs.
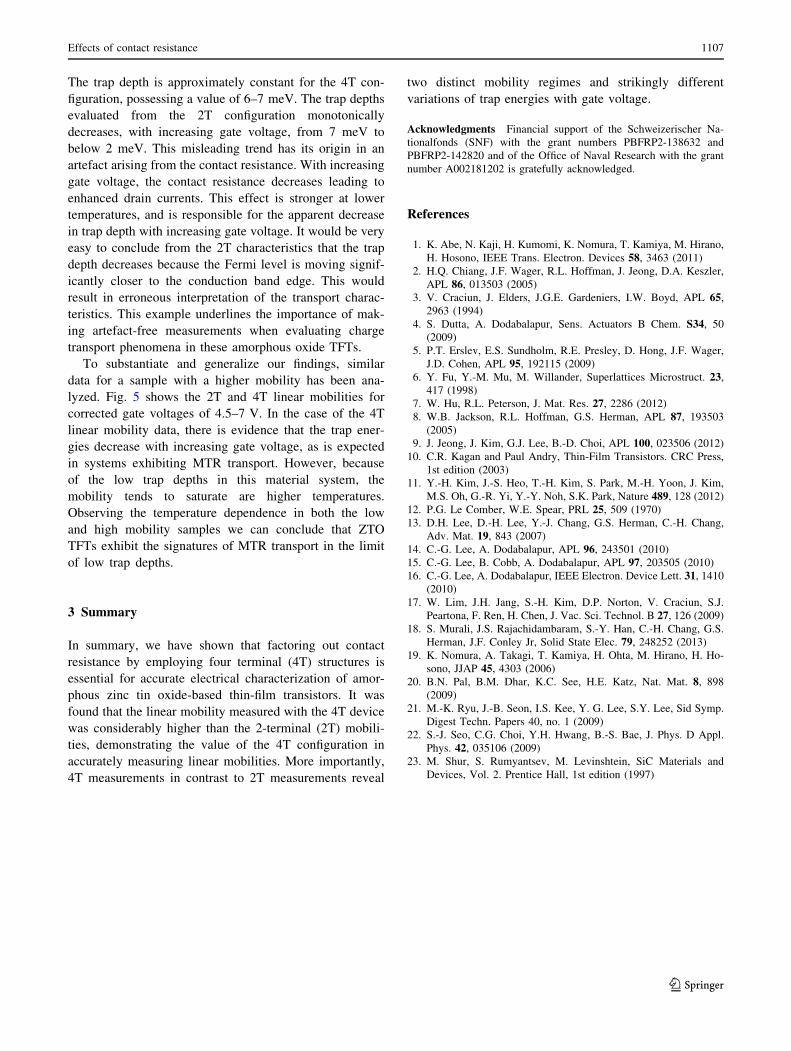
To substantiate and generalize our findings, similar
data for a sample with a higher mobility has been ana-
lyzed. Fig. 5 shows the 2T and 4T linear mobilities for
corrected gate voltages of 4.5–7 V. In the case of the 4T
linear mobility data, there is evidence that the trap ener-
gies decrease with increasing gate voltage, as is expected
in systems exhibiting MTR transport. However, because
of the low trap depths in this material system, the
mobility tends to saturate are higher temperatures.
Observing the temperature dependence in both the low
and high mobility samples we can conclude that ZTO
TFTs exhibit the signatures of MTR transport in the limit
of low trap depths.
3 Summary
In summary, we have shown that factoring out contact
resistance by employing four terminal (4T) structures is
essential for accurate electrical characterization of amor-
phous zinc tin oxide-based thin-film transistors. It was
found that the linear mobility measured with the 4T device
was considerably higher than the 2-terminal (2T) mobili-
ties, demonstrating the value of the 4T configuration in
accurately measuring linear mobilities. More importantly,
4T measurements in contrast to 2T measurements reveal
two distinct mobility regimes and strikingly different
variations of trap energies with gate voltage.
Acknowledgments Financial support of the Schweizerischer Na-
tionalfonds (SNF) with the grant numbers PBFRP2-138632 and
PBFRP2-142820 and of the Office of Naval Research with the grant
number A002181202 is gratefully acknowledged.
References
1. K. Abe, N. Kaji, H. Kumomi, K. Nomura, T. Kamiya, M. Hirano,
H. Hosono, IEEE Trans. Electron. Devices 58, 3463 (2011)
2. H.Q. Chiang, J.F. Wager, R.L. Hoffman, J. Jeong, D.A. Keszler,
APL 86, 013503 (2005)
3. V. Craciun, J. Elders, J.G.E. Gardeniers, I.W. Boyd, APL 65,
2963 (1994)
4. S. Dutta, A. Dodabalapur, Sens. Actuators B Chem. S34, 50
(2009)
5. P.T. Erslev, E.S. Sundholm, R.E. Presley, D. Hong, J.F. Wager,
J.D. Cohen, APL 95, 192115 (2009)
6. Y. Fu, Y.-M. Mu, M. Willander, Superlattices Microstruct. 23,
417 (1998)
7. W. Hu, R.L. Peterson, J. Mat. Res. 27, 2286 (2012)
8. W.B. Jackson, R.L. Hoffman, G.S. Herman, APL 87, 193503
(2005)
9. J. Jeong, J. Kim, G.J. Lee, B.-D. Choi, APL 100, 023506 (2012)
10. C.R. Kagan and Paul Andry, Thin-Film Transistors. CRC Press,
1st edition (2003)
11. Y.-H. Kim, J.-S. Heo, T.-H. Kim, S. Park, M.-H. Yoon, J. Kim,
M.S. Oh, G.-R. Yi, Y.-Y. Noh, S.K. Park, Nature 489, 128 (2012)
12. P.G. Le Comber, W.E. Spear, PRL 25, 509 (1970)
13. D.H. Lee, D.-H. Lee, Y.-J. Chang, G.S. Herman, C.-H. Chang,
Adv. Mat. 19, 843 (2007)
14. C.-G. Lee, A. Dodabalapur, APL 96, 243501 (2010)
15. C.-G. Lee, B. Cobb, A. Dodabalapur, APL 97, 203505 (2010)
16. C.-G. Lee, A. Dodabalapur, IEEE Electron. Device Lett. 31, 1410
(2010)
17. W. Lim, J.H. Jang, S.-H. Kim, D.P. Norton, V. Craciun, S.J.
Peartona, F. Ren, H. Chen, J. Vac. Sci. Technol. B 27, 126 (2009)
18. S. Murali, J.S. Rajachidambaram, S.-Y. Han, C.-H. Chang, G.S.
Herman, J.F. Conley Jr, Solid State Elec. 79, 248252 (2013)
19. K. Nomura, A. Takagi, T. Kamiya, H. Ohta, M. Hirano, H. Ho-
sono, JJAP 45, 4303 (2006)
20. B.N. Pal, B.M. Dhar, K.C. See, H.E. Katz, Nat. Mat. 8, 898
(2009)
21. M.-K. Ryu, J.-B. Seon, I.S. Kee, Y. G. Lee, S.Y. Lee, Sid Symp.
Digest Techn. Papers 40, no. 1 (2009)
22. S.-J. Seo, C.G. Choi, Y.H. Hwang, B.-S. Bae, J. Phys. D Appl.
Phys. 42, 035106 (2009)
23. M. Shur, S. Rumyantsev, M. Levinshtein, SiC Materials and
Devices, Vol. 2. Prentice Hall, 1st edition (1997)
Effects of contact resistance 1107
123