Proceedings of 2013 IAHR World Congress ABSTRACT:This study investigates the effect of contraction length on abutment scour morphology, the surface velocity field and maximum scour depth. A series of experiments wereconducted in a tilting flume (45-m long and 1.5-m wide) with uniform coarse sand (d 50 = 0.84-mm). The models representing the long and short contractions wereequivalent to vertical-wall abutments. The results of four groups of experiments are presented (two experiments per group), covering eight possible combinations of varying contraction ratio, contraction length and flow intensity. An ultrasonic depth-sounder, a Flow Tracker Acoustic Doppler Velocimeter and Particle Tracking Velocimetry (PTV) were used to obtain equilibrium scour depths, detailed bed-scour contours around the abutment and two-dimensional surface velocity fields. Results show that contraction length has only a small effect on maximum scour depth and equilibrium bed morphologies. In addition, the surface velocity fields for both initial plane bed and equilibrium scour condition are similar for long and short contractions. The need for additional experiments, investigating approach channel geometry and geotechnical stability, is emphasized. KEY WORDS:Abutment scour, Contraction length, Bed-morphology,Maximum scour depth,Surface velocity field. 1 INTRODUCTION After decades of bridge scour research, estimates of scour depth still vary substantially. This variability is due to the innate complexity of the flow, combined with site-specific approach geometries and boundary materials. Sturm et al. (2011) presented a clear delineation of the dominant variables governing abutment scour.However, the full influences of some variables are still unclear and the innate complexity could result in some secondary variables being poorly defined. As river flow passes around a bridge abutment, the streamlines converge due to channel contraction and then diverge after passing through it. Over more than half a century, the contracting process has been theoretically explained and physically modeled, based on the idealized long contraction theory of Straub (1934) and Laursen (1960, 1963);the major difference in their solutions lies in the contraction ratios used. Komura (1966) and Webby (1984) defined a long contraction as having at least the same length as the width of the un-contracted upstream channel. In reality, however, abutments are often only as wide as bridge decks. Bridge decks can range from single lane to multi-lane; nevertheless, for many bridge designs, abutment widths are narrow compared with upstream channel width. Contraction scour and local scour have been widely accepted as interdependent processes, and usually occur concurrently,although displaying different magnitudes (Chang and Davis 1998, Chang and Davis 1999). Schreider et al. (2001) investigated the interaction between abutment scour and contraction scour atrelief bridges in a flood plain. Their results revealed that contraction scour depth could be drastically reduced by the co-existence of abutment scour process, and that the abutment scour develops Effects of Contraction Length on Abutment Scour Xiaozhou Xiong PhD student, Auckland University, Auckland 1142, New Zealand. Email: [email protected]Bruce W. Melville Professor, Dept. of Civil and Environmental Engineering, Auckland Univ., Auckland 1142, New Zealand. Email:[email protected]Heide Friedrich Lecturer, Dept. of Civil and Environmental Engineering, Auckland Univ., Auckland 1142, New Zealand. Email:[email protected]
Transcript
Proceedings of 2013 IAHR World Congress
ABSTRACT:This study investigates the effect of contraction length on abutment scour morphology, the surface velocity field and maximum scour depth. A series of experiments wereconducted in a tilting flume (45-m long and 1.5-m wide) with uniform coarse sand (d50 = 0.84-mm). The models representing the long and short contractions wereequivalent to vertical-wall abutments. The results of four groups of experiments are presented (two experiments per group), covering eight possible combinations of varying contraction ratio, contraction length and flow intensity. An ultrasonic depth-sounder, a Flow Tracker Acoustic Doppler Velocimeter and Particle Tracking Velocimetry (PTV) were used to obtain equilibrium scour depths, detailed bed-scour contours around the abutment and two-dimensional surface velocity fields. Results show that contraction length has only a small effect on maximum scour depth and equilibrium bed morphologies. In addition, the surface velocity fields for both initial plane bed and equilibrium scour condition are similar for long and short contractions. The need for additional experiments, investigating approach channel geometry and geotechnical stability, is emphasized. KEY WORDS:Abutment scour, Contraction length, Bed-morphology,Maximum scour depth,Surface velocity field. 1 INTRODUCTION
After decades of bridge scour research, estimates of scour depth still vary substantially. This variability is due to the innate complexity of the flow, combined with site-specific approach geometries and boundary materials. Sturm et al. (2011) presented a clear delineation of the dominant variables governing abutment scour.However, the full influences of some variables are still unclear and the innate complexity could result in some secondary variables being poorly defined.
As river flow passes around a bridge abutment, the streamlines converge due to channel contraction and then diverge after passing through it. Over more than half a century, the contracting process has been theoretically explained and physically modeled, based on the idealized long contraction theory of Straub (1934) and Laursen (1960, 1963);the major difference in their solutions lies in the contraction ratios used. Komura (1966) and Webby (1984) defined a long contraction as having at least the same length as the width of the un-contracted upstream channel. In reality, however, abutments are often only as wide as bridge decks. Bridge decks can range from single lane to multi-lane; nevertheless, for many bridge designs, abutment widths are narrow compared with upstream channel width.
Contraction scour and local scour have been widely accepted as interdependent processes, and usually occur concurrently,although displaying different magnitudes (Chang and Davis 1998, Chang and Davis 1999). Schreider et al. (2001) investigated the interaction between abutment scour and contraction scour atrelief bridges in a flood plain. Their results revealed that contraction scour depth could be drastically reduced by the co-existence of abutment scour process, and that the abutment scour develops
Bruce W. Melville Professor, Dept. of Civil and Environmental Engineering, Auckland Univ., Auckland 1142, New Zealand. Email:[email protected]
Heide Friedrich Lecturer, Dept. of Civil and Environmental Engineering, Auckland Univ., Auckland 1142, New Zealand. Email:[email protected]
faster than the contraction scour. However, the opposing relationship, i.e. the effect of contraction scour on abutment scour, has rarely been studied and the effect is still not clear. Briaud et al. (2005) extended the cohesive soils-erosion function apparatus (SRICOS-EFA) method to the case of contraction scour in fine-grained soils. Their results from flume tests showed that the maximum scour depth is not influenced by the contraction length Lc, when it is between 0.5 and 6.8 times the contracted channel width Bc. The results of numerical simulations by Briaud et al. (2005) showed that the maximum initial shear stress along the centerline of the channel is insensitive to the contraction length, except for very small contraction lengths, in which case the maximum initial shear stress decreases. Their results also showed that when Lc /Bc is smaller than 0.25, the maximum scour depth is much larger than for larger Lc/Bc values, with the same hydrodynamic and geometric conditions. Hager (1985) and Wu and Molinas (2001), both theoretically and experimentally, verified the effects of the relative contraction length L*, whereL* = Lc /B (B is the approach channel width). The analysis of Wu and Molinas showed that the discharge coefficient is affected up to 6% by L*, because contraction length increase causes higher energy losses within the contracted reach. Kohli and Hager (2001) demonstrated that for contraction lengths Lc between 0.02 and 0.30-m (channel width 1-m), the effect of contraction length can be determined without an effect on the maximum scour depth.
This paper presents the results of a comparison of the effects of long and short contraction on local scour around solid vertical abutments in a rectangular sand-bed channel. The objective of this paper is to determine the effect of contraction length on flow features around the abutment and on the associated abutment scour depth. Two-dimensional velocity fields, for both the plane-bed and scoured bed condition and equilibrium scour contours are presented and discussed.
2 EXPERIMENTAL SETUP AND MEASUREMENT
The experiments were conducted in a 1.54-m wide, 1.2-m deep and 45-m long recirculating flume in the Fluid Mechanics Laboratory at The University of Auckland. A sheet metal false floor was placed along the length of the flume at a height of 0.4-m. The flume is supported on two steel I-beams that are centrally pivoted, allowing the slope of the flume to be adjusted. Starting at 30-m downstream from the inlet section, a sand recess of 4.5-m length is located. The sand used in the experiments is uniform with a median size d50 = 0.84-mm and geometric standard deviation σg = 1.35.
Vertical wall abutments were attached to the true left side of the flume. The abutment models were box shaped and were made of perspex. The models were fastened to the flume wall, near the middle of the sand recess length, ensuring that at least a 1.5-m long sand reach extended upstream from the abutment.
The flume discharge was controlled by two pumps with speed controllers. For any particular setting of the speed controllers, average velocities were assumed to be the same in comparative experiments, as long as the water level remained the same. The water level was controlled by a flexible overflow pipe, placed at the outlet of the flume. Both the upstream and downstream water levels stabilized within 5-mm limits, when the backwater effect wore off. Wave skimmers at the inlet section suppressed surface waves, and uniform flow was produced for this series of experiments.
Point velocity was measured using a Flow Tracker Handheld-ADV, which can measure velocities as low as 0.001-m/s. The ADV was fixed in a moveable carriage above the flume.The average flow velocity U in the flume was measured at least 2-m upstream from the abutment. Particle Tracking Velocimetry (PTV) was used to obtain two-dimensional surface velocity field measurements (van Ballegooy 2005). The particles used were plastic balls of uniform size (D = 6.5-mm) and were painted fluorescent-yellow. The particles were illuminated under ultra-violet lights, to obtain strong light intensity for the camera. Barrel distortion in the images was small and not taken into account in image processing. For surface velocity measurements in experiments with a plane-bed condition, a sand-coated aluminum plate was used, having the same size sand.
Scour-depth development and the equilibrium bed surface around the abutment were measured using an ultrasonic depth sounder attached to an equipment trolley, which is mounted on the top rails of the flume walls. Scour depth measurements were recorded for the duration of the experiments, until equilibrium scour depth was reached.Equilibrium was assumed to have occurred when the 24-hour scour depth increase was less than or equal to 5% of water depth, i.e. 5-mm (Coleman et al. 2003).
2
Four groups of experiments were performed (two experiments per group), covering eight possible combinations, resulting from variation of contraction ratio (i.e., abutment length), contraction length (i.e., abutment width) and flow intensity (Table 1). Each group has a wide abutment (Lc = 1100-mm) experiment and a narrow abutment (Lc = 50-mm) experiment. Within each group, the velocities in the two experiments were approximately equal.
Us: relatively small velocity; Ul: relatively large velocity; H: water depth; Abutment length direction is perpendicular to the water flow; Contraction length direction is parallel to the water flow
3 RESULTS AND DISCUSSION 3.1 Bed morphologies in equilibrium
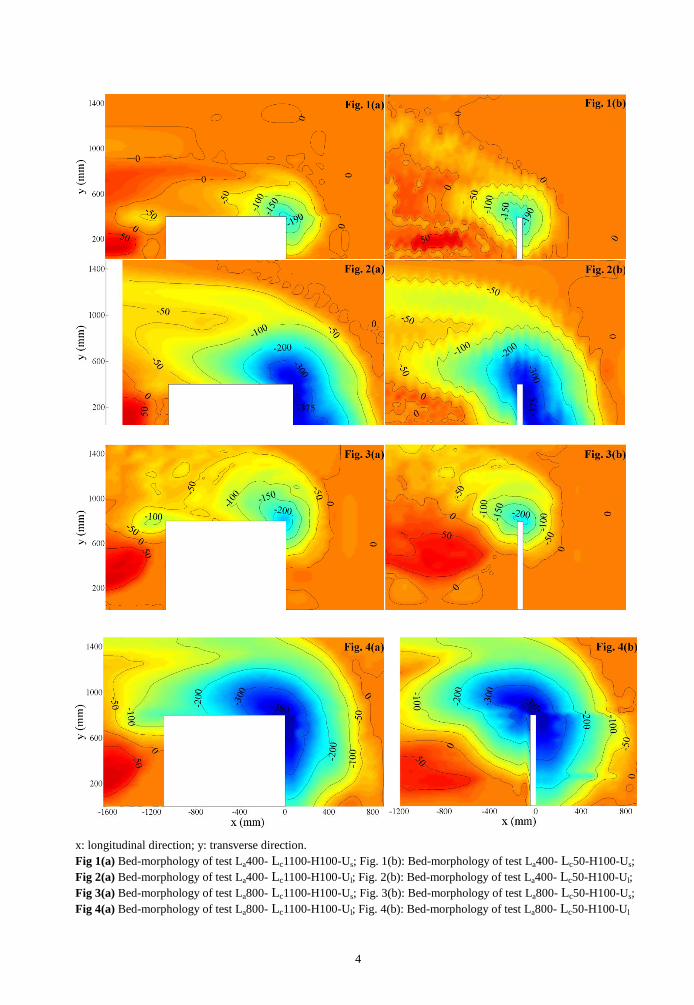
Figures 1 to 4 show the bed morphologies in equilibrium state for the four groups of experiments.All the scour holes resemble frustums of inverted circular or elliptical cones, centered on the upstream corner of the abutments, with the shapes partially interrupted by the abutments themselves. Eroded bed material was transported mainly to the downstream side of the abutment, forming an elongated bank close to the flume wall.
For Group 2 and 4 experiments, with near threshold velocity (Figs. 2 and 4), the deepest scour holes progressively moved from the corner towards the channel wall before equilibrium was reached. An elongated elliptical scour hole, about 50-mm wide and 150-mm long, formed, extending transversally from the upstream abutment tip towards the true left bank. The suggested explanation is that, for these experiments, the scour agent changed from locally contracted flow and turbulence to downflow and the principal vortex. As was similarly observed by Kwan (1984), sand ridges were formed at the interface between the principal vortex and the secondary vortex (Figs. 2 and 4). It should be noted that the sand ridges have similar shapes for long and short contraction lengths.
For Group 1 experiments, with smaller velocity and smaller lateral contraction (Figs. 1(a) and 1(b)), the sand bed at the true right side of the flume remained intact throughout the experiments, because flow was highly contracted locally around the abutment. For Group 2 experiments with larger velocity, but the same lateral contraction as Group 1 (Figs. 2(a) and 2(b)), erosion outside the hole was initially absent, but gradually spread across the whole section for both short and long contraction lengths. In contrast, for Group 4 experiments (Figs. 4(a) and 4(b)), which had both larger velocity and more severe lateral contraction, general erosion was observed during the initial phase of the experiments.
3
x: longitudinal direction; y: transverse direction. Fig 1(a) Bed-morphology of test La400- Lc1100-H100-Us; Fig. 1(b): Bed-morphology of test La400- Lc50-H100-Us; Fig 2(a) Bed-morphology of test La400- Lc1100-H100-Ul; Fig. 2(b): Bed-morphology of test La400- Lc50-H100-Ul; Fig 3(a) Bed-morphology of test La800- Lc1100-H100-Us; Fig. 3(b): Bed-morphology of test La800- Lc50-H100-Us; Fig 4(a) Bed-morphology of test La800- Lc1100-H100-Ul; Fig. 4(b): Bed-morphology of test La800- Lc50-H100-Ul
4
Two other interesting findings are: 1. A comparison of Group 1 and Group 3 results (Figs. 1 and 3) shows that the scour holes for the
smaller and larger contractions (La = 400-mm and 800-mm, respectively) have similar pattern and extent. The more severe contraction (Group 3) generated deeper scour holes, but the true left extent of these scour holes just reached 400-mm, which is similar to the extent of the Group 1 scour holes.
2. For the long contraction experiments in Groups 1 and 3 (smaller velocities), Figures 1a and 3a show that at the downstream corner of the wide abutment, relatively shallow scour holes were generated, attributed to wake vortices and flow divergence.
Above all, the most noteworthy finding is that, for all four combinations of lateral contraction and flow velocity, the final morphologies of the scour holes were insensitive to contraction length. With close velocities within each group of experiments, the shape and extent of the sour holes are quite similar to each other. 3.2 Surface velocity field 3.2.1 Surface velocity field for the plane bed condition
Figures 5(a) and 5(b) are the plane bed surface velocity field obtained from PTV software, Streams 2.00(Nokes 2012), for large velocity, large contraction (La = 800-mm), and long and short contraction, respectively (Group 4 in Table 1). These diagrams show the typical acceleration patterns resulting from physical contraction in width.The principal features of the surface flow for a narrow abutment, in plane bed condition, and with U approximately equal to 0.6 times critical threshold velocity Uc (partiallybased on Figure 5(b) and partially on laboratory observation), are:
1. a small slowly circulating anticlockwise eddy upstream of the abutment,which is more like a stagnant water region;
2. laterally converging streamlines that do not diverge until about 3m downstream from the abutment;
3. intensive flow turbulence just downstream of the abutment nose; 4. a small clockwise circulating eddy just downstream of the abutment; 5. a much larger-scale eddy downstream near the bank. For higher velocity, U 0.9Uc, transverse contraction and turbulence were more significant but the
two small eddies immediately upstream and downstream of the abutment (1. and 4. above) were too feeble to notice. In addition, the large eddy downstream of the abutment moved further downstream and became weaker because of the inertia effect. The flow pattern of the wider abutment has features similar to those of the narrow abutment (as above); the only noticeable difference is a large scale reverse eddy by the abutment side face (abutment side face here is the plane parallel to the flume wall, Figure 5(a)). Flow in the immediate vicinity of the abutment side face is characterized by a current in the direction opposite to the approach flow direction. It is worth noting that in the plane bed condition, the backwater effect was pronounced.For U 0.9Uc, the water level just upstream of the abutment was 120-mm and the water level just downstream was 80-mm. The water level difference diminished after about 24 hours, at which time the scour hole developed to about 70% of its equilibrium depth.
Figures 5(a) and 5(b) show that, in general, the flow field is indistinguishable for the long and short contraction experiments. Regardless of contraction length, mass transfer after the contracted reach is very small in consequence of the inertia phenomenon. The small amount of mass transfer could be attributed to pressure difference between stagnant subsections and high velocity subsections.
Figures 6(a) and 6(b) show the streamwise velocity u and transverse velocity v distribution curves at different y (transverse) values for the Group 4 experiments in the plane bed condition, for which surface velocity vectors are shown in Figure 5. The reference velocities ur and vr are the average streamwise and transverse surface velocity components at x=750-mm, respectively. Here, because of the important backwater effects and intensive contraction at the initial stage, the surface velocity components upstream (x = 750-mm)are more representative than mean velocity as the reference values. Except for streamlines close to the abutment (800-mm < y < 850-mm, around Sections D), the streamwise velocity from x = 750-mm to x = −500-mm at Sections A (y= 1400-mm), B (y= 1200-mm) andC (y= 1000-mm) reached up to
≈
≈
5
2.75 times (section B) the reference velocity, and then gradually reduced after x = −500-mm. The surface velocities after x = −1375-mm could not be covered by the camera, but their values do not affect the findings reported in this paper. It is obvious from Figure 6(a) that this acceleration pattern is almost the same for both contraction lengths in this study.
For the narrow abutment, at Section D (y = ~830-mm), streamwise velocity fell to almost zero at x = −50-mm (at the downstream corner of the abutment) and then started to increase. In contrast, for the wider abutment at Section D, velocity close to the abutment side face changed direction at x = −50-mm and maintained a small value (about 58-mm/s) till the downstream corner of the abutment.
Figure 6(b) shows that transverse velocities on Sections D diverted the most and velocities on Sections A the least. Again, regardless of contraction length, transverse velocities at different sections decreased to zero around x = −500-mm and leveled off with small negative values, i.e., with or without lateral restraint, flow started to diverge 500-mm downstream of the abutment's upstream corner and maintained a stable but small transverse velocity. For the narrow abutment, it appears that there was a water wall acting just like a wide abutment, preventing lateral mass and energy transport.
From the discussions above, for the un-scoured state, surface velocity fields for the long and the short contraction experiments have very high similarity. The accelerated water body did not diverge significantly till about 3 meters (this value dependent on contraction ratio and approaching velocity) after the obstruction, rendering the contraction length effect secondary or even non-contributing.
The experimental results of Lim and Nugroho (2004) lend support to the assumption that shear stress distribution is similar to the surface velocity field (the velocity profile was reasonably well represented by a log-law relationship in their work). The validity of this assumption was afterwards verified in the main channel of a flume by van Ballegooy (2005). Thus, for both the wide and narrow abutments, the driving force of erosion, i.e., shear stress acting on sediment, is similar, resulting in similar equilibrium bed morphologies and maximum scouring depths (discussed in the next part).
For small flow velocities, inertia phenomena were less significant than near threshold ones. However, laboratory observation and the equilibrium bed morphologies in Figures 1 and 3 are still enough to demonstrate that contraction length has little effect for small velocity experiments.
Figure 5(a) Surface velocity pattern around 1100 mm-wide abutment before scour, La800- Lc1100-H100-Ul
-1200 -800 -400 0 400
200
600
1000
1400
x (mm)
y (m
m)
400mm/s
A
B
D
C
6
Figure 5(b) Surface velocity pattern around 50 mm-wide abutment before scour, La800- Lc50-H100-Ul
Red lines correspond to 1100-mm wide abutment; black lines correspond to 50-mm wide abutment
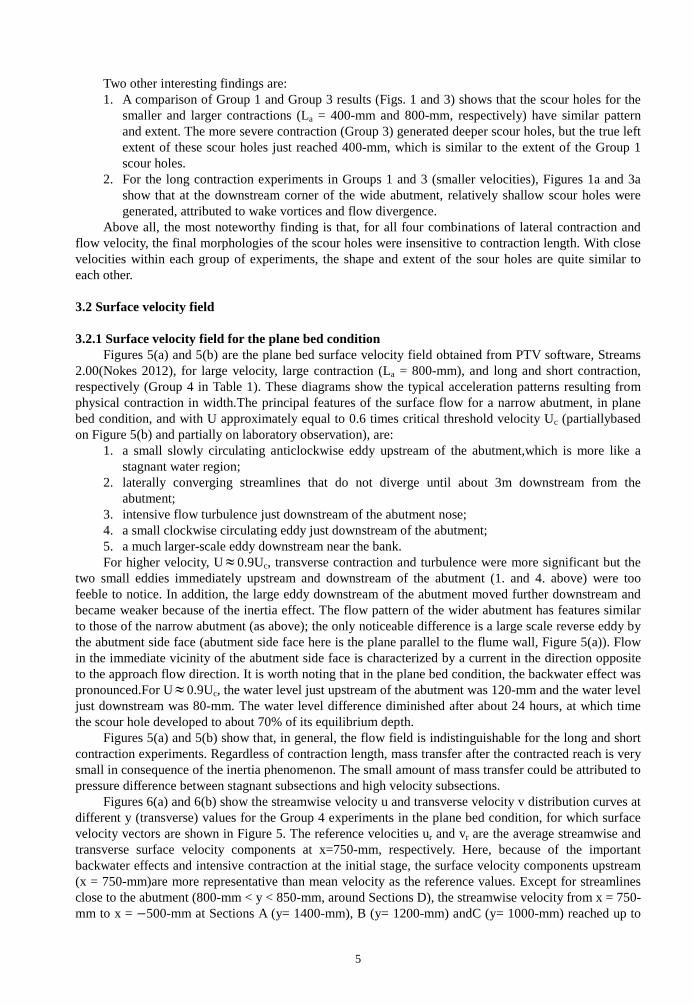
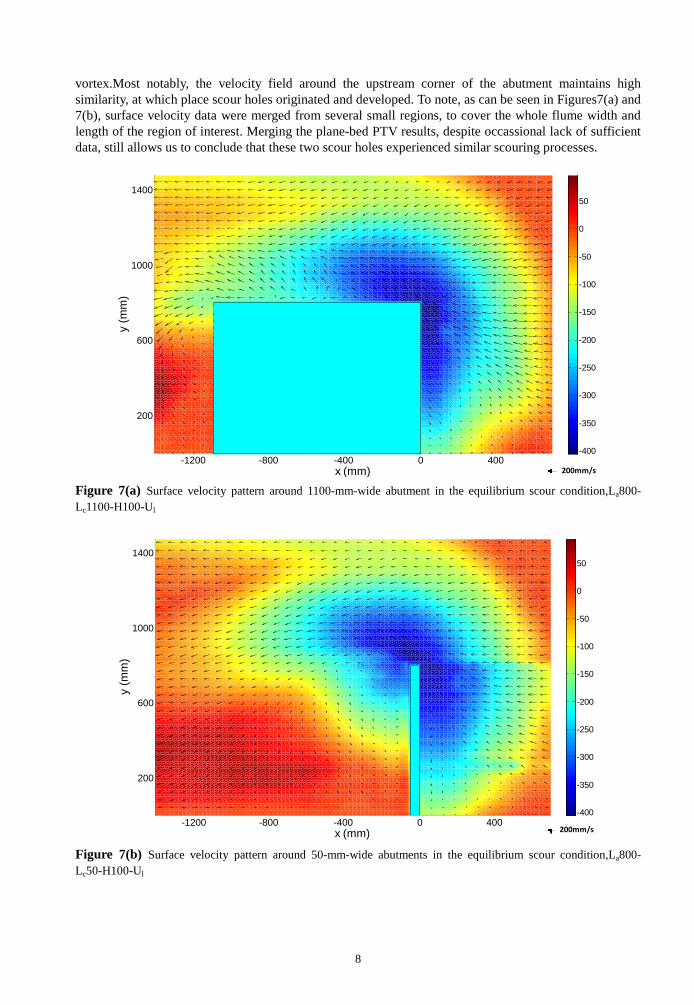
3.2.2 Surface velocity field in the equilibrium condition Figures 7(a) and 7(b) show after-scour bed morphologies superimposed with the surface velocity
fields, for the same long and short contraction experiments (Group 4) as in the previous subsection. As shown in Figure 7(a), velocity vectors from both sides of the approach section converged to the
middle of the conctracted channel. In the conctracted section of the channel, centered at the point x = −800-mm, y = 900-mm, the predominant feature in the flow field is a rectangular shaped area where lateral velocity is so significant that flow lines are almost perpendicular to the center line of the flume. In addition to this, laboratory observation shows that upward flow exists along the side face of the abutment, indicating an open-end lee eddy in this area. The vortex rotating longitudinally (with a horizontal axis pointing downstream) near the middle of the side face of the abutment described above might be attributed to subsurface flux from the other side of the flume; alternatively, or in addition, it might be attributed to the existence of the sand ridge. After passing the bluff body, because of shallower water depth resulting from sand deposition, the flow turns towards the flume wall to which the abutment is attached, and its velocity increases to larger than that of the approach flow.
By comparison, as shown in Figure 7(b), the velocity field is quite similar to that ofthe long contraction one, except for weaker transverse velocity near the true right side of the channel, weaker diverging flow once through the abutment downstream corner and little evidence of stream-wise
-1200 -800 -400 0 400
200
600
1000
1400
x (mm)
y (m
m)
400mm/s
A
B
C
D
-1
0
1
2
3
-1500 -1000 -500 0 500 1000
u/u r
Longitudinal direction (mm)
A
B
C
D
A
B
C
D-2
-1
0
1
2
3
4
5
6
-1500 -1000 -500 0 500 1000
v/v r
Longtitudinal direction (mm)
A
B
C
D
A
B
C
D
7
vortex.Most notably, the velocity field around the upstream corner of the abutment maintains high similarity, at which place scour holes originated and developed. To note, as can be seen in Figures7(a) and 7(b), surface velocity data were merged from several small regions, to cover the whole flume width and length of the region of interest. Merging the plane-bed PTV results, despite occassional lack of sufficient data, still allows us to conclude that these two scour holes experienced similar scouring processes.
Figure 7(a) Surface velocity pattern around 1100-mm-wide abutment in the equilibrium scour condition,La800- Lc1100-H100-Ul
Figure 7(b) Surface velocity pattern around 50-mm-wide abutments in the equilibrium scour condition,La800- Lc50-H100-Ul
-1200 -800 -400 0 400
200
600
1000
1400
x (mm)
y (m
m)
-400
-350
-300
-250
-200
-150
-100
-50
0
50
200mm/s
-1200 -800 -400 0 400
200
600
1000
1400
x (mm)
y (m
m)
-400
-350
-300
-250
-200
-150
-100
-50
0
50
200mm/s
8
3.3 Equilibrium scour depth As discussed above, for average velocity lower than 220-mm/s (Us), the location of the maximum
scour, ds, always occurred at the upstream corner of the abutment, while for average velocity larger than 280-mm/s (Ul), the ellipse-shaped deepest area moved toward the bank along the upstream face of the abutment. For the lower velocity experiments, the scouring process was mainly sensitive to a principal vortex and locally contracted flow, and the downflow was a less significant component. In contrast, for the higher velocity experiments, deepest scouring area stretched 150-mm from the abutment toe towards the left bank, where downflow still contributes the most. For 1<La/H<25 Melville suggests the characteristic length scale is (LaH)0.5 (Melville 1992). The data are insufficient to obtain a relationship between the contraction length and the scour depth. As shown in Table 2, when the relative contraction length L* changes from 0.03 (= 50/1540) to 0.71 (= 1100/1540), the maximum non-dimensional scour depth due to contraction length effect changes by less than 10% (Group 3), which is in accordance with the results of Wu and Molinas (2001) and Kohli and Hager (2001). The effect is so subtle that the correction factor for the effect of contraction length is suggested as 1.1 when Lc/Bc is as small as 0.04. Compared to the fine-grained soil experimental results of Briaud et.al (2005), our results indicate that even when Lc/Bc is much smaller than 0.25, increasing the predicated maximum scouring values is not necessary for a sand river-bed.
Table2 Maximum scour depth
Test La400-Lc1100
-H100-Us
La400- Lc50
-H100-Us
La400- Lc1100
-H100-Ul
La400- Lc50
-H100-Ul
La800- Lc1100
-H100-Us
La800- Lc50
-H100-Us
La800- Lc1100
-H100-Ul
La800- Lc50
-H100-Ul U
(mm/s) 214 210 304 290 214 172 304 281
(mm)
194 195 378 377 238 212 411e 394
1.56 1.60 2.15 2.24 1.36 1.50 1.65 1.71
e: the scour hole reached to the bottom and the scour depth was extrapolated with the surrounding slope with Matlab. 4 CONCLUSIONS
A secondary effect on local abutment scour was studied experimentally using an ultrasonic depth-sounder, a Flow Tracker Hand-held Acoustic Doppler Velocimeter and Particle Tracking Velocimetry (PTV). At the initial state of the scouring process, the velocity field is slightly affected by contraction length. Regardless of contraction length, velocity components are similar in the proximity of the abutment. A change of velocity direction was also observed for the initial state. Velocity in the transverse direction is weak along and after the contracted section, indicating a low level of lateral water flux. At the equilibrium scour state, a large scale vortex (with a downstream-pointing horizontal axis) near the middle of the contracted reach was observed for the long contraction experiment. Surface velocity is relatively uniformly distributed because of discharge redistribution after erosion, and the velocity field around the scour hole is similar in both the long and short contraction experiments. In the four groups of comparative experiments with contraction length as the main variable, results reveal less than 10% of difference in the non-dimensional scour depth. The results suggest that abutment scour is insensitive to contraction length and the correction factor for the effect of contraction length is suggested as 1.1 when Lc/Bc is as small as0.04, otherwise, the factor is suggested as 1.0.
Since the data are insufficient to make a firm conclusion that the contraction length effect is negligible, further experiments are necessary to verify the present observations on a wider variety of contraction lengths, foundation shapes, and approach channel geometries. Bankline abutments in compound channels and contraction length in practical range of bridge widths are of particular interest. Also, attention should be given to contraction length effect on the erodible embankments with rip-rap or other counter-measures.
sd
s c
a
d UUL H⋅
9
ACKNOWLEDGEMENT The first author wants to acknowledge the support from CSC (China Scholarship Council). Also, the valuable suggestions from Keith Adams are appreciated. References Briaud, J. L., Chen, H. C., Li, Y., Nurtjahyo, P., Wang, J., 2005. SRICOS-EFA method for contraction scour in fine-
grained soils. Journal of Geotechnical and Geoenvironmental Engineering 131(10), 1283-1294. Chang, F. and Davis, S., 1998. Maryland SHA procedure for estimating scour at bridge abutments, part 2-clear water
scour. Proc. of Water Resources Engineering, '98, ASCE, Memphis, TN,pp.169-173. Chang, F. and Davis, S., 1999. MarylandSHA procedure for estimating scour at bridge waterways, part1 - live bed
scour. In Stream Stability and scour at Highway Bridges, (Eds) Richardson, E. and Lagasse, P., American Society of Civil Engineers, Reston VA, pp 401-4011.
Coleman, S. E., Lauchlan,C. S., Melville, B.W., 2003. Clear-water scour development at bridge abutments. Journal of Hydraulic Research 41(5), 521-531.
Hager, W. H. and Dupraz,P. A., 1985. Discharge characteristics of local, discontinuous contractions (Durchfluss-Charakteristika von lokalen, diskontinuierlichen Verengungen). Journal of Hydraulic Research Vol. 23, 421-433.
Komura, S., 1966. Equilibrium depth of scour in long constrictions. Journal of the Hydraulics Division, A.S.C.E., 92(HY5).
Kohli, A. and Hager, W. H., 2001. Building scour in floodplains Proceedings of the ICE - Water and Maritime Engineering 148, 61-80 DOI: 10.1680/wame.2001.148.2.61
Kwan, T. F., 1984. Study of abutment scour. Report No. 328, School of Engineering, The University of Auckland, Auckland, New Zealand.
Laursen, E. M., 1960. Scour at bridge crossings. Journal of the Hydraulics Division, A.S.C.E. 86(2), 39-54. Laursen, E. M., 1963. An analysis of relief bridge scour. J. Hydr. Div 89(3), 93-118. Lim, S. Y. and Nugroho, J., 2004. Observations on Flow Field around an Abutment in a Two-stage Channel.
Proceedings of the 2nd International Conference on Scour and Erosion, Singapore 1, 156-164. Melville, B., 1992. Local Scour at Bridge Abutments. Journal of Hydraulic Engineering 118(4), 615-631. Sturm, T. W., Ettema, R., and Melville, B., 2011. Evaluation of Bridge-Scour Research: Abutment and Contraction
Scour Progresses and Prediction. Final Report, NCHRP Project 24-27(02), Transportation Research Board, The National Academies Washington, DC.
Nokes, R. I., 2012. Streams Version 2.00. Department of Civil Engineering, University of Canterbury, New Zealand Schreider, M., G. Scacchi, C. R., Felipe,F., 2001. Contraction and Abutment Scour in Relief Bridges in a Flood Plain.
Wetlands Engineering & River Restoration 2001, 1-12. Straub, L. G., 1934. Effect of channel contraction works upon regimen of moveable bed streams. Trans. American
Geophysical Union, part II. Van Ballegooy, S., 2005. Bridge abutment scour countermeasures. Ph.D. thesis, The Univ. of Auckland, Auckland,
New Zealand. Webby, M. G., 1984. The Effect of Entrance Shape on the Depth of Clear Water Scour at a Contraction, Report 3-86/2,
Central Laboratories, Ministry of Works and Development, Lower Hutt, New Zealand. Wu, B. and Molinas, A., 2001. Choked Flows through Short Contractions. Journal of Hydraulic Engineering 127(8),