Effects of dietary hatchery by-products on growth performance, relative organ weight, plasma measurements, immune organ index, meat quality, and tibia characteristics of broiler chickens
Won Jun Choi1, Jong Hyuk Kim1, Gi Ppeum Han1, Chan Ho Kwon1, and Dong Yong Kil1,*
Objective: The objective of the current study was to investigate the effects of dietary hatchery by-products (HBPs) as a replacement of fish meal (FM) on growth performance, relative organ weight, plasma measurements, immune organ index, meat quality, and tibia charac-teristics of broiler chickens.Methods: A total of 720 broiler chickens (3 d of age) were randomly allotted to 1 of 9 treat-ments with 8 replicates. Each replicate consisted of 5 male and 5 female birds. The basal diet was formulated to contain 5.0% commercial FM, whereas eight treatment diets were prepared by replacing 25%, 50%, 75%, or 100% of FM in the basal diet with infertile eggs (IFE) or a mixture of various HBPs (MIX); therefore, the inclusion levels of IFE or MIX in the experimental diets were 1.25%, 2.50%, 3.75%, or 5.00%. The diets and water were provided on an ad libitum basis for 32 d. Results: Increasing inclusion levels of IFE as a replacement of FM in diets had no effects on growth performance, plasma measurements, immune organ index, and tibia charac-teristics of broiler chickens. Increasing inclusion levels of IFE in diets increased (linear, p<0.05) meat lightness (L*) but decreased (linear, p<0.05) meat redness (a*). The breast meat pH at 1-h postmortem was increased (linear, p<0.05) by increasing inclusion levels of IFE in diets. Likewise, increasing inclusion levels of MIX in diets had no effects on growth performance, relative organ weight, plasma measurements, immune organ index, and tibia characteristics. However, increasing inclusion levels of MIX in diets increased (linear, p<0.05) 1-h postmortem pH but decreased (linear, p<0.05) 24-h postmortem pH of breast meat. Increasing inclusion levels of MIX in diets decreased (linear, p<0.05) thiobarbituric acid reactive substances values of breast meat.Conclusion: Both IFE and MIX are suitable alternatives to FM as protein ingredients in broiler diets.
Keywords: Animal Protein Ingredient; Broiler Chicken; Fish Meal; Growth Performance; Hatchery By-products; Infertile Eggs
INTRODUCTION
Poultry diets are formulated primarily with various vegetable ingredients, which are rela-tively cheap but contain the less bioavailable nutrients than animal-derived ingredients and purified nutrients. Therefore, despite their high price, animal protein sources such as fish meal (FM) are often added to poultry diets, especially for broiler chickens, to satisfy the essential amino acid (AA) requirements. Feed cost constitutes the largest portion of the total cost of poultry production, and therefore, the identification and increased use of potential and inexpensive animal protein sources would significantly improve economic
outcomes of the poultry industry [1]. The Korean poultry industry produces more than 4,000 tons of hatchery by-products (HBPs) every year. These HBPs include infertile eggs (IFE), unhatched eggs (UHE), low grade and dead chicks (LDC), and eggshells (ES) [2]. In commer-cial hatcheries, IFE are typically collected at the middle of the hatching process (e.g., examination of fertilization), whereas UHE, LDC, and ES are mostly collected at the end of the hatching process. The collected UHE, LDC, and ES are mixed to produce the final HBPs with or without inclusion of IFE. Currently, most HBPs produced in South Korea are com-posted as a fertilizer, and the raising environmental concerns necessitate an alternative solution for the use of HBPs. The HBPs contain high amounts of available nutrients such as AAs, calcium (Ca), and phosphorus (P) for animals. Several previous experiments have reported that the HBPs can be used as economical and potential protein ingredients for poul-try diets [1,3]. However, few studies have directly evaluated a mixture of HBPs (MIX) as an alternative to FM, which is widely used as an animal protein ingredient in poultry diets. In addition, IFE can be collected separately from MIX, and thus, IFE is likely another potential source of animal protein. However, there is very limited information regarding the nutri-tive value of IFE and MIX in broiler diets, especially compared with FM. Accordingly, the objective of the present study was to in-vestigate the effects of dietary IFE and MIX (a conventional mixture of IFE, UHE, LDC, and ES) as a replacement of FM on growth performance, relative organ weight, plasma mea-surements, immune organ index, meat quality, and tibia characteristics of broiler chickens.
MATERIALS AND METHODS
Animals, experimental design, and dietsThe protocol for the current experiment was reviewed and approved by the Institutional Animal Care and Use Com-mittee at Chung-Ang University (IACUC No. 2018-00136). In total, 720 Ross 308 broiler chicks (1 d of age) were obtained from a local hatchery (Dongsan broiler hatchery, Cheonan, Korea). The chicks were fed a commercial pellet starter diet until 3 d of age. At the 3 d of age, chicks with an average ini-tial body weight (BW) of 82±2.1 g were allotted to 1 of 9 treatments with 8 replicates in a completely randomized design. Each replicate consisted of 5 male and 5 female birds. The HBPs, including IFE, UHE, LDC, and ES, were sep-arately obtained from a local hatchery (Dongsan broiler hatchery, Cheonan, Korea). A mixture of assorted HBPs (designated MIX) was produced with a composition of 55% IFE, 10% UHE, 10% LDC, and 25% ES, which was based on the consideration of typical production ratio of each HBP in the commercial hatchery [2]. The IFE and MIX samples
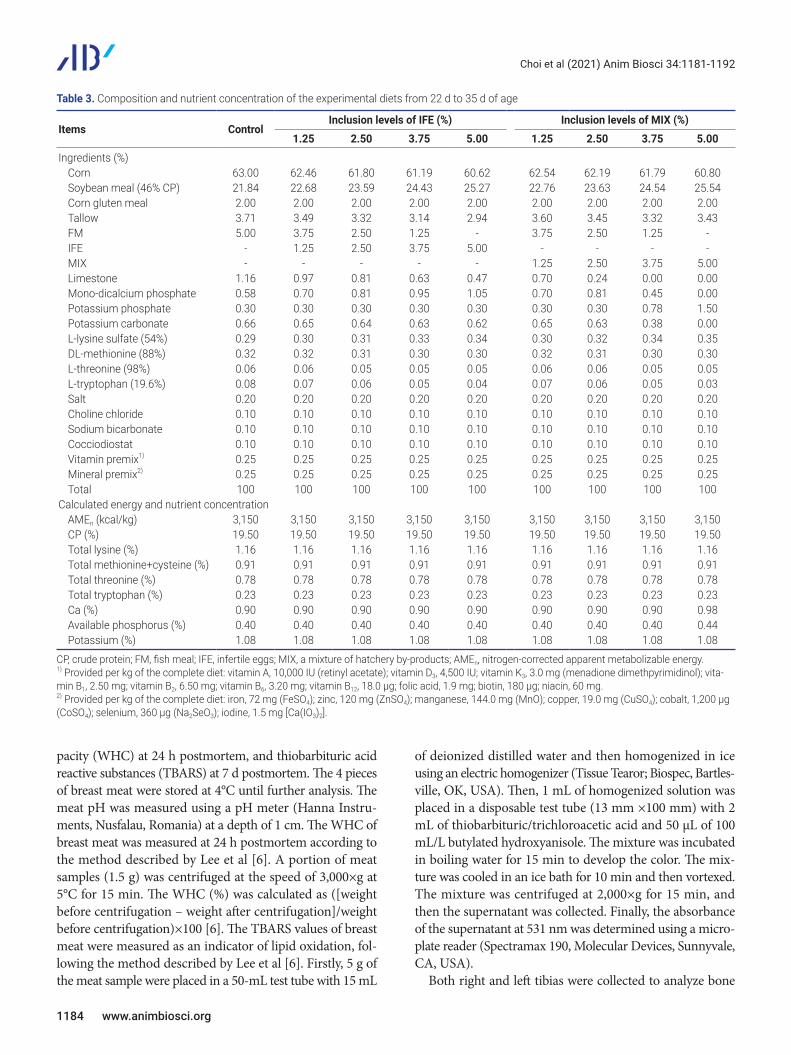
were ground using a meat chopper (MN-225, Hankook Fujee, Hwaseong, Korea) and dried at 50°C for 24 h in a vertical convention oven (LDO-630F, Daihan Labtech, Namyangju, Korea) to ensure that they contained less than 2.0% water. The commercial FM was also prepared for diet formulation. The analyzed nutrient concentrations of IFE, MIX, and FM are presented in Table 1. The basal diet for the control group was formulated to con-tain 5.0% FM, which is close to the maximum inclusion levels of FM in the commercial broiler diet. Eight treatment diets were prepared by replacing 25%, 50%, 75%, or 100% of FM with either IFE or MIX. Therefore, the actual inclusion levels of IFE or MIX in the experimental diets were 1.25%, 2.50%, 3.75%, or 5.00%. All nutrient concentrations of 9 treatments diets (Tables 2, 3) were formulated to be identical and satis-fied for nutrient requirements of growing and finishing broiler chickens [4]. The experimental diets and water were provided on an ad libitum basis for 32 d from 3 d to 35 d of age. The room temperature was maintained at 30°C at the start of the experiment and then gradually decreased to 24°C as recom-mended by the Ross manual [4]. A 23-h lighting schedule was applied during the experimental period. The body weight gain (BWG) and feed intake (FI) were measured when the chickens were 35 d old. The mortality was recorded daily. The feed conversion ratio was calculated by dividing FI (kg) by BWG (kg) after correcting for mortality.
Sample collection and analysis At the end of experiment (35 d of age), the individual weights of all broiler chickens were recorded. The broiler chickens,
Table 1. Energy and nutrient composition of fish meal (FM), infertile eggs (IFE), and a mixture of hatchery by-products (MIX)
AMEn, nitrogen-corrected apparent metabolizable energy; DM, dry matter; CP, crude protein; AA, amino acid.1) The value for AMEn of FM was adopted from INRA [35], whereas the values for AMEn of IFE and MIX were measured in our previous experi-ment [38].2) Nutrient concentrations were analyzed using AOAC methods [39].3) AA concentrations were analyzed for IFE and MIX, whereas AA concen-trations for FM were adopted from INRA [35].
www.animbiosci.org 1183
Choi et al (2021) Anim Biosci 34:1181-1192
which is the closest to average weight of the replicated cage, were euthanized via CO2 asphyxiation. Blood samples from each bird were collected via heart puncture into a 10-mL vacu-tainer tube containing sodium heparin (BD, Franklin Lakes, NJ, USA) and then centrifuged at 3,000×g at 4°C for 20 min to obtain the plasma. The plasma samples were stored at –20°C before further analysis. The concentrations of albumin, alanine aminotransferase (ALT), aspartate aminotransferase (AST), creatinine, glucose, total protein, and total glyceride in the plasma were analyzed using a HITACHI 7020 automatic an-alyzer (Hitachi, Tokyo, Japan). The liver, kidney, small intestine, and gizzard were collect-ed, and their relative weight (the weight as a percentage of
the total BW) were calculated. The immune organs such as thymus, spleen, and bursa of Fabricius were also collected and weighed. The values for immune organ index were cal-culated by the following equation: (immune organ weight [g] /BW [g])×1,000 [5]. The right portion of the breast meat was detached from the sternum for meat quality analyses. The color of breast meat was measured directly postmortem using a colorimeter (model CR-10, Konica Minolta, Tokyo, Japan) with the light-ness (L*), redness (a*), and yellowness (b*) values of the meat surface being recorded. The breast meat was then weighed and divided into 4 parts, which were respectively used to measure pH at 1 h and 24 h postmortem, water holding ca-
Table 2. Composition and nutrient concentration of the experimental diets from 3 d to 21 d of age
Items ControlInclusion levels of IFE (%) Inclusion levels of MIX (%)
CP, crude protein; FM, fish meal; IFE, infertile eggs; MIX, a mixture of hatchery by-products; AMEn, nitrogen-corrected apparent metabolizable energy.1) Provided per kg of the complete diet: vitamin A, 10,000 IU (retinyl acetate); vitamin D3, 4,500 IU; vitamin K3, 3.0 mg (menadione dimethpyrimidinol); vita-min B1, 2.50 mg; vitamin B2, 6.50 mg; vitamin B6, 3.20 mg; vitamin B12, 18.0 µg; folic acid, 1.9 mg; biotin, 180 μg; niacin, 60 mg.2) Provided per kg of the complete diet: iron, 72 mg (FeSO4); zinc, 120 mg (ZnSO4); manganese, 144.0 mg (MnO); copper, 19.0 mg (CuSO4); cobalt, 1,200 μg (CoSO4); selenium, 360 μg (Na2SeO3); iodine, 1.5 mg [Ca(IO3)2].
1184 www.animbiosci.org
Choi et al (2021) Anim Biosci 34:1181-1192
pacity (WHC) at 24 h postmortem, and thiobarbituric acid reactive substances (TBARS) at 7 d postmortem. The 4 pieces of breast meat were stored at 4°C until further analysis. The meat pH was measured using a pH meter (Hanna Instru-ments, Nusfalau, Romania) at a depth of 1 cm. The WHC of breast meat was measured at 24 h postmortem according to the method described by Lee et al [6]. A portion of meat samples (1.5 g) was centrifuged at the speed of 3,000×g at 5°C for 15 min. The WHC (%) was calculated as ([weight before centrifugation – weight after centrifugation]/weight before centrifugation)×100 [6]. The TBARS values of breast meat were measured as an indicator of lipid oxidation, fol-lowing the method described by Lee et al [6]. Firstly, 5 g of the meat sample were placed in a 50-mL test tube with 15 mL
of deionized distilled water and then homogenized in ice using an electric homogenizer (Tissue Tearor; Biospec, Bartles-ville, OK, USA). Then, 1 mL of homo genized solution was placed in a disposable test tube (13 mm ×100 mm) with 2 mL of thiobarbituric/trichloroacetic acid and 50 μL of 100 mL/L butylated hydroxyanisole. The mixture was incubated in boiling water for 15 min to develop the color. The mix-ture was cooled in an ice bath for 10 min and then vortexed. The mixture was centrifuged at 2,000×g for 15 min, and then the supernatant was collected. Finally, the absorbance of the supernatant at 531 nm was determined using a micro-plate reader (Spectramax 190, Molecular Devices, Sunnyvale, CA, USA). Both right and left tibias were collected to analyze bone
Table 3. Composition and nutrient concentration of the experimental diets from 22 d to 35 d of age
Items ControlInclusion levels of IFE (%) Inclusion levels of MIX (%)
CP, crude protein; FM, fish meal; IFE, infertile eggs; MIX, a mixture of hatchery by-products; AMEn, nitrogen-corrected apparent metabolizable energy.1) Provided per kg of the complete diet: vitamin A, 10,000 IU (retinyl acetate); vitamin D3, 4,500 IU; vitamin K3, 3.0 mg (menadione dimethpyrimidinol); vita-min B1, 2.50 mg; vitamin B2, 6.50 mg; vitamin B6, 3.20 mg; vitamin B12, 18.0 µg; folic acid, 1.9 mg; biotin, 180 µg; niacin, 60 mg.2) Provided per kg of the complete diet: iron, 72 mg (FeSO4); zinc, 120 mg (ZnSO4); manganese, 144.0 mg (MnO); copper, 19.0 mg (CuSO4); cobalt, 1,200 µg (CoSO4); selenium, 360 µg (Na2SeO3); iodine, 1.5 mg [Ca(IO3)2].
www.animbiosci.org 1185
Choi et al (2021) Anim Biosci 34:1181-1192
characteristics. The muscle attached to the tibias was removed. The concentrations of Ca, P, and ash in the right tibia were analyzed, whereas the left tibia was used to measure the break-ing strength. The right tibia was dried at 100°C for 24 h in a drying oven and then placed in a Soxhlet apparatus for 48 h to remove the fat using ethyl ether as a solvent. Afterwards, the right tibia was dried again at 100°C for 24 h in a drying oven and then ground to powder. Ground samples were ashed in a muffle furnace at 600°C for 24 h to measure tibia ash concentrations [7,8]. The Ca and P concentrations in the ash of the right tibia were measured using an inductively coupled plasma spectrometer (Optima 5300 DV, Perkin Elmer, Shelton, CT, USA) as described by Kurtoğlu et al [9]. Break-ing strength of the left tibia was analyzed using a TAHDi texture analyzer (Stable Micro Systems, Surrey, UK) accord-ing to the method described by Shaw et al [10].
Statistical analysisAll data were analyzed using analysis of variance in a com-pletely randomized design using the MIXED procedure (SAS Institute Inc., Cary, NC, USA). All data were checked for outliers and normal distribution using the UNIVARIATE procedure of SAS (SAS Institute Inc., USA). One outlier was identified and removed from the final data analysis. The rep-licate was used as an experimental unit for all measurements. There were 9 experimental diets in this study, including 1 basal diet, 4 diets containing IFE, and 4 diets containing MIX. In order to evaluate individual IFE and MIX as alternatives to FM, IFE and MIX treatments were analyzed separately, with each evaluation involving 5 experimental diets (1 basal diet and 4 treatment diets containing different inclusion levels of IFE or MIX). The LSMEANS procedure was used to calcu-late treatment means and the PDIFF option of SAS was used to separate the means if the difference was significant. Or-thogonal polynomial contrasts test was also used to determine the linear and quadratic effects of increasing inclusion levels of IFE or MIX as a replacement of FM in diets. Significance for statistical tests was set at p<0.05.
RESULTS AND DISCUSSION
Nutrient composition of infertile eggs and hatchery by-product mixtureThe proximate and AA compositions of the IFE and MIX used in this experiment are presented in Table 1. The con-centrations of crude protein (CP), Ca, and P in the MIX were comparable to previous results of a mixture of HBPs [11]. However, other studies have used HBP mixtures with different ratios of each HBP, leading to differences in nutrient concentrations comparing with HBPs used in this study [12]. The concentrations of CP and P were similar between IFE and MIX, whereas MIX had a greater concentration of Ca than IFE because of the inclusion of UHE, LDC, and ES, which contained high amounts of Ca. Based on the con-centrations of CP and Ca, both IFE and MIX can be good sources of protein and Ca for broiler diets.
Growth performanceIncreasing inclusion levels of IFE or MIX from 0% to 5.0% as a replacement of FM in diets had no effects on growth performance of broiler chickens (Tables 4, 5), which indi-cates that both IFE and MIX are suitable replacements of FM in broiler diets if the diets are formulated to keep the constant energy and nutrient concentrations. A similar re-sult was observed by Rasool et al [13] who used a control diet containing 12% FM and found that 100% replacement of FM with HBPs had no adverse effects on growth perfor-mance of broiler chicks. The reason for these results is that both FM and HBPs (i.e., IFE and MIX) are animal protein sources and contain high amounts of available essential AAs and minerals for broiler chickens [14].
Plasma measurements Plasma measurements, including albumin, ALT, AST, cre-atinine, glucose, total protein, and total glyceride were not influenced by increasing inclusion levels of IFE or MIX as a replacement of FM in broiler diets (Tables 6, 7). The plasma concentrations of albumin, ALT, and AST have been rou-
Table 4. Effect of increasing inclusion levels of infertile eggs (IFE) as a replacement of fish meal (FM) in diets on growth performance of broiler chickens1),2)
SEM, standard error of the mean; BWG, body weight gain; FI, feed intake; FCR, feed conversion ratio.1) Data are least squares means of 8 observations per treatment. 2) Diets were fed to birds for 32 d from 3 to 35 d of age. 3) IFE was included at replacing levels of 0%, 25%, 50%, 75%, or 100% with 5.0% FM in the basal diet.4) T, overall effects of treatments; L, linear effects of increasing replacement levels of IFE in diets; Q, quadratic effects of increasing replacement levels of IFE in diets.
1186 www.animbiosci.org
Choi et al (2021) Anim Biosci 34:1181-1192
tinely used for monitoring the liver health because those concentrations are increased when liver cells are damaged [15,16]. In addition, the plasma concentrations of creatinine are used for a biomarker for the renal health because creat-inine in the body is mainly excreted through the kidney
[17]. The plasma concentrations of glucose, total protein, and total glycerides observed in the current experiment fell within the normal range for poultry. Therefore, both IFE and MIX appear to have no negative effects on liver and kidney functions as well as nutrient metabolism in broiler chickens.
Table 5. Effect of increasing inclusion levels of a mixture of hatchery by-products (MIX) as a replacement of fish meal (FM) in diets on growth performance of broiler chickens1),2)
SEM, standard error of the mean; BWG, body weight gain; FI, feed intake; FCR, feed conversion ratio.1) Data are least squares means of 8 observations per treatment. 2) Diets were fed to birds for 32 d from 3 to 35 d of age. 3) MIX was included at replacing levels of 0%, 25%, 50%, 75%, or 100% with 5.0% FM in the basal diet.4) T, overall effects of treatments; L, linear effects of increasing replacement levels of MIX in diets; Q, quadratic effects of increasing replacement levels of MIX in diets.
Table 6. Effect of increasing inclusion levels of infertile eggs (IFE) as a replacement of fish meal (FM) in diets on the plasma measurements of broiler chickens1)
SEM, standard error of the mean; ALT, alanine aminotransferase; AST, aspartate aminotransferase.1) Data are least squares means of 8 observations per treatment.2) IFE was included at replacing levels of 0%, 25%, 50%, 75%, or 100% with 5.0% FM in the basal diet.3) T, overall effects of treatments; L, linear effects of increasing replacement levels of IFE in diets; Q, quadratic effects of increasing replacement levels of IFE in diets.
Table 7. Effect of increasing inclusion levels of a mixture of hatchery by-products (MIX) as a replacement of fish meal (FM) in diets on the plasma measurements of broiler chickens1)
SEM, standard error of the mean; ALT, alanine aminotransferase; AST, aspartate aminotransferase.1) Data are least squares means of 8 observations per treatment.2) MIX was included at replacing levels of 0%, 25%, 50%, 75%, or 100% with 5.0% FM in the basal diet.3) T, overall effects of treatments; L, linear effects of increasing replacement levels of MIX in diets; Q, quadratic effects of increasing replacement levels of MIX in diets.
www.animbiosci.org 1187
Choi et al (2021) Anim Biosci 34:1181-1192
Relative organ weight Increasing inclusion levels of IFE as a replacement of FM in diets had no effects on the relative weight of the breast, liver, kidney, and small intestine. The relative weight of the gizzard was increased (quadratic, p<0.05) with increasing inclusion levels of IFE in the diets (Table 8). However, increasing in-clusion levels of MIX had no effects on the relative weight of any of the measured organs (Table 9). The current observations are in line with a previous study reporting no difference in breast weights among birds fed diets containing from 0% to 4.5% HBPs [18]. Likewise, Abiola et al [11] also reported that the relative liver and gizzard weights were not affected by replacing FM with HBPs in broiler diets. In addition, the values of relative weights of breast, liver, kidney, and small intestine as observed in this study fell in the normal range reported previously [19-22]. However, interestingly we found a quadratic association between in-creasing inclusion levels of IFE in diets and the relative gizzard weight, and the reason for this observation is not clear. De-spite this unexpected result, the values for the relative gizzard weight as observed in the current experiment also remained within the normal range from 1.2% to 1.5% of BW [23,24],
and no abnormal enlargement in the gizzard size was iden-tified. Thus, increasing inclusion levels of IFE or MIX up to 5.0% as a replacement of FM in diets are unlikely to lead to considerable changes in the gastrointestinal growth and de-velopment of broiler chickens.
Immune organ index There were no linear or quadratic effects of increasing inclu-sion levels of IFE or MIX as a replacement of FM in diets on the immune organ index (Tables 10, 11). The thymus is re-sponsible for T-lymphocyte differentiation and proliferation, whereas B-lymphocytes is matured in the bursa of Fabricius [25,26]. The spleen plays a role in the regulation of cellular and humoral immunity in poultry via activation of T-lym-phocytes, B-lymphocytes, and macrophage [27]. Therefore, the relative development of the thymus, bursa of Fabricius, and spleen can be used to evaluate immune function and health status of poultry [28,29]. Therefore, our results may indicate that replacing FM with IFE or MIX up to 5.0% in diets has no adverse effects on immune function of broiler chickens.
Table 8. Effect of increasing inclusion levels of infertile eggs (IFE) as a replacement of fish meal (FM) in diets on the relative organ weight of broiler chickens1)
SEM, standard error of the mean.1) Data are least squares means of 8 observations per treatment.2) Relative organ weight = [organ weight (g)/body weight (g)] × 100.3) IFE was included at replacing levels of 0%, 25%, 50%, 75%, or 100% with 5.0% FM in the basal diet.4) T, overall effects of treatments; L, linear effects of increasing replacement levels of IFE in diets; Q, quadratic effects of increasing replacement levels of IFE in diets.
Table 9. Effect of increasing inclusion levels of a mixture of hatchery by-products (MIX) as a replacement of fish meal (FM) in diets on the relative organ weight of broiler chickens1)
SEM, standard error of the mean.1) Data are least squares means of 8 observations per treatment.2) Relative organ weight = [organ weight (g)/body weight (g)] × 100.3) MIX was included at replacing levels of 0%, 25%, 50%, 75%, or 100% with 5.0% FM in the basal diet.4) T, overall effects of treatments; L, linear effects of increasing replacement levels of MIX in diets; Q, quadratic effects of increasing replacement levels of MIX in diets.
1188 www.animbiosci.org
Choi et al (2021) Anim Biosci 34:1181-1192
Meat qualityThe WHC and TBARS values of breast meat were not influ-enced by increasing inclusion levels of IFE as a replacement of FM in diets (Table 12). However, increasing inclusion levels of IFE in diets increased (linear, p<0.05) meat lightness (L*) but decreased (linear, p<0.05) meat redness (a*). The 1-h post-
mortem pH of breast meat was increased (linear, p<0.05) by increasing inclusion levels of IFE in diets. In particular, the pH was significantly greater (p<0.05) in birds fed diets con-taining 3.75% IFE than in birds fed the basal diet. However, the pH at 24 h postmortem was not affected by replacing FM with IFE.
Table 10. Effect of increasing inclusion levels of infertile eggs (IFE) as a replacement of fish meal (FM) in diets on the immune organ index of broiler chickens1)
SEM, standard error of the mean.1) Data are least squares means of 8 observations per treatment.2) Index = [organ weight (g)/body weight (g)] × 1,000.3) IFE was included at replacing levels of 0%, 25%, 50%, 75%, or 100% with 5.0% FM in the basal diet.4) T, overall effects of treatments; L, linear effects of increasing replacement levels of IFE in diets; Q, quadratic effects of increasing replacement levels of IFE in diets.
Table 11. Effect of increasing inclusion levels of a mixture of hatchery by-products (MIX) as a replacement of fish meal (FM) in diets on the im-mune organ index of broiler chickens1)
SEM, standard error of the mean.1) Data are least squares means of 8 observations per treatment.2) Index = [organ weight (g)/body weight (g)] × 1,000.3) MIX was included at replacing levels of 0%, 25%, 50%, 75%, or 100% with 5.0% FM in the basal diet.4) T, overall effects of treatments; L, linear effects of increasing replacement levels of MIX in diets; Q, quadratic effects of increasing replacement levels of MIX in diets.
Table 12. Effect of increasing inclusion levels of infertile eggs (IFE) as a replacement of fish meal (FM) in diets on meat quality of breast meat of broiler chickens1)
SEM, standard error of the mean; L*, lightness; a*, redness; b*, yellowness; WHC, water holding capacity; TBARS, thiobarbituric acid-reactive substances; MDA, malondialdehyde.1) Data are least squares means of 8 observations per treatment.2) IFE was included at replacing levels of 0, 25, 50, 75, or 100% with 5.0% FM in the basal diet.3) T, overall effects of treatments; L, linear effects of increasing replacement levels of IFE in diets; Q, quadratic effects of increasing replacement levels of IFE in diets.a,b Means with different superscripts within a row are different (p < 0.05).
www.animbiosci.org 1189
Choi et al (2021) Anim Biosci 34:1181-1192
Increasing inclusion levels of MIX in diets did not influ-ence meat color and WHC of breast meat (Table 13). However, increasing inclusion levels of MIX in diets increased (linear, p<0.05) pH at 1 h postmortem but decreased (linear, p<0.05) pH at 24 h postmortem. In addition, increasing inclusion levels of MIX in diets decreased (linear, p<0.05) TBARS values of breast meat. Meat color is one of the important factors affecting con-sumers’ preferences with regard to broiler meat [6]. For broiler breast meat, L* values of 42 to 50 and a* values of 1.9 to 5.3 have been widely reported [30-32]. The L* and a* values ob-served in this experiment fell within the quantitative range although the linear increase in L* value and linear decrease in a* value were observed with increasing inclusion levels of IFE in this experiment. It is not clear whether some specific chemical compounds in eggs (i.e., IFE) may affect breast meat colors, as no such effect has been reported previously in broiler chickens. However, it appears that consumers would be un-able to distinguish HBP-fed birds from FM-fed birds on the basis of meat color. The low pH value of breast meat is often associated with low meat quality [33]. In the current study, the pH values at 1 h postmortem were increased (linear, p<0.05) by increas-ing inclusion levels of both IFE and MIX, whereas pH values at 24 h postmortem were decreased (linear, p<0.05) with in-creasing inclusion levels of MIX. Postmortem pH is dependent primarily on the amount of glycogen in the muscle and the rate of its degradation to lactic acid [34]. However, it is un-clear whether some specific chemical compounds in IFE and MIX may influence the concentration or degradation rate of glycogen in the muscle. However, all pH values of breast meat observed in this experiment fell within the normal range from 6.20 to 6.54 for 1 h postmortem [21,22] and from 5.85 to 6.34
for 24 postmortem [21,32], indicating that replacement of FM with IFE and MIX exerts no adverse effects on the post-mortem pH of breast meat. The TBARS value is used as an indicator of lipid peroxi-dation, and thus meat with low TBARS values is considered less oxidized [6]. Interestingly, we found that increasing re-placement of FM with both IFE and MIX tended to decrease TBARS values of breast meat although the significance was only detected for broiler chickens fed diets containing MIX. Thus, replacement of FM with IFE and MIX is likely to de-crease lipid peroxidation in breast meat. This observation is likely caused by the fact that FM contains a greater amount of polyunsaturated fatty acids as compared to other animal protein sources [35], as it is well-known that polyunsaturated fatty acids are more prone to oxidation than saturated fatty acids [36]. Therefore, one potential benefit of replacing FM with IFE or MIX may be the improvement in lipid stability of breast meat, which can increase the shelf-life of breast meat. It should be noted, however, that all TBARS values measured in this experiment fell within the normal range from 0.18 to 1.32 for 7 d postmortem [21,37]. Therefore, it appears that neither FM nor both HBPs (i.e., IFE and MIX) have consid-erable effects on lipid stability of the breast meat.
Tibia characteristics The tibia characteristics, including concentrations of ash, Ca, and P, and breaking strength were not affected by increasing inclusion levels of IFE or MIX (Tables 14, 15). This is likely related to the fact that all diets were formulated to contain the identical concentrations of minerals such as Ca and P. In addition, minerals such as Ca and P in the IFE and MIX are mostly derived from the ES, and it has been reported that Ca and P present in the ES are highly digestible and utilizable
Table 13. Effect of increasing inclusion levels of a mixture of hatchery by-products (MIX) as a replacement of fish meal (FM) in diets on meat quality of breast meat of broiler chickens1)
SEM, standard error of the mean; L*, lightness; a*, redness; b*, yellowness; WHC, water holding capacity; TBARS, thiobarbituric acid-reactive substances; MDA, malondialdehyde.1) Data are least squares means of 8 observations per treatment.2) MIX was included at replacing levels of 0%, 25%, 50%, 75%, or 100% with 5.0% FM in the basal diet.3) T, overall effects of treatments; L, linear effects of increasing replacement levels of MIX in diets; Q, quadratic effects of increasing replacement levels of MIX in diets.
1190 www.animbiosci.org
Choi et al (2021) Anim Biosci 34:1181-1192
by poultry [2].
CONCLUSION
Replacement of FM with HBPs as IFE and MIX up to 5.0% in diets has no adverse effects on growth performance, plasma measurements, relative organ weight, immune organ index, breast meat quality, and tibia characteristics of broiler chickens, provided that diets are formulated with appropriate energy and nutrient concentrations. One potential benefit of re-placing FM with IFE or MIX may be the improvement in lipid stability of broiler meat by decreasing concentrations of polyunsaturated fatty acids. Therefore, both IFE and MIX can serve as economically feasible alternatives to FM as a protein source in broiler diets.
CONFLICT OF INTEREST
We certify that there is no conflict of interest with any financial organization regarding the material discussed in the manu-script.
ACKNOWLEDGMENTS
This research was carried out with the support of the Coopera-
tive Research Program for Agriculture Science and Technology Development (Project No. PJ01252804), Rural Development Administration, Republic of Korea. This research was also supported by the Chung-Ang University Graduate Research Scholarship in 2020.
REFERENCES
1. Abiola SS, Onunkwor EK. Replacement value of hatchery waste meal for fish meal in layer diets. Bioresour Technol 2004;95:103-6. https://doi.org/10.1016/j.biortech.2004.02. 001
2. Choi HS, Park GH, Kim JH, Ji SY, Kil DY. Determination of calcium and phosphorus utilization in various hatchery by-products for broiler chickens. Korean J Agric Sci 2019;46:361-8. https://doi.org/10.7744/kjoas.20190023
3. Ratriyanto A, Suprayogui WPS, Atikah R. Infertile egg powder as a potential feedstuff for starter broilers. IOP Conf Ser: Earth Environ Sci 2020;518:012005. https://doi.org/10.1088/1755- 1315/518/1/012005
5. Chen HL, Li DF, Chang BY, Gong LM, Dai JG, Yi GF. Effects of Chinese herbal polysaccharides on the immunity and growth performance of young broilers. Poult Sci 2003;82:
Table 15. Effect of increasing inclusion levels of a mixture of hatchery by-products (MIX) as a replacement of fish meal (FM) in diets on the tibia characteristics of broiler chickens1)
SEM, standard error of the mean.1) Data are least squares means of 8 observations per treatment.2) MIX was included at replacing levels of 0%, 25%, 50%, 75%, or 100% with 5.0% FM in the basal diet.3) T, overall effects of treatments; L, linear effects of increasing replacement levels of MIX in diets; Q, quadratic effects of increasing replacement levels of MIX in diets.
Table 14. Effect of increasing inclusion levels of infertile eggs (IFE) as a replacement of fish meal (FM) in diets on the tibia characteristics of broiler chickens1)
SEM, standard error of the mean.1) Data are least squares means of 8 observations per treatment.2) IFE was included at replacing levels of 0%, 25%, 50%, 75%, or 100% with 5.0% FM in the basal diet.3) T, overall effects of treatments; L, linear effects of increasing replacement levels of IFE in diets; Q, quadratic effects of increasing replacement levels of IFE in diets.
www.animbiosci.org 1191
Choi et al (2021) Anim Biosci 34:1181-1192
364-70. https://doi.org/10.1093/ps/82.3.3646. Lee SJ, Lee SY, Kim GD, GB Kim, SK Jin, SJ Hur. Effects of
self-carbon dioxide-generation material for active packaging on pH, water-holding capacity, meat color, lipid oxidation and microbial growth in beef during cold storage. J Sci Food Agric 2017;97:3642-8. https://doi.org/10.1002/jsfa.8223
7. Watson BC, Matthews JO, Southern LL, Shelton JL. The effects of phytase on growth performance and intestinal transit time of broilers fed nutritionally adequate diets and diets deficient in calcium and phosphorus. Poult Sci 2006;85: 493-7. https://doi.org/10.1093/ps/85.3.493
8. Woyengo TA, Emiola IA, Kim IH, Nyachoti CM. Bioavail-ability of phosphorus in two cultivars of pea for broiler chicks. Asian-Australas J Anim Sci 2016;29:396-403. https://doi.org/ 10.5713/ajas.15.0299
9. Kurtoğlu F, Kurtoğlu V, Celik I, Kececi T, Nizamlioğlu M. Effects of dietary boron supplementation on some biochemical parameters, peripheral blood lymphocytes, splenic plasma cells and bone characteristics of broiler chicks given diets with adequate or inadequate cholecalciferol (vitamin D3) content. Br Poult Sci 2005;46:87-96. https://doi.org/10.1080/0007166 0400024001
10. Shaw AL, Blake JP, Moran ET. Effects of flesh attachment on bone breaking and of phosphorus concentration on perfor-mance of broilers hatched from young and old flocks. Poult Sci 2010;89:295-302. https://doi.org/10.3382/ps.2009-00402
11. Abiola SS, Radebe NE, Westhuizen CVD, Umesiobi DO. Whole hatchery waste meal as alternative protein and calcium sources in broiler diets. Archiv Zootec 2012;61:229-34.
12. Dhaliwal APS, Shingari BK, Sapra KL. Chemical composi-tion of hatchery waste. Pak Vet J 1997;17:168-70.
13. Rasool S, Rehan M, Haq A, Alam MZ. Preparation and nutri-tional evaluation of hatchery waste meal for broilers. Asian-Australas J Anim Sci 1999;12:554-7. https://doi.org/10.5713/ ajas.1999.554
14. Beski SSM, Swick RA, Iji PA. Specialized protein products in broiler chicken nutrition: a review. Anim Nutr 2015;1:47-53. https://doi.org/10.1016/j.aninu.2015.05.005
15. Piotrowska A, Burlikowska K, Szymeczko R. Changes in blood chemistry in broiler chickens during the fattening period. Folia Biol 2011;59:183-7. https://doi.org/10.3409/fb59_3-4. 183-187
16. Azadmanesh V, Jahanian R. Effect of supplemental lipotropic factors on performance, immune responses, serum metabolites and liver health in broiler chicks fed on high-energy diets. Anim Feed Sci Technol 2014;195:92-100. https://doi.org/10. 1016/j.anifeedsci.2014.06.004
17. Adriani L, Nugraha P, Marin M. The effect of granting fer-mented milk, fermented soy milk, and the combination against creatinine and blood glucose levels on broiler. AgroLife Sci J 2017;6:9-15.
18. Mehdipour M, Shargh MS, Dastar B, Hassani S. Effects of
different levels of hatchery wastes on the performance, carcass and tibia ash and some blood parameters in broiler chicks. Pak J Biol Sci 2009;12:1272-6. https://doi.org/10.3923/pjbs. 2009.1272.1276
19. Awad WA, Ghareeb K, Abdel-Raheem S, Böhm J. Effects of dietary inclusion of probiotic and synbiotic on growth perfor-mance, organ weights, and intestinal histomorphology of broiler chickens. Poult Sci 2009;88:49-56. https://doi.org/10. 3382/ps.2008-00244
20. Elaroussi MA, Mohamed FR, Elgendy MS, El Barkouky EM, Abdou AM, Hatab MH. Ochratoxicosis in broiler chickens: functional and histological changes in target organs. Int J Poult Sci 2008;7:414-22. https://doi.org/10.3923/ijps.2008.414.422
21. Goo D, Kim JH, Choi HS, Park GH, Han GP, Kil DY. Effect of stocking density and sex on growth performance, meat quality, and intestinal barrier function in broiler chickens. Poult Sci 2019;98:1153-60. https://doi.org/10.3382/ps/pey491
22. Wang JP, Lee JH, Yoo JS, Cho JH, Kim HJ, Kim IH. Effects of phenyllactic acid on growth performance, intestinal micro-biota, relative organ weight, blood characteristics, and meat quality of broiler chicks. Poult Sci 2010;89:1549-55. https:// doi.org/10.3382/ps.2009-00235
23. Sacranie A, Svihus B, Denstadli V, Moen B, Iji PA, Choct M. The effect of insoluble fiber and intermittent feeding on gizzard development, gut motility, and performance of broiler chickens. Poult Sci 2012;91:693-700. https://doi.org/ 10.3382/ps.2011-01790
24. Kheravii SK, Swick RA, Choct M, Wu S-B. Dietary sugarcane bagasse and coarse particle size of corn are beneficial to per-formance and gizzard development in broilers fed normal and high sodium diets. Poult Sci 2017;96:4006-16. https:// doi.org/10.3382/ps/pex225
25. Pearse G. Normal structure, function and histology of the thymus. Toxicol Pathol 2006;34:504-14. https://doi.org/10. 1080/01926230600865549
26. Nagy N, Olah I. Experimental evidence for the ectodermal origin of the epithelial anlage of the chicken bursa of Fabricius. Development 2010;137:3019-23. https://doi.org/10.1242/ dev.055194
27. Guo Y, Jiang R, Su A, et al. Identification of genes related to effects of stress on immune function in the spleen in a chicken stress model using transcriptome analysis. Mol Immunol 2020;124:180-9. https://doi.org/10.1016/j.molimm.2020.06. 004
28. Attia YA, Al-Khalaifah H, Ibrahim MS, Abd Al-Hamid AE, Al-Harthi MA, El-Naggar A. Blood hematological and bio-chemical constituents, antioxidant enzymes, immunity and lymphoid organs of broiler chicks supplemented with propolis, bee pollen and mannan oligosaccharides continuously or intermittently. Poult Sci 2017;96:4182-92. https://doi.org/10. 3382/ps/pex173
29. Chen C, Li J, Zhang H, et al. Effects of a probiotic on the
1192 www.animbiosci.org
Choi et al (2021) Anim Biosci 34:1181-1192
growth performance, intestinal flora, and immune function of chicks infected with Salmonella pullorum. Poult Sci 2020; 99:5316-23. https://doi.org/10.1016/j.psj.2020.07.017
30. Chen Y, Gu Y, Zhao H, Zhang H, Zhou Y. Effects of graded levels of dietary squalene supplementation on the growth performance, plasma biochemical parameters, antioxidant capacity, and meat quality in broiler chickens. Poult Sci 2020; 99:5915-24. https://doi.org/10.1016/j.psj.2020.08.042
31. Chang Q, Lu Y, Lan R. Chitosan oligosaccharide as an effective feed additive to maintain growth performance, meat quality, muscle glycolytic metabolism, and oxidative status in yellow-feather broilers under heat stress. Poult Sci 2020;99:4824-31. https://doi.org/10.1016/j.psj.2020.06.071
32. Kim HJ, Kim HJ, Jeon JJ, et al. Comparison of the quality characteristics of chicken breast meat from conventional and animal welfare farms under refrigerated storage. Poult Sci 2020;99:1788-96. https://doi.org/10.1016/j.psj.2019.12. 009
33. Swatland HJ. How pH causes paleness or darkness in chicken breast meat. Meat Sci 2008;80:396-400. https://doi.org/10. 1016/j.meatsci.2008.01.002
34. Duclos MJ, Berri C, Le Bihan-Duval E. Muscle growth and meat quality. J Appl Poult Res 2007;16:107-12. https://doi.
org/10.1093/japr/16.1.10735. The French National Institute for Agricultural Research
(INRA). Tables of composition and nutritional value of feed materials. Wageningen, The Netherlands: Wageningen Academic Publishers; 2004.
36. Valentini J, Da Silva AS, Fortuoso BF, et al. Chemical compo-sition, lipid peroxidation, and fatty acid profile in meat of broilers fed with glycerol monolaurate additive. Food Chem 2020;330:127187. https://doi.org/10.1016/j.foodchem.2020. 127187
37. Vaithiyanathan S, Naveena BM, Muthukumar M, et al. Bio-chemical and physicochemical changes in spent hen breast meat during postmortem aging. Poult Sci 2008;87:180-6. https://doi.org/10.3382/ps.2007-00068
38. Choi HS, Goo D, Pitargue FM, et al. Determination of meta-bolizable energy values for various hatchery by-products for broiler chickens. In: Proceedings of Korean Society of Poultry Science 2017; 2017 Nov 9-10; Jeonbuk, KR. Gangwon, KR: Korean Society of Poultry Science; 2017. 129 p.
39. Latimer GW; AOAC International. Official methods of analy-sis of AOAC International. 19th ed. Gaithersburg, MD, USA: AOAC International; 2012