EFFECTS OF DIFFERENT TYPES OF WARM-UP ON SWIMMING PERFORMANCE IN COLLEGIATE SWIMMERS by GYTIS BALILIONIS A THESIS Submitted in partial fulfillment of the requirements for the degree of Master of Arts in the Department of Kinesiology in the Graduate School of The University of Alabama TUSCALOOSA, ALABAMA 2009
Transcript
EFFECTS OF DIFFERENT TYPES OF WARM-UP ON SWIMMING
PERFORMANCE IN COLLEGIATE SWIMMERS
by
GYTIS BALILIONIS
A THESIS
Submitted in partial fulfillment of the requirements for the degree of Master of Arts
in the Department of Kinesiology in the Graduate School of
The University of Alabama
TUSCALOOSA, ALABAMA
2009
Copyright Gytis Balilionis 2009 ALL RIGHTS RESERVED
ii
ABSTRACT
The purpose of the present study was to evaluate the effect of three different types of
warm-up on swimming performance in NCAA Division I swimmers. Eight male and eight
female swimmers utilized three warm-up protocols prior to performing 50-yard (45.72-meter)
freestyle swim trials each trial in counterbalanced order and separated by 48 hours. The warm-up
protocols consisted of: (1) no warm-up, (2) short warm-up (50-yards at 40% maximal effort and
50-yards at 90%), (3) regular warm-up (swimmers own pre-competition warm-up). Following
the warm-up regimen, participants rested for three minutes and completed a 50-yard freestyle
swim trial. Heart rate pre- and post- trial, diving distance, reaction time, post warm-up RPE, post
50-yard trial RPE, and stroke count were measured. Times for 50-yard swim were significantly
(p = 0.03) different among warm-ups. Mean 50-yard time was significantly (p = 0.01) faster after
regular warm-up (24.95 ± 1.53 sec) compared to short warm-up (25.26 ± 1.61 sec) and
approached significance between no- and regular- warm-ups (p = 0.06); however, no significant
difference was found between no- (25.19 ±1.54 sec) and short warm-ups (p = 0.59) on 50-yard
time. Individual data indicated that 19% of participants performed their best 50-yard time after
short warm-up, 37% after no-, and 44% after regular warm-up. Heart rate was significantly (p =
0.01) higher after regular warm-up (100 ± 13 b/min) compared to no warm-up (88 ± 18 b/min)
and approached significance between short- and regular warm-ups (p = 0.07); however, no
significant difference was observed between no- and short warm-ups (92 ± 19 b/min) (p = 0.32).
RPE was significantly (p <0.001) lower after no warm-up (6.3 ± 0.5) compared to short warm-up
(10.1 ± 1.7) and regular warm-up (12.1 ± 1.0). No significant difference was found in reaction
iii
time (p = 0.96), RPE post 50-yard time trial (p = 0.11), dive distance (p = 0.67), and stroke count
(p = 0.23) among warm-ups. In conclusion, regular warm-up was better than short warm-ups to
achieve the fastest mean 50-yard freestyle time but individuals differed in their response to
different warm-ups.
iv
DEDICATION
I dedicate this thesis to my father Raimundas Saulius Balilionis who has shown a great
example as my dad and to my coach Sigitas Skarelis who inspired and guided me through my
swimming career.
v
ACKNOWLEDGMENTS
I would like to express my appreciation to Dr. Phillip A. Bishop for his critical
comments, patient and guidance through my thesis.
I would also like to thank Dr. Yasmin Neggers and Dr. Mark Richardson for serving on
my thesis committee, for their time and patience through the process.
Finally, I would like to thank Carrie Ellis and Svetlana Nepocatych for helping to collect
data, and to all athletes who have participated in the study.
vi
LIST OF ABBREVIATIONS AND SYMBOLS
ANOVA Analysis of variance
b/min Beats per minute
cm Centimeters
Fig Figure
HR Heart rate
kg Kilograms
LSD Least significant difference
min Minute
p Probably associated with the occurrence under the null hypothesis of a
value as extreme as or more than observed value
RPE Rating of perceived exertion
SD Standard deviation
sec Second
sig Significance
VO2 Oxygen uptake
VO2max Maximal oxygen uptake
vs. Versus
WU Warm-up
yrs Year
vii
CONTENTS
ABSTRACT .............................................................................................. ii
DEDICATION ......................................................................................... iv
ACKNOWLEDGMENTS ....................................................................... v
LIST OF ABBREVIATIONS AND SYMBOLS ..................................... vi
LIST OF TABLES ................................................................................... viii
LIST OF FIGURES ................................................................................. ix
1. Participants physical characteristics: age, weight, height, percent body fat, swimming experience, best 50-yard time, and regular warm-up (N=16) ........................................................................ 17
2. Mean in 50-yard time, pre and post heart rate, warm-up RPE, post 50-yard RPE, dive distance, reaction time, and stroke count for each warm-up type: no, short, and regular warm-up (N=16) ................... 18
ix
LIST OF FIGURES
1. 50-yard time trial results after no-, short-, and regular warm-ups (N=16) ........................................................................................ 19 2. 50-yard time trial individual results after no-, short-, and regular warm-ups (N=16) ....................................................................... 20 3. Heart rate pre 50-yard time trial for no-, short-,
and regular warm-ups (N=16) ....................................................................... 21
4. Heart rate post 50-yard time trial for no-, short-, and regular warm-ups (N=16) ....................................................................... 22 5. Post warm-up RPE for no-, short-, and regular warm-ups (N=16) ............... 23
1
INTRODUCTION
Swimming is a very demanding sport which requires extreme muscle strength and
endurance. Only fractions of a second may separate the winner from the opponents (Bobo,
1999).
A good swimming performance is influenced not only by training, genetics, and
opportunity, but also by a “warm-up”, recognized as a main factor in athletic performance
(Bobo, 1999). Swim warm-up is defined as engaging in physical activity before the main event
for the purpose of improving swimming performance (Bobo, 1999). The warm-up intends to
raise the body’s temperature, increase blood flow, respiration rate, heart rate and flexibility of the
involved muscles; however, should not cause fatigue (King, 1979). In addition, warm-up in the
competition swimming pool allows a participant to become familiar with diving blocks and
lanes, turning flags and surface of the walls (for turns) (King, 1979). All of these warm-up
aspects are believed to prepare an athlete for optimal performance during competition.
It is customary in swimming competition to use a long warm-up, even for short races. A
long warm-up is, in general, believed to provide a “feel for the water” as well as to increase
blood flow, heart rate and flexibility of the involved muscles. However, long warm-ups require
higher energy consumption and may contribute to overall muscle fatigue. During a competitive
swim season, when athletes often do not taper before competition, a long warm-up may detract
from swim training and consequently from performance.
In the previous research, conflicting evidence exists of the impact on performance of
warm-up versus no warm-up (Bobo, 1999). Romney and Nethery (1993) found that 100-yard
2
swimming performance was significantly better after warm-up compared to no warm-up.
Conversely, Mitchell and Huston (1992) found no significant differences in 200-yard swimming
performance after no-, short-, and regular- warm-ups. In addition, unpublished data collected at
The University of Alabama (2002) and King (1979) found no significant differences in 50-yard
swimming performance after no-, short-, and regular- warm-ups. While there exist a variety of
warm-up protocols utilized currently, it is not exactly known the precise load and intensity of an
optimal warm-up an athlete requires.
Therefore considering inconclusive findings from previous research, the purpose of the
current study was to evaluate the effects of three different types of warm-ups (no warm-up, short
warm-up, and regular warm-up) on swimming performance in collegiate swimmers. We
hypothesized that short warm-up or no warm-up would be better or would have the same benefits
as regular warm-up. If shorter warm-ups allow equal swim performance, shorter or minimal
warm-up may provide training advantages for some athletes.
3
METHODS
Participants
Eight male and eight female NCAA Division I swimmers, between 19 and 25 years of
age volunteered to participate in the study.
All participants had been involved in competitive swimming for at least five years.
Participants had been in post-season training for the previous three weeks and trained five times
a week during this period. Volume and intensity were identical for all swimmers during post-
season training. Prior to the study, each participant completed a Health Status Questionnaire
(ACSM Risk Stratification) and a Physical Activity Readiness Questionnaire (PAR-Q) to
determine any health risks prior to the study. A positive answer on the PAR-Q eliminated the
participant from the study. In addition, a training status questionnaire was given to the
participants to obtain information about years of experience, preferred stroke, distance, and best
swimming times. In addition, participants were asked to avoid alcohol, caffeine, and physical
activities (that were not related to swimming practice) at least 24 hours before every session.
Also, participants were asked to avoid heavy food consumption and energy drinks at least 3-4
hours before each session.
Participants were excluded from the study if any of the following criteria were present: (i)
participant was younger than 19; (ii) in the past six months had a shoulder injury; (iii) screening
forms indicated any previous cardiovascular or respiratory problems or other major chronic
diseases that may have limitations for exercise; (iv) participant had any type of surgery or injury
4
that may have resulted in an increased risk of exercise participation. All participants provided
written informed accordance with the local Institutional Review Board.
Testing
Prior to the testing sessions, study design and procedures were explained, screening
procedures were completed, and height, weight, and percent body fat were recorded. Using
skinfold calipers (Lange, Beta Technology Incorporated Cambridge, Maryland) three skinfold
sites were measured (chest, abdomen, and thigh for men and triceps, suprailiac, and thigh for
women) and percent body fat was estimated from the sum of skinfold sites and age (Pollock et al.
1980). Participants, wearing swimwear, were weighed using a calibrated scale (Beam Balance,
DETECTO, Web City, Missouri). Height was self-reported and recorded. Also, years of
experience, preferred swimming stroke, and best 50-yard freestyle time were recorded through
the training status questionnaire.
Warm-up Types
Three different types of warm-up protocols were used in this study. Warm-up order was
counterbalanced and separated by 48 hours of rest between each performance trial. After
participants completed each warm-up, they were afforded three minutes of rest prior to the 50-
yard (45.72-meter) maximal performance trial. All participants swam freestyle.
No warm-up – no physical activity was performed during this time. Participants rested for
three minutes.
5
Short warm-up – participants completed a 50-yard freestyle swim at 40% of their
maximal effort and another 50-yard swim at 90% of their maximal effort (total: 100-yards
(91.44-meters)).
Regular warm-up – participants completed their own pre-competition swim warm-up.
The warm-up length was recorded and reported in Table 1.
Performance Evaluation
50-Yard (45.72-meter) Maximal Performance Trial. The maximal performance trial
measured how fast each participant completed a 50-yard maximal effort time trial. A timing
system (Colorado Time Systems, Loveland, CO, USA) was used to time the trials. The system
was attached to the swimming pool wall. Participant climbed on the diving block and was given
a verbal command “take your mark” and a beep sound (“start” signal) of the timing system was
used to start the time trial. With the “start” signal, the system started the time as participant dove
off the block. As each participant completed the trial by touching the swimming wall, the system
stopped and recorded 50-yard time to the nearest hundredth of a second and, subsequently, each
score was recorded. In addition, there were two manual stop-watches used as a back-up if the
main system did not record the time. The mean time of the two stop-watches was recorded. The
choice of 50-yard freestyle was made because it is the shortest swimming event during the
competition and most swimmers are adept to freestyle swimming. Only one flip turn was
required to complete the race, whereas longer swimming events would require multiple laps and
flip turn which would have diluted the impact of warm-up.
Diving Distance. A video camera and software (Dartfish software, Alpharetta, GA, USA)
were used to record and measure diving distance. Dive distance was measured as the distance
6
from the diving block to the first touch of the water. Participant’s dive distance was analyzed and
reported in centimeters.
Reaction Time. Reaction time was measured as time between the “start” signal and first
movement of the participant using a reaction pad attached to the block (Daktronics, Brookings,
SD, USA). Participant’s reaction time was measured to the nearest hundredth of a second, and
reported in seconds.
Rating of Perceived Exertion (RPE). Participants were asked to rate warm-up and 50-
yard maximal performance trial session using Borg’s 15-point scale (Borg, 1974). The scale was
explained in detail and supported by a visual aid. RPE was asked post warm-up and post 50-
yard-maximal performance swim trial.
Heart Rate. Heart rate was measured by manual palpation method at the wrist or neck.
The manual palpation method was explained in detail to the participants prior to testing. All
participants were familiar with this procedure because they used it in regular swim training.
Heart rate was measured 30 seconds before the swim trial and immediately post 50-yard
maximal performance trial. Participants counted their own heart rate for 15 seconds. Heart rate
was reported as beats per minute.
Stroke Count. During the 50-yard-maximal performance trial, strokes were counted.
However, to minimize error, stroke count was counted in cycles. One cycle was equal to two
strokes. The cycle started when the first arm of the participant entered the water and ended when
it recovered.
7
Statistical Analysis
All statistical analyses were performed on a commercially available statistical platform
(SSPS Version.16, Illinois, Chicago, USA). A series of one-way repeated measures ANOVA
was used to analyze the difference in 50-yard time trial performance, dive distance, stroke count,
reaction time, RPE, and heart rate between the three warm-up protocols. Significance was
accepted at the p < 0.05 level. Differences between warm-up protocols for any variable that
demonstrated significance were examined by a LSD post-hoc multiple comparison test. In
addition, the number of individuals recording their fastest time for a given warm-up was reported
as a percentage of the total group. Data were reported as means and standard deviations (SD).
8
RESULTS
Descriptive data of the participants and regular warm-up distance are shown in Table 1.
The timing system did not record 50-yard time for two participants in one 50-yard time trial.
Two manual stop-watches were used as a back-up timing and the mean time of the two was
recorded. Results for the one-way repeated measures ANOVA revealed a significant main effect
(p = 0.03) among warm-up protocols on 50-yard time trial (Fig 1). Post-hoc measures revealed
that the group mean 50-yard time trial was significantly (p = 0.01) faster after regular warm-up
(24.95 ± 1.53 sec) compared to short warm-up (25.26 ± 1.61 sec) and approached significance (p
= 0.06) between no- (25.19 ±1.54 sec) and regular warm-ups. No significant difference was
found between no- and short warm-ups (p = 0.59) on 50-yard time. Further, individual data
indicated that 19% of the participants swam their best 50-yard time after short warm-up, 37%
after no warm-up, and 44% after regular warm-up (Fig 2).
A significant main effect between warm-ups (p = 0.02) was revealed for heart rate prior
to the 50-yard swim trial (Fig 3). Post-hoc measures found heart rate was significantly (p = 0.01)
higher after regular warm-up (100 ± 13 b/min) compared to no warm-up (88 ± 18 b/min) and
approached significance between short- (92 ± 19 b/min) and regular warm-ups (p = 0.07). No
significant difference was observed between no- and short warm-ups (p = 0.32) in heart rate
response
Similarly, there was a significant main effect (p = 0.03) for heart rate post 50-yard swim
trial among warm-ups (Fig 4). Heart rate was significantly (p = 0.01) higher after regular warm-
up (156 ± 23 b/min) compared to short warm-up (142 ± 16 b/min). No significant differences
9
were found between no- (150 ± 19 b/min) and short warm-ups (p = 0.14), and no- and regular
warm-ups (p = 0.24).
A significant main effect (p < 0.01) for RPE after warm-up was found among warm-up
types (Fig 5). RPE was significantly (p <0.01) lower after no warm-up (6.3 ± 0.5) compared to
short warm-up (10.1 ± 1.7) and regular warm-up (12.1 ± 1.0). Also, RPE was significantly (p =
0.001) lower after short warm-up compared to regular warm-up.
The reaction pad did not record reaction time for one participant in two 50-yard time
trials and for two participants in one 50-yard time trial. All three participants were removed from
reaction time statistical analysis. No significant differences were found in reaction time (p =
0.96), RPE post 50-yard time trial (p = 0.11) dive distance (p = 0.67), and stroke count (p = 0.23)
between warm-ups. Results from the 50-yard time trial results, heart rate pre and post 50-yard
performance trial, RPE post warm-up and post 50-yard performance trial, dive distance, reaction
time, and stroke count after each warm-up are presented in Table 2.
10
DISCUSSION
The purpose of this study was to evaluate the effect of three different types of warm-up
(no warm-up, short warm-up, and regular warm-up) on 50-yard freestyle swimming performance
in collegiate swimmers. The results of the present study indicated that 50-yard swimming time
was significantly (p = 0.01) faster after regular warm-up (24.95 ± 1.53 sec) compared to short
warm-up (25.26 ± 1.61 sec). In addition, 50-yard swimming time approached significantly faster
time (p = 0.06) after regular warm-up compared to no warm-up (25.19 ±1.54 sec). However, no
significant difference was found between no- and short warm-ups (p = 0.59).
Swimming warm-up serves to raise the body’s core temperature, increase blood flow,
respiration rate, heart rate and flexibility of the involved muscles which may prepare a swimmer
for an optimum performance (King, 1979; Bishop, 2003a). In the present study, heart rate was
significantly different after three warm-ups. Heart rate was higher after the regular warm-up (100
± 13 b/min) compared to the short- (92 ± 19 b/min) and no (88 ± 18 b/min) warm-ups. These
results serve to confirm earlier findings by Mitchell et al. (1993) and Zochowski et al. (2007).
Previously, reported improvements in swimming performance after warm-up have been
attributed to an increase in heart rate causing elevated baseline VO2, increased muscle and core
temperature (Bishop, 2003b). In the present study, heart rate after regular warm-up was
significantly higher compared to other warm-ups which could have had an effect on times in 50-
yard performance due to an elevated VO2. In addition, higher heart rate and elevated VO2 were
reported after low and high intensity swimming warm-up protocols (Mitchell et al., 1993).
11
Active warm-up at moderate intensity and for no less than five minutes was reported to
increase muscle and core temperatures (Bishop, 2003a&b; Arnett, 2002; Zochowski et al., 2007).
In the present study, the regular warm-up lasted at least 10 minutes. Reported RPE values
indicated that the regular warm-up (12.1 ± 1.0) was perceived as significantly harder compared
to no- (6.3 ± 0.5) and short (10.1 ± 1.7) warm-up trials. The regular warm-up was perceived as
“somewhat hard” indicating moderate intensity. Therefore, improvements in 50-yard swim time
after regular warm-up may be attributed to increased muscle and core temperatures.
Additionally, psychological changes may contribute to improved athletes performance
(Bishop, 2003a). Previous research has shown that warm-up increases preparedness and provides
time to concentrate before the race (Bishop, 2003a). This might be an explanation for why some
swimmers swam their best 50-yard times after regular warm-up. In parallel, some participants
might be discouraged and have lack of motivation to race with no warm-up or a short warm-up
which may explain the tendency towards slower 50-yard times after no- (25.19 ±1.54 sec) and
short- (25.26 ± 1.61 sec) warm-ups in the present study.
To date there are a limited number of studies available that examined swimming
performance using different types of warm-up protocols. The results from previous reports have
been equivocal with conflicting evidence of warm-up versus no warm-up benefits. The results of
the present study support Romney et al. (1993), who found a significantly faster 100-yard swim
time after 15 minutes of swimming warm-up compared to no warm-up. However, King (1979)
found no significant difference in 50-meter swim time between a 400-meter swim warm-up and
no warm-up. This might be due to smaller sample size (N = 13) and large age variability (age
range 9-24 years) in the King study. In addition, a 400-meter warm-up might not be sufficient
enough to raise muscle and core temperature, thus no difference between 400-meter warm-up
12
and no warm-up was found. Moreover, Bobo (1999) found no significant differences in 100-yard
swim time between 800-yards swim warm-up and no warm-up. Also, Mitchell et al. (1993)
found no significant difference in 183-meter (200-yard) swim time between no-, low-intensity
(365 meters), and high-intensity (365 meters) warm-ups. Low-intensity, 365-meter (400-yard)
warm-up may not be sufficient to raise muscle and core temperature, thus resulting in no
significant difference between no- and 365-meter warm-up protocols. Furthermore, the high
intensity warm-up was completed at 110% of VO2max and thus, could have caused fatigue. No
difference between warm-ups in 183-meter swim time could be explained by insufficient low
intensity warm-up and fatigue caused by high intensity warm-up.
RPE following a 50-yard swim trial was not significantly different among warm-up
protocols. This indicates that participants felt the same after each 50-yard swim trial regardless
of warm-up type and despite variable levels of RPE prior to the 50-yard swim trial. This study
supports the findings of Romney et al. (1993), who found that RPE was not significantly
different after 100-yard trial between warm-ups. Similarly, there was no significant difference
found in stroke count between warm-ups. These findings confirm previous work by Zochowski
et al. (2007), who found no difference in stroke count in 200-meter swim performance. In
addition, in the present study warm-up had no effect on dive distance or reaction time. The
specific protocols used in this study may not have prepared specific-skills required for diving and
reaction time. No practice dives off the blocks or jumps on the deck were performed during no-,
short- or regular warm-ups.
Although the regular warm-up produced, on average, faster mean time there was a need
to look at the individual results to detect individual variability. Indeed, not every individual
responds to the treatments the same. If an individual performs consistently better after specific
13
warm-up such as no-, short- or regular-warm-up, coaches should recognize that individuality and
employ that specific warm-up in order to maximize that athlete’s performance. For some
individuals no- or short warm-up might be better than regular warm-up.
Individual data of the present study indicated that 19% of the participants set the best 50-
yard time after short warm-up, 37% after no warm-up, and 44% after regular warm-up (Fig 2).
These results are similar to unpublished data previously collected at our university (2002). Those
data indicated that 15% of participants achieved best time with regular warm-up (1100-yard),
54% with mixed warm-up (200 + 10 vertical push from the bottom of the pool), and 31% with
short warm-up (100-yard).
14
CONCLUSION
In conclusion, the best group 50-yard freestyle mean times were performed after regular
warm-up. However, regular warm-up was perceived as more intense compared to other warm-
ups. In addition, heart rate was higher before the 50-yard trial after the regular warm-up. The
faster group mean in 50-yard swim time after regular warm-up may be attributed to an elevated
baseline VO2, increased muscle and core temperatures, and psychological effects. However, there
was large individual variability and just 44% of the swimmers achieved their fastest time after
regular warm-up. We recommend that swimmers and coaches experiment to determine each
individual’s optimal warm-up to maximize swim performance.
15
PRACTICAL APPLICATIONS
Results of the present study indicated that the fastest mean 50-yard swim time was after
regular warm-up. However, coaches work with individual swimmers rather than group means in
order to maximize training and performance. Individual analyses are necessary to determine the
best warm-up for the individual. In the present study after regular warm-up 44% of the
swimmers achieved their best time, 19% after short warm-up, and 37% after no warm-up.
Coaches should take into consideration that no- or short- warm-up can be better for some
individuals compared to regular warm-up. Furthermore, race results show that often only one
hundredth of a second separates winners in swimming competition. Therefore, coaches should
invest more time and effort during the off-season in order to determine the individual warm-up
needed for the athlete to perform at their best. This study indicates that regular warm-up does, on
average give the best performance, individuals do not always swim their best 50-yard freestyle
time with their traditional warm-up.
Future research is needed in order to determine the stability of results of alternative
warm-ups for a 50-yard race. Currently, there are no studies available for longer distance
swimming event. There is a need for future research in order to determine optimal warm-up
duration, intensity, and recovery time for 400, 800, and 1500-meter swimming events.
16
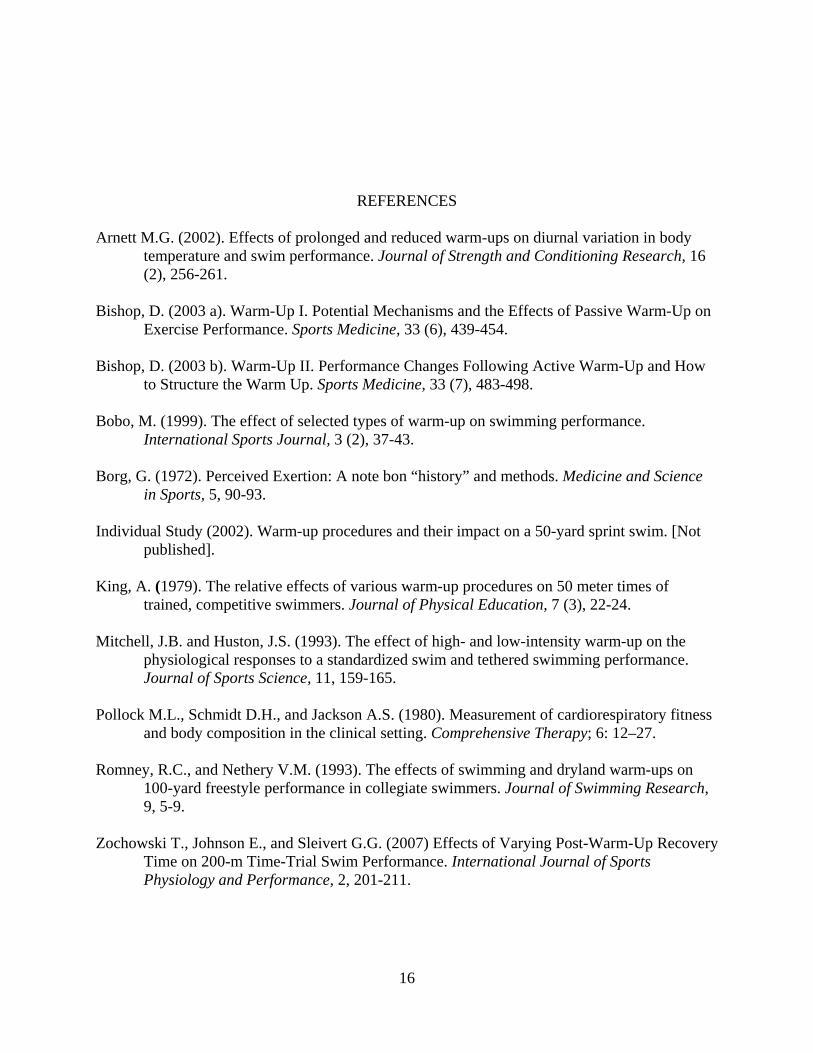
REFERENCES
Arnett M.G. (2002). Effects of prolonged and reduced warm-ups on diurnal variation in body temperature and swim performance. Journal of Strength and Conditioning Research, 16 (2), 256-261.
Bishop, D. (2003 a). Warm-Up I. Potential Mechanisms and the Effects of Passive Warm-Up on
Exercise Performance. Sports Medicine, 33 (6), 439-454. Bishop, D. (2003 b). Warm-Up II. Performance Changes Following Active Warm-Up and How
to Structure the Warm Up. Sports Medicine, 33 (7), 483-498. Bobo, M. (1999). The effect of selected types of warm-up on swimming performance.
International Sports Journal, 3 (2), 37-43. Borg, G. (1972). Perceived Exertion: A note bon “history” and methods. Medicine and Science
in Sports, 5, 90-93. Individual Study (2002). Warm-up procedures and their impact on a 50-yard sprint swim. [Not
published]. King, A. (1979). The relative effects of various warm-up procedures on 50 meter times of
trained, competitive swimmers. Journal of Physical Education, 7 (3), 22-24. Mitchell, J.B. and Huston, J.S. (1993). The effect of high- and low-intensity warm-up on the
physiological responses to a standardized swim and tethered swimming performance. Journal of Sports Science, 11, 159-165.
Pollock M.L., Schmidt D.H., and Jackson A.S. (1980). Measurement of cardiorespiratory fitness
and body composition in the clinical setting. Comprehensive Therapy; 6: 12–27. Romney, R.C., and Nethery V.M. (1993). The effects of swimming and dryland warm-ups on
100-yard freestyle performance in collegiate swimmers. Journal of Swimming Research, 9, 5-9.
Zochowski T., Johnson E., and Sleivert G.G. (2007) Effects of Varying Post-Warm-Up Recovery
Time on 200-m Time-Trial Swim Performance. International Journal of Sports Physiology and Performance, 2, 201-211.
Table 2. Comparison of Physiological Variables for No, Short, Regular Warm- up (WU) (N=16). NO WU
Means ± SD Short WU
Means ± SD Reg WU
Means ± SD Sig (p)
50-yard time (sec) 25.19 ±1.54 25.26 ± 1.61* 24.95 ± 1.53* 0.03 HR pre 50 (b/min) 88 ± 18** 92 ± 19 100 ± 13** 0.02 HR post 50 (b/min) 150 ± 19 142 ± 16* 156 ± 23* 0.03 WU RPE 6.3 ± 0.5*** 10.1 ± 1.7***† 12.1 ± 1.0***† 0.01 50-yard RPE 15.3 ± 2.2 15.2 ± 1.7 16.1 ± 1.4 0.11 Dive distance (cm) 319.9 ± 31.8 317.4 ± 25.8 316.9 ± 31.6 0.67 Reaction time (sec) ‡ 0.77 ± 0.10 0.77 ± 0.09 0.77 ± 0.06 0.96 Stroke count 28.7 ± 5.0 29.3 ± 4.9 29.3 ± 4.9 0.23 * Significant difference (p < 0.05) between short WU and regular WU. ** Significant difference (p < 0.05) between no WU and regular WU. *** Significant difference (p < 0.05) between no WU and short WU, and between no WU and regular WU. † Significant difference (p < 0.05) between short WU and regular WU. ‡ 13 participants in the statistical analysis. WU = warm-up HR = heart rate
19
FIGURES
Figure 1. 50-yard time trial results after no-, short-, and regular warm-ups (N=16).
* Indicates significant difference (p < 0.05) between short- and regular warm-ups in 50-yard time.
20
Figure 2. 50-yard time trial individual results after no-, short-, and regular warm-ups (N=16).
21
Figure 3. Heart rate pre 50-yard time trial for no-, short-, and regular warm-ups (N=16).
* Indicates significant difference (p < 0.05) between no- and regular warm-ups in pre 50-yard heart rate.
22
Figure 4. Heart rate post 50-yard time trial for no-, short-, and regular warm-up (N=16).
* Indicates significant difference (p < 0.05) between short- and regular warm-ups in post 50-yard heart rate.
23
Figure 5. Post warm-up RPE for no-, short-, and regular warm-ups (N=16).
* indicates significant difference (p < 0.05) between no- and short warm-ups, and no- and regular warm-ups in post warm-up RPE. ** indicates significant difference (p < 0.05) between short- and regular warm-ups in post warm-up RPE.