Contents lists available at SciVerse ScienceDirect
Meat Science
j ourna l homepage: www.e lsev ie r .com/ locate /meatsc i
Effects of feeding flaxseed or sunflower-seed in high-forage diets on beef production,quality and fatty acid composition
C. Mapiye a, J.L. Aalhus a, T.D. Turner a, D.C. Rolland a, J.A. Basarab b, V.S. Baron a, T.A. McAllister c, H.C. Block d,B. Uttaro a, O. Lopez-Campos a, S.D. Proctor e, M.E.R. Dugan a,⁎a Agriculture and Agri-Food Canada, Lacombe Research Centre, 6000 C & E Trail, Lacombe, Alberta T4L 1W1, Canadab Alberta Agriculture and Rural Development, Lacombe Research Centre, 6000 C & E Trail, Lacombe, Alberta T4L 1W1, Canadac Agriculture and Agri-Food Canada, Lethbridge Research Centre, 1st Avenue South 5403, PO Box 3000, Lethbridge, Alberta T1J 4B1, Canadad Agriculture and Agri-Food Canada, Brandon Research Centre, 18th Street and Grand Valley Road, P.O. Box 1000A, RR3, Brandon, Manitoba R7A 5Y3, Canadae Metabolic and Cardiovascular Diseases (MCVD) Laboratory, Alberta Diabetes and Mazankowski Institutes, Li Ka Shing (LKS) Centre for Health Research Innovation, University of Alberta,Edmonton, Alberta T6G 2E1, Canada,
Yearling steers were fed 70:30 forage:concentrate diets for 205 d, with either grass hay (GH) or red cloversilage (RC) as the forage source, and concentrates containing either sunflower-seed (SS) or flaxseed (FS),each providing 5.4% oil to diets. Feeding diets containing SS versus FS significantly improved growth and carcassattributes (P b 0.05), significantly reduced meat off-flavor intensity (P b 0.05), and significantly increased intra-muscular proportions of vaccenic (t11-18:1), rumenic (c9,t11-CLA) and n−6 fatty acids (FA, P b 0.05). Feedingdiets containing FS versus SS produced significantly darker and reddermeat with greater proportions of atypicaldienes (P b 0.05). A significant forage × oilseed type interaction (P b 0.05) was found for n−3 FA, α-linolenicacid, and conjugated linolenic acid, with their greatest intramuscular proportions found when feeding theRC-FS diet. Feeding GH versus RC also significantly improved growth and carcass attributes, sensory tenderness(P b 0.05) and significantly influenced intramuscular FA composition (P b 0.05), but overall, forage effects on FAprofiles were limited compared to effects of oilseed.
Beef lipids typically have high contents of saturated fatty acids(SFA), compared to tissues from monogastric species, due to exten-sive ruminal biohydrogenation (BH) of polyunsaturated fatty acids(PUFA; Raes, De Smet, & Demeyer, 2004). Efforts have been made toincrease amounts of PUFA in beef, particularly omega-3 (n−3)PUFA and PUFA BH intermediates, which may have health benefitsfor consumers (Dilzer & Park, 2012; Molendi-Coste, Legry, & Leclercq,2011). The challenges have been to define appropriate diets andrumen conditions to promote accumulation of PUFA and their BHintermediates in beef.
To substantially increase PUFA and their BH intermediates in beef,typically an oil or oilseed source of PUFA must be fed while creatingrumen conditions conducive to promote PUFA bypass or partial as op-posed to complete BH (Jenkins &Bridges, 2007). To this end, our researchgroup has undertaken a series of studies feeding diets containing 10–15%flaxseed (FS), a rich source of α-linolenic acid (18:3n−3, ALA) to cattleand resulting in increased deposition of n−3 PUFA in total muscle FAby 0.7–1.1% (Juárez et al., 2011; Mapiye et al., 2013; Nassu et al., 2011).The type (He et al., 2012; Nassu et al., 2011) and level (Aharoni, Orlov,& Brosh, 2004; Mir et al., 2003) of forage can, however, have overridingeffects on accumulation of PUFA BH intermediates in beef. Juárez et al.(2011) fed steers 10% FS in a high (73%) barley grain diet with 22%alfalfa/brome hay, and found limited accumulations of either ALA or itsBH intermediates. In this study, the PUFA BHpathway favored accumula-tion of trans (t)13/t14-18:1 instead of t11-18:1 (vaccenic acid, VA), andatypical dienes (AD, i.e., non-conjugated, non-methylene interrupteddienes) instead of conjugated linoleic acid (CLA). Nassu et al. (2011)fed FS to cull cows in 50:50 forage:concentrate diets with either grasshay (GH) or barley silage as the forage source for an extended period(20 weeks), and found that feeding GH-FS promoted greater accumula-tions of PUFA BH intermediates, with VA as the major trans mononene.In addition, feeding GH-FS yielded more AD than barley silage-FS, andfor both diets, AD exceeded amounts of total CLA and total n−3 PUFA.
a GH-FS, grass hay + flaxseed; GH-SS, grass hay + sunflower-seed, RC-FS, red cloversilage + flaxseed; RC-SS, red clover silage + sunflower-seed.
b Vitamin/mineral supplement per kg DM contained 1.86% calcium, 0.93% phosphorous,0.56% potassium, 0.21% sulfur, 0.33% magnesium 0.92% sodium, 265 ppm iron, 314 ppmmanganese, 156 ppm copper, 517 ppm zinc, 10.05 ppm iodine, 5.04 ppm cobalt, 2.98 ppmselenium, 49,722 IU/kg vitamin A, 9944 IU/kg vitamin D3, and 3222 IU/kg vitamin E.
c Digestible energy was calculated according to Bull (1981).
99C. Mapiye et al. / Meat Science 95 (2013) 98–109
Recently, Mapiye et al. (2013) found feeding 15% FS in a 70% forage(red clover silage, RC) diet for 215 d provided even greater accumula-tions of PUFA BH intermediates in beef lipids with t11-18:1 reaching ahigh of 9.5% in perirenal fat, cis (c)9,t11-18:2 (rumenic acid, RA)reaching a high of 2.9% in subcutaneous fat, and t11,c15-18:2 reachinga high of 1.9% in perirenal fat. The increased amounts of PUFA BH inter-mediates were in part attributed to the amount and duration of FS feed-ing. In addition, the relatively high level of polyphenol oxidase (PPO)activity in RCmay have played a role, as PPO reduces rates of PUFA lipol-ysis and BH in the rumen (Van Ranst, Lee, & Fievez, 2011) therebyenhancing deposition of PUFA and their BH intermediates in tissues(Lee, Evans, Nute, Richardson, & Scollan, 2009). The benefits of feedingRC were, however, not evaluated in comparison with other foragesources such as GHwhich have demonstrated positive effects on the ac-cumulation of PUFA BH intermediates in beef (Nassu et al., 2011).
Feeding sources of linoleic acid (18:2n−6, LA), for examplesunflower-seed (SS) or oil, in high-forage diets can also increase PUFABH intermediates in beef, but these are mostly restricted to VA and RA(Basarab, Mir, et al., 2007; Noci, French, Monahan, & Moloney, 2007).Feeding SS or FS in high forage diets can, therefore, increase VA and RAin beef, and feeding FS can also increase other ALA specific BH intermedi-ates. Consuming VA and RA may have positive health effects for humans(Dilzer & Park, 2012; Jaudszus et al., 2012; Sofi et al., 2010), but effects ofmany other PUFA BH intermediates have not been evaluated. Conse-quently, the objectives of the present experiment were to feed steers ahigh forage diet (either RC or GH) in combination with oilseeds (eitherFS or SS) for an extended period, and determine which diets would leadto the greatest accumulations of PUFA and their related BH intermediatesin beef. In addition, animal performance, carcass traits, meat quality andsensory attributes were evaluated since increasing the degree of FAunsaturation in beef accentuates oxidation of fat, possibly leading to un-acceptable changes in shelf-life and eating quality (Wood et al., 2004).
2. Materials and methods
2.1. Animals and diets
Sixty-four 12-month-old British × Continental crossbred steerswith an initial mean body weight of 423.2 ± 5.93 kg were used in thecurrent study conducted at Lacombe Research Centre, Alberta, Canada.Animal care was in compliance with the principles and guidelinesestablished by the Canadian Council on Animal Care (CCAC, 1993).Steers were stratified by weight to four experimental diets, with twopens of eight steers per diet. The four diets were GH-FS, GH-SS, RC-FSand RC-SS. On a dry matter (DM) basis, diets contained 70% forageand either SS (18.4%) or FS (14.3%), with oilseeds added to providethe same amount of oil (5.4%, DM basis; Table 1) to each diet. All dietsincluded 4.2% of a vitamin mineral supplement (Table 1) and in an at-tempt to equalize the digestible energy of the diets, additional groundbarley grain was added to the diets containing SS, and additional barleystraw was added to the diets containing FS. Flaxseed was triple rolled,while SS was fed whole. Steers in each pen were group fed to appetiteand were all capable of feeding at the feed bunk at the same time(0.8 m of space at the bunk per animal). Steers had free access tofresh, clean water. Feed was provided once daily (feed DM equaling~2.5% body weight) and the amount adjusted so that 10–15% ortswere present after 18 h with all feed being consumed by 24 h. Duringthe study period one animal from the GH-FS treatment was withdrawndue to lameness unrelated to dietary treatment.
2.2. Feed analysis
Feed samples were collected weekly and stored at −40 °C, thenpooled monthly before determination of DM, minerals, crude fat,crude protein (AOAC, 2006), neutral detergent fiber and acid detergentfiber (Van Soest, Robertson, & Lewis, 1991). Fatty acids from the
finishing totalmixed rationwere extracted andmethylated as describedby Sukhija and Palmquist (1988) and analyzed according to Dugan et al.(2007).
2.3. Growth measurements and slaughter procedure
Individual steer weights were measured monthly and average dailygain (ADG) was calculated by dividing each animal's body weight bydays on-test. Animal growth and DM intake (DMI) were recordedfrom the start of the experiment until the first group of animals wereslaughtered due to difficulties in measuring DMI when numbers ofanimals per penwere reduced. Backfat thicknesswasmeasuredmonthlyby a certified ultrasound technician using an Aloka 500 V diagnosticreal-time ultrasound with a 17 cm 3.5 MHz linear array transducer(Overseas Monitor Corporation Ltd., Richmond, B.C., Canada) followingprocedures of Brethour (1992). Steers were slaughtered at the LacombeResearch Centre abattoir over four slaughter dates in November 2011(two steers/pen/diet/slaughter day) at an average of 205 don feed corre-sponding to subcutaneous fat depths of 5–8 mm between the 12th and13th rib over the right longissimus thoracis (LT) muscle of each animal.
On mornings of slaughter, animals were transported 2 km to theLacombe Research Centre abbatoir. At slaughter, final live weights wererecorded and steers were stunned, exsanguinated and dressed in a com-mercial manner. Following carcass splitting, trimmed side weights wererecorded and initial (45 min) pH and temperature were recorded caudalto the grade site on the left LT using aHannaHI99163 pHmeter equippedwith a Hanna Smart electrode FC232 for meat (Hanna Instruments,Laval QC, Canada). Upon entry into the cooler, stainless steel thermo-couples (10 cm) were placed into the right LT ~2.5 cm anterior to the
100 C. Mapiye et al. / Meat Science 95 (2013) 98–109
12th vertebrae of all animals, and temperatures were recorded every15 min for 24 h using data temperature loggers (Mark III, MC4000;SumaqWholesalers, Toronto, ON, Canada).
2.4. Meat quality
Carcass sides were chilled overnight in a cooler set at 2 °C, with anaverage wind speed of 1.4 m/s. At 24 h post-slaughter, the left andright carcass sides were weighed to determine cooler shrinkage losses.The left carcass sides were knife-ribbed at the Canadian grade site(between the 12th and 13th ribs) and the muscle surface exposed to at-mospheric oxygen for 20 min. Full Canadian grade data were collected(grade fat thickness, estimated lean yield, ribeye area and marblingscore) alongwith objective color measurements from three surface loca-tions (CIE L* (brightness), a* (red–green axis), b* (yellow–blue axis)values; Commission Internationale de l'Eclairage, 1978) using theMinolta CR-300 with Spectra QC-300 Software (Minolta Canada Inc.,Mississauga, ON, Canada). Color measurements were converted to hueangle [hab = arctan(b*/a*)] and chroma [C*ab = (a*2 + b*2) 0.5]. Gradedata, including yield estimation and subjective estimates of marblingwere assessed according to the Livestock and Poultry Carcass GradingRegulations (Canadian Food Inspection Agency, 1992) by two certifiedgraders. Temperature and pH of the LT were again measured at 24 hcaudal to the grade site.
The left LT was dissected from the carcass at 24 h and a 5.0 cmsteak removed from the grade site (caudal end of the LT), trimmed ofepimysium, subcutaneous and intermuscular fat, comminuted using aRobot Coupe Blixir BX3 (Robot Coupe USA Inc.; Ridgeland, MS, USA),and subsamples were frozen at −80 °C for subsequent FA analyses.The remainder of the muscle was trimmed of all extraneous fat to theepimysium, weighed, vacuum packaged (Multivac AGW; Multivac Inc.,Kansas City, MO, USA) and aged for 6 d at 2 °C.
After aging, four 2.5 cm thick steaks were removed from the caudalend of the LT. The first steak was pre-weighed onto a polystyrene traywith a dri-loc pad, over-wrapped with oxygen permeable film(8000 cm3·m−2·24 h−1 vitafilm choice wrap; Goodyear Canada Inc.,Toronto, ON, Canada) and placed in a fan assisted, horizontal (chesttype) retail display case (Hill Refrigeration of Canada Ltd., Barrie, ON,Canada). Steaks were exposed to fluorescent room lighting (GE deluxecoolwhite; General Electric Canada, Oakville, ON, Canada), supplementedwith incandescent lighting directly above the display case (GE clear coolbeam 150 W/120 V spaced 91.5 cm apart; General Electric Canada,Oakville, ON, Canada) to provide an intensity of 1076 lx at the meat sur-face for 12 h·day−1 (Jeremiah &Gibson, 2001). The average temperaturein the retail display casewas 3.5 °C. Following 0, 2 and 4 days of retail dis-play, three objective color measurements (L*, a* and b*) were collectedacross the steak and converted to hue angle and chroma as reported pre-viously. Spectral reflectance readings were also collected concurrentlyand the relative contents ofmetmyoglobin,myoglobin and oxymyoglobinwere calculated as described by Shibata (1966) and Krzywicki (1979).Following the fourthdayof objective colormeasurements, steakswere re-moved from retail display and final weights were recorded to determinedrip-loss.
Raw steak weights were recorded on the second steaks and a 10 cmspear point Type T thermocouple probe (Wika Instruments, Edmonton,AB, Canada) was inserted into the mid-point of each steak prior tocooking. Steaks were then cooked, on a Garland grill (Model ED30B,Condon Barr Food Equipment Ltd., Edmonton, AB, Canada) preheatedto 210 °C, to an internal temperature of 35.5 °C, turned and cooked toa final temperature of 71 °C. Internal temperatures during cookingweremonitoredwith aHewlett PackardHP34970AData Logger (HewlettPackard Co., Boise ID, USA). Upon removal from the grill, steaks wereplaced into polyethylene bags, sealed and immediately immersed in anice/water bath to prevent further cooking. Steaks were then transferredto a 2 °C cooler for 24 h. Final steak weights were recorded and sixcores, 1.9 cm in diameter, were removed from each steak parallel to the
fiber grain. Peak shear force was determined on each core perpendicularto the fiber grain (TA-XT Plus Texture Analyzer equippedwith aWarner-Bratzler shear head at a crosshead speed of 200 mm·min−1 and a 30 kgload cell using Texture Exponent 32 Software; Texture Technolo-gies Corp., Hamilton, MA, USA). Shear forcewas recorded as the averageof all six cores per steak. Raw and final steakweightswere used to deter-mine cooking losses, and cooking times were also recorded.
The third steakswere labeled, individually vacuumpackaged, placedinto a 2 °C cooler, and aged for 16 d prior to shear force determinationas previously described. Fourth steaks were labeled, vacuum packaged,placed into a 2 °C cooler and aged for 16 d. Following aging, steakswereplaced into a −35 °C freezer until used for sensory evaluation.
The remaining portion of the LT was trimmed of epymysium andcomminuted using Robot Coupe Blixir BX3 (Robot Coupe USA Inc.,Ridgeland MS, USA) and analyzed for protein, moisture and fat using aCEM rapid analyzer system (Sprint Protein Analyzer Model 558000,Smart Turbo Moisture Analyzer Model 907990, and Smart Trac FatAnalyzer Model 907955; CEM Corporation, Matthews, NC, USA).
2.5. Longissimus thoracis fatty acid analysis
Intramuscular lipids were extracted from LT samples using amixtureof chloroform–methanol (2:1, v/v) according to Folch, Lees, and SloaneStanley (1957). Aliquots of muscle lipids (10 mg) were methylatedseparately using acid (5% methanolic HCl) and base (0.5 N sodiummethoxide) reagents (Kramer, Hernandez, Cruz-Hernandez, Kraft, &Dugan, 2008). Internal standard, 1 ml of 1 mg c10-17:1 methyl ester/mltoluene (standard no. U-42M form Nu-Check Prep Inc., Elysian, MN,USA), was added prior to addition of methylating reagents. Fatty acidmethyl esters (FAME) were analyzed using the gas chromatography(GC) and silver-ion high-performance liquid chromatography methodsoutlined by Cruz-Hernandez et al. (2004), except t-18:1 isomers wereanalyzed using two complementary GC temperature programs as de-scribed by Kramer et al. (2008).
For the identification of FAME by GC, the reference standard no. 601from Nu-Check Prep Inc, Elysian, MN, USA was used. Branched-chainFAME were identified using a GC reference standard BC-Mix1 pur-chased previously from Applied Science (State College, PA, USA). ForCLA isomers, the UC-59M standard from Nu-Chek Prep Inc. was usedwhich contains all four positional CLA isomers. Trans-18:1 CLA isomersand other BH intermediates not included in the standardmixtureswereidentified by their retention times and elution orders as reported inliterature (Cruz-Hernandez et al., 2004; Gómez-Cortés, Bach, Luna,Juárez, & de la Fuente, 2009; Kramer et al., 2008). The FAMEwere quan-tified using chromatographic peak area and internal standard basedcalculations. Only FAME representing more than 0.01% of total FAMEwere included in tables and figures, except for BH intermediates whereall the quantified isomers were reported.
2.6. Sensory analysis
Sensory analysis of steakswas conducted using previously describedprocedures (Aldai et al., 2010; Basarab, Aalhus, et al., 2007). Prior totaste panel assessments, steaks were removed from the freezer andplaced in a refrigerator to thaw for 24 h. Fifteen minutes prior tocooking, steaks were removed from the refrigerator and were cookedto a final temperature of 71 °C as described previously for shear forcedeterminations. Each steakwas cut into 1.3 cm cubes, avoiding connec-tive tissue and large areas of fat. Eight cubes from each sample wererandomly assigned to an eight-member trained sensory panel. Sampleswere placed in lightly covered glass jars in a circulating water bath(Lindberg/Blue Model WB1120A-1; Kendro Laboratory Products,Asheville, NC, USA) and allowed to equilibrate to 68 °C prior to evalua-tion. Attribute ratings were electronically collected using Compusense5, Release 4.6 software (Compusense Inc., Guelph, ON, Canada ) using8-point descriptive scales for initial and overall tenderness (1 =
101C. Mapiye et al. / Meat Science 95 (2013) 98–109
extremely tough and 8 = extremely tender), initial and sustainablejuiciness (1 = extremely dry and 8 = extremely juicy), beef flavorintensity (1 = extremely bland and 8 = extremely intense), off-flavorintensity (1 = extremely intense off-flavor and 8 = no off-flavor) andamount of connective tissue (1 = abundant and 8 = none detected).Initial tenderness was rated on the first bite through the cut center sur-face with the incisors; initial juiciness was rated after 3–5 chews withthe molars; beef flavor intensity, off-flavor intensity and amount ofconnective tissue were rated between 10 and 20 chews, and overall ten-derness and sustainable juiciness were rated prior to expelling. All panelevaluations were conducted in well-ventilated partitioned booths, underred lighting (124 lx). Distilled water and unsalted soda crackers wereprovided to purge the palate of residual flavor notes between samples(Larmond, 1977).
2.7. Statistical analysis
Data were analyzed using the PROC MIXED procedure of SAS(2009). The statistical model used for animal weights and feed intakeincluded oilseed, forage and oilseed × forage interaction as fixed effects,and pen nested within the oilseed × forage interaction as the randomeffect. Data analysis for carcass traits, meat quality, sensory attributesand muscle FA profiles included the fixed effects of oilseed, forage andoilseed × forage interaction and random effects of slaughter date andpen nested within the oilseed × forage interaction. Meat shear forceand retail display data were analyzed with a repeated measures design,with oilseed, forage, day and their interactions as main effects, slaughterdate and pen nested within the oilseed × forage interaction as randomeffects, and day as the repeated factor. Since the random effect of pennested within the oilseed × forage interaction was not significant, itwas removed from carcass traits, meat quality and FA models and indi-vidual animal was used as the experimental unit. Treatment meanswere generated and separated using the LSMEANS and PDIFF optionsrespectively (SAS, 2009). Frequency tables were generated along withChi-Square tests for yield and quality grade data. The significance thresh-old for all statistical analyses was set at P b 0.05.
3. Results and discussion
3.1. Nutrient and fatty acid composition of the experimental diets
The DM content of GH was double that of RC diets (Table 1). TheDM nutrient composition of the experimental diets was similar(Table 1) with RC diets having slightly more crude protein, crude fatand digestible energy than GH diets. Linoleic acid and ALA were thedominant FA in the SS and FS diets, respectively (Table 1).
3.2. Animal performance
Over the course of the experiment, steers fed diets containing FS hadsignificantly lower (P b 0.05) DMI than those fed SS, and steers feddiets containing RC consumed less (P b 0.05) feed than those fed GH(P b 0.05; Table 2). As a reflection of these findings, ADG and final liveweights were lower (P b 0.05) in steers fed FS containing diets compared
Table 2Effect of forage type and oilseed supplementation on feed intake and growth performance
Grass hay Red clover
Variable Flax Sunflower Flax
Dry matter intake, kg DM·d−1 13.0 13.6 11.2Initial live weight, kg 425 431 419Final live weight, kg 539 563 497Average daily gain, kg·d−1 0.56 0.69 0.45
Means with different superscripts for a particular animal performance trait are significantly1 Oilseed type × forage type interaction.
to SS and final live weights were also lower (P b 0.05) in steers fedRC compared to those fed GH (Table 2). The lower DMI could be partlyrelated to the slightly higher digestible energy of FS diets, but likelyrelates more to reduced palatability, as FS has been shown to reduce in-take when fed at levels above 10% of DM (Kim et al., 2009). Additionof straw to the FS diets to balance digestible energy across diets mayhave also reduced palatability and DMI due to its lower digestibility(Sarnklong, Coneja, Pellikaan, & Hendriks, 2010). The reasons for thelower final live weight when feeding RC as opposed to GH are lessclear, but the higher crude fat content of RC diets, or the quality of silagefed may have had some influence. Levels of fat above 5% have beenshown to inhibit ruminal fiber digestion, which can result in increasedrumen fill and reduced DMI (Jenkins, 1993). The quality of the silagefed in the current study was, however, not evaluated.
3.3. Carcass traits and longissimus thoracis quality
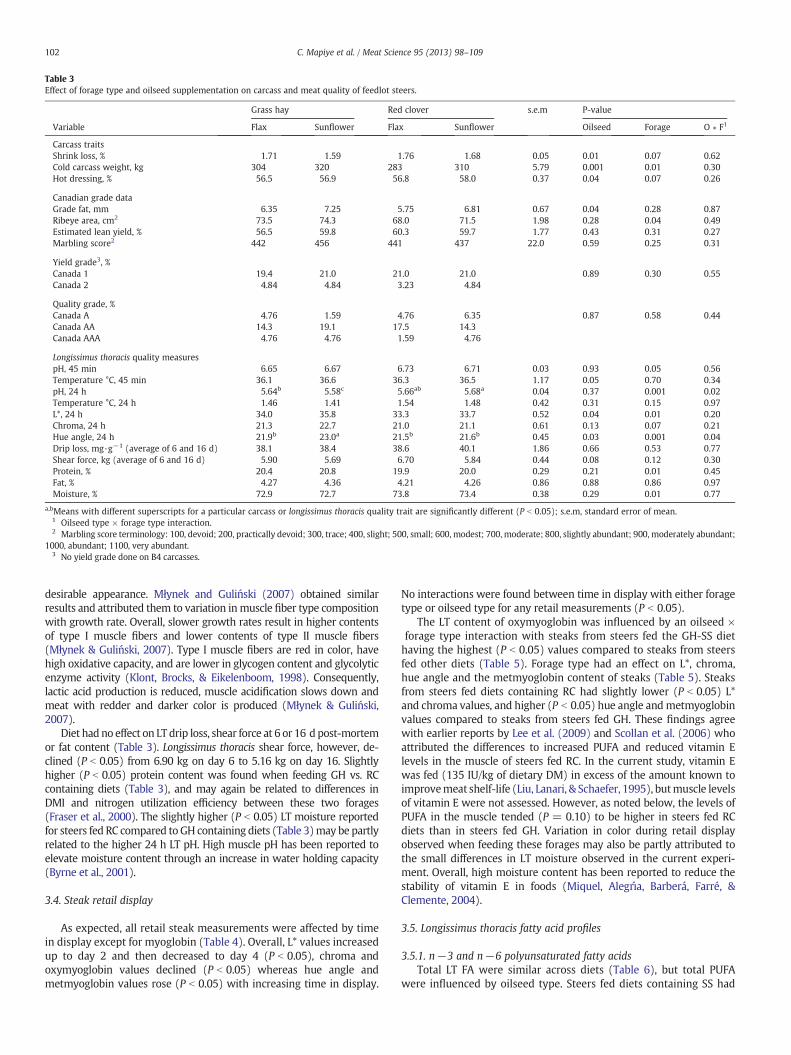
At 24 h post-slaughter, feeding diets containing FS reduced (P b 0.05)cold carcass weight, hot dressing percentage and grade fat thickness ascompared to feeding SS (Table 3). Feeding diets containing RC vs. GHalso reduced cold carcass weight (P b 0.05), but only led to trends for re-duced hot dressing percentage (P b 0.07). These findings may be associ-ated with the lower DMI, ADG and final live weights reported for the FSandRC containing diets. Compared to steers fed diets containing SS, steersfed FS had greater (P b 0.05) carcass shrink loss, and steers fed dietscontaining RC tended (P b 0.07) to have greater carcass shrink loss thansteers fed GH. These findings could be related to differences in grade fatthickness. Subcutaneous fat can act as a thermal insulator and reducewater losses during carcass cooling (Bezerra et al., 2012). Type of foragehad an effect on ribeye area, with steers fed diets containing GH havinglarger (P b 0.05) ribeye areas than those fed RC. These results could beexplained by differences in DMI, carcass weights and nitrogen utilizationefficiency when consuming these two forages (Fraser, Fychan, & Jones,2000). Diet had no effect on estimated lean yield or marbling score(Table 3). There were no differences in the distribution of yield and qual-ity grades among the dietary treatments (Table 3). Overall, the distribu-tion of yield and quality grades indicates that about 82% and 65% of thecarcasses graded Canada 1 and Canada AA, respectively (Table 3).
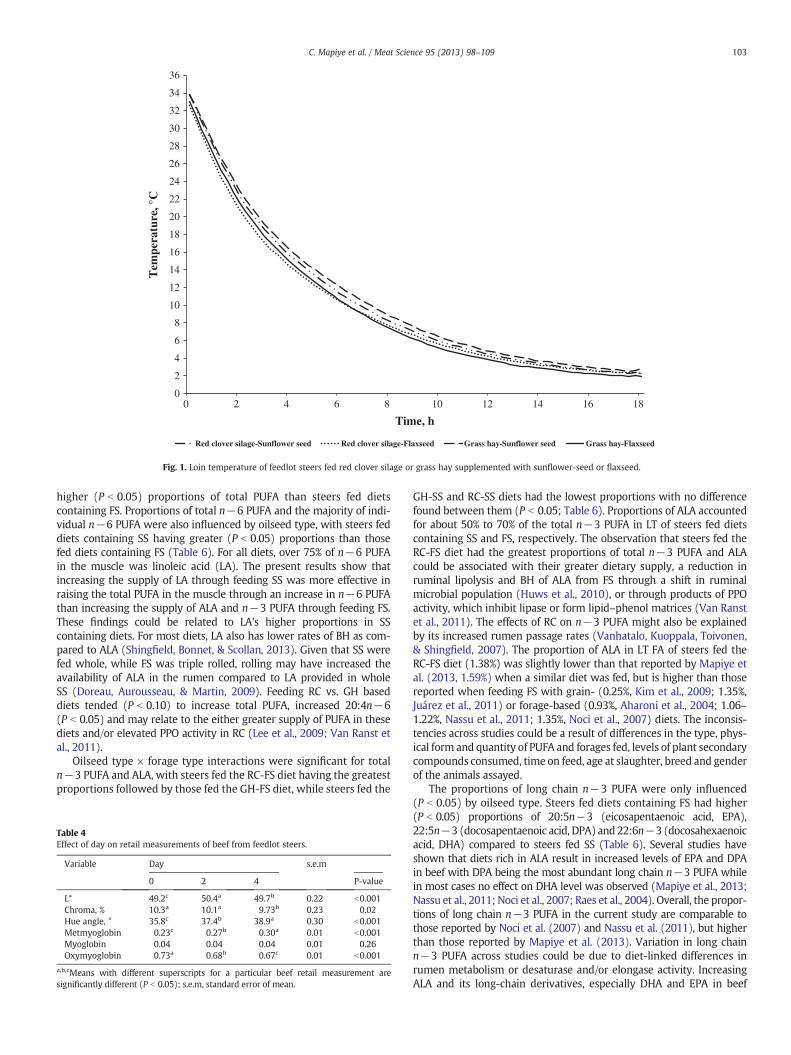
Loin temperature decline by diet data are presented in Fig. 1.Steers fed diets containing SS had higher (P = 0.05) 45 min post-slaughter LT temperatures than those fed FS (Table 3), but foragetype had no effect on 45 min LT temperature. Types of forage and oil-seed had no effect on 24 h muscle temperature (Table 3). Steers feddiets containing RC as opposed GH had higher (P = 0.05) 45 min LTpH. At 24 h, however, an oilseed type × forage type interaction wasdetected for LT pH, and steers fed the RC-SS diet had the highestpH, the GH-SS the lowest and steers fed the RC-FS and GH-FS dietshad intermediate values (P b 0.05; Table 3). Oilseed and forage typeaffectedmuscle L* and interacted to influence hue angle (P b 0.05). Feed-ing diets containing RC or FS resulted in darker (lower L*; P b 0.05) andredder (lower hue angle; P b 0.05) meat compared to feeding GH and SS(Table 3). Slower rates of live weight gain and lighter carcass weightsobserved for steers fed diets containing RC or FS likely resulted in fasterloin cooling rates (Fig. 1) to produce meat with a higher pH and a less
Longissimus thoracis quality measurespH, 45 min 6.65 6.67 6.73 6.71 0.03 0.93 0.05 0.56Temperature °C, 45 min 36.1 36.6 36.3 36.5 1.17 0.05 0.70 0.34pH, 24 h 5.64b 5.58c 5.66ab 5.68a 0.04 0.37 0.001 0.02Temperature °C, 24 h 1.46 1.41 1.54 1.48 0.42 0.31 0.15 0.97L*, 24 h 34.0 35.8 33.3 33.7 0.52 0.04 0.01 0.20Chroma, 24 h 21.3 22.7 21.0 21.1 0.61 0.13 0.07 0.21Hue angle, 24 h 21.9b 23.0a 21.5b 21.6b 0.45 0.03 0.001 0.04Drip loss, mg·g−1 (average of 6 and 16 d) 38.1 38.4 38.6 40.1 1.86 0.66 0.53 0.77Shear force, kg (average of 6 and 16 d) 5.90 5.69 6.70 5.84 0.44 0.08 0.12 0.30Protein, % 20.4 20.8 19.9 20.0 0.29 0.21 0.01 0.45Fat, % 4.27 4.36 4.21 4.26 0.86 0.88 0.86 0.97Moisture, % 72.9 72.7 73.8 73.4 0.38 0.29 0.01 0.77
a,bMeans with different superscripts for a particular carcass or longissimus thoracis quality trait are significantly different (P b 0.05); s.e.m, standard error of mean.1 Oilseed type × forage type interaction.2 Marbling score terminology: 100, devoid; 200, practically devoid; 300, trace; 400, slight; 500, small; 600, modest; 700, moderate; 800, slightly abundant; 900, moderately abundant;
1000, abundant; 1100, very abundant.3 No yield grade done on B4 carcasses.
102 C. Mapiye et al. / Meat Science 95 (2013) 98–109
desirable appearance. Młynek and Guliński (2007) obtained similarresults and attributed them to variation inmuscle fiber type compositionwith growth rate. Overall, slower growth rates result in higher contentsof type I muscle fibers and lower contents of type II muscle fibers(Młynek & Guliński, 2007). Type I muscle fibers are red in color, havehigh oxidative capacity, and are lower in glycogen content and glycolyticenzyme activity (Klont, Brocks, & Eikelenboom, 1998). Consequently,lactic acid production is reduced, muscle acidification slows down andmeat with redder and darker color is produced (Młynek & Guliński,2007).
Diet had no effect on LT drip loss, shear force at 6 or 16 d post-mortemor fat content (Table 3). Longissimus thoracis shear force, however, de-clined (P b 0.05) from 6.90 kg on day 6 to 5.16 kg on day 16. Slightlyhigher (P b 0.05) protein content was found when feeding GH vs. RCcontaining diets (Table 3), and may again be related to differences inDMI and nitrogen utilization efficiency between these two forages(Fraser et al., 2000). The slightly higher (P b 0.05) LT moisture reportedfor steers fed RC compared to GH containing diets (Table 3)may be partlyrelated to the higher 24 h LT pH. High muscle pH has been reported toelevate moisture content through an increase in water holding capacity(Byrne et al., 2001).
3.4. Steak retail display
As expected, all retail steak measurements were affected by timein display except for myoglobin (Table 4). Overall, L* values increasedup to day 2 and then decreased to day 4 (P b 0.05), chroma andoxymyoglobin values declined (P b 0.05) whereas hue angle andmetmyoglobin values rose (P b 0.05) with increasing time in display.
No interactions were found between time in display with either foragetype or oilseed type for any retail measurements (P b 0.05).
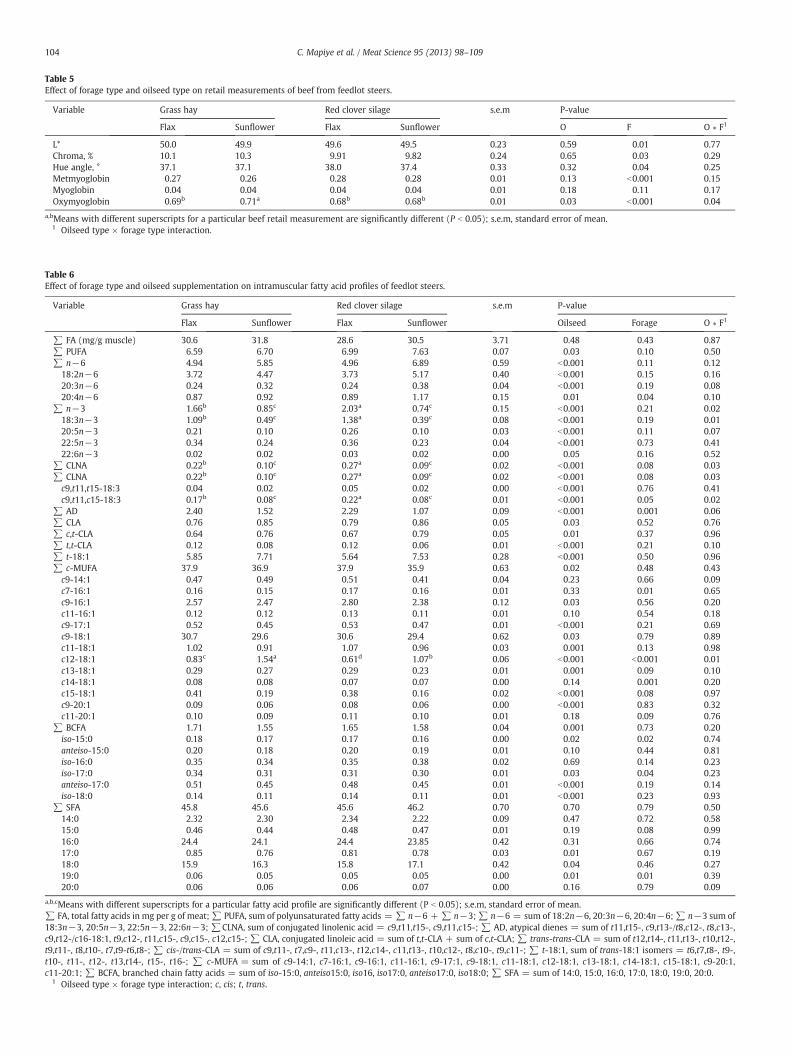
The LT content of oxymyoglobin was influenced by an oilseed ×forage type interaction with steaks from steers fed the GH-SS diethaving the highest (P b 0.05) values compared to steaks from steersfed other diets (Table 5). Forage type had an effect on L*, chroma,hue angle and the metmyoglobin content of steaks (Table 5). Steaksfrom steers fed diets containing RC had slightly lower (P b 0.05) L*and chroma values, and higher (P b 0.05) hue angle andmetmyoglobinvalues compared to steaks from steers fed GH. These findings agreewith earlier reports by Lee et al. (2009) and Scollan et al. (2006) whoattributed the differences to increased PUFA and reduced vitamin Elevels in the muscle of steers fed RC. In the current study, vitamin Ewas fed (135 IU/kg of dietary DM) in excess of the amount known toimprovemeat shelf-life (Liu, Lanari, & Schaefer, 1995), butmuscle levelsof vitamin E were not assessed. However, as noted below, the levels ofPUFA in the muscle tended (P = 0.10) to be higher in steers fed RCdiets than in steers fed GH. Variation in color during retail displayobserved when feeding these forages may also be partly attributed tothe small differences in LT moisture observed in the current experi-ment. Overall, high moisture content has been reported to reduce thestability of vitamin E in foods (Miquel, Alegrı́a, Barberá, Farré, &Clemente, 2004).
3.5. Longissimus thoracis fatty acid profiles
3.5.1. n−3 and n−6 polyunsaturated fatty acidsTotal LT FA were similar across diets (Table 6), but total PUFA
were influenced by oilseed type. Steers fed diets containing SS had
0
2
4
6
8
10
12
14
16
18
20
22
24
26
28
30
32
34
36
0 2 4 6 8 10 12 14 16 18
Tem
pera
ture
, °C
Time, h
Red clover silage-Sunflower seed Red clover silage-Flaxseed Grass hay-Sunflower seed Grass hay-Flaxseed
Fig. 1. Loin temperature of feedlot steers fed red clover silage or grass hay supplemented with sunflower-seed or flaxseed.
103C. Mapiye et al. / Meat Science 95 (2013) 98–109
higher (P b 0.05) proportions of total PUFA than steers fed dietscontaining FS. Proportions of total n−6 PUFA and the majority of indi-vidual n−6 PUFA were also influenced by oilseed type, with steers feddiets containing SS having greater (P b 0.05) proportions than thosefed diets containing FS (Table 6). For all diets, over 75% of n−6 PUFAin the muscle was linoleic acid (LA). The present results show thatincreasing the supply of LA through feeding SS was more effective inraising the total PUFA in the muscle through an increase in n−6 PUFAthan increasing the supply of ALA and n−3 PUFA through feeding FS.These findings could be related to LA's higher proportions in SScontaining diets. For most diets, LA also has lower rates of BH as com-pared to ALA (Shingfield, Bonnet, & Scollan, 2013). Given that SS werefed whole, while FS was triple rolled, rolling may have increased theavailability of ALA in the rumen compared to LA provided in wholeSS (Doreau, Aurousseau, & Martin, 2009). Feeding RC vs. GH baseddiets tended (P b 0.10) to increase total PUFA, increased 20:4n−6(P b 0.05) and may relate to the either greater supply of PUFA in thesediets and/or elevated PPO activity in RC (Lee et al., 2009; Van Ranst etal., 2011).
Oilseed type × forage type interactions were significant for totaln−3 PUFA and ALA, with steers fed the RC-FS diet having the greatestproportions followed by those fed the GH-FS diet, while steers fed the
Table 4Effect of day on retail measurements of beef from feedlot steers.
a,b,cMeans with different superscripts for a particular beef retail measurement aresignificantly different (P b 0.05); s.e.m, standard error of mean.
GH-SS and RC-SS diets had the lowest proportions with no differencefound between them (P b 0.05; Table 6). Proportions of ALA accountedfor about 50% to 70% of the total n−3 PUFA in LT of steers fed dietscontaining SS and FS, respectively. The observation that steers fed theRC-FS diet had the greatest proportions of total n−3 PUFA and ALAcould be associated with their greater dietary supply, a reduction inruminal lipolysis and BH of ALA from FS through a shift in ruminalmicrobial population (Huws et al., 2010), or through products of PPOactivity, which inhibit lipase or form lipid–phenol matrices (Van Ranstet al., 2011). The effects of RC on n−3 PUFA might also be explainedby its increased rumen passage rates (Vanhatalo, Kuoppala, Toivonen,& Shingfield, 2007). The proportion of ALA in LT FA of steers fed theRC-FS diet (1.38%) was slightly lower than that reported by Mapiye etal. (2013, 1.59%) when a similar diet was fed, but is higher than thosereported when feeding FS with grain- (0.25%, Kim et al., 2009; 1.35%,Juárez et al., 2011) or forage-based (0.93%, Aharoni et al., 2004; 1.06–1.22%, Nassu et al., 2011; 1.35%, Noci et al., 2007) diets. The inconsis-tencies across studies could be a result of differences in the type, phys-ical form and quantity of PUFA and forages fed, levels of plant secondarycompounds consumed, time on feed, age at slaughter, breed and genderof the animals assayed.
The proportions of long chain n−3 PUFA were only influenced(P b 0.05) by oilseed type. Steers fed diets containing FS had higher(P b 0.05) proportions of 20:5n−3 (eicosapentaenoic acid, EPA),22:5n−3 (docosapentaenoic acid, DPA) and 22:6n−3 (docosahexaenoicacid, DHA) compared to steers fed SS (Table 6). Several studies haveshown that diets rich in ALA result in increased levels of EPA and DPAin beef with DPA being the most abundant long chain n−3 PUFA whilein most cases no effect on DHA level was observed (Mapiye et al., 2013;Nassu et al., 2011; Noci et al., 2007; Raes et al., 2004). Overall, the propor-tions of long chain n−3 PUFA in the current study are comparable tothose reported by Noci et al. (2007) and Nassu et al. (2011), but higherthan those reported by Mapiye et al. (2013). Variation in long chainn−3 PUFA across studies could be due to diet-linked differences inrumen metabolism or desaturase and/or elongase activity. IncreasingALA and its long-chain derivatives, especially DHA and EPA in beef
Table 5Effect of forage type and oilseed type on retail measurements of beef from feedlot steers.
Variable Grass hay Red clover silage s.e.m P-value
a,bMeans with different superscripts for a particular beef retail measurement are significantly different (P b 0.05); s.e.m, standard error of mean.1 Oilseed type × forage type interaction.
Table 6Effect of forage type and oilseed supplementation on intramuscular fatty acid profiles of feedlot steers.
Variable Grass hay Red clover silage s.e.m P-value
Flax Sunflower Flax Sunflower Oilseed Forage O ∗ F1
a,b,cMeans with different superscripts for a particular fatty acid profile are significantly different (P b 0.05); s.e.m, standard error of mean.∑ FA, total fatty acids in mg per g of meat;∑ PUFA, sum of polyunsaturated fatty acids = ∑ n−6 + ∑ n−3;∑ n−6 = sum of 18:2n−6, 20:3n−6, 20:4n−6;∑ n−3 sum of18:3n−3, 20:5n−3, 22:5n−3, 22:6n−3; ∑CLNA, sum of conjugated linolenic acid = c9,t11,t15-, c9,t11,c15-; ∑ AD, atypical dienes = sum of t11,t15-, c9,t13-/t8,c12-, t8,c13-,c9,t12-/c16-18:1, t9,c12-, t11,c15-, c9,c15-, c12,c15-; ∑ CLA, conjugated linoleic acid = sum of t,t-CLA + sum of c,t-CLA; ∑ trans-trans-CLA = sum of t12,t14-, t11,t13-, t10,t12-,t9,t11-, t8,t10-, t7,t9-t6,t8-; ∑ cis-/trans-CLA = sum of c9,t11-, t7,c9-, t11,c13-, t12,c14-, c11,t13-, t10,c12-, t8,c10-, t9,c11-; ∑ t-18:1, sum of trans-18:1 isomers = t6,t7,t8-, t9-,t10-, t11-, t12-, t13,t14-, t15-, t16-; ∑ c-MUFA = sum of c9-14:1, c7-16:1, c9-16:1, c11-16:1, c9-17:1, c9-18:1, c11-18:1, c12-18:1, c13-18:1, c14-18:1, c15-18:1, c9-20:1,c11-20:1; ∑ BCFA, branched chain fatty acids = sum of iso-15:0, anteiso15:0, iso16, iso17:0, anteiso17:0, iso18:0; ∑ SFA = sum of 14:0, 15:0, 16:0, 17:0, 18:0, 19:0, 20:0.
1 Oilseed type × forage type interaction; c, cis; t, trans.
104 C. Mapiye et al. / Meat Science 95 (2013) 98–109
105C. Mapiye et al. / Meat Science 95 (2013) 98–109
remains a priority as they have been reported to have cardiovascular,immune and mental health benefits in humans (Molendi-Coste et al.,2011). In the current study, estimated levels of n−3 PUFA in LT fromsteers fed SS and FS containing diets would be 0.03 and 0.06 g per100 g LT, respectively, which would account for 10% and 20% of thelevels required to make an n−3 PUFA enrichment claim in Canada(≥0.3 g of n−3 PUFA per serving; CFIA, 2003). However, at retailmost lean steak is sold with subcutaneous fat contributing 5 to 15% ofthe whole steak, and in other species, this fat depot is included as partof the serving and can contribute significantly to the overall n−3PUFA enrichment level.
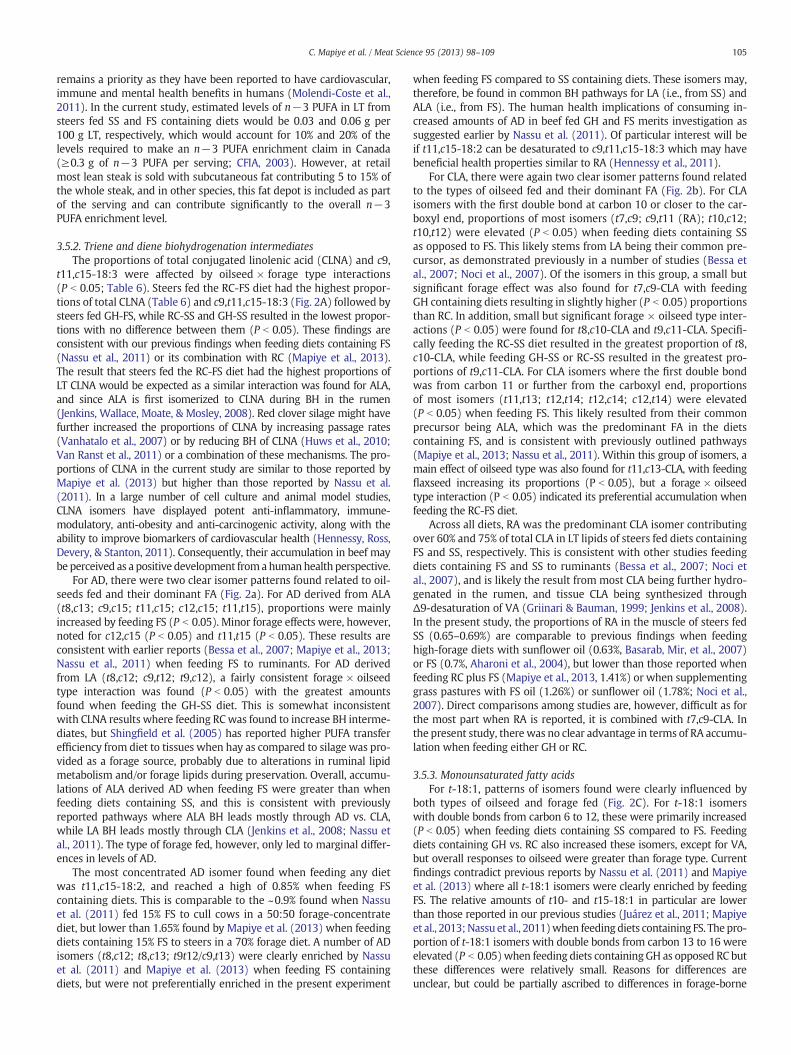
3.5.2. Triene and diene biohydrogenation intermediatesThe proportions of total conjugated linolenic acid (CLNA) and c9,
t11,c15-18:3 were affected by oilseed × forage type interactions(P b 0.05; Table 6). Steers fed the RC-FS diet had the highest propor-tions of total CLNA (Table 6) and c9,t11,c15-18:3 (Fig. 2A) followed bysteers fed GH-FS, while RC-SS and GH-SS resulted in the lowest propor-tions with no difference between them (P b 0.05). These findings areconsistent with our previous findings when feeding diets containing FS(Nassu et al., 2011) or its combination with RC (Mapiye et al., 2013).The result that steers fed the RC-FS diet had the highest proportions ofLT CLNA would be expected as a similar interaction was found for ALA,and since ALA is first isomerized to CLNA during BH in the rumen(Jenkins, Wallace, Moate, & Mosley, 2008). Red clover silage might havefurther increased the proportions of CLNA by increasing passage rates(Vanhatalo et al., 2007) or by reducing BH of CLNA (Huws et al., 2010;Van Ranst et al., 2011) or a combination of these mechanisms. The pro-portions of CLNA in the current study are similar to those reported byMapiye et al. (2013) but higher than those reported by Nassu et al.(2011). In a large number of cell culture and animal model studies,CLNA isomers have displayed potent anti-inflammatory, immune-modulatory, anti-obesity and anti-carcinogenic activity, along with theability to improve biomarkers of cardiovascular health (Hennessy, Ross,Devery, & Stanton, 2011). Consequently, their accumulation in beef maybe perceived as a positive development fromahumanhealth perspective.
For AD, there were two clear isomer patterns found related to oil-seeds fed and their dominant FA (Fig. 2a). For AD derived from ALA(t8,c13; c9,c15; t11,c15; c12,c15; t11,t15), proportions were mainlyincreased by feeding FS (P b 0.05). Minor forage effects were, however,noted for c12,c15 (P b 0.05) and t11,t15 (P b 0.05). These results areconsistent with earlier reports (Bessa et al., 2007; Mapiye et al., 2013;Nassu et al., 2011) when feeding FS to ruminants. For AD derivedfrom LA (t8,c12; c9,t12; t9,c12), a fairly consistent forage × oilseedtype interaction was found (P b 0.05) with the greatest amountsfound when feeding the GH-SS diet. This is somewhat inconsistentwith CLNA results where feeding RCwas found to increase BH interme-diates, but Shingfield et al. (2005) has reported higher PUFA transferefficiency from diet to tissues when hay as compared to silage was pro-vided as a forage source, probably due to alterations in ruminal lipidmetabolism and/or forage lipids during preservation. Overall, accumu-lations of ALA derived AD when feeding FS were greater than whenfeeding diets containing SS, and this is consistent with previouslyreported pathways where ALA BH leads mostly through AD vs. CLA,while LA BH leads mostly through CLA (Jenkins et al., 2008; Nassu etal., 2011). The type of forage fed, however, only led to marginal differ-ences in levels of AD.
The most concentrated AD isomer found when feeding any dietwas t11,c15-18:2, and reached a high of 0.85% when feeding FScontaining diets. This is comparable to the ~0.9% found when Nassuet al. (2011) fed 15% FS to cull cows in a 50:50 forage-concentratediet, but lower than 1.65% found by Mapiye et al. (2013) when feedingdiets containing 15% FS to steers in a 70% forage diet. A number of ADisomers (t8,c12; t8,c13; t9t12/c9,t13) were clearly enriched by Nassuet al. (2011) and Mapiye et al. (2013) when feeding FS containingdiets, but were not preferentially enriched in the present experiment
when feeding FS compared to SS containing diets. These isomers may,therefore, be found in common BH pathways for LA (i.e., from SS) andALA (i.e., from FS). The human health implications of consuming in-creased amounts of AD in beef fed GH and FS merits investigation assuggested earlier by Nassu et al. (2011). Of particular interest will beif t11,c15-18:2 can be desaturated to c9,t11,c15-18:3 which may havebeneficial health properties similar to RA (Hennessy et al., 2011).
For CLA, there were again two clear isomer patterns found relatedto the types of oilseed fed and their dominant FA (Fig. 2b). For CLAisomers with the first double bond at carbon 10 or closer to the car-boxyl end, proportions of most isomers (t7,c9; c9,t11 (RA); t10,c12;t10,t12) were elevated (P b 0.05) when feeding diets containing SSas opposed to FS. This likely stems from LA being their common pre-cursor, as demonstrated previously in a number of studies (Bessa etal., 2007; Noci et al., 2007). Of the isomers in this group, a small butsignificant forage effect was also found for t7,c9-CLA with feedingGH containing diets resulting in slightly higher (P b 0.05) proportionsthan RC. In addition, small but significant forage × oilseed type inter-actions (P b 0.05) were found for t8,c10-CLA and t9,c11-CLA. Specifi-cally feeding the RC-SS diet resulted in the greatest proportion of t8,c10-CLA, while feeding GH-SS or RC-SS resulted in the greatest pro-portions of t9,c11-CLA. For CLA isomers where the first double bondwas from carbon 11 or further from the carboxyl end, proportionsof most isomers (t11,t13; t12,t14; t12,c14; c12,t14) were elevated(P b 0.05) when feeding FS. This likely resulted from their commonprecursor being ALA, which was the predominant FA in the dietscontaining FS, and is consistent with previously outlined pathways(Mapiye et al., 2013; Nassu et al., 2011). Within this group of isomers, amain effect of oilseed type was also found for t11,c13-CLA, with feedingflaxseed increasing its proportions (P b 0.05), but a forage × oilseedtype interaction (P b 0.05) indicated its preferential accumulation whenfeeding the RC-FS diet.
Across all diets, RA was the predominant CLA isomer contributingover 60% and 75% of total CLA in LT lipids of steers fed diets containingFS and SS, respectively. This is consistent with other studies feedingdiets containing FS and SS to ruminants (Bessa et al., 2007; Noci etal., 2007), and is likely the result from most CLA being further hydro-genated in the rumen, and tissue CLA being synthesized throughΔ9-desaturation of VA (Griinari & Bauman, 1999; Jenkins et al., 2008).In the present study, the proportions of RA in the muscle of steers fedSS (0.65–0.69%) are comparable to previous findings when feedinghigh-forage diets with sunflower oil (0.63%, Basarab, Mir, et al., 2007)or FS (0.7%, Aharoni et al., 2004), but lower than those reported whenfeeding RC plus FS (Mapiye et al., 2013, 1.41%) or when supplementinggrass pastures with FS oil (1.26%) or sunflower oil (1.78%; Noci et al.,2007). Direct comparisons among studies are, however, difficult as forthe most part when RA is reported, it is combined with t7,c9-CLA. Inthe present study, there was no clear advantage in terms of RA accumu-lation when feeding either GH or RC.
3.5.3. Monounsaturated fatty acidsFor t-18:1, patterns of isomers found were clearly influenced by
both types of oilseed and forage fed (Fig. 2C). For t-18:1 isomerswith double bonds from carbon 6 to 12, these were primarily increased(P b 0.05) when feeding diets containing SS compared to FS. Feedingdiets containing GH vs. RC also increased these isomers, except for VA,but overall responses to oilseed were greater than forage type. Currentfindings contradict previous reports by Nassu et al. (2011) and Mapiyeet al. (2013) where all t-18:1 isomers were clearly enriched by feedingFS. The relative amounts of t10- and t15-18:1 in particular are lowerthan those reported in our previous studies (Juárez et al., 2011; Mapiyeet al., 2013;Nassu et al., 2011)when feeding diets containing FS. The pro-portion of t-18:1 isomers with double bonds from carbon 13 to 16 wereelevated (P b 0.05)when feeding diets containingGH as opposed RC butthese differences were relatively small. Reasons for differences areunclear, but could be partially ascribed to differences in forage-borne
Grass hay-Flaxseed Grass hay-Sunflower seed Red clover silage-Flaxseed Red clover silage-Sunflower seed
α,ßα,ß
α,ß
ß
α,ßα
α,ßα
C
Fig. 2. Effect of forage type and oilseed supplementation on atypical dienes (A), conjugated linoleic acid (B) and trans-18:1 isomers (C) in intramuscular fat from feedlot steers. a,b,c,d
Means (±standard error) with different superscripts for a particular fatty acid profile are significantly different (P b 0.05). α: Significant forage effect (P b 0.05); ß: Significant oil-seed effect (P b 0.05).
106 C. Mapiye et al. / Meat Science 95 (2013) 98–109
microbes or alterations in endogenous ruminal microbes (Kong, He,McAlister, Seviour, & Forster, 2010), or disparities in ruminal and duode-nal passage rates between these forages (Lee, Harris, Dewhurst, Merry, &Scollan, 2003).
Vaccenic acid was the major t-18:1 isomer and constituted over45% of total t18:1 irrespective of diet fed (Fig. 2C). The proportionsof VA found in LT regardless of diet were less than we previouslyfound when feeding FS in a high RC diet (Mapiye et al., 2013;6.37%) and when supplementing with either sunflower or flaxseedoil on pasture (Noci et al., 2007; 8.56%). Differences between presentresults and others may, therefore, be related to influences of non-oilcomponents of the diets. Specifically, the SS fed in the present exper-iment had a relatively low oil content (29.5%) compared to a typicalvalue of 40% (Gunstone & Harwood, 1994). Consequently, the amountof SS that had to be added to the diet to get 5.4% oil was relativelyhigh (18.4%) and the nutritive or forage value of the hull relativelylow. Subsequently, to balance the digestible energy content across diets,straw had to be added to the flaxseed containing diets, which wouldhave led to diminished overall quality of forage in FS containing diets.Results of the present study, therefore, dramatically reinforce the impor-tance of the non-oil components of the diet when trying to enrich BHintermediates, particularly VA, in beef.
Emphasis on increasing VA in beef relates to its abilities to reducepro-inflammatory cytokines (Jaudszus et al., 2012; Sofi et al., 2010)and platelet aggregation in humans (Sofi et al., 2010), and substantiallyreduce plasma triglycerides in animal models (Wang, Jacome-Sosa, &Proctor, 2012). It may also have positive health effects through Δ-9desaturation to RA, which may reduce risk of cardiovascular diseaseand cancer, increase bonemass andmodulate immune and inflammato-ry responses (Dilzer & Park, 2012). In the present study, the estimatedlevels of VA in LT from steers fed FS and SS containing diets would be0.08 and 0.12 g per 100 g LT, while the RA contents would be 0.01 and0.02 g per 100 g LT, respectively. Thus, the RA levels in lean steak fromsteers fed SS would contribute 0.6 to 20% of the estimated dietary CLAintake of 0.1 to 3.0 g/day considered necessary for cancer prevention(Ip, Singh, Thompson, & Scimeca, 1994; Knekt, Järvinen, Seppänen,Pukkala, & Aromaa, 1996; Ritzenthaler et al., 2001). Although the levelsof VA required to elicit positive effects on human health remain to beelucidated, up to 30% of VA is converted to RA in humans (Turpeinenet al., 2002) suggesting that VA could be regarded as potential RA.Including VA conversion, LT from steers fed SS could therefore contrib-ute 1.8 to 56% (VA, 1.2 to 36% + RA, 0.6 to 20%) of the dietary CLA intakeconsidered necessary for cancer prevention. The relative risk to humanhealth of consuming the individual t-18:1 isomers other than VA
107C. Mapiye et al. / Meat Science 95 (2013) 98–109
remains to be elucidated, and thus recommendations to either enrich ordeplete these isomers should be reserved until their effects are known.
Feeding cattle a combination of oils or oilseeds rich in ALA and LAhasbeen found to result in a synergistic accumulation of VA (AbuGhazaleh,Schingoethe, Hippen, Kalscheur, & Whitlock, 2002) and CLA (Lock &Garnsworthy, 2002) in tissues, which may have additive health effects(Jacome-Sosa et al., 2010). In this respect, it could be worthwhile toevaluate if supplementing high-forage diets with a blend of SS andFS would simultaneously enhance concentrations of VA, RA and n−3PUFA in beef. Effects of feeding mixtures of SS, FS and sources oflong-chain PUFA such as EPA and DHA, which are known potentinhibitors of BH of 18:1 to 18:0 in the rumen (Chow et al., 2004; Maia,Chaudhary, Figueres, &Wallace, 2007)may also beworth investigating.
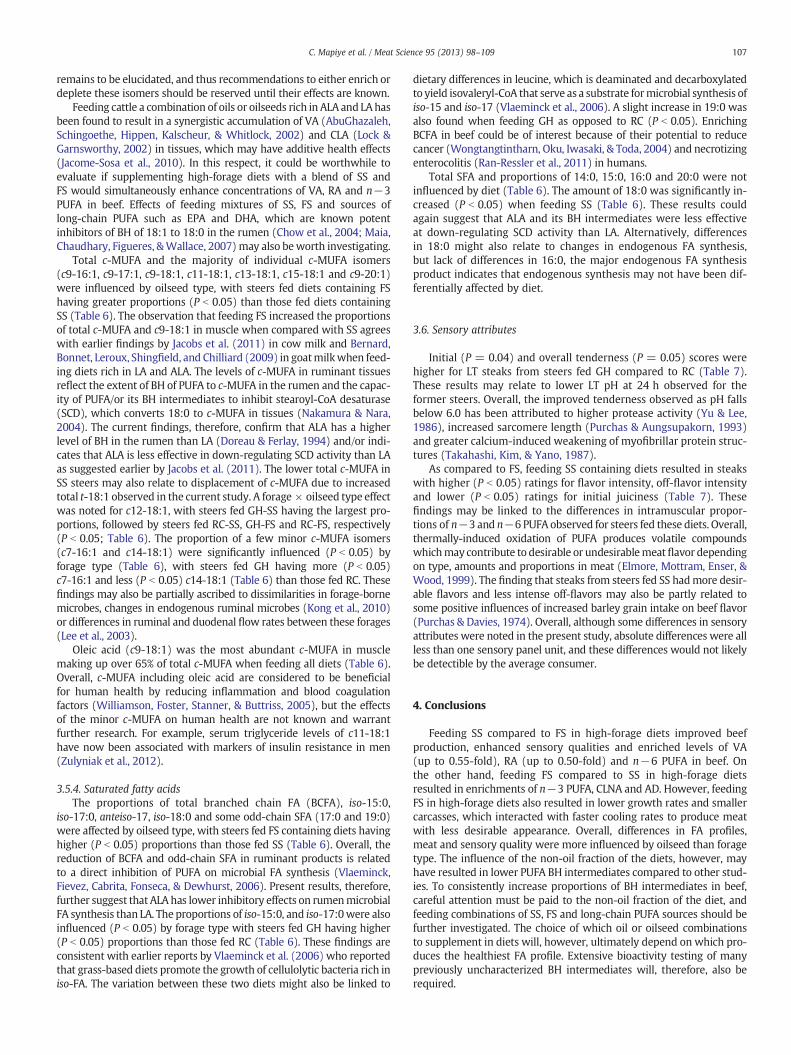
Total c-MUFA and the majority of individual c-MUFA isomers(c9-16:1, c9-17:1, c9-18:1, c11-18:1, c13-18:1, c15-18:1 and c9-20:1)were influenced by oilseed type, with steers fed diets containing FShaving greater proportions (P b 0.05) than those fed diets containingSS (Table 6). The observation that feeding FS increased the proportionsof total c-MUFA and c9-18:1 in muscle when compared with SS agreeswith earlier findings by Jacobs et al. (2011) in cow milk and Bernard,Bonnet, Leroux, Shingfield, and Chilliard (2009) in goatmilkwhen feed-ing diets rich in LA and ALA. The levels of c-MUFA in ruminant tissuesreflect the extent of BH of PUFA to c-MUFA in the rumen and the capac-ity of PUFA/or its BH intermediates to inhibit stearoyl-CoA desaturase(SCD), which converts 18:0 to c-MUFA in tissues (Nakamura & Nara,2004). The current findings, therefore, confirm that ALA has a higherlevel of BH in the rumen than LA (Doreau & Ferlay, 1994) and/or indi-cates that ALA is less effective in down-regulating SCD activity than LAas suggested earlier by Jacobs et al. (2011). The lower total c-MUFA inSS steers may also relate to displacement of c-MUFA due to increasedtotal t-18:1 observed in the current study. A forage × oilseed type effectwas noted for c12-18:1, with steers fed GH-SS having the largest pro-portions, followed by steers fed RC-SS, GH-FS and RC-FS, respectively(P b 0.05; Table 6). The proportion of a few minor c-MUFA isomers(c7-16:1 and c14-18:1) were significantly influenced (P b 0.05) byforage type (Table 6), with steers fed GH having more (P b 0.05)c7-16:1 and less (P b 0.05) c14-18:1 (Table 6) than those fed RC. Thesefindings may also be partially ascribed to dissimilarities in forage-bornemicrobes, changes in endogenous ruminal microbes (Kong et al., 2010)or differences in ruminal and duodenal flow rates between these forages(Lee et al., 2003).
Oleic acid (c9-18:1) was the most abundant c-MUFA in musclemaking up over 65% of total c-MUFA when feeding all diets (Table 6).Overall, c-MUFA including oleic acid are considered to be beneficialfor human health by reducing inflammation and blood coagulationfactors (Williamson, Foster, Stanner, & Buttriss, 2005), but the effectsof the minor c-MUFA on human health are not known and warrantfurther research. For example, serum triglyceride levels of c11-18:1have now been associated with markers of insulin resistance in men(Zulyniak et al., 2012).
3.5.4. Saturated fatty acidsThe proportions of total branched chain FA (BCFA), iso-15:0,
iso-17:0, anteiso-17, iso-18:0 and some odd-chain SFA (17:0 and 19:0)were affected by oilseed type, with steers fed FS containing diets havinghigher (P b 0.05) proportions than those fed SS (Table 6). Overall, thereduction of BCFA and odd-chain SFA in ruminant products is relatedto a direct inhibition of PUFA on microbial FA synthesis (Vlaeminck,Fievez, Cabrita, Fonseca, & Dewhurst, 2006). Present results, therefore,further suggest that ALA has lower inhibitory effects on rumenmicrobialFA synthesis than LA. The proportions of iso-15:0, and iso-17:0were alsoinfluenced (P b 0.05) by forage type with steers fed GH having higher(P b 0.05) proportions than those fed RC (Table 6). These findings areconsistent with earlier reports by Vlaeminck et al. (2006) who reportedthat grass-based diets promote the growth of cellulolytic bacteria rich iniso-FA. The variation between these two diets might also be linked to
dietary differences in leucine, which is deaminated and decarboxylatedto yield isovaleryl-CoA that serve as a substrate formicrobial synthesis ofiso-15 and iso-17 (Vlaeminck et al., 2006). A slight increase in 19:0 wasalso found when feeding GH as opposed to RC (P b 0.05). EnrichingBCFA in beef could be of interest because of their potential to reducecancer (Wongtangtintharn, Oku, Iwasaki, & Toda, 2004) and necrotizingenterocolitis (Ran-Ressler et al., 2011) in humans.
Total SFA and proportions of 14:0, 15:0, 16:0 and 20:0 were notinfluenced by diet (Table 6). The amount of 18:0 was significantly in-creased (P b 0.05) when feeding SS (Table 6). These results couldagain suggest that ALA and its BH intermediates were less effectiveat down-regulating SCD activity than LA. Alternatively, differencesin 18:0 might also relate to changes in endogenous FA synthesis,but lack of differences in 16:0, the major endogenous FA synthesisproduct indicates that endogenous synthesis may not have been dif-ferentially affected by diet.
3.6. Sensory attributes
Initial (P = 0.04) and overall tenderness (P = 0.05) scores werehigher for LT steaks from steers fed GH compared to RC (Table 7).These results may relate to lower LT pH at 24 h observed for theformer steers. Overall, the improved tenderness observed as pH fallsbelow 6.0 has been attributed to higher protease activity (Yu & Lee,1986), increased sarcomere length (Purchas & Aungsupakorn, 1993)and greater calcium-induced weakening of myofibrillar protein struc-tures (Takahashi, Kim, & Yano, 1987).
As compared to FS, feeding SS containing diets resulted in steakswith higher (P b 0.05) ratings for flavor intensity, off-flavor intensityand lower (P b 0.05) ratings for initial juiciness (Table 7). Thesefindings may be linked to the differences in intramuscular propor-tions of n−3 and n−6 PUFA observed for steers fed these diets. Overall,thermally-induced oxidation of PUFA produces volatile compoundswhichmay contribute to desirable or undesirablemeatflavor dependingon type, amounts and proportions in meat (Elmore, Mottram, Enser, &Wood, 1999). The finding that steaks from steers fed SS hadmore desir-able flavors and less intense off-flavors may also be partly related tosome positive influences of increased barley grain intake on beef flavor(Purchas & Davies, 1974). Overall, although some differences in sensoryattributes were noted in the present study, absolute differences were allless than one sensory panel unit, and these differences would not likelybe detectible by the average consumer.
4. Conclusions
Feeding SS compared to FS in high-forage diets improved beefproduction, enhanced sensory qualities and enriched levels of VA(up to 0.55-fold), RA (up to 0.50-fold) and n−6 PUFA in beef. Onthe other hand, feeding FS compared to SS in high-forage dietsresulted in enrichments of n−3 PUFA, CLNA and AD. However, feedingFS in high-forage diets also resulted in lower growth rates and smallercarcasses, which interacted with faster cooling rates to produce meatwith less desirable appearance. Overall, differences in FA profiles,meat and sensory quality were more influenced by oilseed than foragetype. The influence of the non-oil fraction of the diets, however, mayhave resulted in lower PUFA BH intermediates compared to other stud-ies. To consistently increase proportions of BH intermediates in beef,careful attention must be paid to the non-oil fraction of the diet, andfeeding combinations of SS, FS and long-chain PUFA sources should befurther investigated. The choice of which oil or oilseed combinationsto supplement in diets will, however, ultimately depend on which pro-duces the healthiest FA profile. Extensive bioactivity testing of manypreviously uncharacterized BH intermediates will, therefore, also berequired.
Table 7Effect of forage type and oilseed type on sensory of beef from feedlot steers.
Variables Grass hay Red clover silage s.e.m
Flax Sunflower Flax Sunflower Oilseed Forage F ∗ O1
a,b,cMeans with different superscripts for a particular sensory trait are significantly different (P b 0.05); s.e.m, standard error of mean.1 Oilseed type × forage type interaction; 8-point descriptive scales (1 = extremely tough, extremely dry, extremely bland flavor, extremely intense off-flavor, abundant connec-
tive tissue; and 8 = extremely tender, extremely juicy, extremely intense flavor, no off-flavor, no connective tissue detected).
108 C. Mapiye et al. / Meat Science 95 (2013) 98–109
Acknowledgments
This research was funded by the Alberta Meat and Livestock Agency(ALMA). Drs. C. Mapiye and T.D. Turner acknowledge the receipt ofNSERC Fellowships funded through ALMA. Dr. S.D. Proctor holds a NewInvestigator Award from the Heart and Stroke Foundation of Canada.Special thanks are extended to staff at the Lacombe Research Centre(LRC) Beef Unit of AAFC for animal care, animalmanagement and samplecollection. The slaughter and processing of the cattle by the LRC abattoirstaff is gratefully acknowledged. Contributions of the meat grading andquality staff at the LRC to the results are appreciated. Ms. I.L. Larsen isacknowledged for her valuable assistance in statistical analysis.
References
AbuGhazaleh, A. A., Schingoethe, D. J., Hippen, A. R., Kalscheur, K. F., & Whitlock, L. A.(2002). Fatty acid profiles of milk and rumen digesta from cows fed fish oil, extrudedsoybeans or their blend. Journal of Dairy Science, 85(9), 2266–2276.
Aharoni, Y., Orlov, A., & Brosh, A. (2004). Effects of high-forage content and oilseedsupplementation of fattening diets on conjugated linoleic acid (CLA) and transfatty acids profiles of beef lipid fractions. Animal Feed Science and Technology,117(1–2), 43–60.
Aldai, N., Aalhus, J. L., Dugan, M. E. R., Robertson, W. M., McAllister, T. A., Walter, L. J., &McKinnon, J. J. (2010). Comparison of wheat- versus corn-based dried distillers'grains with solubles on meat quality of feedlot cattle.Meat Science, 84(3), 569–577.
AOAC (2006). Official methods of analysis (14th ed.)Washington, DC, USA: Associationof Official Analytical Chemists (AOAC).
Basarab, J. A., Aalhus, J. L., Shah, M. A., Mir, P. S., Baron, V. S., Dugan, M., Okine, E. K., &Robertson, W. M. (2007). Effect of feeding sunflower seeds on the performance,carcass characteristics, meat quality, retail stability and sensory characteristics ofpasture-fed and feedlot finished beef. Canadian Journal of Animal Science, 87(1), 15–27.
Basarab, J. A., Mir, P. S., Aalhus, J. L., Shah,M. A., Baron, V. S., Okine, E. K., & Robertson,W.M.(2007). Effect of sunflower seed supplementation on the fatty acid composition ofmuscle and adipose tissue of pasture-fed and feedlot finished beef. Canadian Journalof Animal Science, 87(1), 71–86.
Bernard, L., Bonnet, M., Leroux, C., Shingfield, K. J., & Chilliard, Y. (2009). Effect ofsunflower-seed oil and linseed oil on tissue lipid metabolism, gene expression,and milk fatty acid secretion in Alpine goats fed maize silage-based diets. Journalof Dairy Science, 92(12), 6083–6094.
Bessa, R. J. B., Alves, S. P., Jerónimo, E., Alfaia, C. M., Prates, J. A. M., & Santos-Silva, J.(2007). Effect of lipid supplements on ruminal biohydrogenation intermediatesand muscle fatty acids in lambs. European Journal of Lipid Science and Technology,109(8), 868–878.
Bezerra, S. B. L., Véras, A. S. C., de Andrade Silva, D. K., de Andrade Ferreira,M., Pereira, K. P.,de Arruda Santos, G. R., Magalhães, A. L. R., & de Almeida, O. C. (2012). Morphometryand carcass characteristics of goats submitted to grazing in the Caatinga. RevistaBrasileira de Zootecnia, 41(1), 131–137.
Brethour, J. R. (1992). The repeatability and accuracy of ultrasound in measuringbackfat of cattle. Journal of Animal Science, 70(4), 1039–1044.
Bull, H. S. (1981). Estimating the nutrient value of corn silage. Proceedings of 41stsemi annual meeting of American feed manufacturers association, 18–20 November,Lexington, KY (pp. 15–19).
Byrne, D. V., Bredie, W. L. P., Bak, L. S., Bertelsen, G., Martens, H., & Martens, M. (2001).Sensory and chemical analysis of cooked porcine meat patties in relation towarmed-over flavour and pre-slaughter stress. Meat Science, 59(3), 229–249.
Canadian Food Inspection Agency (1992). Livestock and poultry carcass grading regula-tions, office consolidation. Part III. Schedules I and II (online). (bhttp://laws.justice.gc.ca/en/C-0.4/SOR-92-541> (accessed 12.12.2012)).
CCAC (1993). In E. D. Olfert, B. M. Cross, & A. A. McWilliams (Eds.), (2nd ed.)Guide tothe care and use of experimental animals, Vol. 1, Ottawa, Ontario, Canada: CanadianCouncil on Animal Care (CCAC).
CFIA (2003). Guide to food labelling and advertising. : Canadian Food InspectionAgency (http://www.inspection.gc.ca/english/fssa/labeti/guide/toce.shtml. (accessed12.12.2012)).
Chow, T. T., Fievez, V., Moloney, A. P., Raes, K., Demeyer, D., & Smet, S. D. (2004). Effectof fish oil on in vitro rumen lipolysis, apparent biohydrogenation of linoleic andlinolenic acid and accumulation of biohydrogenation intermediates. Animal FeedScience and Technology, 117(1–2), 1–12.
Commission Internationale de l'Eclairage (1978). Recommendations on uniform colorspaces — Color difference equations — Psychometric color terms (CIE publicationno.15 (E-1.3.3)1971/(TC-1.3), supplement no. 2, pp. 8–12). (Paris, France).
Cruz-Hernandez, C., Deng, Z., Zhou, J., Hill, A. R., Yurawecz, M. P., Delmonte, P.,Mossoba, M. M., Dugan, M. E. R., & Kramer, J. K. G. (2004). Methods for analysisof conjugated linoleic acids and trans-18:1 isomers in dairy fats by using a combi-nation of gas chromatography, silver-ion thin-layer chromatography/gas chroma-tography, and silver-ion liquid chromatography. Journal of AOAC International,87(2), 545–562.
Dilzer, A., & Park, Y. (2012). Implication of conjugated linoleic acid (CLA) in humanhealth. Critical Reviews in Food Science and Nutrition, 52(6), 488–513.
Doreau, M., Aurousseau, E., & Martin, C. (2009). Effects of linseed lipids fed as rolledseeds, extruded seeds or oil on organic matter and crude protein digestion incows. Animal Feed Science and Technology, 150(3–4), 187–196.
Doreau, M., & Ferlay, A. (1994). Digestion and utilisation of fatty acids by ruminants.Animal Feed Science and Technology, 45(3–4), 379–396.
Dugan, M. E. R., Kramer, J. K. G., Robertson, W. M., Meadus, W. J., Aldai, N., & Rolland,D.C. (2007). Comparing subcutaneous adipose tissue in beef and muskox with em-phasis on trans 18:1 and conjugated linoleic acids. Lipids, 42(6), 509–518.
Elmore, J. S., Mottram, D. S., Enser, M., & Wood, J. D. (1999). Effect of the polyunsaturatedfatty acid composition of beef muscle on the profile of aroma volatiles. Journal ofAgricultural and Food Chemistry, 47(4), 1619–1625.
Folch, J., Lees, M., & Sloane Stanley, G. H. (1957). A simple method for the isolation andpurification of total lipids from animal tissues. The Journal of Biological Chemistry,226(1), 497–509.
Fraser, M. D., Fychan, R., & Jones, R. (2000). Voluntary intake, digestibility and nitrogen uti-lization by sheep fed ensiled forage legumes. Grass and Forage Science, 55(3), 271–279.
Gómez-Cortés, P., Bach, A., Luna, P., Juárez, M., & de la Fuente, M. A. (2009). Effects ofextruded linseed supplementation on n−3 fatty acids and conjugated linoleicacid in milk and cheese from ewes. Journal of Dairy Science, 92(9), 4122–4134.
Griinari, J. M., & Bauman, D. E. (1999). Biosynthesis of conjugated linoleic acid and its in-corporation into meat andmilk in ruminants. In M. P. Yurawecz, M.Mossoba, J. K. G.Kramer, G. Nelson, & M. W. Pariza (Eds.), Advances in conjugated linoleic acid re-search, Vol. 1. (pp. 180–200)Champaign, IL (USA): AOCS Press.
Gunstone, F. D., & Harwood, J. L. (1994). Occurrence and characterization of oils andfats. In F. D. Gunstone, J. L. Harwood, & F. B. Padley (Eds.), The lipid handbook(pp. 101). New York: Chapman & Hall.
He, M. L., McAllister, T. A., Kastelic, J. P., Mir, P. S., Aalhus, J. L., Dugan, M. E. R., Aldai, N.,& McKinnon, J. J. (2012). Feeding flaxseed in grass hay and barley silage diets tobeef cows increases alpha-linolenic acid and its biohydrogenation intermediatesin subcutaneous fat. Journal of Animal Science, 90(2), 592–604.
Hennessy, A. A., Ross, R. P., Devery, R., & Stanton, C. (2011). The health promoting prop-erties of the conjugated isomers of α-linolenic acid. Lipids, 46(2), 105–119.
Huws, S. A., Lee, M. R. F., Muetzel, S. M., Scott, M. B., Wallace, R. J., & Scollan, N. D.(2010). Forage type and fish oil cause shifts in rumen bacterial diversity. FEMSMicrobiology Ecology, 73(2), 396–407.
Ip, C., Singh, M., Thompson, H. J., & Scimeca, J. A. (1994). Conjugated linoleic acid sup-presses mammary carcinogenesis and proliferative activity of the mammary glandin the rat. Cancer Research, 54(5), 1212–1215.
Jacobs, A. A. A., van Baal, J., Smits, M. A., Taweel, H. Z. H., Hendriks, W. H., van Vuuren,A.M., & Dijkstra, J. (2011). Effects of feeding rapeseed oil, soybean oil, or linseed oilon stearoyl-CoA desaturase expression in the mammary gland of dairy cows. Journalof Dairy Science, 94(2), 874–887.
Jacome-Sosa, M., Lu, J., Wang, Y., Ruth, M., Wright, D., Reaney, M., Shen, J., Field, C., Vine,D., & Proctor, S. (2010). Increased hypolipidemic benefits of cis-9, trans-11 conju-gated linoleic acid in combination with trans-11 vaccenic acid in a rodent model ofthe metabolic syndrome, the JCR:LA-cp rat. Nutrition & Metabolism, 7(1), 1–10.
Jaudszus, A., Jahreis, G., Schlörmann, W., Fischer, J., Kramer, R., Degen, C., Rohrer, C., Roth,A., Gabriel, H., Barz, D., & Gruen, M. (2012). Vaccenic acid-mediated reduction in
109C. Mapiye et al. / Meat Science 95 (2013) 98–109
cytokine production is independent of c9, t11-CLA in human peripheral bloodmononuclear cells. Biochimica et Biophysica Acta — Molecular and Cell Biology ofLipids, 1821(10), 1316–1322.
Jenkins, T. C. (1993). Lipid metabolism in the rumen. Journal of Dairy Science, 76(12),3851–3863.
Jenkins, T. C., & Bridges, W. C., Jr. (2007). Protection of fatty acids against ruminalbiohydrogenation in cattle. European Journal of Lipid Science and Technology,109(8), 778–789.
Jenkins, T. C., Wallace, R. J., Moate, P. J., & Mosley, E. E. (2008). Board-invited review:Recent advances in biohydrogenation of unsaturated fatty acids within therumen microbial ecosystem. Journal of Animal Science, 86(2), 397–412.
Jeremiah, L. E., & Gibson, L. L. (2001). The influence of packaging and storage time onthe retail properties and case-life of retail-ready beef. Food Research International,34(7), 621–631.
Juárez, M., Dugan, M. E. R., Aalhus, J. L., Aldai, N., Basarab, J. A., Baron, V. S., & McAllister,T. A. (2011). Effects of vitamin E and flaxseed on rumen-derived fatty acid interme-diates in beef intramuscular fat. Meat Science, 88(3), 434–440.
Kim, C. M., Kim, J. H., Oh, Y. K., Park, E. K., Ahn, G. C., Lee, G. Y., Lee, J. I., & Park, K. K.(2009). Effects of flaxseed diets on performance, carcass characteristics and fattyacid composition of Hanwoo steers. Asian-Australasian Journal of Animal Sciences,22(8), 1151–1159.
Klont, R. E., Brocks, L., & Eikelenboom, G. (1998). Muscle fibre type and meat quality.Meat Science, 49(Supplement 1(0)), S219–S229.
Knekt, P., Järvinen, R., Seppänen, R., Pukkala, E., & Aromaa, A. (1996). Intake of dairyproducts and the risk of breast cancer. British Journal of Cancer, 73(5), 687–691.
Kong, Y., He, M., McAlister, T., Seviour, R., & Forster, R. (2010). Quantitative fluores-cence in situ hybridization of microbial communities in the rumens of cattle feddifferent diets. Applied and Environmental Microbiology, 76(20), 6933–6938.
Kramer, J. K. G., Hernandez, M., Cruz-Hernandez, C., Kraft, J., & Dugan, M. E. R. (2008).Combining results of two GC separations partly achieves determination of all cisand trans 16:1, 18:1, 18:2 and 18:3 except CLA isomers of milk fat as demonstratedusing ag-ion SPE fractionation. Lipids, 43(3), 259–273.
Krzywicki, K. (1979). Assessment of relative content of myoglobin, oxymyoglobin andmetmyoglobin at the surface of beef. Meat Science, 3(1), 1–10.
Larmond, E. (1977). Laboratory methods for sensory evaluation of foods. Ottawa, ON:Agriculture Canada (Publ. 1637).
Lee, M. R. F., Evans, P. R., Nute, G. R., Richardson, R. I., & Scollan, N. D. (2009). A compar-ison between red clover silage and grass silage feeding on fatty acid composition,meat stability and sensory quality of the M. Longissimus muscle of dairy cullcows. Meat Science, 81(4), 738–744.
Lee, M. R. F., Harris, L. J., Dewhurst, R. J., Merry, R. J., & Scollan, N. D. (2003). The effect ofclover silages on long chain fatty acid rumen transformations and digestion in beefsteers. Animal Science, 76(3), 491–501.
Liu, Q., Lanari, M. C., & Schaefer, D. M. (1995). A review of dietary vitamin E supplementa-tion for improvement of beef quality. Journal of Animal Science, 73(10), 3131–3140.
Lock, A. L., & Garnsworthy, P. C. (2002). Independent effects of dietary linoleic andlinolenic fatty acids on the conjugated linoleic acid content of cows' milk. AnimalScience, 74(1), 163–176.
Maia, M. R. G., Chaudhary, L. C., Figueres, L., & Wallace, R. J. (2007). Metabolism of poly-unsaturated fatty acids and their toxicity to the microflora of the rumen. AntonieVan Leeuwenhoek, 91(4), 303–314.
Mapiye, C., Turner, T. D., Rolland, D. C., Basarab, J. A., Baron, V. S., McAllister, T. A., Block,H. C., Uttaro, B., Aalhus, J. L., & Dugan, M. E. R. (2013). Adipose tissue and musclefatty acid profiles of steers fed red clover silage with and without flaxseed. LivestockScience, 151(1), 11–20.
Miquel, E., Alegrı ́a, A., Barberá, R., Farré, R., & Clemente, G. (2004). Stability of tocoph-erols in adapted milk-based infant formulas during storage. International DairyJournal, 14(11), 1003–1011.
Mir, P. S., Ivan, M., He, M. L., Pink, B., Okine, E., Goonewardene, L., McAllister, T. A.,Weselake, R., & Mir, Z. (2003). Dietary manipulation to increase conjugated linoleicacids and other desirable fatty acids in beef: A review. Canadian Journal of AnimalScience, 83, 673–685.
Młynek, K., & Guliński, P. (2007). The effect of growth rate and age at slaughter ondressing percentage and colour, pH48 and microstructure of longissimus dorsimuscle in Black-and-White (BW) bulls vs commercial crossbreds of BW withbeef breeds. Animal Science Papers and Reports, 25(2), 65–71.
Molendi-Coste, O., Legry, V., & Leclercq, I. A. (2011). Why and how meet n−3 PUFAdietary recommendations? Gastroenterology Research and Practice.
Nakamura, M. T., & Nara, T. Y. (2004). Structure, function, and dietary regulation of Δ6,Δ5, and Δ9 desaturases. Annual Review of Nutrition, 24, 345–376.
Nassu, R. T., Dugan, M. E. R., He, M. L., McAllister, T. A., Aalhus, J. L., Aldai, N., & Kramer,J. K. G. (2011). The effects of feeding flaxseed to beef cows given forage baseddiets on fatty acids of longissimus thoracis muscle and backfat. Meat Science,89(4), 469–477.
Noci, F., French, P., Monahan, F. J., & Moloney, A. P. (2007). The fatty acid compositionof muscle fat and subcutaneous adipose tissue of grazing heifers supplementedwith plant oil-enriched concentrates. Journal of Animal Science, 85(4), 1062–1073.
Purchas, R. W., & Aungsupakorn, R. (1993). Further investigations into the relationshipbetween ultimate pH and tenderness for beef samples from bulls and steers. MeatScience, 34(2), 163–178.
Purchas, R. W., & Davies, H. L. (1974). Carcass and meat quality of Friesian steers fed oneither pasture or barley. Australian Journal of Agricultural Research, 25(1), 183–192.
Raes, K., De Smet, S., & Demeyer, D. (2004). Effect of dietary fatty acids on incorporationof long chain polyunsaturated fatty acids and conjugated linoleic acid in lamb, beefand pork meat: A review. Animal Feed Science and Technology, 113(1–4), 199–221.
Ran-Ressler, R. R., Khailova, L., Arganbright, K. M., Adkins-Rieck, C. K., Jouni, Z. E., Koren,O., Ley, R. E., Brenna, J. T., & Dvorak, B. (2011). Branched chain fatty acids reducethe incidence of necrotizing enterocolitis and alter gastrointestinal microbial ecologyin a neonatal rat model. PLoS One, 6(12).
Ritzenthaler, K. L., McGuire, M. K., Falen, R., Shultz, T. D., Dasgupta, N., & McGuire, M. A.(2001). Estimation of conjugated linoleic acid intake by written dietary assessmentmethodologies underestimates actual intake evaluated by food duplicate method-ology. Journal of Nutrition, 131(5), 1548–1554.
Sarnklong, C., Coneja, J. W., Pellikaan, W., & Hendriks, W. H. (2010). Utilization of ricestraw and different treatments to improve its feed value for ruminants: A review.Asian-Australasian Journal of Animal Sciences, 23(5), 680–692.
SAS (2009). SAS user's guide: Statistics. SAS for windows. Release 9.2. Cary NC: SAS InstituteInc.
Scollan, N. D., Costa, P., Hallett, K., Nute, G. R., Wood, J. D., & Richardson, R. I. (2006). Thefatty acid composition of muscle fat and relationships to meat quality in Charolaissteers: Influence of level of red clover in the diet. Proceedings of the British Society ofAnimal Science (pp. 23). : British Society of Animal Science0906562 52 X.
Shibata, K. (1966). Spectrophotometry of opaque biological materials. In D. Glick (Ed.),Methods of biochemical analysis, Vol. 9. (pp. 217–234)New York: Interscience.
Shingfield, K. J., Bonnet, M., & Scollan, N. D. (2013). Recent developments in altering the fattyacid composition of ruminant-derived foods. Animal, 1(Supplement 1), 132–162.
Shingfield, K. J., Salo-Väänänen, P., Pahkala, E., Toivonen, V., Jaakkola, S., Piironen, V., &Huhtanen, P. (2005). Effect of forage conservation method, concentrate level andpropylene glycol on the fatty acid composition and vitamin content of cows'milk. The Journal of Dairy Research, 72(03), 349–361.
Sofi, F., Buccioni, A., Cesari, F., Gori, A. M., Minieri, S., Mannini, L., Casini, A., Gensini, G.F.,Abbate, R., & Antongiovanni, M. (2010). Effects of a dairy product (pecorinocheese) naturally rich in cis-9, trans-11 conjugated linoleic acid on lipid, inflammatoryand haemorheological variables: A dietary intervention study. Nutrition, Metabolism,and Cardiovascular Diseases, 20(2), 117–124.
Sukhija, P. S., & Palmquist, D. L. (1988). Rapid method for determination of total fattyacid content and composition of feedstuffs and feces. Journal of Agricultural andFood Chemistry, 36(6), 1202–1206.
Takahashi, K., Kim, O. H., & Yano, K. (1987). Calcium-induced weakening of Z-disks inpostmortem skeletal muscle. Journal of Biochemistry, 101(3), 767–773.
Turpeinen, A. M., Mutanen, M., Aro, A., Salminen, I., Basu, S., Palmquist, D. L., & Griinari,J. M. (2002). Bioconversion of vaccenic acid to conjugated linoleic acid in humans.The American Journal of Clinical Nutrition, 76(3), 504–510.
Van Ranst, G., Lee, M. R. F., & Fievez, V. (2011). Red clover polyphenol oxidase and lipidmetabolism. Animal, 5(04), 512–521.
Van Soest, P. J., Robertson, J. B., & Lewis, B. A. (1991). Methods for dietary fiber, neutraldetergent fiber, and nonstarch polysaccharides in relation to animal nutrition.Journal of Dairy Science, 74(10), 3583–3597.
Vanhatalo, A., Kuoppala, K., Toivonen, V., & Shingfield, K. J. (2007). Effects of forage speciesand stage of maturity on bovinemilk fatty acid composition. European Journal of LipidScience and Technology, 109(8), 856–867.
Vlaeminck, B., Fievez, V., Cabrita, A. R. J., Fonseca, A. J. M., & Dewhurst, R. J. (2006). Factorsaffecting odd- and branched-chain fatty acids in milk: A review. Animal Feed Scienceand Technology, 131(3–4), 389–417.
Wang, Y., Jacome-Sosa, M. M., & Proctor, S. D. (2012). The role of ruminant trans fat as apotential nutraceutical in the prevention of cardiovascular disease. Food ResearchInternational, 46(2), 460–468.
Williamson, C. S., Foster, R. K., Stanner, S. A., & Buttriss, J. L. (2005). Red meat in the diet.Nutrition Bulletin, 30(4), 323–355.
Wongtangtintharn, S., Oku, H., Iwasaki, H., & Toda, T. (2004). Effect of branched-chainfatty acids on fatty acid biosynthesis of human breast cancer cells. Journal of Nutri-tional Science and Vitaminology, 50(2), 137–143.
Wood, J. D., Richardson, R. I., Nute, G. R., Fisher, A. V., Campo, M. M., Kasapidou, E.,Sheard, P. R., & Enser, M. (2004). Effects of fatty acids on meat quality: A review.Meat Science, 66(1), 21–32.
Yu, L. P., & Lee, Y. B. (1986). Effects of postmortem pH and temperature muscle structureand meat tenderness. Journal of Food Science, 51(3), 774–780.
Zulyniak, M. A., Ralston, J. C., Tucker, A. J., MacKay, K. A., Hillyer, L. M., McNicholas, P. D.,Graham, T. E., Robinson, L. E., Duncan, A. M., Ma, D. W. L., & Mutch, D. M. (2012).Vaccenic acid in serum triglycerides is associated with markers of insulin resis-tance in men. Applied Physiology, Nutrition, and Metabolism, 37(5), 1003–1007.