Effects of Filler Composition on Binder Viscosity and Mix Stability ROBERT H. GIETZ, Washington State Department of Highways, Spokane, and DONALD R. LAMB, University of Wyoming, Laramie Combinations of two penetration grade asphalt cements and three mineral fillers were prepared at various filler concentrations. Mixture consistency was determined by penetration, softening point, and viscosity tests. The low- temperature properties were predicted from each system and compared. Marshall stability specimens were pre- pared using premixed binder and conventional methods. Higher stabilities and low temperature stiffness were noted for mixtures with portland cement filler. Pre- mixed binder specimens were found to have higher sta- bility and more uniformity than conventional specimens. •DURING this and previous studies, the occurrence of lateral cracking in asphaltic con- crete has been established as common in the Wyoming highway system. Secondary failures commonly occur as a result of lateral cracking where plastic soils or expan- sive clays are present in the subgrade. Within the Wyoming highway system there are several projects of asphaltic concrete pavement that exhibit little or no lateral cracking under conditions of service similar to those of other projects that have cracked. In ad- dition, differences in cracking have been noted within the same project. All projects were constructed under the same specifications although materials were of dissimilar origin. INVESTIGATION OF PAVEMENT COMPOSITION Previous studies (1, 2) have pointed toward thermal stresses as a possible cause of lateral cracking. It would naturally follow that differences in cracking pattern could be attributable to the most temperature-variable component of the pavement, namely, the asphalt cement. These investigations were undertaken, therefore, to attempt to characterize the temperature-dependent consistency of typical asphalt materials and the effect of the variation of mineral filler content on the temperature-consistency re- lationship. A proposed alternative method of mix preparation was compared with the conventional method. The alternate system consists of preparing an asphalt-filler binder mix from asphalt cement and the fraction of the aggregate passing the No. 200 sieve. This binder was then mixed with the remaining aggregate. It was felt that possibly the variability of pavement performance could be correlated to a measured variation in pavement composition within specification limits. Since, in practice, the asphalt content is held within fairly close tolerances, the remaining variables are limited to those in aggregate gradation, assuming that variations in com- position should be minor within a single source. This paper reports the results of in- vestigation of the effects of variation of the mineral filler concentration and composi- tion on the temperature-consistency relationships of the resulting asphalt cement- mineral filler mixture. Paper sponsored by Committee on Characteristics of Aggregates and Fi Ilers for Bituminous Construction and presented at the 47th Annual Meeting.
Transcript
Effects of Filler Composition on Binder Viscosity and Mix Stability ROBERT H. GIETZ, Washington State Department of Highways, Spokane, and DONALD R. LAMB, University of Wyoming, Laramie
Combinations of two penetration grade asphalt cements and three mineral fillers were prepared at various filler concentrations. Mixture consistency was determined by penetration, softening point, and viscosity tests. The lowtemperature properties were predicted from each system and compared. Marshall stability specimens were prepared using premixed binder and conventional methods. Higher stabilities and low temperature stiffness were noted for mixtures with portland cement filler. Premixed binder specimens were found to have higher stability and more uniformity than conventional specimens.
•DURING this and previous studies, the occurrence of lateral cracking in asphaltic concrete has been established as common in the Wyoming highway system. Secondary failures commonly occur as a result of lateral cracking where plastic soils or expansive clays are present in the subgrade. Within the Wyoming highway system there are several projects of asphaltic concrete pavement that exhibit little or no lateral cracking under conditions of service similar to those of other projects that have cracked. In addition, differences in cracking have been noted within the same project. All projects were constructed under the same specifications although materials were of dissimilar origin.
INVESTIGATION OF PAVEMENT COMPOSITION
Previous studies (1, 2) have pointed toward thermal stresses as a possible cause of lateral cracking. It would naturally follow that differences in cracking pattern could be attributable to the most temperature-variable component of the pavement, namely, the asphalt cement. These investigations were undertaken, therefore, to attempt to characterize the temperature-dependent consistency of typical asphalt materials and the effect of the variation of mineral filler content on the temperature-consistency relationship. A proposed alternative method of mix preparation was compared with the conventional method. The alternate system consists of preparing an asphalt-filler binder mix from asphalt cement and the fraction of the aggregate passing the No. 200 sieve. This binder was then mixed with the remaining aggregate.
It was felt that possibly the variability of pavement performance could be correlated to a measured variation in pavement composition within specification limits. Since, in practice, the asphalt content is held within fairly close tolerances, the remaining variables are limited to those in aggregate gradation, assuming that variations in composition should be minor within a single source. This paper reports the results of investigation of the effects of variation of the mineral filler concentration and composition on the temperature-consistency relationships of the resulting asphalt cementmineral filler mixture.
Paper sponsored by Committee on Characteristics of Aggregates and Fi I lers for Bituminous Construction and presented at the 47th Annual Meeting.
2
Literature Review
The variability of proportions of asphalt cement and mineral filler has been acknowledged to affect mix properties. Eske (3) examined the effect on the flexural strength and advocated an optimum filler ratio ofl.25 to 2.0 by weight to give maximum flexural strength. Above this optimum ratio a decrease in flexural strength was attributed to inadequate compaction as a result of loss of workability. Kallas and Krieger (4) found that substitution of equal weights of diatomaceous earth or asbestos fiber in the mineral filler increased the optimum asphalt content for an optimum, low air void content. (The objective of their studies was to increase asphalt content with a view to increased durability without loss of stability. ) Bahri and Rader (5) examined the effects of bitumen viscosity on the compaction of asphalt mixes. They found that the variation of mineral filler concentration varied the optimum mixing and compacting temperatures due to the effects on the consistency of the resulting mixture. In these tests a single source of aggregate and asphalt cement was used, with the variables being the mixing and compacting temperatures.
Heukelom (6) examined the effects of variation of type and quantity of filler on the workability ofthe resultant mix. The critical factor having the major effect on the consistency and densification of the mix was stated to be the bulk volume of filler present.
Tunnicliff has examined the properties of both the mineral filler (7) and the combined asphalt-filler mixture (8). His reports consider both a redefinition of mineral filler (7) and a consideration of the binding effects of the mineral filler-asphalt mixture (8). Several concepts suggested in the latter report will be employed in the evaluations fo this paper.
The behavior of asphaltic cements under stress is highly variable, depending on the temperature, rate, and method of loading. The rational characterization of its behavior in absolute terms is extremely complex. Van der Poel (9) proposed the evaluation of bitumen stiffness based on the relative responses of different materials as determined by the results of standard tests. He employed the penetration index developed by Pfeiffer and Van Doormaal (10) to characterize the temperature-dependent change in consistency. This evaluationwas further refined by Heukelom (11), who revised the original nomograph and conducted tests that confirmed the application to all types of bitumen. The stiffness and penetration index nomographs as presented by Heukelom will be used in evaluations fur lhis repu.l'l.
The determination of the penetration index is based on the standard penetration and ring-and-ball softening point tests. By their nature these determinations are somewhat empirical. The measurement of viscosity tends to be more fundamental. Griffith and Puzinauskas (12) examined the correlations of viscosity determinations with other accepted tests. Their findings included good correspondence between penetration and viscosity when determined at 77 F. In correlating viscosities determined at higher temperatures with 77 F penetration, however, poor correspondence was noted. To describe the change in viscosity with temperature, the viscosity-temperature-susceptibility (V'T'S) w:H1 advoc::i.ted. 'T'his iR determined by the slope of the log of log viscosity vs log of Rankine temperature plot.
The VTS parameter has been employed in other research at the University of Wyoming by Silver; Davis; and DlLnca.n (13). ThJs wo:rk involved the comparison of bitumen produced by hydrogenation oI coalwith conventional asphalt cement and road tars. The necessary coneplate viscometer for this determination was available along with a well-developed laboratory procedure. Therefore, the VTS relationship was also used as an index of consistency in this study.
Experimental Materials
Mineral Filler Composition-So that results of these tests might be extended to the typical pavement mixtures of Wyoming highways, the components selected were in compliance with standard specifications. Standard Wyoming Highway Department Specifications for Mineral Filler (14, 15) permit the use of limestone dust, portland cement, or other inert mineral mattergraded so that 100 percent shall pass a No. 30
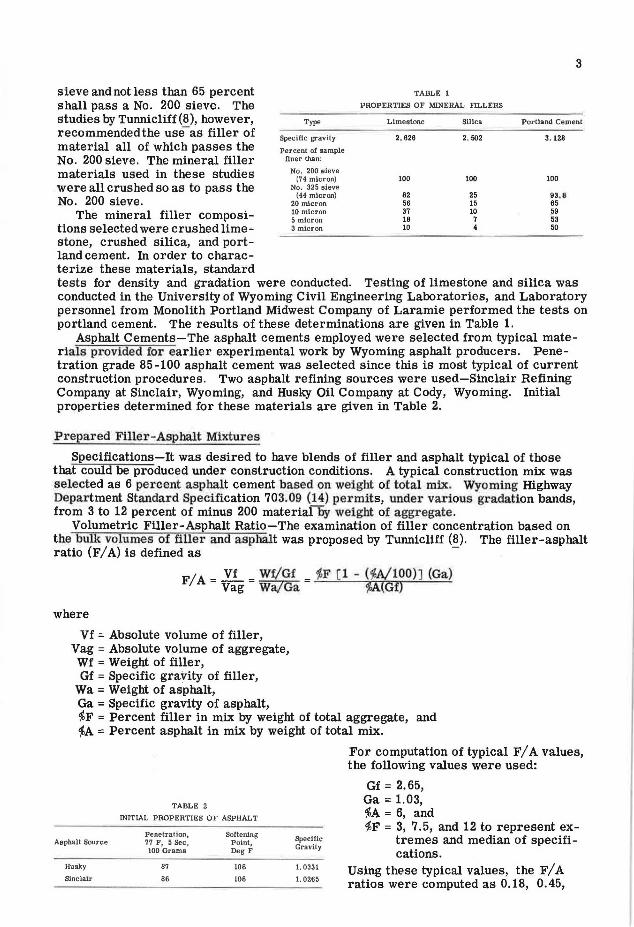
sieve and not less than 65 percent shall pass a No. 200 sieve. The studies by Tunnicliff(8), however, recommended the use- as filler of material all of which passes the No. 200 sieve. The mineral filler materials used in these studies were all crushed so as to pass the No . 200 sieve.
The mineral filler compositions selected were crushed limestone, crushed silica, and port-land cement. In order to charac-terize these materials, standard
Type
Specific gravity
Percent of sample finer than:
No. 200 sieve (74 micron)
No. 325 sieve (44 micron)
20 micron 10 micron 5 micron 3 micron
TABLE 1
PROPERTIES OF MINERAL FILLERS
Limestone
2. 626
100
82 56 37 18 10
Silica
2. 502
100
25 15 10 7 4
3
Portland Cement
3.128
100
93 . 8 65 59 53 50
tests for density and gradation were conducted. Testing of limestone and silica was conducted in the University of Wyoming Civil Engineering Laboratories, and Laboratory personnel from Monolith Portland Midwest Company of Laramie performed the tests on portland cement. The results of these determinations are given in Table 1.
Asphalt Cements-The asphalt cements employed were selected from typical materials pr ovided for earlier experimental work by Wyoming asphalt producers. Penetration grade 85-100 asphalt cement was selected since this is most typical of current construction procedures. Two asphalt refining sources were used-Sinclair Refining Company at Sinclair, Wyoming, and Husky Oil Company at Cody, Wyoming. Initial properties determined for these materials are given in Table 2.
Prepared Filler-Asphalt Mixtures
Specifications-It was desired to have blends of filler and asphalt typical of those that could be produced under construction conditions. A typical construction mix was selected as 6 percent asphalt cement based on weight of total mix. Wyoming Highway Department Standard Speci fication 703.09 (14) permits, under various gradation bands, from 3 to 12 percent of minus 200 materialliy weight of aggregate .
Volumetric Filler-Asphalt Ratio-The examination of filler concentration based on the bulk volumes of filler and asphalt was proposed by Tunnicliff (8). The filler-asphalt ratio (F/ A) is defined as -
Vf = Absolute volume of filler, Vag = Absolute volume of aggregate, Wf = Weight of filler, Gf = Specific gravity of filler,
Wa = Weight of asphalt, Ga = Specific gravity of asphalt, %F = Percent filler in mix by weight of total aggregate, and %A = Percent asphalt in mix by weight of total mix.
Asphalt Source
Husky
Sinclair
TABLE 2
INITIAL PROPERTIES OF ASPHALT
Penetration, 77 F, 5 Sec, 100 Grams
87
86
Softening Point, Deg F
108
108
Specific Gravity
1.0331
I. 0265
For computation of typical F/ A values, the following values were used:
Gf = 2.65, Ga= 1.03, %A= 6, and %F = 3, 7.5, and 12 to represent ex
tremes and median of specifications.
Using these typical values, the F/ A ratios were computed as 0.18, 0.45,
4
and 0. 72. These typical values were employed in proportioning the test mixtures, based on the actual measured specific gravities of the filler and asphalt.
Preparation-In preparing the mixed asphalt-filler samples, 6-ounce seamless tinned moisture cans were used as sample containers. Duplicate samples were prepared for each combination of asphalt, filler, and F/ A ratio. The asphalt cement was initially heated just enough to permit it to flow. The weighed sample cans were filled approximately half full and allowed to cool. The actual weight of asphalt and cans was determined by weighing on a torsion balance to the nearest 0.01 gram. Using the previously determined can weights, the weight of asphalt was found by subtraction. The volume of asphaltic cement was then determined for each sample.
Samples were selected at random for preparation of desired filler- asphalt ratios. Based on the computed asphalt volumes, the required filler volume for the desired F/ A ratio was computed. For each type of filler the necessary weight was calculated based on the measured specific gravities. These weights of filler material were then weighed out of a supply of previously prepared filler. The filler material was maintained in an oven for over 24 hours at 221 F prior to weighing.
The filler material was placed in the sample containers of asphalt and heated for mixing in groups of four cans. Each group was placed on an electric hot plate and brought to a temperature of 275 F in approximately 30 minutes. The samples were mixed by stirring with a clean glass stirring rod until visual inspection indicated that a uniform mixture free of lumps had been obtained. The containers were then covered, set aside, and allowed to cool to room temperature.
Observation of samples during cooling revealed that the filler material settled out while the asphalt material was still hot. This resulted in a nonuniform distribution of filler in the cooled sample with the upper portion of the sample consisting of a most pure asphalt cement. This could have had a distorting effect on any penetration measurement subsequently made. It was decided to be particularly careful to reheat and thoroughly stir the specimens before removing samples for the viscosity and softening point tests. The problem of settlement effects on penetration tests was solved by continuous stirring of the specimens while recooling in an ice-water bath until the mixture became too viscous to continue stirring. The prepared samples were then divided into two groups, one to be used for penetration and softening point tests, the other for viscosity determinations.
Test Methods
To the greatest extent possible, standard established experimental procedures were used. The chief limitations were the availability of equipment or modifications to suit sample conditions such as those noted involving cooling and stirring of penetration specimens. The specific tests and evaluations used as well as any modifications and comments are summarized below:
flask was used. -Penetrayon of Bituminous Materials: ASTM D 5-61 (16). A Lab-Line Model 4100T
universal penetrometer with automatic timer was used. All penetration values ,vere taken at 77 F, 5 sec, with 100-gram penetration weight.
Softening Point of Asphalt (Ring-and-Ball): ASTM D36-64T (16). Water bath was used for all determinations. Samples were prepared on a Teflon-covered metal pan rather than the prescribed amalgamated brass plate. This was done to avoid the hazards associated with mercury vapors. The samples were found to separate easily and cleanly from the Teflon when chilled for about 30 minutes.
Specific Gravity of Asphalt Cement: ASTM D70-52 (16). Recovery of Asphalt From Solution by the Abson Method: ASTM D 1856-63 (16).
This is the reflux extraction method using the Faulwetter-type extractor. The extraction solvent employed was ACS reagent grade benzene with approximately 20 percent ethyl alcohol added by volume. The addition of the alcohol was recommended in the
5
extractor manufacturer's instructions. It has been found in previous work to speed up the extraction process and facilitate t,he release of asphalt from the aggregate.
Determination of Viscosity by Cone-Plant Viscometer: The procedure for this test is detailed in the work by Silver, Davis, and Duncan (13) and is summarized here. The equipment used was a cone - plate viscometer manufactured by the Cannon Instrument Company . It is designed to measure viscosity in a range from 103 to 1010 poises. Torque is applied to a specimen in a controlled-temperature bath by means of a weight and pulley system. In preparation of samples, a small amount of heated asphaltic material is placed between the cone and plate, which are then seated by means of an additional weight.
The loading weight is varied during the testing to obtain the desired rate of shear. For these determinations the shear rate of 0.05 sec-1 was used. Viscosities were determined at temperatures of 68, 77, and 100 F.
Following the preparation of the test samples or, in the case of recovered samples, the completion of extraction, the penetration and softening point tests were conducted. The duplicate set of prepared specimens was utilized for viscosity determinations. After completion of the penetration and softening point tests on the six high F/ A ratio specimens, these samples were heated, dissolved in benzene in the reflux extractor, and the asphalt recovered. Additional samples of the original unmixed asphalt were also subject to the same procedure to determine the change, if any, associated with the mixing and recovery process.
Preparation of Marshall Stability Test Specimens
The aggregate gradations and asphalt content used for these tests were those previously determined for other Marshall tests. They are given in Table 3. The coarse aggregate used (larger than 3/ia in.) was crushed limestone. The fine aggregate (passing 3/26 in., retained on No. 200 sieve) was washed gravel. The minus 200 fraction of the aggregate was crushed limestone for the control test. Crushed limestone, silica, and portland cement were used in the premixed binder tests. The binder mixture was prepared by mixing asphalt and filler at the F/ A ratio corresponding to that of the control specimen. The amount of this binder added to the aggregate mixture was that required to give an asphalt content of the total mix equivalent to 6 percent by weight of total aggregate. This asphalt content gave an F/ A ratio of 0.326.
Specimens were compacted by 50 blows on each face using a standard hand-operated Marshall compaction hammer. A positioning guide was employed to assure that the hammer was kept truly vertical. Mixing temperature was 275 F (±5 F) with compaction at 245 F (±5 F). These did not necessarily represent optimum temperatures, but were uniformly attainable with the equipment available.
Samples were prepared for each premix binder. Control specimens were prepared also for a total of 24 samples with mineral filler and 6 percent asphalt.
TEST RESULTS AND DISCUSSION OF RESULTS
Prepared Filler-Asphalt Mixtures
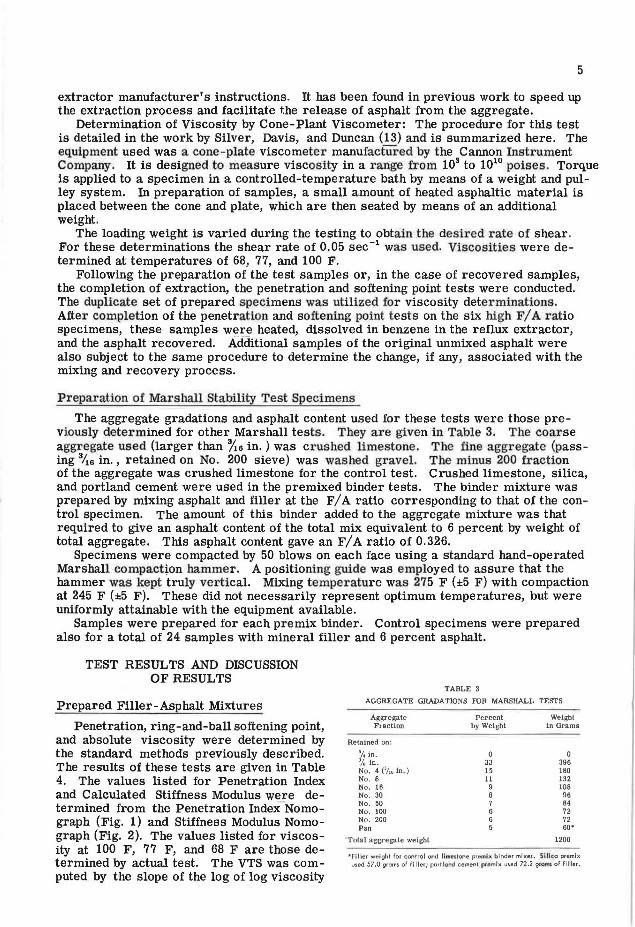
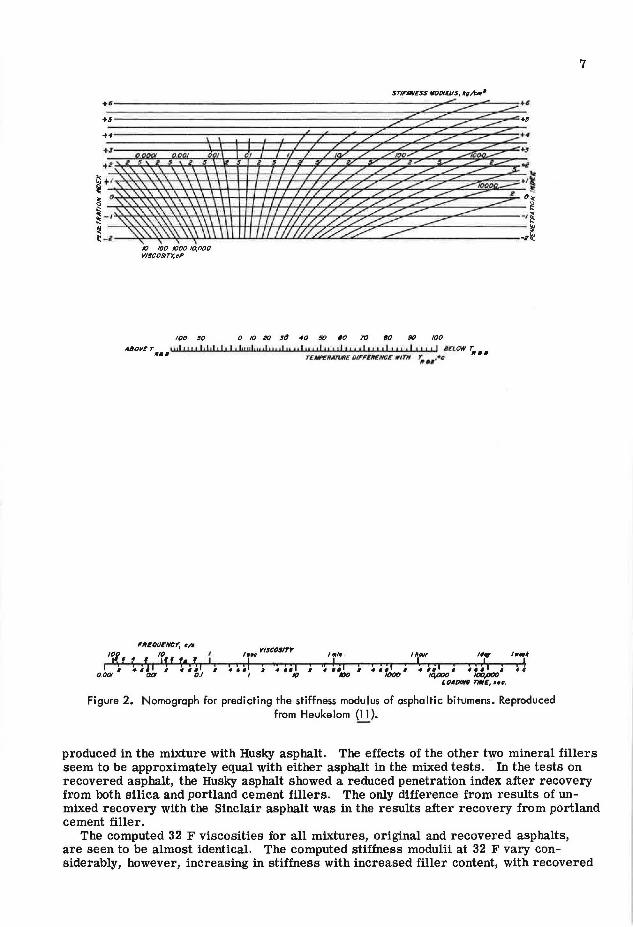
Penetration, ring-and-ball softening point, and absolute viscosity were determined by the standard methods previously described. The results of these tests are given in Table 4. The values listed for Penetration Index and Calculated Stiffness Modulus were determined from the Penetration Index Nomograph (Fig. 1) and Stiffness Modulus Nomograph (Fig. 2). The values listed for viscosity at 100 F, 77 F, and 68 F are those determined by actual test. The VTS was computed by the slope of the log of log viscosity
TABLE 3
AGGREGATE GRADATIONS FUR MARSHALL TESTS
Aggregate Percent Weight Fraction by Weight in Grams
"Filler weight fo r control ond llm.,tone prernl binder mixes. SHlca premix used 57.0 grams of fillerj port loMd cement pu1mlx used 72.2 gr~ of filler.
vs log of Rankine temperatue based on the viscosities at 68 F and 100 F. Using this value and the viscoRity at 68 F, the viscosity at 32 F was computed. Procedure and computations for these values are presented in the Appendix, Table 6. The variation of viscosity with temperature for the various combinations of asphalt and filler are shown in Figures 3 through 8. The viscosities as determined for the original unmixed asphalt and after recovery from benzene solution are included in each figure for comparison.
A larger negative value of pene -
greater variation of consistency with temperature. The VTS pa-..,.,......_,....-r.t.,... .;~ -4-,..1,-a" ,...~ 4-ha olnna nf fl,a .&. U.1..1..&.\.,1,'-'.&. .a.i.=, 1,"-'-'l,,'-'.I.&. Ut.:J l,.I.I'-' i.,.a.v.t-'v V,._ 1,.1,.1,...,
log of log viscosity vs log temperature. Larger numerical values indicate steeper slope and, therefore, more variation of viscosity with temperature. Based on these evaluations, it can be seen from Table 4 that the increase in mineral filler content reduces the temperaturerelated variation of consistency. The greatest effect on consistency was produced by the portland cement filler, and greater stiffness was
ST/FliNESS MODUJJS, tr/cm1
•• +J'
~ ~
i +~,5~~ss~~ss2~~2~~~i1=1~~t~t~~t~z:z;~;~~;~~~~~~~~~~:~~~:~~~;i~~~~;~~i ~ 0 0 ~ ~ g :-, -,~ i-2 -2 ~
/0 /00 /000 10,000 V/$COSITY,eP
/OD ~O o to 20 !Id •o 50 •o 70 110 90 100
ABovcr 1,, l 1111 l,lsl1l1laluul11 11l11 , ,l ,, ,,l,,1 ,l e11t l J1e1l1 t11l,111 l 1t11I aE.1.owr ,,. • rC-ltll'£RMtlfC Dl/t'FVfCNCe rtJrH :-:. •• ~•c ,, ••
trltEIWCNC't', II/a 100 10 I l'!f ~ S I( f (c ~ I
I ~ i ~ I 11 ,f ~ ,I ~ 0.00/ OD 0./
, ... nscos,rr , .. 1 , , " I , ,,.,, 2 "'',o.
,,.,,, " I ,, I
I 11111, 1',r I ••k
~ • ,, ~ \ w ; ~ ~ ~. ; d 1000 ,qooo 100,000
LDADII# TMIC, •••·
Figure 2. Nomograph for predicting the stiffness modulus of asphaltic bitumens. Reproduced from Heukelom {!_!_).
7
produced in the mixture with Husky asphalt. The effects of the other two mineral fillers seem to be approximately equal with either asphalt in the mixed tests. In the tests on recovered asphalt, the Husky asphalt showed a reduced penetration index after recovery from both silica and portland cement fillers. The only difference from results of unmixed recovery with the Sinclair asphalt was in the results after recovery from portland cement filler.
The computed 32 F viscosities for all mixtures, original and recovered asphalts, are seen to be almost identical. The computed stiffness modulii at 32 F vary considerably, however, increasing in stiffness with increased filler content, with recovered
specimens approximately equal to original asphalt stiffness. This seems to indicate a greater applicability of the penetration index parameter to the prediction of lowtemperature behavior. This would be in agreement with the general concept of a change from viscous to elastic behavior at low temperatures. The computation of the lowtemperature viscosities also assumes a linear variation of log log viscosity with log temperature in this range. Although valid at higher temperatures, this linear variation may not be applicable to these asphalts below 68 F.
In examining the relative magnitudes of calculated stiffness modulus, the portland cement filler produced the greatest increase in stiffness, the silica filler the least increase, with limestone filler intermediate. This order of increase corresponds to the order of increasing specific gravity and relative fineness of filler gradation. At low concentrations all three fillers were found to have only slight effect. This difference in effect with different mineral composition cannot be specifically attributed to size, density, or mineral composition. However, the alteration of penetration index noted with portland cement would possibly indicate a chemical reaction that was not reversed by the extraction and recovery.
Marshall Stability Tests
Marshall test specimens were prepared as previously described. The observed stability and flow measurements are given in Table 5. As a measure of the uniformity of samples produced within each group, the mean value for bulk specific gravity and stability and the standard deviation from these mean values within each group have been computed. The determined maximum theoretical specific gravity and air void content based on this value are included for each specimen.
The heights of the compacted specimens were determined by averaging four measurements taken at equal intervals around the perimeter. These values were used to correct the observed stability values to equivalent values for the standard 2½-in. height. The stability values listed in Table 5 are the corrected equivalent values.
The use of premix binder produced considerably higher stability values for the limestone and portland cement fillers compared with the control mix. The premixed silica binder showed a slightly lower mean stability. These stability values are in the same order as the increase in stiffness modulus noted in the discussion of mixed asphaltfiller tests. The standard deviations from mean specific gravity values for each group are less for all three of the premixed binders. Portland cement showed the most uniform specimen density. Standard deviation values of the stability values do not carry
Specimen
Croup I-Control aggregate including limestone filler mixed with 6 per-cent asphalt
Group II-Aggregate without filler, premlx binder; Asphalt and limestone at F/ A = 0. 329
Group m-Aggregate without filler, premlx binder; Aephalt and port-land cement at F/A ~ 0. 329
Group IV-Aggregate without filler, premix binder; Asphalt and sllica at F/ A = 0, 329
out this trend. The variation in stability of the premix binders is slightly greater for portland cement and limestone than for the control mix.
The selection of 6 percent asphalt content for these mixtures was=arbitrary and based in part on mix design for slightly different aggregate. Accepted standard values for this type of mix are, for stability, over 500 pounds, and for flow, minimum 8 and maximum 18. Comparing these values with the test data, all mixes are seen to have excessive flow values. Acceptable stabilities were achieved in the premix binder specimens using limestone and portland cement, while low stabilities were noted for the control mix and the premix silica binder. Air void content for all mixes is within the accepted desirable range of 3 to 5 percent.
An increase in F/ A ratio was also observed to result in an increase in stiffness of the resulting binder. In addition, a high F/ A ratio would increase the high-temperature viscosity, thus dec1·easing the consolidation due to a given compactive effort. Thus, the F/ A value becomes doubly important since it affects both the initial binder stiffness and the degree of compaction, and thereby the possible long-term hardening.
Although not extensively examined in this study, the mineral composition of the filler material also is effective in the binder consistency. The substitution of filler material indiscriminately on an assumed universal inertness could lead to unanticipated increased pavement rigidity and hardening susceptibility.
In the tests of prepared filler-asphalt mixtures, it was concluded that the F/ A ratio was a significant factor in the behavior of mixed binder, in that increasing stiffness was noted at higher F/ A values. The substantial difference in behavior with varying mineral composition and/or size gradation would require the consideration of filler type as well as gradation in determining optimum filler content. The combined effects of composition and gradation cannot be separated on the basis of this research. The viscosity measurements are concluded to be valid indexes of consistency as applied to pavement performance only at temperatures above 68 F.
The premixing of filler and asphalt to form a binder that is then mixed with coarser aggregate fractions is believed to result in a higher resultant stability and more uniform sample densities. This method (premixing of binder) offers a means for more precise control of the amount and composition of filler. The effects of different filler types cannot be separated as to cause on the basis of these studies.
A revised mixing procedure employing a premixed binder and filler-free coarse aggregate should be investigated for feasibility and possible test-site construction as a means of instituting tighter control over the critical F/ A ratio.
Additional research into the mixtures of filler and asphalt is reco111111ended to establish the cause of varied interaction. Examination should include fillers of identical gradation and varying mineral composition as well as identical mineral composition and varying gradation. This could lead to optimizing mix design for filler type and concentration as well as asphalt content.
ACKNOWLEDGMENTS
The research on which this paper is based was conducted under contract from the Wyoming Highway Department in cooperation with the U. S. Bureau of Public Roads. The opinions, findings, and conclusions expressed in this publication are those of the authors and not necessarily those of the Wyoming Highway Department or the Bureau of Public Roads.
REFERENCES
1. Lamb, Donald R., et al. Roadway Pilot Failure Study, Final Report to the Wyoming Highway Department. Highway Engineering Research Publ. H-10, Natural Resources Research Inst., Univ. of Wyoming, Dec. 1964.
2. Lamb, Donald R. , et al. Roadway Failure Study No. I, Final Report to the Wyoming Highway Department. Highway Engineering Research Publ. H-14, Natural Resources Research Inst. , Univ. of Wyoming, Aug. 1966.
13
3. Eske, Martin. The Influence of Varying Amounts of Filler on Flexural Strength and Temperature Susceptibility of Compacted Asphaltic Concrete Mixtures. Proc. AAPT, Vol. 29, p. 141-151, 1960.
4. Kallas, B. F., and Krieger, H. C. Effects of Consistency of Asphalt Cement and Types of Mineral Filler on the Compaction of Asphalt Concrete. Proc. AAPT, Vol. 29, p. 152-176, 1960.
5. Bahri, Gandharv Raj, and Rader, Lloyd F. Effects of Asphalt Viscosity on Physical Properties of Asphaltic Concrete. Highway Research Record 67, p. 59-79, 1965.
6. Heukelom, W. The Role of Filler in Bituminous Mixes. Proc. AAPT, Vol. 34, p. 396-429, 1965.
7. Tunnicliff, David G. A Review of Mineral Filler. Proc. AAPT, Vol. 31, p. 118-150, 1962.
8. Tunnicliff, David G. Binding Effects of Mineral Filler. Paper presented at 1967 Annual Meeting of AAPT Denver, February 13-15, 1967.
9. Van der Poel, C. A General System Describing the Visco-Elastic Properties of Bitumens and Its Relation to Routine Test Data. Jour. Appl. Chem., May 1954.
10. Pfeiffer, J. P., and Van Doormaal, P. M. The Rheologic Properties of Asphaltic Bitumen. Jour. Inst. Petrol. Technologists, Vol. 22, p. 414, 1936 (as cited in 9).
11. Heukelom W. Observations on the Rheology and Fracture of Bitumens. Proc. AAPT, Vol. 35, p. 358-399, 1966.
12. Griffith, J. M., and Puzinauskas, W. P. Relation of Empirical Test to Fundamental Viscosity of Asphalt Cement. ASTM STP 328, p. 21-47, 1963.
13. Silver, Howard F., Davis, Burl E., and Duncan, Walter E. Coal Hydrogenation: Final Report to the Wyoming Highway Department, June 1965.
14. Supplement to 1960 Standard Specifications for Road and Bridge Construction, 1966 Edition, Wyoming State Highway Commission, Oct. 1965.
15. Standard Specifications for Highway Materials and Methods of Sampling and Test, Part I, Specifications. American Association of State Highway Officials, 1961.
16. 1965 Book of American Society for Testing and Materials Standards, Part 11: Bituminous Materials for Highway Construction, Waterproofing, and Roofing; Soils; Skid Resistance. American Society for Testing and Materials, Philadelphia, 1965.
14
Appendix
TABLE 6
COMPUTATION OF LOW-TEMPERATURE VISCOSITIES
(1) (2) (3) (4) (5) (6) (7) (6) (9)
Viscosity Sample Vlscoslty Log Log log
Log log Log at 32 F Sample at 68 F Viscosity Viscosity (0. 03066) Viscosity Viscosity (pot1;es)
Asphalt Filler VTS lpoiaoo) a 2. 0000 = log (VTB) at 32 F >< &log = alog