Page 1
International Journal of Scientific Research and Innovative Technology ISSN: 2313-3759 Vol. 3 No. 3; March 2016
55
EFFECTS OF FIRE ON GRAZING RESOURCES IN THE SAVANNAH
GRASSLANDS ECOSYSTEM IN NAIROBI NATIONAL PARK, KENYA
*PETER NJENGA KEIYORO PhD ; Senior Lecturer ;School of Continuing and Distance education
;University of Nairobi P.O. Box 92 - 00902 , Kikuyu, Kenya.
JOSEPHINE WANJIKU NGUNJIRI PhD, P.O. Box 15873-00509, Langata -Hardy, Kenya.
*Corresponding Author, PETER NJENGA KEIYORO PhD
ABSTRACT
A study of the effects of burning on grazing resources was conducted from July, the savannah grasslands eco-
system of Nairobi National Park. The aims and scope of this study were to examine how controlled experi-
mental burning affected the grazing resources in the park.However,the specific objectives were to : deter-
mine how presence and intensity of fire affected the standing crop in the park.,find out how the fire control
measures had influenced grazing recourses in this Park and formulate a controlled burning program for
this park based on the findings of the study.Results from all the study sites on standing crop reflected a very
high proportion of dead grass in unburnt plots even during the middle of the rainy seasons.The plant nutrient
analysis showed that new growth of grasses in the burned plots had a higher nitrogen content and were thus
likely to be favoured by herbivores. This is because the palatability and digestibility of the living grass de-
clined with age. Hence it was possible that burning reduced the amount of unpalatable, less nutritious ma-
terials. The speed of the backfires varied inversely with the wind velocity. The speed of fire was lowest where
the opposing wind velocity was highest this resulted in hot burn and higher consumption of the grazing re-
courses. The largest amounts of ash were formed where the vegetation standing crop was highest before burn-
ing in the experimental plots.The results obtained indicate that a rotational burning scheme can be recom-
mended. Such a programme would initially be experimental and its effects carefully monitored. The frequency
and the time of prescribed burning would depend on the amount of accumulated grass, which in turn is de-
pendent on precipitation and grazing pressure in this Park.
Key words: Grazing resources, Standing crop, burnt, unburnt, herbivores, experimental plots, fire.
Page 2
International Journal of Scientific Research and Innovative Technology ISSN: 2313-3759 Vol. 3 No. 3; March 2016
56
1. O Introduction
1.1 Background of the study
An important feature of Nairobi National Park is that during the wet season the wildebeest and zebras migrate
to south of the park into the former Kitengela Conservation Unit and the adjoining wet season dispersal areas.
It had been observed that in these areas the grass is short and remains so during the wet season. It was as-
sumed that this occurred due frequent burning of the grasslands by the pastoral communities living to the
southern areas of the park. The presence of short grass during the wet season in this area was also probably
contributed by the grazing pressure caused by livestock owned by Maasai people in the south of the Park. The
new grass that sprouted in the Kitengela area soon after the rains may hold the wildebeest and zebra popula-
tions and only drought forces them back into the Park during the dry season (Foster and Coe, 1968; Foster
and Kearney,1967 ). At the time of this study the standing crop of grasses had increased, with a high propor-
tion of dead materials. This was because of the absence of a burning or mowing policy and no intensive
drought had been experienced in the Park since 1976. Therefore, the herbivore population within the Park
boundaries was very low during the wet seasons in 1977 and 1978 because most of the large herbivores had
migrated to the Kitengela area to the South.
Studies elsewhere have shown that animals are attracted to new flush of grass in burnt areas (Pratt, 1967;
Van Rensburg, 1971) supposedly due to a combination of factors. Such factors include improved palatability
and higher nutrient content of the grass that appear after the rains. Foster and Coe (1968) ,suggested that the
migration of the Park herbivores to Kitengela Conservation Unit was due to the fact that grasses there are
short and have higher nutritional quality than the fibrous, less nutritious grasses that dominate the Park dur-
ing the wet season. It was also suggested that improved visibility for predator avoidance attracted the animals
in the areas where grass was kept short by burning or grazing pressure. Hence grasses in the South and East of
the Park being kept shorter provided better visibility and thus created a greater chance for herbivores to detect
and escape from predators ( Rudnai ,1975) .
In addition to this , there are also permanent water holes and dams in the park which include Narogomon,
Ormanye, Hyena and Karen Primary School dam which were constructed in 1964. Gosling (1975) suggested
that the presence of permanent watering places contributed to the concentration of game in this Park especial-
ly during the dry season when water resources outside the Park were less reliable .
This problem raised several questions such as could a burning programme in the Park improve grazing re-
sources by improving nutritional quality of grasses and/or provide better visibility for the main herbivores in
the Park? Nairobi National Park is a significant tourist attraction and therefore earns a substantial amount of
revenue for the country. Thus, could burning provide short grass areas within the Park in which game could
concentrate and be more easily watched by tourists? Would burning improve grazing resources such that the
animal communities can be contained within the Park boundaries throughout the year or at least for a larger
proportion of the year and, therefore,the Park remain a tourist attraction throughout the year? A wildlife man-
agement policy that would attempt to keep animals within the Park would most likely also reduce the animals'
danger to poaching when they leave the Park boundaries during the dry seasons.
Thus the main objective of this study was to formulate a burning programme based on scientific findings,
since no such programme existed for this Park from it time of establishment in 1946. For example after one
and a half years (1977-1979) of exceptionally high rainfall the standing crop of dead material was such that
Page 3
International Journal of Scientific Research and Innovative Technology ISSN: 2313-3759 Vol. 3 No. 3; March 2016
57
this created a dangerous situation with regard to accidental fires during the dry seasons as was observed in
August and September, 1978 during this study. Once such grassfires in the mid dry season had caught good
hold especially with the large amount of fuel and a following the wind ; it could be difficult to stop them. It
was realized by that no realistic burning policy could be formulated without being based on scientific investi-
gation. The foregoing account therefore was an effort to throw light on the need and purpose of this study.
1.2 The study area
The area of Nairobi National Park is approximately 115 square kilometres and is situated 7km to the south
of the city of Nairobi in the northern wetter areas of the Athi - Kapiti plains(Morgan ,1967). The Park ex-
tends 48 km in length with an average width of 6.5 km. The southern and south-eastern boundary of the Park
is formed by the Athi River tributary namely, the Mbagathi. The northeastern and northwestern boundaries
were fenced in 1963 to prevent the animals from moving into the nearby Mombasa-Nairobi railway and
highway , Jomo Kenyatta International Airport and the city industrial area.
The Park topographically presents a gently undulating aspect. The highest elevations are attained in the
wooded North-west (1,790m a.s.l.). The land declines towards the Embakasi plains in the eastern and central
part of the Park which are 1,648m a,s,l. The land further declines to the Athi River in a number of gorges that
open into the basin in the southeastern part of the Park (1,508m a.s.l). The Park is traversed from the north east
by a number of perennial rivers of which the Mokoyeti, Ormanye and Sosian are the main ones. It is also
drained by numerous seasonal rivers.
The Park is situated in the four seasons area of Kenya (Thompson and Samson, 1967) with the highest rainfall
occurring between March and May. The data for 1977 and 1978 were obtained from the Kenya Meteorologi-
cal Department as recorded from the four weather stations. Those were Warden's Camp situated near the War-
den's house in the Park and Cheetah gate. The other stations were located outside the Park but close to the
boundaries at Wilson Airport adjacent to the Park's northwestern boundary and Embakasi Station near the
former Embakasi Airport. The total annual rainfall during this period 1977 and 1978 varied from 1116.8 mm
around Warden's camp in the North to 580.3 mm at the Cheetah gate station in the South East of the Park. In
general there are two rainy seasons that influence the Park climate . One occurs in March to May (the long
rainy season) and the other October to early December (short rainy season).
At the time of the declaration of a National Park in 1946, the grassland fires most likely still annually swept
the Athi-Kapiti plains (Warden Pers. Comm. 1978). No fire breaks that existed to prevent fires started from
outside the Park from crossing through the boundaries from the nearby railway line , Mombasa highway
and city suburbs .No official policy on grassland burning existed since the time of establishment of the park
(Warden, Personal . Comm., 1978 ). However, in the late nineteen sixties a policy of controlled burning was
followed by the warden and his staff. Burning and mowing were also carried out to provide short grass areas
on which the game could concentrate and be more easily watched by tourists (Gosling, 1975). Gosling (1975),
also reported that hay from the park was sold for financial profit during the period 1963-1968. Burning was
also carried out during the dry seasons to control ticks (Warden, Pers Comm. 1978). This practice was stopped
and fire breaks were cleared to prevent fires spreading from outside into the Park in 1969.
Although Pratt (1967) and Foster and Kearney (1967) pointed out the advantages of burning in the Park, a no
Page 4
International Journal of Scientific Research and Innovative Technology ISSN: 2313-3759 Vol. 3 No. 3; March 2016
58
burning policy was maintained from the early 1970’s ,but accidental fires still almost annually occurred in
the park. It was feared that a controlled burning policy could reduce grazing resources available to the animals
should drought occur as it happened in 1960-1961 and 1973-1974 (Warden, pers. comm.). Because of this no
burn policy ,certain grasslands in the Park completely remained protected from fires for four to six years.In
August and September 1978 wildfires occurred in the Park and covered a large portion of the grasslands in
the plains and the Athi-basin (24.76% of the Park was burnt). The game counting blocks IIIA, IV, VA and VB
had their grass completely burnt (fig 1 ). These fires had originated from outside the Park from nearby adja-
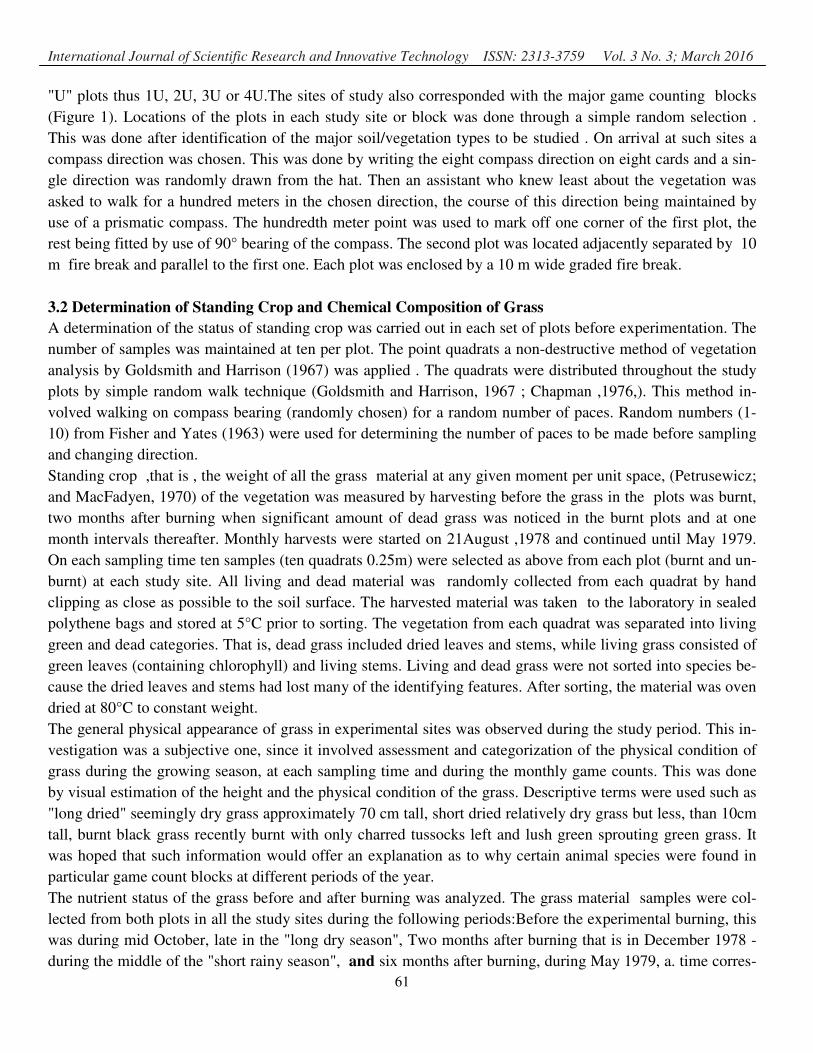
cent Mombasa-Nairobi highway or railway.The areas covered by these fires are shown on the Fig.1. The ef-
fects of the fire were classified after Contrad and Poulton quoted by Daubenmire (1968).
Fig 1: Park areas covered by wildfires 1978 and 1979,location of study sites game
counting blocks are indicated in capital Roman numbers.
The Park vegetation is divisible into the following main physiognomic and floristic types according to Dale
and Greenway (1961) and Goldsmith and Harrison (1967) for trees , shrubs and grasses. These were :The
forest or woodland - this is in the elevated northwestern region of the Park. It is a part of the once extensive
Langata Forest. The dominant species are Croton megalocarpus, Brachylaena hutchinsii, Calodendron ca-
Page 5
International Journal of Scientific Research and Innovative Technology ISSN: 2313-3759 Vol. 3 No. 3; March 2016
59
pense, Teclea spp.and Dryospyros abyssinica. Acacia - Themeda grassland: this covers the plains and
forms 40% of the Park vegetation lying on the deep black cotton soils. Acacia drepanolobium is locally dense
and up to 2.5 m high. The dominant grasses in order of density were Themeda triandra, P. maximun, P. me-
zianum, A. Gayanus, Setarla sphacelata and Ischemum afrum. Aspilia mosambicensis bushes are also frequent
(Heriz -Smith ,1962). The Open grassland :with scattered trees and bushes: this mainly occur in the Athi
River basin. It is an open almost treeless plain of gentle slopes carrying a grey-black calcareous clay soil. The
dominant grass species in order of density are Themeda triandra ,Pennisetum mezianum and Pennisetum
stramineum.
The monthly ground total animal counts during the period of the study indicated that there were about seven-
teen large mammalian species in the Park . These included, Burchells zebras, the white bearded wildebeest.
Thompson's and Grant's gazelles, buffaloes, warthogs, black rhinos, and hartebeest. Also included in the
counts were large birds inhabiting the Park, namely :Ostrich, secretary birds, crested crane and kori bustard.
For obvious reasons truly nocturnal animals were not included in the game counts. These include jumping
hare, civet, wild-cat and gen.
1.3 Review of the Literature
Although research on effects of fire in grasslands had been carried out elsewhere in the world there was
lack of information on this subject in East Africa. Much of the research in East Africa was based on either
chance observations of wildfires or planned studies conducted under very unpredictable conditions. In Kenya
particularly, there was scanty published work on the effects of fire on grazing resources in the savannah
grassland ecosystems that existed in this country. Edward (1942) working near Nairobi was perhaps the first
to conduct a study on burning and grazing in East Africa. He observed that fire could favour certain desirable
grasses and that conversely, grazing often suppressed the certain desirable grasses and also reduced number
of ticks, mites and tsetse flies in open burnt sites (Hill, 1971).
Pratt (1967) studying the response of grazers to burnt grasslands in Nairobi National Park and nearby Macha-
kos area noted that zebras, gazelles and Kongoni were attracted to burnt areas.He also observed that there
was less dry matter production in burnt areas due to uncontrolled grazing during the critical recovery period
rather than due to the direct effect of the fire. Foster and Coe (1968) suggested that the usual seasonal
Southern migration of wildebeest in Nairobi National Park could be held back if the quality of grazing re-
sources was improved by controlled burning or mowing.
Bell (1970) in his study of the use of the herb layer by grazing ungulates in Serengeti noted that Thompson's
gazelles do occur in the absence of other herbivore species, mainly where the herb layer was kept short by
burning or any other human activities, for example grazing by domestic stock. This is because Thompson's
gazelles preferred the most nutritious diet of all the ungulates he studied, and such a diet was mainly available
in burnt areas.
Several other ecologists have-emphasized the importance of fire as an ecological factor and as a useful man-
agement tool in grasslands ( Strugnell and Pigott ,1978; Norton -Griffiths ,1979; Byram quoted by Dauben-
mire ,1968; Glover, 1968; Debano and Contrad, 1978; Afolayan and Fafunsho, 1978; Kilgore, 1978 ; Afo-
layan and Ajayi, 1980 ; Moore,1960; Van Rensburg ,1971; Kessel ,1976; Vogl ,1974); Lock and Mil-
burn,1971). Thus, fire is an important ecological factor in maintaining grasslands in their form (Skovlin
,1971 ; Cooper ,1961).Fires may lead to establishment of trees and shrubs and permits vegetation succession
Page 6
International Journal of Scientific Research and Innovative Technology ISSN: 2313-3759 Vol. 3 No. 3; March 2016
60
leading to some type of wooded plant community (Edward and Bogdan, 1951; Talbot, 1963; Dimbleby, 1977
and Afolayan, 1978; Peberdy ,1969).
Very little is known and can be said about occurrence of fires in the Athi-Kapiti plains before the advent of
written records. It is probable that the pastoral inhabitants of this area occasionally fired the savannah grass-
lands (Edwards and Bogdan, 1951). For example, the Maasai and Kikuyu peoples may have established them-
selves in the Athi-Kapiti plains around the sixteenth century (Morgan, 1967). These native tribes probably
burnt the vegetation and used fire to improve grazing for their livestock and to facilitate hunting (Owen, 1966;
Ojany and Ogendo, 1973). The plains being dominated by savanna grassland were possibly annually burnt by
fires started by the hunters .
Accidental and deliberate burning of vegetation also may have occurred frequently in the plains during the dry
seasons (Stewart and Zaphiro, 1963; Owen, 1966). This was carried out by Maasai people mainly to provide
short green growth for their cattle and sheep, when the palatability and feeding value of unburnt range was
low (Glover, 1968; Ojany and Ogendo, 1973).
3.0 Research Methodology
3.1 Selection of Experimental and Control Plots
It was necessary that plots be established upon which controlled experimental burning would be carried out
adjacent to unburnt control plots. The plots were established in areas of relatively uniform soils and vegeta-
tion. Data were collected in order to establish the similarity of each set of paired plots before the experimental
burning.It was postulated that fire might differently affect the grazing resources in the major vegetation
types. Hence the plots were located in the two main vegetation types of Acacia -Themeda grassland and
open grassland with scattered trees. There were no plots established in the forest or woodland vegetation
type as it was considered to be of less important in this study since it contained negligible numbers of large
herbivores.
These sets of paired plots (each 50x50M) were located in Acacia - Themeda grassland (Figure 1). Site 1 was
established on an almost level flat plain about 2 km from the East gate by road, near the Radio Beacon. The
area was domonated by grasses species such as Themeda triandra,Setaria sphacelata, Pennisetum mezianum
and Andropogon gayanus) with scattered Acacia drepanolobium bushes. Site 2 had a pair of plots situated
about 3 km by road from Langata gate. It was on the southern side of the Mokoyeti Channel and to the south
of Narogomon Dam; The vegetation was similar to that of site 1, except that there were more grass species
than those on site 1 . Additional species were Digitaria nodosa, Panicum maximum, Aristida adoensis and
Eragrostls heteromera. Site 3 was located near sign post 18 on Songora Ridge. The vegetation of this site has
been described by Stanley-Price (1974) as bushed grassland and differed in terms of edaphic factors from
sites 1 and 2 although included in the plains Acacia - Themeda grassland. The final study site (site 4) was lo-
cated in the Athi River basin (Fig. 1).
The four sets of paired plots which were situated in the main grasslands of this Park were treated as follows:
One plot in each set was to be burnt and the other was left unburnt to provide a control experiment . The plots
were coded for ease of subsequent reference. All plots that were to be burnt were coded with the letter "B"
thus IB, 2B, 3B or 4B. The digit indicated the location (Site) of the plot while the letter "B" denoted the burnt
(treatment)“member” of the burnt set. The other plots which were the control that is unburnt were referred as
Page 7
International Journal of Scientific Research and Innovative Technology ISSN: 2313-3759 Vol. 3 No. 3; March 2016
61
"U" plots thus 1U, 2U, 3U or 4U.The sites of study also corresponded with the major game counting blocks
(Figure 1). Locations of the plots in each study site or block was done through a simple random selection .
This was done after identification of the major soil/vegetation types to be studied . On arrival at such sites a
compass direction was chosen. This was done by writing the eight compass direction on eight cards and a sin-
gle direction was randomly drawn from the hat. Then an assistant who knew least about the vegetation was
asked to walk for a hundred meters in the chosen direction, the course of this direction being maintained by
use of a prismatic compass. The hundredth meter point was used to mark off one corner of the first plot, the
rest being fitted by use of 90° bearing of the compass. The second plot was located adjacently separated by 10
m fire break and parallel to the first one. Each plot was enclosed by a 10 m wide graded fire break.
3.2 Determination of Standing Crop and Chemical Composition of Grass
A determination of the status of standing crop was carried out in each set of plots before experimentation. The
number of samples was maintained at ten per plot. The point quadrats a non-destructive method of vegetation
analysis by Goldsmith and Harrison (1967) was applied . The quadrats were distributed throughout the study
plots by simple random walk technique (Goldsmith and Harrison, 1967 ; Chapman ,1976,). This method in-
volved walking on compass bearing (randomly chosen) for a random number of paces. Random numbers (1-
10) from Fisher and Yates (1963) were used for determining the number of paces to be made before sampling
and changing direction.
Standing crop ,that is , the weight of all the grass material at any given moment per unit space, (Petrusewicz;
and MacFadyen, 1970) of the vegetation was measured by harvesting before the grass in the plots was burnt,
two months after burning when significant amount of dead grass was noticed in the burnt plots and at one
month intervals thereafter. Monthly harvests were started on 21August ,1978 and continued until May 1979.
On each sampling time ten samples (ten quadrats 0.25m) were selected as above from each plot (burnt and un-
burnt) at each study site. All living and dead material was randomly collected from each quadrat by hand
clipping as close as possible to the soil surface. The harvested material was taken to the laboratory in sealed
polythene bags and stored at 5°C prior to sorting. The vegetation from each quadrat was separated into living
green and dead categories. That is, dead grass included dried leaves and stems, while living grass consisted of
green leaves (containing chlorophyll) and living stems. Living and dead grass were not sorted into species be-
cause the dried leaves and stems had lost many of the identifying features. After sorting, the material was oven
dried at 80°C to constant weight.
The general physical appearance of grass in experimental sites was observed during the study period. This in-
vestigation was a subjective one, since it involved assessment and categorization of the physical condition of
grass during the growing season, at each sampling time and during the monthly game counts. This was done
by visual estimation of the height and the physical condition of the grass. Descriptive terms were used such as
"long dried" seemingly dry grass approximately 70 cm tall, short dried relatively dry grass but less, than 10cm
tall, burnt black grass recently burnt with only charred tussocks left and lush green sprouting green grass. It
was hoped that such information would offer an explanation as to why certain animal species were found in
particular game count blocks at different periods of the year.
The nutrient status of the grass before and after burning was analyzed. The grass material samples were col-
lected from both plots in all the study sites during the following periods:Before the experimental burning, this
was during mid October, late in the "long dry season", Two months after burning that is in December 1978 -
during the middle of the "short rainy season", and six months after burning, during May 1979, a. time corres-
Page 8
International Journal of Scientific Research and Innovative Technology ISSN: 2313-3759 Vol. 3 No. 3; March 2016
62
ponding to the middle of the long rainy season .The dried samples of dead and living stems and leaves were
cut into small pieces measuring approximately 2-3 cm in length. This was followed by mixing of the ten sam-
ples of each category obtained from the field at any one time. Triplicated samples were drawn from the mix-
ture and used as representative samples for nutrient analysis, for each category of plot before sending them to
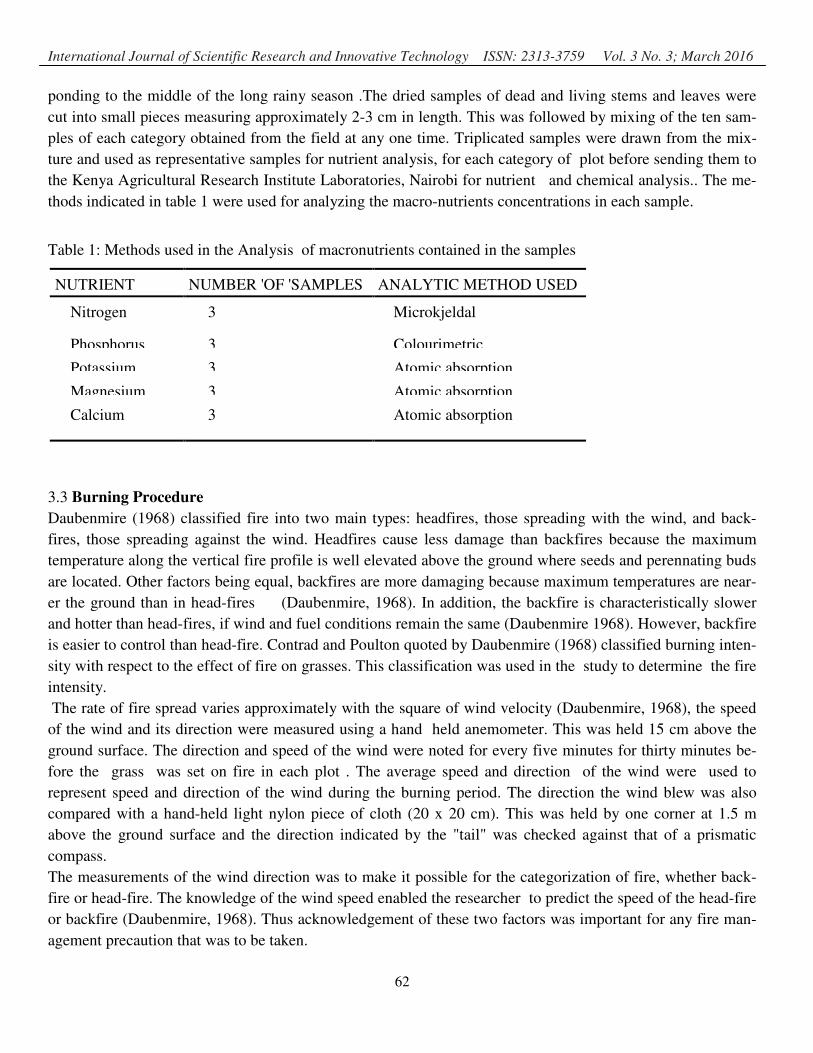
the Kenya Agricultural Research Institute Laboratories, Nairobi for nutrient and chemical analysis.. The me-
thods indicated in table 1 were used for analyzing the macro-nutrients concentrations in each sample.
Table 1: Methods used in the Analysis of macronutrients contained in the samples
NUTRIENT NUMBER 'OF 'SAMPLES ANALYTIC METHOD USED
Nitrogen 3 Microkjeldal
Phosphorus 3 Colourimetric
Potassium 3 Atomic absorption
Magnesium 3 Atomic absorption
Calcium 3 Atomic absorption
3.3 Burning Procedure
Daubenmire (1968) classified fire into two main types: headfires, those spreading with the wind, and back-
fires, those spreading against the wind. Headfires cause less damage than backfires because the maximum
temperature along the vertical fire profile is well elevated above the ground where seeds and perennating buds
are located. Other factors being equal, backfires are more damaging because maximum temperatures are near-
er the ground than in head-fires (Daubenmire, 1968). In addition, the backfire is characteristically slower
and hotter than head-fires, if wind and fuel conditions remain the same (Daubenmire 1968). However, backfire
is easier to control than head-fire. Contrad and Poulton quoted by Daubenmire (1968) classified burning inten-
sity with respect to the effect of fire on grasses. This classification was used in the study to determine the fire
intensity.
The rate of fire spread varies approximately with the square of wind velocity (Daubenmire, 1968), the speed
of the wind and its direction were measured using a hand held anemometer. This was held 15 cm above the
ground surface. The direction and speed of the wind were noted for every five minutes for thirty minutes be-
fore the grass was set on fire in each plot . The average speed and direction of the wind were used to
represent speed and direction of the wind during the burning period. The direction the wind blew was also
compared with a hand-held light nylon piece of cloth (20 x 20 cm). This was held by one corner at 1.5 m
above the ground surface and the direction indicated by the "tail" was checked against that of a prismatic
compass.
The measurements of the wind direction was to make it possible for the categorization of fire, whether back-
fire or head-fire. The knowledge of the wind speed enabled the researcher to predict the speed of the head-fire
or backfire (Daubenmire, 1968). Thus acknowledgement of these two factors was important for any fire man-
agement precaution that was to be taken.
Page 9
International Journal of Scientific Research and Innovative Technology ISSN: 2313-3759 Vol. 3 No. 3; March 2016
63
3.4 Determination of Moisture content in the grass
The amount of moisture in grass material was measured before the controlled burning experiment. Ten grass
samples were collected using simple random method from each plot before burning. Each sample was placed
in a polytene bag which was immediately sealed and weighed using a spring balance, to determine their field
weight. These samples were later placed in paper bags, transferred to the laboratory and dried to constant
weights in the oven at 105°C. The water content in both soil and grass samples was calculated by subtracting
the oven dry weight from field (wet) weight. The average differences for ten samples (soil and grass) was ex-
pressed as a percentage of the average dry weight of the grass.
4.0 Results and Data analysis
4.1 Moisture Content of the Grass before Burning
The intensity of all backfires was class 1 according to Daubenmire (1968). The speed of these fires varied in-
versely with the velocity of the wind. The grass moisture in this experiment did not affect the fire intensity or
speed of the fire-line progression. Fire intensity was high even where the grass moisture content was relatively
high (36.17%) as in plot 3B. All the grass fuel was consumed in all the study plots.
4.2 Standing Crop and Nutrient Content of Grass in Control and Experimental Plots
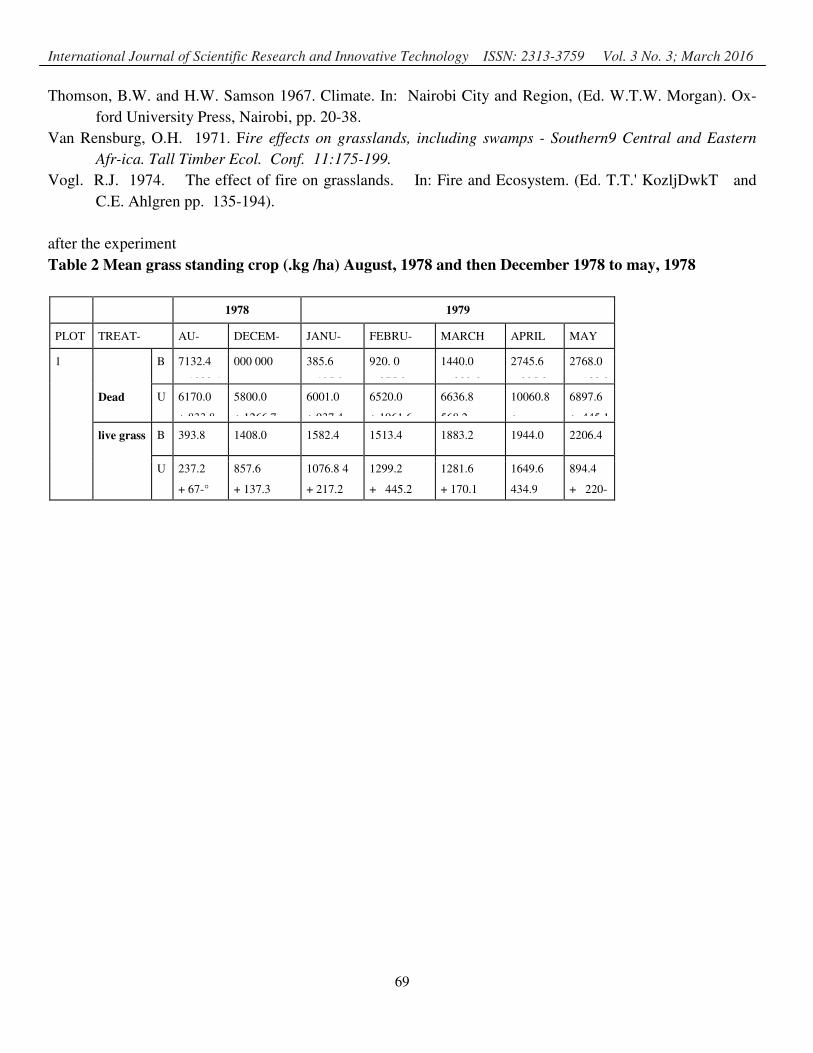
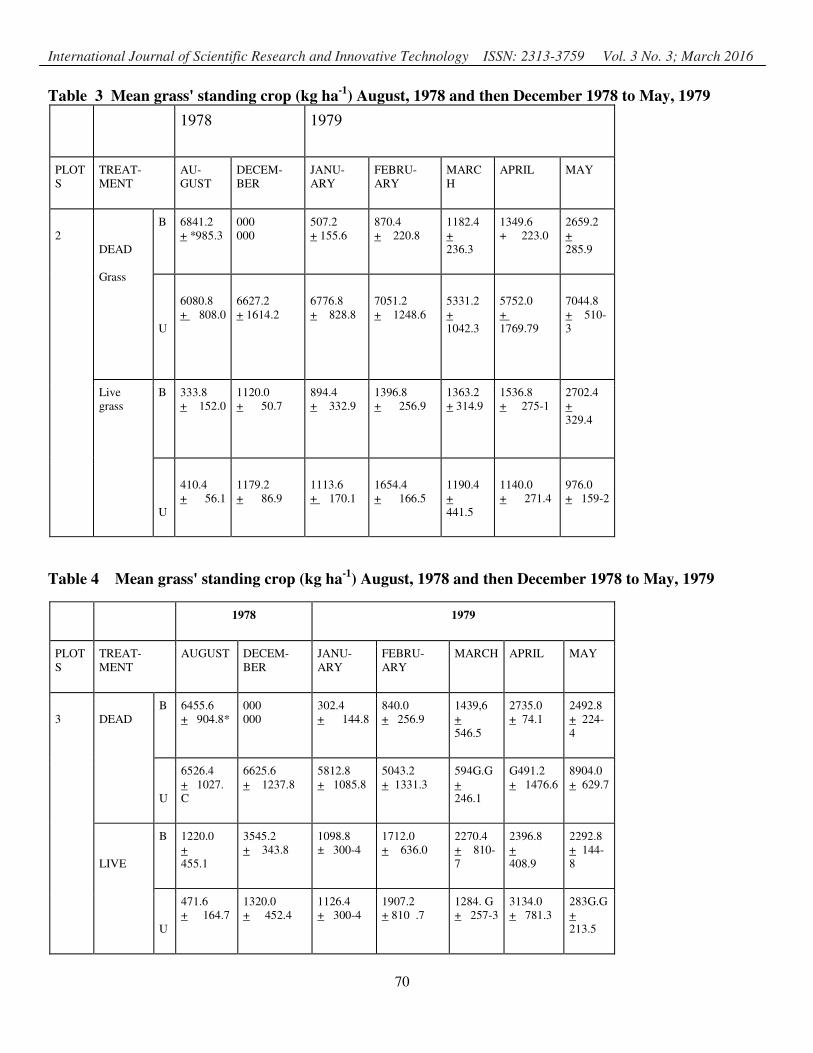
The results of the harvest measurements are summarized in tables 2 to 5 and standard errors are given for each
measurable amount in all the four study sites .There was no significant difference t - test, p> 0.05 in total
standing crop dry weight in each set of control and experimental plots before the experiment in August, 1978.
However, the total standing crop differed greatly at least p< 0.05 and often P< 0.001 in the two sets of plots in
all the study sites during the months that followed the experimental burning. At all times of the study the
quantity of dead grass exceeded the amount of living in unburnt plots . There was also more living grass than
dead in the burnt plots during the early part of growing season. This picture changed towards the middle of the
growing season (March and April) and the amount of dead grass began to exceed that of living grass.
Measurements of nutrients Nitrogen,Phosphorus and Potassium (NPK) contained in live grass in each plot
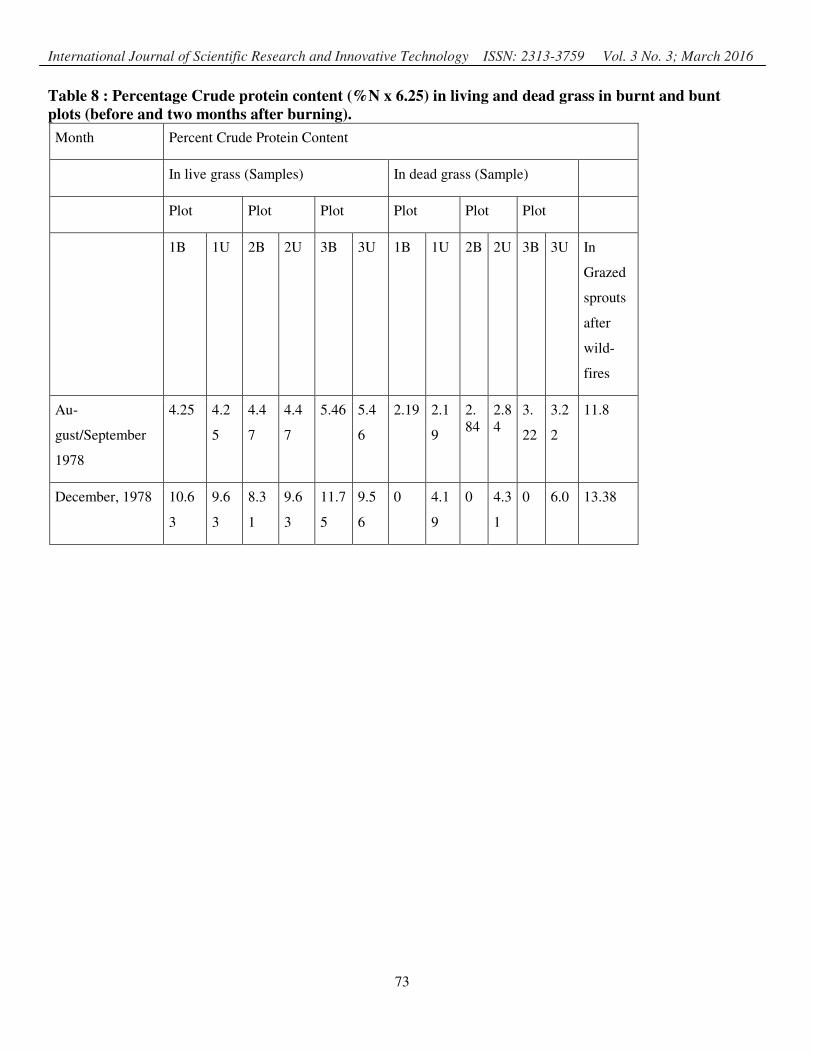
before and after burning are illustrated in table 6 and 7 and percent crude protein in living and dead grass in
burnt and unburnt plots is shown in Table 8 . In general there was an increase in grass nutrient during Novem-
ber 1978 in all the plots. However, except in very few cases e.g. phosphorus and nitrogen in plot 2,the nu-
trient level was higher in burnt than in unburnt plots in December i.e. two months after the experiment
The quantity of live grass was similar in burnt and unburnt (tending to be slightly more in unburnt), but the
proportion of total standing crop that is live was greater in burnt than in unburnt. The quantity of nutrients in
terms of live grass (kg ha-1
) was greater in burnt than unburnt that is grass in burnt plots had a higher concen-
tration of nutrients. However, a certain amount of caution is needed in interpreting the data on changes in plant
standing crop and nutrient content of grasses. This is because although the four study sites were representative
of the Park grasslands, they were dominated by somewhat different combinations of grass species. The study
sites were also separated by distances ranging from 8 km to 15 km (Fig. 2.3). Thus, they received slightly dif-
ferent amounts of rainfall . It is also noted that the quantities of dry matter harvested during the study period
for each treatment at four study sites were different. The variations in weight of the total grass standing crop
(live and dead) in different plots were significant. These differences in weight of grass do not relate to the
rainfall gradient across the Park. Ideally, there should be more than one set of study plots in each type of
Page 10
International Journal of Scientific Research and Innovative Technology ISSN: 2313-3759 Vol. 3 No. 3; March 2016
64
grassland. Measurements should also continue over several years with different burning regimes.
5.0 DISCUSSION
Data from all of the study sites on standing grass crop reflect a very high proportion of dead grass present in
unburnt plots even in the middle of the rainy season, the dead grass: green grass ratio was 4.7:1. Van Rensburg
(1971) also reported that complete protection from fire resulted in accumulation of dead herbage which hin-
dered the growth of the new grass in a pasture. Edwards and Bogdan (1951) also found that palatability and
nutritive value of grass depends upon the distribution of hard tissues in leaves. They also noted that digestibili-
ty decreases with the age of the grass because of increase in fibre content. Heady (1960) reported that in the
dry season when the crude protein in many grasses is low animals have problems digesting such materials.
Many species of herbivores showed decided preference for young grasses which have higher crude protein
content than the old fibrous grass (Strungnell and Pigott, 1978). Similarly, Afolayan (1978) observed in Kainji
National Park, Nigeria, that grazing dropped as the crude protein decreased with the age of the grass.
In this study it was found that crude protein of dead grass in burnt and unburnt plots was low compared with
that present in living grass. It was assumed therefore, that the palatability and digestibility of the living grass
would decline as it grew old. Thus athese results show the importance of burning in reducing the amount of
unpalatable, less nutritious materials. It was also noted that in burnt areas green grass appeared earlier (when
the rains came) than in unburnt areas. This is because the new growth was hidden by the old material in un-
burnt areas. It seems probable that the grazers had difficulty in selection of live grass within an accumulation
of dead grass. This would explain why the herbivores were attracted to burnt areas where the dead grass: live
grass ratio was low.
The accumulated dead materials may also increase the likelihood of wildfire during the dry season since they
contain large amounts of dry grass representing fuel rather than food reserves for herbivores (Heady, 1960). It
can, therefore, be argued that people who object to burning may be opposing the burning of useless dry her-
bage in this Park especially during exceptionally wet seasons. The removal of dead grass by burning stimu-
lated more vigorous growth which seemed to attract the grazers. In this study, it was observed that the percen-
tage cover for Themeda triandra did not increase after burning. However, it is unrealistic to expect significant
floristic changes within the few months of this study. Lock and Milburn (1971) found that removal of plant
cover by fire resulted in an increase in Themeda triandra. They noted that the increase in this species resulted
from seedlings rather than from the sprouting of the old tufts.
Earlier observations in this Park confirmed the observations made here, that burning produced grass that at-
tracts herds of wildebeest and zebras (Foster and Coe , 1968; Pratt ,1967; Park records ,1968). It is also re-
ported that burning in 1968 had the desired effect of keeping quite a large number of migrating herbivores in
the Park during the rainy season when they would normally have moved to Kitengela Conservation Unit as
soon as the rains start and remain out until the grass and water supplies dry out in the Conservation Unit. Al-
though burning was found to be important no purposeful burning was done after 1969. Instead, mowing was
carried out in 1968 to attract the game (Park records, 1968). In such mowed areas the palatability and nutri-
tional value was assumed to be improved. The Assistant Warden (Park records, 1968) also recommended a
plan-of rotational burning such that the same area was burnt once in three years.
It should, however, be mentioned that the plains game were not being attracted to burnt areas only by im-
Page 11
International Journal of Scientific Research and Innovative Technology ISSN: 2313-3759 Vol. 3 No. 3; March 2016
65
proved palatability of the grass but also probably, by improved visibility. Short grass areas resulting from
burning or grazing may provide a better chance of detection and escape from predators than tall grasses of
burnt sites (Vogl, 1974). This possibility cannot be ruled out, since there was a higher concentration of plains
game in unburnt short grass areas during the dry season. In such areas the nutritional quality and accessibility
of grasses would have been suspected to be poorer than in the tall grassland areas during the same period.
When the rains came, the unburnt short and long grass areas had a lower game occupancy than burnt areas.
Thus, it is most likely that it is the enhanced palatability of grasses rather than predator avoidance that attracts
the grazers to burnt areas. The browsers also did not show any decided preference for short grassland areas.
Therefore , their movement from one block to another was most likely determined by food availability rather
than predator avoidance. The detailed investigation of the above possibilities could not be carried out due to
the time limit of this study.
Repeated burning, however could be detrimental to grasses and hence, grazing resources. A comparison of
nitrogen in the ash with that present In the standing crop before burning indicates a slight reduction in the total
nitrogen. It is likely, therefore, that some nitrogen present in the unburnt material is lost through volatilisation
when the material is converted into ash (Daubenmire ,1968; DeBano and Contrad ,1978). Although, there are
few investigators who report loss of nitrogen from grass material after burning many have found nitrogen con-
dition definitely improved in the soil as a consequence of grassfire. For example in the savannah grasslands
of Nigeria, nitrogen was lowest in plots protected from, burning (Moore, I960). Thus, although there a was
loss of nitrogen after burning through volatilization the input through rainfall and fixation from the atmos-
phere is sufficient to balance the small loss resulting from burning (Hunter et al., quoted by Daubenmire,
1968).
6.0 MANAGEMENT AND MONITORING RECOMMENDATIONS
The Park is already divided into blocks of land (game counting blocks) which are separated by motorable
roads. These blocks can be burnt on a rotational system under a well planned controlled burning programme.
The roads should provide fire-breaks to prevent the fire from spreading to blocks which were not intended
for burning at any one given time. Therefore, these roads should be cleared of any vegetation before each
burning procedure.
It is suggested that blocks IIA, IIB, IIIA and IIIB may form one set of burning blocks. VA, VB and VIA a
second set and VIIA, VIIB a third set. The fourth set would consist of blocks 1, VIII and IV. One game count-
ing block in each of the first three sets should be burnt at any one time. For example the following blocks
could be burnt at the same time at each burning period .Blocks II (A and B), and VA and VIIB , blocks IIIB,
VB and VIIA and blocks IIIA, VIA and VI
Block IV would be left aside as an unburnt block and thus completely protected from fire. Blocks I, VIII and
IX form important dry season food reserves because they contain marshes and permanent dams and hence the
plains game concentrate here during the driest periods of the year.
Each of these blocks would only be burnt at the end of dry season unless heavily grazed and trampled during
the dry season. This would allow palatable standing crop to re-accumulate during the rainy seasons.
The frequency and the time of burning would depend on the amount of accumulated dead grass which in turn
is dependent on precipitation and grazing intensity. Thus burning may not be necessary during the dry years
when the plains game concentrate in the Park. Therefore the burning programme should be flexible depending
on an accumulation of dead grass. However, the main purpose of burning in this Park (and an objective of this
Page 12
International Journal of Scientific Research and Innovative Technology ISSN: 2313-3759 Vol. 3 No. 3; March 2016
66
study) is to improve the grazing resources and hence attempt to reduce the movement of herbivores to the out-
side of the Park at the beginning and middle of the rainy seasons. Late burning will not only have the desired-
effect by improving grazing conditions but would also allow the grasses to recover during the rainy period that
would follow this burning programme.
7.0 CONCLUSIONS
This burning programme would provide a burning and grazing mosaic over the whole Park that would create a
variety of grazing resources at the beginning and middle of the rainy season. It would also ensure there is
available flush of green grass during the growing season. It should, however, be mentioned that any such burn-
ing programme should be coupled with long term experimental projects on the impact of burning, mowing and
grazing on grasses. Hence, the reason for the block IV being left aside as a control.
Occasional rotational burning in the game counting blocks under strict control is likely to provide the amount
of grass and browse necessary for animal life and good visibility for game viewing (Afolayan and Ajayi,
1980). This practice together with the permanent dams and watering places would probably reduce the season-
al migration of large herbivores to the Kitengela Conservation Unit, where they are more likely to be poached
as reported in 1968, 1969 and 1971 (Park quarterly reports).
At the time of study the Park Warden had found the need for improving the grazing resources and reducing
grass fuel in the Park by burning during the wet periods in the year. However, this programme was not based
on any research data. The results of this study were expected to help the Park authorities in designing and im-
plementation of the Park's much needed use of fire as a management tool in its policy framework .
It should be pointed out that conservation areas like Nairobi National Park should ideally remain completely
"natural" and unchanged. However, the Park is in an unnatural state already. The area is partly fenced, has
man-made dams and roads and is surrounded by humans activities and nature can no longer be allowed to take
its own course. For example the migration routes of the herbivores have been changed due to human occupa-
tion in the Athi - Kapiti plains and the former Kitengela conservation unit.The survival of this natural resource
is currently totally threatened by humans habitation around all its boundaries.
Historical facts as well as the results of research, past and present, suggest that fire be regarded as an integral
management option of the ecological and social complex of this Park.
The tendencies which have appeared in the short time in which this research was conducted unquestionably
suggested that burning in this Park is necessary in order to remove accumulated fuel, aid better utilization of
Park savannah grasslands ecosystem , help distribution of animals during the plant growing seasons and re-
move unpalatable grass growth. Use of fire could also improve visibility during game viewing and hence the
Park be made more attractive to local and foreign tourists. The results also suggest that withdrawal of the fire
factor initially may lead to a deterioration of the grazing resources in this ecosystem . This would also even-
tually result in a dominance of the woody species and exclusion of grasses and grazers in the course ecological
plant succession.
Page 13
International Journal of Scientific Research and Innovative Technology ISSN: 2313-3759 Vol. 3 No. 3; March 2016
67
8.0 References
Afolayan, T.A. 1978. Savanna burning in Kainji Lake National Park, Nigeria. A. Afr. Wildl. 0. 16:245-255.
Afolayan, T.A. and M. Fafunsho 1978. Seasonal variation in the protein content and grazing of some tropical
savanna grasses. E.Afr. Wildl. J. 16:97-104.
Afolayan, T.A. and S.5. Ajayi, 1980. The, influence of seasonality on the the distribution of large mammals in
Yankari Game Reserve, Nigeria. Afr. J. Ecol., 18:37-96.
Bell, R.H. 1970. The use of herb layer by grazing ungulates in the Serengeti. In: Animal Populations in rela-
tion to their food resources (ed. Watson A.) Blackwell, Oxford and Edinburgh.
Chapman, S.B. 1976. Production ecology and nutrient budgets. In: Methods in Plant Ecology (ed. S.B. Chap-
man) Blackwell Scientific Pub!.9 Oxford, pp. 157-288. CLAYTON, W.D. 1970. Flora of Tropical East
Africa: Gramineae (Part 1). Crown agents, London.
Cooper, F.C. 1961. The ecology of fire Sci. Amer. 204:150-160
Dale, I.R. and P.J. Greenway 1961. Kenya Trees and Shrubs. Buchanan's Kenya Estates Ltd., in association
with Hatchard's London.
Daubenmire, R. 1968. The ecology of fire in grasslands. In: Advances in Ecological Research (ed. J. Cragg).
Academic Press. London and New York: pp. 209-266.
Debano, L.F. and C.E. Conrad 1978- Effect of Fire on Nutrients in a chaparral ecosystem. Ecol. 59:439-497.
Dimbleyby, G.W. 1977. Ecology and Archeology. Edward Arnold,
London.
Edwards, D.C. 1942. Grass burning. Emp. J. Exp. Agric. 10:219-231.
Edwards, D.C. and A.V. Bogdan, 1951; Important grassland plants of Kenya. Pitmans. Nairobi.
Fisher, R.A. and F. Yates. 1963. Statistical' Tables for Biological, Agricultural and Medical Research, 6th edi-
tion. Oliver and Boyd, Edinburgh and London.
Foster, J.B. and D. Kearney 1967. Nairobi National Park game census, 1966. E. Afr. Wild. J. 5:112-120.
Foster, J.B. and M.J. Coe. 1968. The biomass of game animals in Nairobi National Park, 1960-1966. J.
Zoo!. London 155:413-425
Glover, P.E. 1968. The role of fire and other influences on savanna habitat, with suggestions for further re-
search. E. Afr. Wild. J. 6:131-137.
Goldsmith, F.B. and C.M. Harrison 1967. Description and analysis of vegetation. In: Methods in Plant
Ecology. (Ed. S.B. Chapman) Blackwell Scientific Pub!., Oxford, pp 85-155.
Gosling, L.M. (1975). The ecological significance of male behaviour in Coke's hartebeest, Alcelaphus
buselaphus cokei (Gunther). Unpublished Ph.D Thesis. University of Nairobi.
Heady, H.F. 1960. Range Management in East Africa. Govt. Printer, Nairobi
Page 14
International Journal of Scientific Research and Innovative Technology ISSN: 2313-3759 Vol. 3 No. 3; March 2016
68
Heriz-Smith, S. 1962. The Wild Flowers of Nairobi National Park (includes a note on vegetation by Bernard
Verdcourt). D.A. Hawkins Ltd., Nairobi,
Hill, P. 1971. Grass foggage, food for fauna or fuel for fire or both? Tall Timbers Fire Ecol. Conf., 11:337-
375.
Kessel S,R. 1976. Gradient Modelling: A new approach to fire modelling and wilderness resource manage-
ment. Environ. Management 1:39-48.
Kilgore, B,M. 1978. From fire control to fire management and ecological basis for policies. Trans. N. Amer.
Wildl. Natur. Resour. Conf, 41:477-496.
Lock , J.M. and T.R. Milburn, 1971. The seed biology of Themeda triandra Forsk. in relation to fire. In:
Scientific Management of Animal and Plant Communities for .conservation. (Ed. E. Duffey and A.5.
Watt). The llth Symposium of the British Ecological Society University of East Anglia, Norwich.
Blackwell and Oxford, pp,337-349.
Moore, A.M. 1960. The influence of annual burning and soil in the derived zone of Nigeria. 7th Internat.
Congr. Soil Trans. 4:257-267.
Morgan W.T.W. 1967. Nairobi: City and Regions. (Ed. W.T.W. Morgan) Oxford University Press..Nairobi.
Norton-Griffiths, M. 1979. The influence of grazing, browsing and fire on the vegetation dynamics of the Se-
rengeti. In: Serengeti Dynamics of an Ecosystem. (Eds. A.R.E. Sinclair, M. Norton Griffiths). Chicago
University Press, pp. 310-352.
Ojany, F.F. and R.B. Ogendo 1973. Kenya; A study in physical and human geography. Longman, Kenya.
Owen, D.F. 1966. Animal Ecology in Tropical Africa. Oliver and Boyd, Edinburgh and London.
Peberdy, J.R. (1969). Rangelands of East Africa. In: East Africa: its People and Resources. (Ed. E.W. Russel).
D.A. Hawkins in Association with East African Literature Bureau, Nairobi pp. 153-176.
Petrusewicz, K. and A. Macfadyen ,1970. Productivity of Terrestrial Animals: Principles and Methods. IBP
Handbook No. 13. Blackwell, Oxford.
Pratt, D.J. 1967. A note on the overgrazing of burnt grassland by wildfire. E, Afr..Wildl. J., 5:178-179.
Rudnai, J. 1975. The pattern of lion predation in Nairobi National. Park. E. Afr. Wild. 0. 12:213-223.
Skovlin, J.M. 1971. The influence of fire on important Range grasses of East Africa, Tall Timber fire Ecol.
Conf. 11:201-217.
Strugnell, R.G. and C.D. Pigott, 1978. Biomass, shoot production and grazing of two grasslands in Rwenzori
National Park, Uganda. J. Ecol, 66:75-86.
Stewart, D.R.M. and D. Zaphiro 1963. Biomass and density of wild herbivores in different East African habi-
tats. Mammalia 27:483-496.
Stanley-Price, M.R. 1974. The feeding ecology of Coke's Hartebeest Alcelaphus buselaphus cokei Gunther
in Kenya Unpublished D. Phil. Thesis, Oxford University.
Talbot, L.M. 1963. Ecosystems and biological productivity: Savanna, 9th.Meet., I.U.C.N. 1-11.
Page 15
International Journal of Scientific Research and Innovative Technology ISSN: 2313-3759 Vol. 3 No. 3; March 2016
69
Thomson, B.W. and H.W. Samson 1967. Climate. In: Nairobi City and Region, (Ed. W.T.W. Morgan). Ox-
ford University Press, Nairobi, pp. 20-38.
Van Rensburg, O.H. 1971. Fire effects on grasslands, including swamps - Southern9 Central and Eastern
Afr-ica. Tall Timber Ecol. Conf. 11:175-199.
Vogl. R.J. 1974. The effect of fire on grasslands. In: Fire and Ecosystem. (Ed. T.T.' KozljDwkT and
C.E. Ahlgren pp. 135-194).
after the experiment
Table 2 Mean grass standing crop (.kg /ha) August, 1978 and then December 1978 to may, 1978
1978 1979
PLOT TREAT- AU- DECEM- JANU- FEBRU- MARCH APRIL MAY
1 B 7132.4
+ 1022.4
000 000 385.6
+ 105.0
920. 0
+ 275.0
1440.0
+ 282-3
2745.6
+ 235.2
2768.0
+ 188.2
Dead
grass
U 6170.0
+ 833.8
5800.0
+ 1266.7
6001.0
+ 937.4
6520.0
+ 1961.6
6636.8
568.2
10060.8
+
6897.6
+ 445.1
live grass B 393.8 1408.0 1582.4 1513.4 1883.2 1944.0 2206.4
U 237.2
+ 67-°
857.6
+ 137.3
1076.8 4
+ 217.2
1299.2
+ 445.2
1281.6
+ 170.1
1649.6
434.9
894.4
+ 220-
Page 16
International Journal of Scientific Research and Innovative Technology ISSN: 2313-3759 Vol. 3 No. 3; March 2016
70
Table 3 Mean grass' standing crop (kg ha-1) August, 1978 and then December 1978 to May, 1979
1978 1979
PLOT
S
TREAT-
MENT
AU-
GUST
DECEM-
BER
JANU-
ARY
FEBRU-
ARY
MARC
H
APRIL MAY
2
DEAD
Grass
B 6841.2
+ *985.3
000
000
507.2
+ 155.6
870.4
+ 220.8
1182.4
+
236.3
1349.6
+ 223.0
2659.2
+
285.9
U
6080.8
+ 808.0
6627.2
+ 1614.2
6776.8
+ 828.8
7051.2
+ 1248.6
5331.2
+
1042.3
5752.0
+
1769.79
7044.8
+ 510-
3
Live
grass
B
333.8
+ 152.0
1120.0
+ 50.7
894.4
+ 332.9
1396.8
+ 256.9
1363.2
+ 314.9
1536.8
+ 275-1
2702.4
+
329.4
U
410.4
+ 56.1
1179.2
+ 86.9
1113.6
+ 170.1
1654.4
+ 166.5
1190.4
+
441.5
1140.0
+ 271.4
976.0
+ 159-2
Table 4 Mean grass' standing crop (kg ha-1) August, 1978 and then December 1978 to May, 1979
1978 1979
PLOT
S
TREAT-
MENT
AUGUST DECEM-
BER
JANU-
ARY
FEBRU-
ARY
MARCH APRIL MAY
3
DEAD
B
6455.6
+ 904.8*
000
000
302.4
+ 144.8
840.0
+ 256.9
1439,6
+
546.5
2735.0
+ 74.1
2492.8
+ 224-
4
U
6526.4
+ 1027.
C
6625.6
+ 1237.8
5812.8
+ 1085.8
5043.2
+ 1331.3
594G.G
+
246.1
G491.2
+ 1476.6
8904.0
+ 629.7
LIVE
B
1220.0
+
455.1
3545.2
+ 343.8
1098.8
± 300-4
1712.0
+ 636.0
2270.4
+ 810-
7
2396.8
+
408.9
2292.8
+ 144-
8
U
471.6
+ 164.7
1320.0
+ 452.4
1126.4
+ 300-4
1907.2
+ 810 .7
1284. G
+ 257-3
3134.0
+ 781.3
283G.G
+
213.5
Page 17
International Journal of Scientific Research and Innovative Technology ISSN: 2313-3759 Vol. 3 No. 3; March 2016
71
Table 5 Mean grass standing crop (k/ha)August, 1978 and then December 1978 to May 1979
1978 1979
PLOT
S
TREAT-
MENT
AU-
GUST
DECEM-
BER
JANU-
ARY
FEBRU-
ARY
MARC
H
APRIL MAY
4
DEAD
B
6462.0
+ 755.5
000
+ 000
440.0
+ 332.9
G92.8
+ 228.0
318.4
+ 217-
2
2241.6
+ 195-4
2137.6
+ 665.9
U
5804.
+ 483.1
6516.8
+ 586.3
5980.8
+ 1357.2
6774.4
+ 1990.5
6668.3
+ 955-
5
3227.2
+
2736.1
11460.8
+ 673.1
LIVE
B
38.4
+ 32.6
1408.0
+ 394.5
1035.2
+ 416.2
1563.2
+ 293.2
2172.8
+ 571.
8
2836.8
+
390.9
2881.6
+ 452-4
U
0000
0000
966.4
+ 209.9
1136.00
± 133-9
2731.2
+ 1147.3
2688.
+ 264.2
3240
+ 651.5
3302.4
+ 325.7
NB: CONFIDENCE LIMITS WERE CALCULATED AT 95$ PROBABILITY LEVEL (P = 0.05). TEN SAM-
PLES WERE TAKEN IN EACH CASE DF = 9. t s (n-1) ẌS.d x S.E.
Table 6 Change in plant nutrients (in kg ha-1) in living green grass before burning and two months after burning.
N P K
SITE PLOT BE-
FORE
BURN-
ING
AFTER
BURN-
ING
DIFF. BE-
FOR
E
BUR
NIN
G
AF-
TER
BURN
ING
DIFF. BE-
FORE
BURN
ING
AF-
TER
BURN
ING
DIFF.
1
B
2.17
(0.68)*
23.94
(1.70)
+
21.77
0.31
(0.08
)
2.11
(0.15)
+ 1.8
5.58
(1.40)
18.30
(1.30)
+
12.72
U
1.61
(0.68)
13.21
(1.54)
+ 11.6
0.19
(0.08
)
1.03
(0.12)
+ 0.84
3.32
(1.40)
11.23
(1.31)
+
7.91
Page 18
International Journal of Scientific Research and Innovative Technology ISSN: 2313-3759 Vol. 3 No. 3; March 2016
72
2 B 2.42
(0-72)
14.90
(1.33)
+
12.48
0.25
(0.07
5)
1.23
(0.11)
+ 0.98
3.59
(1.06)
7.84
(0.70)
+ 4-
25
U
2.91
(0.72)
18.14
(1.54)
+
15,23
0.30
(0.07
)
1.53
(0.13)
+ 1.23
4.35
(1.06)
16.74
(1.42)
+
12.35
3
B 10.68
(0.88)
29.05
(1.88)
+
18.37
2.95
(.242
)
4.94
(0.32)
+ 1.99
15.93
(1.31)
31.32
(2.04)
+
15.34
U
4.13
(0.83)
15.97
(1.21)
+11.8
4
1.14
(0.24
)
3.3
(0.25)
+ 2.16
6.18
(1-31)
18.8
(1.43)
+
12.7
Table 7 Change in plant nutrients (in kg ha-1) in living green grass before burning and two months after burning.
N P K
SITE PLOT BE-
FORE
BURN-
ING
AFTER
BURN-
ING
DIFF. BE-
FORE
BURN-
ING
AFTER
BURN-
ING
DIFF, _.
BEFORE
BURN-
ING
AFTER
BURN-
ING
DIFF.
1
B
2.15
(0.58)*
6.90
(0.49)
+ 4.75
0.52
(0.13)
1.83
(0.13)
+ 1.31
0.49
(0.124)
1.55
(0.11)
+ 1.06
U
1.28
(0.04)
4.46
(0.52)
+ 3.18
0.31
(0.13)
0.94
(0.11)
+ 0.63
0.29
(0.125)
0.69
(0.08)
+ 0.4
2 -
B
1.43
(0.423)
8.18
(0.73)
+6.75
0.32
(0.094)
1.90
(0.17)
+ 1.58
0.39
(0.12)
1.57
(0.14)
+ 1.18
U
1.74
(0.423)
5.90
(0.50)
+4.16
0.39
(0.094)
1.18
(0.10)
+ 0.79
0.47
(0.94)
1.42
(0.12)
+ 0.95
3
B
4.73
(0.388)
8.50
(0.55)
+3.77
1.65
(0.94)
3.09
(0.20)
+ 1.44
(1.15
(0.94)
2.47
(0.16)
+ 1.32
U
1.83
(0.39)
7.26
(0.55)
+5.43
0.64
(0.14)
2.24
(0.17)
+ 1.6
0.44
(0.09)
1.45
(0.1)
+ 1.01
Page 19
International Journal of Scientific Research and Innovative Technology ISSN: 2313-3759 Vol. 3 No. 3; March 2016
73
Table 8 : Percentage Crude protein content (%N x 6.25) in living and dead grass in burnt and bunt plots (before and two months after burning).
Month Percent Crude Protein Content
In live grass (Samples) In dead grass (Sample)
Plot Plot Plot Plot Plot Plot
1B 1U 2B 2U 3B 3U 1B 1U 2B 2U 3B 3U In
Grazed
sprouts
after
wild-
fires
Au-
gust/September
1978
4.25 4.2
5
4.4
7
4.4
7
5.46 5.4
6
2.19 2.1
9
2.
84
2.8
4
3.
22
3.2
2
11.8
December, 1978 10.6
3
9.6
3
8.3
1
9.6
3
11.7
5
9.5
6
0 4.1
9
0 4.3
1
0 6.0 13.38