Page 1
University of Central Florida University of Central Florida
STARS STARS
Electronic Theses and Dissertations, 2004-2019
2010
Effects Of Flight Factors On Pilot Performance, Workload, And Effects Of Flight Factors On Pilot Performance, Workload, And
Stress At Final Approach To Landing Phase Of Flight Stress At Final Approach To Landing Phase Of Flight
Kyongsun Lee University of Central Florida
Part of the Engineering Commons
Find similar works at: https://stars.library.ucf.edu/etd
University of Central Florida Libraries http://library.ucf.edu
This Doctoral Dissertation (Open Access) is brought to you for free and open access by STARS. It has been accepted
for inclusion in Electronic Theses and Dissertations, 2004-2019 by an authorized administrator of STARS. For more
information, please contact [email protected] .
STARS Citation STARS Citation Lee, Kyongsun, "Effects Of Flight Factors On Pilot Performance, Workload, And Stress At Final Approach To Landing Phase Of Flight" (2010). Electronic Theses and Dissertations, 2004-2019. 1628. https://stars.library.ucf.edu/etd/1628
Page 2
EFFECTS OF FLIGHT FACTORS ON PILOT PERFORMANCE,
WORKLOAD, AND STRESS AT FINAL APPROACH TO LANDING
PHASE OF FLIGHT
by
KYONGSUN LEE
B.A., Korea Airforce Academy, 1993
M.S., Chungbuk National University, 2006
A dissertation submitted in partial fulfillment of the requirements
for the degree of Doctor of Philosophy
in the Department of Industrial Engineering and Management Systems
in the College of Engineering and Computer Science
at the University of Central Florida,
Orlando, Florida
Fall Term
2010
Major Professor: Gene H. Lee
Page 3
ii
ABSTRACT
Since human errors are one of the major causes of flight accidents, the design and
operation of the modern aircraft system deals with them seriously. Particularly, the pilot
workload on aviation causes human errors. Whenever new procedures are introduced and
operated, the aircraft capabilities have been checked in every aspect. However, there has been
little study on the impact of the new procedures such as LDLP, SCDA, SATS, and Steep
Angle approach on the pilot performance, workload, and stress.
In this study, different methods have been tried to understand the relationship between
new procedures and the pilots in terms of performance, workload, and stress. The flight
factors (e.g. flight experience, gliding angle, and approach area) were examined by the pilot
performance, workload, and stress at the “Final Approach to L/D” phase using the single
engine Cessna 172R type flight simulator. Five students and five instructor pilots from
Embry-Riddle Aeronautical University in Dayton Beach, Florida, participated and they flew
under four different simulation tasks of gliding angle and approach area. Their Heart Rate
Variability (HRV) and NASA-Task Load Index (TLX) were measured to determine their
stress level and subjective workload, respectively. In addition, Landing Performance (LP)
data (e.g. landing distance, landing speed) and Above Glide Path Tracking Performance
(AGPTP) data were also collected to evaluate pilot performance.
Page 4
iii
As a result, the type of approach area showed a significant effect on pilot performance,
workload, and stress determined by ANOVA (HRV, TLX, LP, AGPTP: all are p < .05).
Flying over “Populated” area (e.g. a large city) resulted in lower pilot performance and higher
pilot workload and stress than that over “Non-Populated” area (e.g. a grass field). Similarly,
the levels of a gliding angle showed the statistical difference on the performance, workload,
and stress (HRV, TLX, and LP: all are p < .05). During the flight with 4.5 degree, the pilots
showed lower performance with higher workload and stress. However, the levels of the flight
experience did not have any influence on the performance, workload, and stress levels
(AGPTP, LP, TLX, HRV: all are p > .05).
In conclusion, flying in Populated area and flying with a 4.5 degree gliding angle
increases the workload and stress level of the pilots. In addition, when the pilots were flying
over Populated area at Final Approach to L/D phase, they showed lower performance on
tracking the glide path. Based on the results, stresses and workload can have a significant
impact on flight performance. Therefore, in order to reduce the workload and stress that can
cause human errors, it is highly recommended to carefully examine the impact of new flight
procedures on pilot workload and stress before they are implemented.
Page 5
iv
ACKNOWLEDGMENTS
I would like to express my appreciation to my dissertation committee chair, Dr. Gene
Lee, and committee members, Dr. Ahmad Elshennawy, Dr. Pamela McCauley-Bush, and Dr.
Jongwook Kim for their support, guidance, and assistance. I am sincerely grateful for Dr.
Gene Lee‟s encouragement and motivation. His guidance ultimately changed my way of
thinking. I also wish to express my deepest thanks to the staff members of Embry-Riddle
Aeronautical University for their support and high regard for doing an experiment.
I would also like to thank my families, especially my wife, Hyunsuk Park, for her
entire support and prayer on this long endeavor. Without their support, patience, and
understanding, none of this would have been possible.
Page 6
v
TABLE OF CONTENTS
LIST OF FIGURES ................................................................................................................. vii
LIST OF TABLES ................................................................................................................. viii
LIST OF ACRONYMS ............................................................................................................ ix
CHAPTER ONE: INTRODUCTION ........................................................................................ 1
1.1 Background ...................................................................................................................... 1
1.2 Objectives of the study..................................................................................................... 6
CHAPTER TWO: LITERATURE REVIEW ............................................................................ 8
2.1 Human error and accidents .............................................................................................. 8
2.2 Workload and performance ............................................................................................ 11
2.2.1 Measurements of workload ..................................................................................... 14
2.2.1.1 Psycho-physiological measurements ............................................................... 14
2.2.2.2 Subjective measurements ................................................................................. 15
2.2.2.3 Performance measurements ............................................................................. 17
2.3 Stress and performance .................................................................................................. 18
2.3.1 Measurements of stress ........................................................................................... 20
2.4 Three factors of pilot workload ...................................................................................... 22
2.4.1 Levels of experience ............................................................................................... 23
2.4.2 Levels of gliding angle ............................................................................................ 24
2.4.3 Types of approach area ........................................................................................... 26
2.5 Flight simulation experiment ......................................................................................... 29
CHAPTER THREE: METHODOLOGY ................................................................................ 30
3.1 Experimental design....................................................................................................... 30
3.1.1 Statistical model ...................................................................................................... 30
3.2 Protocol .......................................................................................................................... 31
3.2.1 Experimental set-up ................................................................................................ 31
3.2.2 Subjects ................................................................................................................... 33
3.2.3 Tasks ....................................................................................................................... 35
3.2.4 Procedure ................................................................................................................ 36
3.3 Data collection and processing ...................................................................................... 37
3.3.1 Heart rate variability ............................................................................................... 37
3.3.2 NASA-TLX ............................................................................................................. 39
3.3.3 Flight performances ................................................................................................ 40
3.4 Hypotheses ..................................................................................................................... 41
Page 7
vi
CHAPTER FOUR: RESULTS ................................................................................................ 43
4.1 Types of Approach Area ................................................................................................ 44
4.1.1 Hypotheses test for the AA effect ........................................................................... 44
4.1.2 Graphical results related in AA ............................................................................... 47
4.2 Levels of Gliding Angle ................................................................................................. 54
4.2.1 Hypotheses test for the GA effect ........................................................................... 54
4.2.2 Graphical results related in GA ............................................................................... 56
4.3 Levels of Flight Experience ........................................................................................... 62
4.3.1 Hypotheses test for the FE effect ............................................................................ 62
4.3.2 Graphical results related in FE ................................................................................ 64
CHAPTER FIVE: DISCUSSION ............................................................................................ 68
5.1 Types of Approach Area ................................................................................................ 69
5.2 Levels of Gliding Angle ................................................................................................. 72
5.3 Levels of Fight Experience ............................................................................................ 75
CHAPTER SIX: COCLUSIONS ............................................................................................. 77
6.1 Conclusions .................................................................................................................... 77
6.2 Findings, Limitations, and Suggested further research .................................................. 79
APPENDIX A: UCF CONSENT FORM ................................................................................ 81
APPENDIX B: APPROVAL OF HUMAN RESEARCH ....................................................... 83
APPENDIX C: SUBJECTIVE QUESTIONNAIRE (NASA-TLX) ........................................ 84
APPENDIX D: COLLECTED DATA .................................................................................... 88
APPENDIX E: STATISTICAL TEST RESULTS .................................................................. 91
REFERENCES ........................................................................................................................ 95
Page 8
vii
LIST OF FIGURES
Figure 1. Broad Causes of US General Aviation Accident ....................................................... 4
Figure 2. The Accident Rate of Flight Phase in US General aviation ....................................... 5
Figure 3. FRASCA MENTOR ATD Simulator ....................................................................... 32
Figure 4. S801i Heart Rate Monitor ........................................................................................ 33
Figure 5. R-R Interval on ECG Wave ...................................................................................... 38
Figure 6. Mean LP Score of AA within GA ............................................................................ 50
Figure 7. Mean AGPT Ratio of AA within GA ....................................................................... 50
Figure 8. Mean NASA-TLX MD Score of AA within GA ..................................................... 53
Figure 9. Mean HRV-LF Ratio of AA within GA ................................................................... 53
Figure 10. Mean LP Score of GA within AA .......................................................................... 59
Figure 11. Mean AGPT Ratio of GA within AA ..................................................................... 59
Figure 12. Mean NASA-TLX MD Score of GA within AA ................................................... 61
Figure 13. Mean HRV-LF Ratio of GA within AA ................................................................. 61
Figure 14. Mean LP Score between SPG and IPG .................................................................. 66
Figure 15. Mean AGPT Ratio between SPG and IPG ............................................................. 66
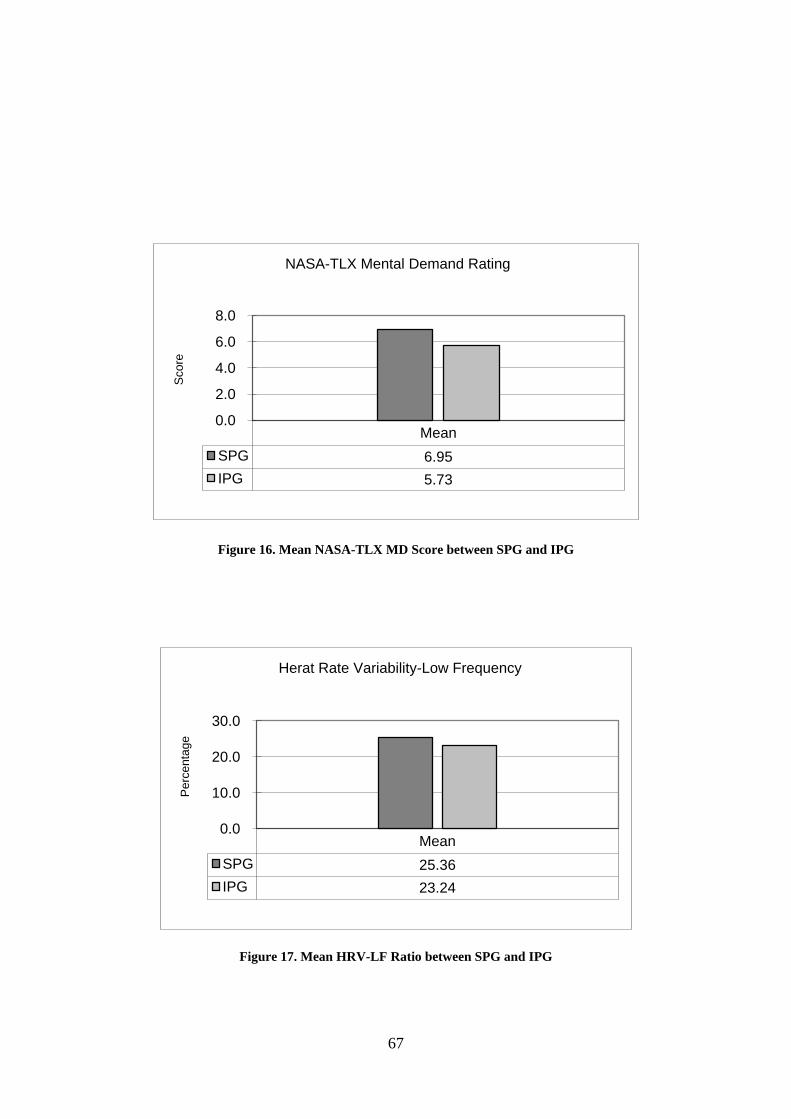
Figure 16. Mean NASA-TLX MD Score between SPG and IPG ............................................ 67
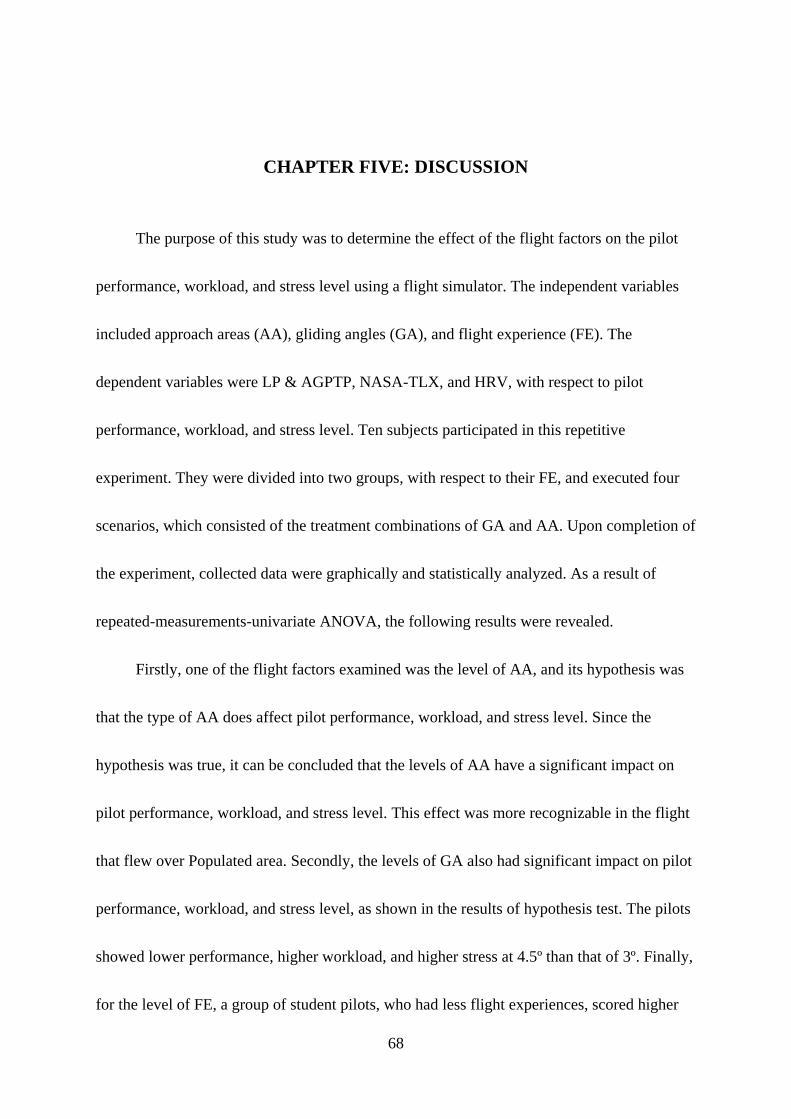
Figure 17. Mean HRV-LF Ratio between SPG and IPG ......................................................... 67
Page 9
viii
LIST OF TABLES
Table 1. Matrix for grouping the subjects ................................................................................ 34
Table 2. Conversion table ........................................................................................................ 41
Table 3. Mean of LP, AGPT, TLX, and HRV between AA .................................................... 47
Table 4. Mean of LP, AGPT, TLX, and HRV between GA .................................................... 57
Table 5. Mean of LP, AGPT, TLX, and HRV between FE ..................................................... 65
Page 10
ix
LIST OF ACRONYMS
AA Approach Area
AGPTP Above Glide Path Tracking Performance
AF Air Force
ATC Air Traffic Controller
ATSB Australian Transportation Safety Bureau
BHI Black Hole Illusion
Bpm Beat per minute
EDA Electrodermal activity
EEG Electroencephalography
EOG Electrooculograph
FAA Federal Aviation Administration
FE Flight Experience
GPO Glide Path Over estimate
GA Gliding Angle
GP Glide Path
HF High Frequency
HFACS Human Factor Analysis Classification System
HR Heart Rate
HRV Heart Rate Variability
Hz Hertz
ICAO International Civil Aviation Organization
IFR Instrument Flight Rule
IHN Instructor pilot and 4.5 degree GA and Non-Populated area
IHP Instructor pilot and 4.5 degree GA and Populated area
ILN Instructor pilot and 3 degree GA and Non-Populated area
ILP Instructor pilot and 3 degree GA and Populated area
ILS Instrument Landing System
IMC Instrument Meteorological Condition
IP(G) Instructor Pilot (Group)
L/D Landing
LF Low Frequency
Mph Mile per hour
Page 11
x
NASA-TLX National Aeronautics and Space Administration – Task Load Index
NTSB National Transportation Safety Board
RWY Runway
SLN Student pilot and 3 degree GA and Non-Populated area
SLP Student pilot and 3 degree GA and Populated area
SHN Student pilot and 4.5 degree GA and Non-Populated area
SHP Student pilot and 4.5 degree GA and Populated area
SP(G) Student Pilot (Group)
T/O Take-Off
VFR Visual Flight Rule
VMC Visual Meteorological Condition
VLF Very Low Frequency
Page 12
1
CHAPTER ONE: INTRODUCTION
1.1 Background
Because of a rapid development of aviation technology in both civil and military
purposes, the operation of an aircraft has also increased dramatically in quantity as well as
quality. In 2009, the total scheduled traffic carried by the airlines of the 190 Member States
of International Civil Aviation Organization (ICAO) amounted for approximately 2,280
million passengers and 38 million tons of freight (ICAO, 2010). ICAO forecasted that world
air traffic volume would increase at an annual rate of 4.4% over the year 2002-2015 (ICAO,
2004). In accordance with it, the airport facilities (e.g. runway, passenger terminal, etc.) have
been expanded toward city area to accommodate this increased air traffic volume. This, in
chain reaction, caused development of the cities near the airport, which was then surrounded
by many metropolitan cities. This occurrence gave negative impact on both surrounding
neighborhoods and pilots for the stress caused by noise and safety concerns, respectively.
This rapid growth of air traffic caused enormous noise problems on the neighborhoods.
To solve this problem, a few noise-reduced approach procedures (e.g. Lower Drag Low
Power (LDLP), Segmented Continuous Descent Approach (SCDA), etc.) were introduced
(Elmenhorst et al., 2009). Moreover, several airports and aircraft manufacture tested Steep
Page 13
2
Angle Approach (Airbus, 2006; Rob, 2001) to see if it had any impacts on the noise level.
Another problem caused by the intense growth of air traffic was the air traffic congestion. So,
the aviation society introduced the Small Aircraft Transportation System (SATS) to alleviate
this problem (NASA, 2004). These procedures require a steeper gliding angle than normal,
which is usually 2.5 to 3 degrees (°). This steeper gliding angle, however, is known to
increase pilot workload and safety concerns at Final Approach to L/D phase of flight
(Boehm-Davis et al., 2007; Roscoe, 1975).
Stress in a general term refers to some undesirable condition, circumstance, task, or
other factors that impinge upon an individual (McCormick & Sanders, 1993). Some possible
sources of stresses include heavy work, immobilization, extreme temperature conditions,
noise, sleep loss, danger, information overload, boredom, loneliness, and financial insecurity.
These constraints can induce a significant mental (cognitive) workload (Hankins & Wilson,
1998) defined as the ratio between task demands and the capacity of the operator (Veltman &
Gaillard, 1996). In general, the pilots have many tasks to do during a flight in a cockpit. For
example, they should supervise the status of the aircraft system and anticipate future tasks,
including their primary tasks such as flying, navigation, and communications. Thus, aircraft
piloting requires a high level of the cognitive activity associated with various stress factors
such as time constraints, safety threats, and environmental factors. Mental workload can be
Page 14
3
related to the following consequences: 1) physiological states of stress and effort 2) the
subjective experiences of stress, mental effort, and time pressure 3) the objective measures of
performance levels and 4) breakdowns in performance (Schvaneveldt et al., 1998). Lysaght et
al. (1989) described that an increase in workload would lead to decreases in performance.
Therefore, acceptable performance can be expected at reasonable levels of workload. A
reduction of mental and physical workload on pilots is the top priority in the aviation
community since many accidents happen due to pilot error.
National Transport Safety Board (NTSB) accident database showed that human errors
were cited as a broad cause or factor in 88 to 91 % of all US general aviation accidents
(NTSB, 1998~2005). As it can be seen in Figure 1 below, in 2005, the factors that caused
accidents were human factors (91 %), environmental factors (39 %), and aircraft factors
(25 %). Here, the cumulative percentage exceeds 100 %, which means more than one cause
was involved in a single accident. The 91 % of the human factors are made of 81 % in pilots,
9 % in on and off board personnel, and 1 % in personnel of organization.
Page 15
4
Figure 1. Broad Causes of US General Aviation Accident
It is well known that the Final Approach to L/D phase of flight is the most work
loaded phase and is a critical phase for the severe accidents. Although it is a very short time
period compared to a total flight time, Final Approach to L/D phase of flight is nearly 50 %
of all accidents, according to the report by Nagel (1988). From the NTSB accident reports in
1998-2005, Figure 2 shows that 55 % of total accidents happened at Final Approach to L/D
phase, 23 % at “T/O & Climb” phase, 18 % at “En-route Fight” phase, and 4 % at “Ground
Operation” phase. Accidents by human errors as well as accidents at Final Approach to L/D
phase of flight are the main factors of previous accidents, as it is shown in Figures 1 and 2.
Page 16
5
Figure 2. The Accident Rate of Flight Phase in US General aviation
During the flight, pilots in the cockpit compete for many important tasks (e.g.
communicating with air traffic controllers, supervising instruments, and looking outside of
cockpit, etc.) to make it a safe flight at all times. They continuously interpret information to
make right decisions. Particularly, the pilots become busier with piloting at Final Approach to
L/D phase (e.g. setting its flap and landing gear, maintaining airspeed, tracking glide path,
etc.). In addition, both internal and external factors (e.g. mechanical failure, severe weather,
etc.) are very crucial in aircraft piloting at Final Approach to L/D phase. This is because the
aircraft is under low altitude and low air speed. Therefore, pilot workload is affected by
Page 17
6
various factors during the flight and it is frequently blamed for the cause of accidents. If such
potential causes of pilot workload are removed or reduced, the aviation safety will be
improved.
In summary, various landing procedures (e.g. LDLP, SCDA, SATS, Steep Angle
Approach, etc.) at Final Approach to L/D phase have been studied to solve the key issues
regarding noise reduction as well as human health. However, there is still lack of
achievement on either the technical flight safety or the capability of a human operator for the
sophisticated landing procedures (Elmenhorst et al., 2009). As science and technology has
been developed, a machine or system is expected to perform 99 % of its own function
(McCormick & Sanders, 1993), while human beings make errors that could implicate in
various accidents as well as accidents in the aviation field. Therefore, newly introduced
procedures should strongly focus on reducing human errors for improving the safety.
1.2 Objectives of the study
So far, the aviation society has been spending and investing their efforts and money to
fix such problems explained in the introduction section. They also have developed a new
approach procedure such as the Steep Angle approach, which has more than 3º of a gliding
angle, in order to reduce the noise created by aircrafts. Current approach procedures have a
Page 18
7
common gliding angle of 3º. They have mainly focused on testing the aircraft capability than
the pilot workload and stress. Thus, there are only few researches that report on how the steep
angle over 3º affects pilot workload at Final Approach to L/D phase, which is known as the
most dangerous flight segment. Therefore, the assessment of pilot workload for executing
new procedures at Final Approach to L/D phase is an important aspect to improve the
aviation safety and human health under various environmental factors (e.g. weather, traffic
volume in approach area, type of approach area, etc.).
In this study, how pilot workload is affected by various flight factors while flying at
Final Approach to L/D phase through simulated scenarios by a flight simulator is examined.
This would provide a better understanding of the relationship between pilot workload and an
accident. The objectives of this study are as follows;
1) To compare the level of pilot performance, workload, and stress experienced by
both experienced pilots and less-experienced pilots.
2) To identify and describe pilot performance, workload, and stress with two different
levels of a gliding angle (e.g. 3º and 4.5°).
3) To investigate whether environments of the final approach course (e.g. Non-
Populated & Populated area) has an impact on pilot performance, workload, and
stress or not.
Page 19
8
CHAPTER TWO: LITERATURE REVIEW
There are various factors that cause unsafe behavior or accidents in a work
environment. Generally, the majority of the worst performance and accidents that still occur
are attributed to human errors. So, it is important to better understand the various roles of the
human operators involved in a system or task to further enhance performance and safety. In
this research, literature that is relevant to the topic of analyzing human error, workload, stress,
and their relationship with performance and accidents is reviewed. In addition, several
methodological approaches are also introduced to measure performance, workload, and stress
of human work.
2.1 Human error and accidents
Numerous definitions have been proposed for human error. From Heinrich‟s (Heinrich
et al., 1931) axioms of the industrial safety to Reason‟s (1990) “Swiss Cheese” model of
human error, a sequential theory of accident causation has been consistently agreed by some
researchers in the field of human error (Wiegmann & Shappell, 2001). According to Reason
(1990), it would be taken as a generic term to encompass all those occasions in which a
planned sequence of mental or physical activities failed to achieve its intended outcome.
Page 20
9
McCormick and Sanders (1993) also defined that human error was an inappropriate or
undesirable human decision or behavior that reduced, or had the potential for reducing,
effectiveness, safety, or system performance. In the past, human error has been used to
describe operator error. Recently, the broader perspective of human error has considered
other humans (e.g. managers, system designers, maintainers, and coworkers) as a contributor
to an accident. Petersen (1996) stated that human error is the basic cause behind all accidents.
Over the years, numerous error classification schemes have been developed to give
useful insight into the ways for preventing human error. Senders and Moray (1991) suggested
a useful classification scheme of human error. They suggested four types of taxonomy; 1)
phenomenological taxonomy (e.g. omissions, substitutions), 2) internal processes taxonomy
(e.g. capture errors, work overload, and decision errors), 3) neuropsychological mechanisms
taxonomy (e.g. forgetting, stress, attention), and 4) external processes taxonomy (e.g. poor
equipment design). It has been demonstrated that workload is one of the important factors
that cause human errors (Kantowitz & Sorkin, 1983).
Generally, the human being is most reliable under adequate levels of workload that do
not change suddenly and unpredictably. When workload is excessive, errors arise from the
inability of the human operators to cope with high information rates imposed by the
environment (Kantowitz & Casper, 1988). For example, human error has been cited as a
Page 21
10
cause or contributing factor on disasters and accidents in industries such as nuclear power
(e.g. Three Mile Island accident), aviation (e.g. pilot error), space exploration (e.g., Space
Shuttle Challenger Disaster), and medicine (e.g. medical error) (Reason,1990; Woods, 1990).
Therefore, human error prevention can be the greatest contributor to improve productivity,
quality, and safety.
Many aviation accidents do not happen with a single event or a single mistake. They
rather result from a chain of such events and mistakes culminating with the errors of aircrews,
especially the pilots. Pilot error, called cockpit error in the aviation field, is a term used to
describe the cause of an accident involving an aircraft where the pilot is considered to be
principally or partially responsible. It can be defined as a mistake, oversight, or lapse in
judgment by an aircraft operator during the flight.
A closer examination of the current aviation accident records revealed that between 60 %
and 80 % of all aviation accidents in both military and civil areas are partially due to human
error (Wiegmann & Shappell, 1997; O‟Hare et al., 1994; Yacavone, 1993). It is considered
that multiple perspectives on an aviation accident is required to reduce those accidents. For
quantitative and qualitative improvements in aviation safety, we should primarily focus on
reducing human errors by the pilots and others (mechanics, supervisors, air traffic controllers)
who are involved with the flight safety.
Page 22
11
2.2 Workload and performance
Workload is defined as the amount of cognitive or attention resources being expended
at any given point in time based on the information processing theory. It is the difference
between the information that needs to be processed to make decisions and the capacity of the
individual to meet those demands (Sweller et al., 1998). Besides, workload is widely used for
various measurement techniques to evaluate the effectiveness of the equipment and work
systems by researchers of human factors.
Many researchers have reported that mental or physical workload is an important factor
in determining human performance in complex systems. Thus, it has been recognized that
optimizing the allocation of workload to individuals can reduce human errors and lead to
increase in productivity (Xie & Salvendy, 2000; Moray, 1988; Gopher & Donchin, 1986).
Some of the factors that can impact workload include: 1) skill of the operator 2) training 3)
operating procedures 4) operating conditions 5) staffing levels and competence 6) task
allocations 7) job task demands 8) organizational expectations 9) task complexity, and 10)
work pace (Cuevas, 2003; Kantowitz, 1987; Bainbridge, 1974).
According to Gawron et al. (1989), workload was commonly used as two different
meanings on the flight task. One meaning depended on work done by pilots in the aircraft.
This indicated that workload varied with the difficulty of the task and the number of tasks
Page 23
12
being performed. For example, Watson et al. (1996) reported that task difficulty significantly
influenced on pilot workload. Sarno and Wickens (1995) state that the main contributor to
pilot workload is task loading. This is the number of tasks required to be performed at a time.
Moray et al. (1991) showed that there were some limits to performance in the context of
scheduling multiple tasks as well. So, the requirement to perform multiple tasks is a major
contributing factor on workload as well as performance levels (Kantowitz, 1987; Wickens &
Yeh, 1982). The other meaning depended on the environmental conditions or circumstances
under the operation to fly. This suggested that workload was influenced by environmental
factors, under which the tasks were performed
Workload for the pilot varies due to diverse features of flight. Different phases of flight
present different workloads for the pilot. For example, Wilson and Hankins (1994) found that
Instrument Flight Rule (IFR) flight created significantly higher workload than Visual Flight
Rule (VFR) flight. In another study of Hankins and Wilson (1998), they reported that pilots
showed higher workload for Take-Off (T/O), Landing (L/D), and IFR flight phase than
Cruise and VFR flight phase. In addition, the increase on the pilot workload during the most
information-loaded flight phase such as T/O and L/D has been reported by Ylonen et al.
(1997), Sekiguchi et al. (1978), and Opmeer and Krol (1973). Workload is modified further
by factors not under the control of the crew, such as weather, visibility, traffic density, and
Page 24
13
communication requirements, etc. (Kantowitz & Casper, 1988).
The relationship between workload and performance as described by Lysaght et al.
(1989) showed that high workload results in poor performance. In detail, Searle et al. (1999)
reported that the high work demand condition revealed significantly decreased accuracy in
comparison to the low work demand condition and the partial replication. This has been
supported by many studies in a variety of experimental settings (Cox-Fuenzalida, 2007;
Goldberg & Stewart, 1980; Cumming & Croft, 1973). However, Wickens and Holland (2000)
stated that increases in workload do not necessarily have negative consequences. For example,
Schvaneveldt (1969) demonstrated that performance of relatively simple tasks can be
degraded when coupled with complex, independent tasks. In general, however, over
workload is related to poor performance (Lysaght et al., 1989).
So far, many assessments on workload have been evaluated from performance,
subjective impressions of workload, and physiological indicators of work and stress. Based
on data obtained from these assessments, it turned out that various factors (e.g. ambiguity,
uncertainty, time pressure, level and place of control, and task complexity) can have an
impact on or can be related to work performance in military, medical, and university fields
(Xiao et al., 1996, Kanki, 1996; Urban et al., 1996; Serfaty et al., 1993).
Page 25
14
2.2.1 Measurements of workload
Levels of cognitive demands can lead to errors that cause catastrophic accidents
(Wilson, 2002a). Therefore, it is necessary to design systems and flight procedures that can
reduce cognitive demands in order to not exceed the capacities of the human operators. The
complexity of flying requires the pilots to use numerous cognitive processes. So, more than
one measurement is required to determine the pilot workload. One measurement cannot be
expected to give a full insight into the multifaceted nature of piloting. The various aspects of
workload have led to distinct means for assessing pilot workload, including psycho-
physiological criteria (e.g. the heart rate, the heart rate variability, the evocation of potentials,
etc.), performance criteria (e.g. quantity and quality of performance), and subjective criteria
(such as rating of level of effort), reported by Schvaneveldt et al. (1998). Details of three
aspects are discussed below.
2.2.1.1 Psycho-physiological measurements
Psycho-physiological measurements used for many years in aviation provide objective
data on the cognitive demands of flying (Wilson, 2002a). As the recording equipment has
become considerably reliable, these measurements have facilitated user acceptance and
increased the potential to collect in-flight data (Wilson, 2001). These measurements include
Page 26
15
Heart Rate Variability (HRV; Hilburn et al., 1995; Sauvet et al., 2009), Heart Rate (HR;
Roscoe, 1975; Lindholm & Cheatham, 1983; Wilson, 1993; Veltman, 2002), Electrodermal
activity (EDA; Steptoe et al., 1997), Eye Blink (Veltman et al, 1996; Wilson, 1993; Stern et
al., 1984), brain activity (Dussault et al., 2004; Gundel et al., 1997), and EEG (Sterman et
al.,1994).
2.2.2.2 Subjective measurements
A number of different approaches and techniques for measuring subjective workload
have been introduced. For example, Hill et al. (1992) suggested four measurements that were
mostly popular or prospective for application: 1) National Aeronautics and Space
Administration-Task Load Index (NASA-TLX, Hart & Staveland, 1988) 2) Modified
Cooper-Harper Scale (MCH, Cooper & Harper, 1969) 3) the Overall Workload (OW,
Vidulich & Tsang, 1987), and 4) Subjective Workload Assessment Technique (SWAT, Reid
et al., 1981).
Among these measurements, in this study, the paper-and-pencil-based NASA-Task
Load Index (TLX) method was used to measure workload. It was developed through vast
laboratory research by Hart & Staveland in 1988 and its sensitivity and validity has been
reported. According to Hill et al. (1992), the NASA-TLX is consistently superior when
Page 27
16
considering sensitivity, as measured by factor validity and operator acceptance by comparing
those four measures mentioned above. This method has been extensively tested and
frequently used in human performance studies (Jorgensen et al., 1999) and pilot workload in
real (Shively et al., 1987) and simulated flight tasks (Corwin et al., 1989; Tsang & Johnson,
1989; Battiste & Bortolussi, 1988; Vidulich & Bortolussi, 1988; Nataupsky & Abbott, 1987)
for a long time. In particular, Moroney et al. (1995) stated that it is considered to be a firm
method of measuring subjective workload.
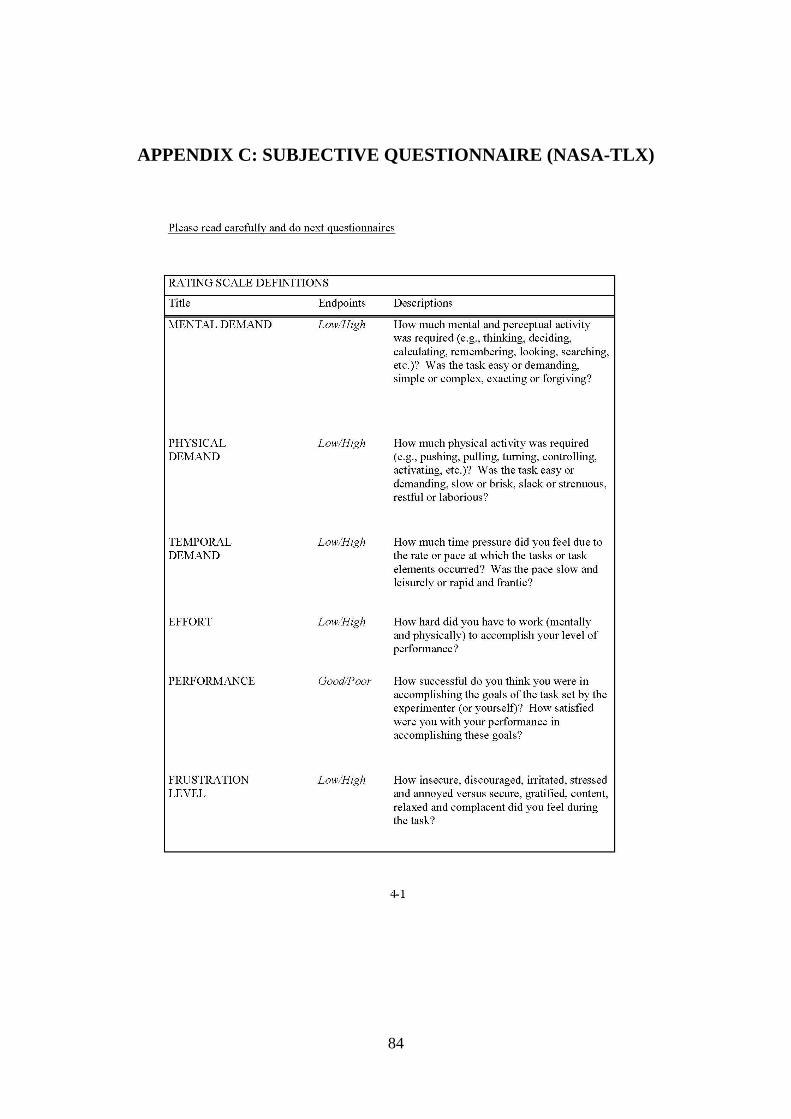
The NASA-TLX is a multidimensional rating technique that requires operators to
assign the ratio on each of six sub-dimensions of subjective workload: Mental Demand (MD),
Physical Demand (PD), Temporal Demand (TD), Performance, Effort, and Frustration. The
NASA-TLX method consists of two parts: 1) ratings and 2) weightings. For ratings,
participants score on six individual 21-point bipolar subscales. For weightings, participants
select the one between each pair which is considered to provide the most significant source of
workload in the tasks. There are 15 pairwise comparisons composed of 6 sub-dimensions,
already mentioned above. The value derived from this paired-comparison procedure is used
to weight the rating associated with each sub-dimension. The weighted values are then
combined to provide an overall workload index.
Page 28
17
2.2.2.3 Performance measurements
Performance measurements monitor an operator and system performance during a task
and seek to objectively determine the level of successful completion of the task. This
category can be divided into primary and secondary task measurements. The primary task
measurement is used to measure workload under consideration, whereas the secondary task
measurements are typically used to determine the amount of spare cognitive capacity while
the operator is performing the primary task. The primary task measurement provides a direct
indication of performance on the task of interest and the secondary task measurements
provide a useful index of spare cognitive capacity (e.g., the ability to respond to emergencies
or unforeseen events).
The measurements obtained from the primary and secondary tasks are probably an
obvious index of mental workload assessment (Meshkati et al., 1995). Both reaction time and
accuracy are used as the most appropriate ways to measure particular performance by the
nature of the task (Farmer et al., 2000; Fitts, 1966). Flight performance data (e.g. landing
performance, glide path tracking performance, reaction time from the certain events, etc.)
from real flights can help us to understand the usual work demands from the pilots.
Page 29
18
2.3 Stress and performance
Stress is a dynamic phenomenon caused by the quality and quantity of transactions
between human and environmental demands (Hancock & Warm, 1989; Lazarus & Folkman,
1984). Generally, it has been described as an incompatibility between the individual and his
or her work environment (Humphrey, 1998). For example, evidence from space research and
environments showed that negative responses to stress largely depended on how each
individual evaluated their capacity to manage the output imposed by the stressor (Kanki,
1996; Orasanu & Backer, 1996).
As a part of the workload experienced, stress is typically associated with excessive
high workload levels. Kantowitz (1987) emphasized the complex and multifaceted natures of
workload defined as a subjective experience caused by various factors such as motivation,
ability, expectations, training, timing, stress, fatigue, and circumstances. Brotheridge (2001)
concluded that emotional exhaustion, which is a type of stress, was significantly related to
workload in a study of Canadian government employees. The stress is directly proportional to
the levels of workload. Tyler and Cushway (1995) established a significant and positive link
between workload and stress levels in nurses.
To have a better understanding of the relationship between workload and stress
including various factors, it is important for researchers to determine how to get rid of
Page 30
19
negative effects of stressors on individuals across organizations. Kirmeyer and Dougherty
(1988) found that the perceived workload of dispatch operators was positively associated
with a measurement of tension-anxiety. Searle et al. (2001) showed that the level of stress for
the high workload condition was significantly higher than that for the low workload condition.
In some cases, Cox-Fuenzalida et al. (2004) asserted that some changes in workload
conditions might serve as a stimulus that induced stress. This implies that the shift of
workload from low to high would raise the level of stress perceived by an individual.
The relationship between stress and performance has been verified in many
experiments and has been explained by the Yerkes-Dodson Law: the relationship between
stress and performance has an inverted U-shape (Yerkes & Dodson, 1908; Ahmadi & Alireza,
2007). The law dictates that performance increases with physiological or mental stress, but
only up to a point. When levels of stress become too high, performance decreases. Many
researchers have supported the Yerkes-Dodson Law of the relationship between stress and
performance (Sanders, 1983; Srivastava & Krishna, 1991). However, this law has become the
subject of criticism. Some psychologists have suggested a linear positive relationship
(Meglino, 1977; Hatton et al. 1995) and a negative linear relationship (Jamal, 1985; Vroom,
1964) between stress and performance. Despite the empirical evidence supporting these
Page 31
20
alternative theories, the inverted-U theory is the most used explanation for the relationship
between stress and performance (Muse et al., 2003).
For military aviator, many surveys were carried out to identify the relationships
between stress and performance. Ahmadi and Alireza (2007) mentioned life stress (both
positive and negative) is an important factor which may have some effects on performance.
Katz (1997) reported that job satisfaction and flight performance were significantly decreased
in relation to personal life events and family problems that cause stress in life. Henn (1996)
found a few significant stressors that decrease the performance ability of aviators such as
irregular work hours, fatigue, training structure, labor-management confrontations, and time
management. Moreover, Carlisle (2001) mentioned that a significant level of stress could
diminish the ability of the experienced pilots to fly safely. It is reported by Edens (1992) that
the psychological stress level has significant relationship with the pilot error that frequently
leads to aviation accidents. Therefore, stress in pilots has a greater tendency to cause
dangerous situation than stress in other people.
2.3.1 Measurements of stress
Stress is measured by physiological measures such as HR, EMG, HRV and eye pupil
response. Cuevas (2003) mentioned that traditional approaches to define stress have followed
Page 32
21
a physiological stimulus response model that either focuses on the stimuli in the environment
(noise, motion, or workload) or emphasizes the physiological response (such as heart rate or
anxiety) of the individual to the putative stressor. In addition, there are a number of well
validated rating scales for different aspects of stress. Examples include Rated Perceived
Exertion (Borg, 1982), Body Part Discomfort (Corlett & Bishop, 1976), and modified
Cooper-Harper scale (Wierwille & Casali, 1983) as qualitative measurements.
In this study, Heart Rate Variability (HRV) is used to evaluate stress. A HRV signal
contains well-defined rhythms, which have been successfully shown to contain psycho-
physiological information (Akselrod et al., 1981; Sayers, 1973; Penaz et al., 1968). It is used
to measure sympathetic activation (Kamath & Fallen, 1993; Malliani et al., 1991; Pagani et
al., 1989) and especially stress (Paritala, 2009; Seong et al, 2004; Fauvel et al., 2000). Under
the stress, an increase of activity in the sympathetic nervous system, and a decrease of
activity of the parasympathetic nervous system were observed.
There are three different frequency bands (VLF, LF, and HF) in frequency domain
evaluation methods through spectral analysis. Firstly, long period rhythms contained in the
Very Low- Frequency (VLF; 0.00-0.04 Hz) band account for the long-term regulations
mechanisms, probably related to thermoregulation and other humoral factors (Kitney &
Rompelman, 1977). Secondly, in the Low Frequency (LF; 0.03-0.15 Hz) band, there is a
Page 33
22
rhythm, generally centered on around 0.1 Hz. Kamath & Fallen (1993) reported an increase
in the LF power for the sympathetic activation. Sympathetic activation includes rest-tilt
maneuver, mental stress, hemorrhage, coronary occlusion, and etc. Thirdly, it is possible to
identify a high-frequency component in the HRV signal, generally in a wide range between
0.18 and 0.4 Hz. Such a rhythm, synchronous with the respiration rate, is generally accepted
as an indicator of parasympathetic activation (Cerutti et al., 1995; Pagani et al., 1986). In this
study, LF band ratio was obtained and evaluated to understand the impact of flight factors on
pilot stress.
2.4 Three factors of pilot workload
Workload contains multifaceted and complicated terms controlled by various factors,
which include: 1) the skill of the operator 2) training 3) operating procedures 4) operating
conditions 5) staffing levels and competence 6) task allocations 7) job task demands 8)
organizational expectations 9) task complexity, and 10) work pace (Cuevas, 2003; Kantowitz,
1987). For this research, three factors were considered: 1) levels of experience as a skill of
the operator factor 2) levels of a gliding angle as an operating procedure, and 3) different
approach areas as an operating condition.
Page 34
23
2.4.1 Levels of experience
In general, workload is affected by levels of an operating skill. A novice is called a
less-skilled or a less-experienced performer and an expert is called a skilled or a much
experienced performer. A novice and an expert can experience different workload even
though they perform the same tasks. Many studies were conducted to evaluate the
relationship between pilot workload and the levels of experience in the aviation field. The
less-experienced pilots showed higher mental workload than the experienced pilots in T/O
and Climb phase (Yao et al. 2008) and also in Final Approach to L/D phase (Dussault et al.,
2004). Stein (1984) found significant differences in the flight workload ratings between
expert pilots and novice pilots when they were at an air transport mission. In some cases,
either novice pilots (Kakimoto et al., 1988) or the pilots who are responsible for the mission
(Hart & Hauser, 1987; Roman, 1965) had higher workloads than those pilots who had lots of
experiences or less responsibility.
In addition, some research verified the effect of the experience level on performance,
which is related to the level of work experience. Mostly, the results reported that obvious
differences existed between novices and experts in the proficiency of performance (Stokes et
al., 1997; Wiggins & O‟Hare, 1995; Fisk et al., 1992; Livingston & Borko, 1989). Because
workload affects pilot performance, such flight workload issues are relevant to aircraft
Page 35
24
certification, aviation safety, cockpit design, and tactical effectiveness. The workload of
pilots from flying a high-performance aircraft has become a major problem in aviation
(Roscoe, 1993). As a result, the measurement of workload of the pilots has been widely used
for the evaluation of aircraft designs, mission analysis, and the assessment of pilot
performance during the flight operation (Dahlstrom & Nahlinder, 2006; Dussault et al., 2005).
2.4.2 Levels of gliding angle
It is widely accepted that both T/O to Climb and Final Approach to L/D phases are one
of the most difficult phases during the entire flight, while the Cruise Flight phase is known as
the easiest one. At Final Approach to L/D phase, the pilots continuously fly down in
accordance with the 3º glide path. The increase in gliding angle into 4.5º decreases the
distance covered in Final Approach to L/D phase. This decrease in distance would put time
pressure on the pilots. Time pressure can increase or decrease the pilot‟s performance and
efficiency in different conditions. It is generally agreed, however, that the relationship
between time pressure and performance is not linear but curvilinear. For example, Andrew
and Farris (1972) found that the productivity of NASA scientists and engineers increased up
to a certain point as time pressure increased. After that, however, work performance declined
Page 36
25
as time pressure became even more intense than normal condition at the peak performance
level.
A few studies were conducted for evaluating Steep Approach in terms of workload.
Roscoe (1975) found that increase in heart rate responded to increasing approach angle, such
as 104 (SD; 0.68) beat-per-minute (bpm) for 3º, 108 (SD; 1.52) bpm for 6°, and 115 (SD; 2.2)
bpm for 9°. This result corresponded very closely with the pilot‟s subjective opinion of the
cockpit workload. Boehm-Davis et al. (2007) found that approaches with 5° produced safe
landings with minimal deviations from normal descent (3º) control configuration and were
rated as having a moderate level of workload. Both 6° and 7° gliding angles produced safe
landings but high workload ratings. They concluded that both 6° and 7° angles might be
achievable in the event of an emergency although both angles might not be practical for
routine approaches due to high workload.
Commonly, the descent rate of a steeper approach angle is higher than that of a normal
approach angle. The ideal descent rate varies with different sources; 1) 500 feet-per-minute
(ft/min), which is recommended by the Aircraft Owners and Pilots Association, 2) 500 to 700
ft/min, which is recommended by the FAA, and 3) no more than 1,000 ft/min, which is
recommended by the Flight Safety Foundation (Boehm-Davis et al., 2007). According to
steep approach landing rules, the lowest value of a gliding angle is 4.5°. No upper limits on a
Page 37
26
gliding angle are given although 7.5° is normally considered as a maximum angle
(Transportation Canada, 2004).
2.4.3 Types of approach area
An aircraft always needs a wide, long, and open area (e.g. runway, grass field, highway,
etc.) to make a safe landing. In the past, almost all airports were built outside of cities.
However, as cities expanded, many airports got surrounded by metropolitan cities and
aircrafts fly over them to land at the airport. However, few research was conducted about the
effect of the simulated ground features (e.g. tree, building, antenna, etc) in Final Approach to
L/D area.
During the VFR flight, the aircrafts are controlled by the perceived orientation of the
ground terrain, which relies on a visual reference such as trees, buildings, etc. As a ground
theory, Calvert (1954) mentioned that the ground features gave some motivations to develop
an approach lighting system, which gives visual reference to the pilot. An absence of the
ground features can create the visual illusion that makes the pilots believe that the aircraft is
at a higher altitude than it actually is. For example, the pilot who does not recognize this
illusion can fly lower while landing over water, darkened areas, and featureless snow fields.
Some simulation studies have provided empirical support showing that pilots tended to
Page 38
27
overestimate gliding angles toward a schematic (i.e., impoverished) runway (Palmisano &
Gillam, 2005; Lewis & Mertens, 1979; Kraft, 1978; Mertens, 1978). They also found that
increasing true orientation of the ground features improved the subject‟s gliding path
judgment.
However, without any information on the instrument panel, the pilots cannot always
judge the exact height of a ground feature. They can over estimate or under estimate the
height of obstacles. A common factor in aircraft accidents is a failure to maintain an adequate
clearance from the objects or the surface. After examining the performance of helicopter
pilots during the hovering flight task, Johnson and Phatak (1989) found that the pilots
attempted to maintain an altitude by holding a fixed optical location on a ground; a strategy
that led to inappropriate altitude corrections in response to vehicle movements. As a result of
the study on pilots‟ altitude perception under the real situation to operate a helicopter, Ungs
and Sangal (1990) found that the pilots showed wide variation for each test. For example,
some achieved altitudes exceeding the target altitude by 100 % and the others flied below the
target altitude when ascending and descending. Specially, it appeared that more pilots tended
to underestimate their altitudes during descending even though altitude perception of the
pilots is important to fly safely during VFR flight. Since sometimes pilot judgment of height
Page 39
28
of obstacles is not right, many obstacles at Final Approach to L/D segment can affect pilot
performance negatively.
Therefore, ground features (e.g. buildings, trees, antennas, etc.) can change flight
environment, which can cause psycho-physiological stress on the pilots. The height of a
ground feature is limited by the ICAO, FAA, and local regulations for the pilots to ensure the
safe approach and landing. According to ICAO DOC 9137 and FAA Order 8260 3B (United
States Standard for Terminal Instrument Procedures, TERPS), the ratio is 50:1 (horizontal
distance to the height of ground features) from the end of the runway to 25,000 ft on the
ground horizontally at Final Approach to L/D segment. In other words, the 20 ft high ground
feature can be built 1000ft away from the location at the end of the runway.
In addition, many aircraft accidents were reported because of turbulence and wind
shear at Final Approach to L/D phase. An airflow changed by the ground features can cause
dangerous situation for an aircraft in a low altitude and a low speed at Final Approach to L/D
phase because aircraft movement is easily affected by the wind (speed and direction). Change
of the wind patterns caused by ground obstacles can cause accidents, especially for those
aircraft with low power and low speed. Therefore, accidents can easily happen at Final
Approach to L/D phase.
Page 40
29
2.5 Flight simulation experiment
Realistic aircraft simulation has become available to many researchers. This makes it
possible to investigate pilot workload under conditions of no actual physical risks. Generally
speaking, simulations have unknown factors: most of the pilots viewed simulations as too far
from the actual aircraft to be of any tangible or real value. However, many people in the
research fields believe in the potential role of simulation in flight training and maintenance of
flight proficiency. Lindholm and Cheatham (1983) stated that extremely dangerous
maneuvers can be investigated without any risks. Also recording instrumentation to get data
is very simple compared to that of the actual flight. Moreover, Magnusson (2002) reported
that simulation and real flight had a close relationship in the field of psycho-physiological
reaction and mental workload. There is enough use simulation to make a realistic assessment
of the relative demands with the different types of flight on simulations. So, flight simulation
for evaluating the pilot workload is plausible.
Page 41
30
CHAPTER THREE: METHODOLOGY
3.1 Experimental design
3.1.1 Statistical model
Three-factor experiments with repeated measurement were designed in order to
evaluate how flight factors affect pilot performance, workload, and stress level. It was a fixed
model with three replications for each level (Howell, 1987; Winer, 1971). Since all sources of
variability between subjects are excluded from the experimental error, repeated measurement
design provides good precision for comparing treatments or tasks. This experiment was
simulated under the ideal conditions, i.e., without air traffic controller communication,
additional traffic, and adverse weather conditions.
Three factors, which are the independent variables, used in this study are: a level of
Flight Experience (FE), Gliding Angle (GA), and Approach Area (AA). First of all, FE had
two different subjects: a student pilot and an instructor pilot. GA had two different angles of
3º and 4.5º. At last, AA on Final Approach to L/D phase had two different areas: Non-
Populated and Populated. For the dependent variables, three different measurements were
conducted: HRV as a psycho-physiological stress, NASA-TLX score as a subjective
workload, and LP score as a pilot performance. Another dependent variable, which is Above
Page 42
31
Glide Path Tracking Performance (AGPTP), was also selected for evaluating the pilot
performance.
3.2 Protocol
3.2.1 Experimental set-up
A. A flight simulator (FRASCA MENTOR ATD)
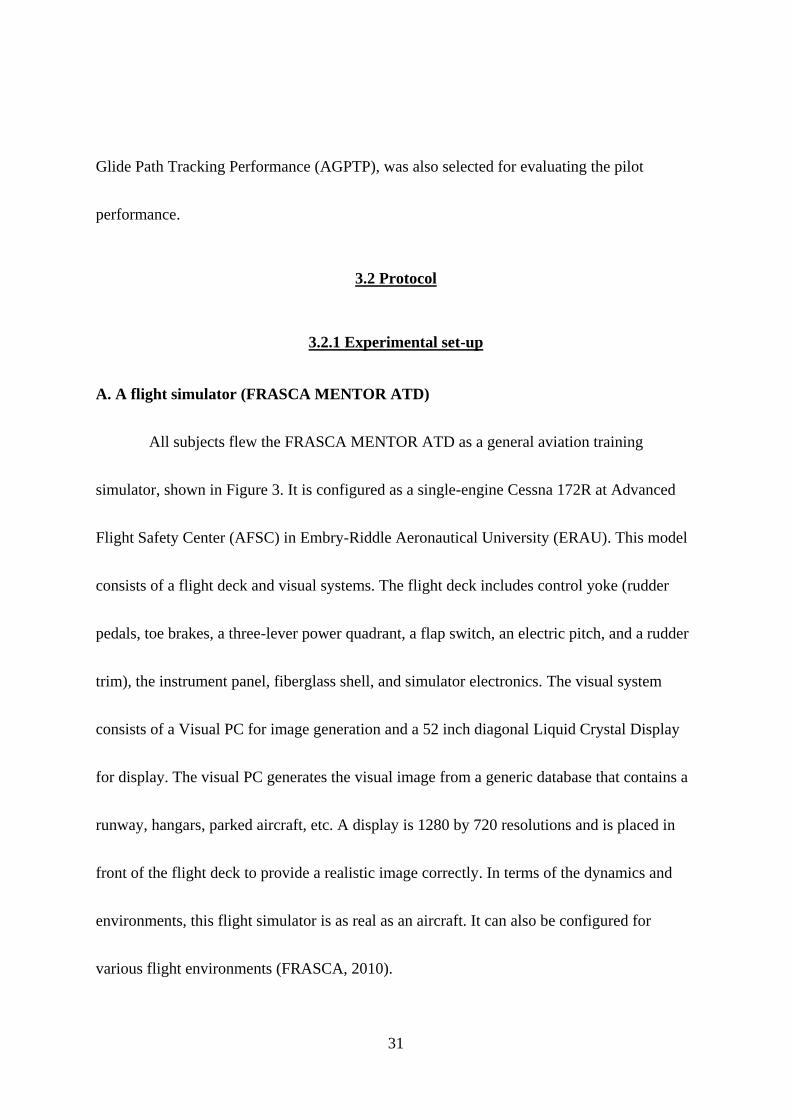
All subjects flew the FRASCA MENTOR ATD as a general aviation training
simulator, shown in Figure 3. It is configured as a single-engine Cessna 172R at Advanced
Flight Safety Center (AFSC) in Embry-Riddle Aeronautical University (ERAU). This model
consists of a flight deck and visual systems. The flight deck includes control yoke (rudder
pedals, toe brakes, a three-lever power quadrant, a flap switch, an electric pitch, and a rudder
trim), the instrument panel, fiberglass shell, and simulator electronics. The visual system
consists of a Visual PC for image generation and a 52 inch diagonal Liquid Crystal Display
for display. The visual PC generates the visual image from a generic database that contains a
runway, hangars, parked aircraft, etc. A display is 1280 by 720 resolutions and is placed in
front of the flight deck to provide a realistic image correctly. In terms of the dynamics and
environments, this flight simulator is as real as an aircraft. It can also be configured for
various flight environments (FRASCA, 2010).
Page 43
32
Figure 3. FRASCA MENTOR ATD Simulator
B. Heart rate monitoring system
Heart rate data was collected by using a Polar S810i Heart Rate Monitoring system
(Polar Electro, 2010), a portable wireless device shown in Figure 4. It includes a watch, an
elastic strap transmitter, and Polar ProTrainer 5.0 software, which downloads the data via
IrDA (an infra red USB) interface to PC. The elastic strap transmitter comfortably holds at a
right place on the chest. This strap contains micro-electronic circuits, which can sense the
signals from the heart when wrapped around the chest and then transmit the signals to the
watch on the wrist. This heart rate data is directly obtained in the form of beat to beat (R-R)
intervals, the time between the beats. The watch communicates all data from an electrode to a
PC via an infrared connection. A watch and an elastic strap transmitter in a heart monitor
Page 44
33
system are set on Pulse Mode that shows the current heart rate (beats per minute). A 3V
lithium battery is used for power source of the heart rate monitor set (a watch and elastic
strap transmitter).
Figure 4. S801i Heart Rate Monitor
3.2.2 Subjects
Subjects were divided into two major groups by their FE levels, with five people in
each group (student pilots and instructor pilots). These major groups were divided into 8 sub-
groups according to the levels of GA and AA, as shown in Table 1. All subjects who
participated in this experiment were from ERAU. The student pilots were in the later stage of
Page 45
34
their “FA 221 Instrument Pilot Single Engine Program” with an average flight hour of 199.7
± 38.7 hr. The flight instructors had “FA 417 (417A and 417I) Flight Instructor Rating” with
795.6 ± 182.5 flight hours. All of the subjects were familiar with a flight simulator since the
flight instructors had experiences with it and the student pilots were trained by the instructors
in ERAU flight school. Each subject read and signed the consent form (Appendix A), which
informed them of their rights before starting the experiment. This study using human subjects
was approved by the UCF Institutional Review Board (Appendix B).
Table 1. Matrix for grouping the subjects
Student pilots
3º
Non-Populated area1)
SLN
Repeated
3 times.
Populated area2)
SLP
4.5°
Non-Populated area1)
SHN
Populated area2)
SHP
Instructor pilots
3º
Non-Populated area1)
ILN
Populated area2)
ILP
4.5°
Non-Populated area1)
IHL
Populated area2)
IHP
Note. 1) Non-Populated area represents the country side including small mountains, rivers, and the sea.
2) Populated area represents the big cities including buildings and taller towers.
Page 46
35
3.2.3 Tasks
The pilots‟ flight task was to fly a series of approaches at a single-runway airport with
an Instrument Landing System (ILS). The pilots executed a “Runway 7L ILS Procedure” at
the Daytona Beach International airport. Among the full procedures, the partial segment of
the procedure, fixed from 5 mile to a runway, was selected for the experiment. ILS is a
ground-based instrument approach system that provides precision guidance to an aircraft
approaching and landing on a runway. For example, it provides the pilots with their relative
vertical and lateral positions, in terms of the established glide path of the ILS procedures.
In this study, the pilots were instructed to follow Precision Approach Path Indicator
(PAPI) on the side of a landing runway, which provides vertical guidance information for
helping the pilots acquire and maintain the established glide path to the runway. During this
experiment, the pilots used the Localizer Indicators in the cockpit to track and control the
aircraft for their lateral positions.
There were four different scenarios for this experiment as shown in Table 1, section
3.2.2. For the scenario 1, the pilots flew with GA of 3º in Non-Populated area at Final
Approach to L/D phase of flight. Flying with the 3º in Populated area was the scenario 2. For
example, to describe Populated area, various buildings whose heights are limited from the
Page 47
36
regulation of FAA Order 8260 3B were placed. The pilots flew with the 4.5º for the scenario
3 in Non-Populated area and for the scenario 4 in Populated area, respectively.
All scenarios were the Straight-In Approach and L/D starting 5 nautical miles at the
revised ILS procedure mentioned above. At the starting point, an aircraft was configured at
100 mile-per-hour (mph) in a straight and level position with no flap extensions. The initial
altitude was set to 1600 feet (ft) for the scenarios 1 and 2, and 2400 ft for the scenarios 3 and
4, respectively. An aircraft was intercepted on the glide path. The weather conditions were set
with 7 miles in visibility, moderate turbulence in wind, and a scattered cloudy sky. Prior to
the experiment, the pilots were provided with scheduled weather conditions, GA, and AA.
All of the simulation flights were terminated when an aircraft landed on or off the runway,
crashed, or did Go-around.
3.2.4 Procedure
All scenarios contained 4 steps. STEP 1 was an orientation for this study: the
experiment procedures of the flight simulation were individually provided to all pilots.
STEPs 2 to 4 were composed of 5-minute of flying for recording (STEP 2), 5-minute of
measuring for NASA-TLX (STEP 3), and 10-minute of resting (STEP 4). Here is more
detailed explanation of the STEPs. In STEP 1, each subject was informed with instructions
Page 48
37
for the study (e.g., total experiment procedure, goal of experiment, notice, etc). Before sitting
on the cockpit seat, the subjects were equipped with HR monitors. The pilots were seated
comfortably on the cockpit seat in a noise-attenuated, shielded room. STEP 2 contained the
work for 5-minute flying, which means the task was finished when an aircraft landed on the
runway. After completing STEP 2, the pilots left the cockpit and rated the workload
associated with the task using the NASA-TLX shown in Appendix C for STEP 3. Then, in
STEP 4, the pilots took a rest for 10 minutes to recover HR. In all cases, HR was recorded by
a heart rate monitor during the flight. The pilots who finished scenario 1 continued these
steps for complying with scenarios 2, 3, and 4.
3.3 Data collection and processing
3.3.1 Heart rate variability
R-R interval of HR was recorded throughout the scenarios with a Polar S810i Heart
Rate Monitoring system of a sampling rate of 1000 Hz. The heart rate signal of
Electrocardiogram (ECG) consists of P, Q, R, S and T waves. The R-R interval means the
time interval from a peak point of R wave to the next peak as shown in Figure 5. The R-R
interval time differs every time since there are lots of phenomena that influence people‟s
Page 49
38
body and mental condition (Murai et al., 2004).
Figure 5. R-R Interval on ECG Wave
Based on the raw R-R interval, a Polar S810i Heart Rate Monitoring system provides
HRV analysis in time domain or in frequency domain. The values of the time domain
analysis contain the mean R-R interval, the standard deviation of all R-R intervals (SDNN),
the root mean square of differences (RMSSD) of successive R-R intervals, the difference
between adjacent R-R intervals of more than 50 ms (NN50), and the proportion of difference
between the adjacent R-R intervals of more than 50 ms (pNN50). The frequency domain
analysis shows the variability of the R-R signal as a function of frequency by looking at the
proportion of the frequencies related to the original R-R signal. The frequency bands used for
frequency domain analysis consist of VLF of 0.00-0.04 Hz, LF of 0.04- 0.15 Hz and HF of
0.15-0.4 Hz (Cerutti et al., 1995). The frequency domain analysis includes the values of LF
Page 50
39
and HF, and the ratio of LF to HF with a normalized unit (nu). For the present study, the LF
value was used for our statistical analysis (Seong et al., 2004; Murai et al., 2004; Sato et al.,
1995).
3.3.2 NASA-TLX
Most of the literature on NASA-TLX, which was created by Hart and Staveland in
1988, have reported workload data using the composite indices with both rating and
weighting as explained in Chapter 2. However, Moroney et al. (1995) mentioned many
applications of a single sub-dimension of workload in various fields. They suggested that
information for 6 sub-dimensions provided by the individual rating may be obscured and
even ignored. Indeed, because sub-dimension rating is sensitive to different task demands, it
is important to preserve a sub-dimension‟s property. In 1988, Vidulich and Bortolussi
reported that six sub-dimensions of NASA-TLX are sensitive to different task demands in
helicopter combat simulations: while weighted TLX failed to demonstrate the differences
between tasks, the physical demand and effort of sub-dimensions positively exhibited the
difference during high workload segments of the missions. The six sub-dimensions of
NASA-TLX have been supported in a series of simulation and field tests by Christ et al.
Page 51
40
(1993). They reported that the sub-dimensions identified the type of workload associated with
different mission segments and crew positions in the helicopter-simulation study.
In addition, several studies also showed a significant correlation between weighted and
sub-dimensional ratings. Byers et al. (1989) compared the weighted and sub-dimensional
methods in the test with the evaluation of 5 Army systems. They reported a very high
correlation (r = 0.977) between the two ratings by the 5 independent studies. These empirical
tests were supported by Moroney et al. (1992) and Nygren (1991). Moroney et al. (1995)
argued that more attention should be paid to the individual sub-dimensional measurement
since it is valid for measuring workload.
In this study, the NASA-TLX method was used for the assessment on subjective
workload. The pilots evaluated their tasks after finishing them. They scored them from 1 to
21 points on six sub-dimensions of NASA-TLX. One of these sub-dimensions, Mental
Demand (MD) rating, was evaluated and was compared with workload.
3.3.3 Flight performances
Flight performances were evaluated in terms of LP and AGPTP. The pilots were
instructed to land at the point of 1,000 ft from the end of the runway, which is the general
landing zone for the pilots. To determine where the pilots land, reference lines were drawn on
Page 52
41
the runway with 300 ft intervals from the landing point designated. The pilots were also
supposed to land at 65 mph. In terms of the distance and the speed, the flight parameters
collected by an experimenter were figured and converted into scores in accordance with
Table 2. For evaluating the glide path tracking performance, the flight path flown by the
pilots was printed out from the simulation database and was manually calculated to get the
percent deviation from the established glide path.
Table 2. Conversion table
L/D distance
Deviations
(± feet) 300 600 900 >1200
Scores 0 -1 -2 -3
L/D speed
Deviations
(± mph) 5 10 15 >20
Scores 0 -1 -2 -3
3.4 Hypotheses
The objectives of this study were to identify and describe the pilot performance,
workload, and stress level under the various flight factors at Final Approach to L/D phase. It
was hypothesized that the pilot stress, workload, and performance would be affected by the
levels of flight factors (FE, GA, and AA). Hypotheses in this study were as follows:
Page 53
42
1. The relationship between the level of FE and the pilot performance, workload, and
stress level at Final Approach to L/D phase of flight.
- H0: FE does not affect the pilot performance, workload, and stress level.
- H1: FE does affect the pilot performance, workload, and stress level.
2. Changes in the pilot performance, workload and stress level as a function of AA.
- H0: Type of AA does not affect the pilot performance, workload, and stress level.
- H1: Type of AA does affect the pilot performance, workload, and stress level.
3. Pilot performance, workload and stress levels vary between the different GA values.
- H0: GA does not affect the pilot performance, workload, and stress level.
- H1: GA does affect the pilot performance, workload, and stress level.
Page 54
43
CHAPTER FOUR: RESULTS
The questions of interest in this study were: 1) how pilot performance varies with the
different flight factors 2) what is the relationship between pilot performance and their
workload and stress at Final Approach to L/D phase of flight. To address these questions,
flight performance was analyzed first and then workload ratings and stress level were
evaluated.
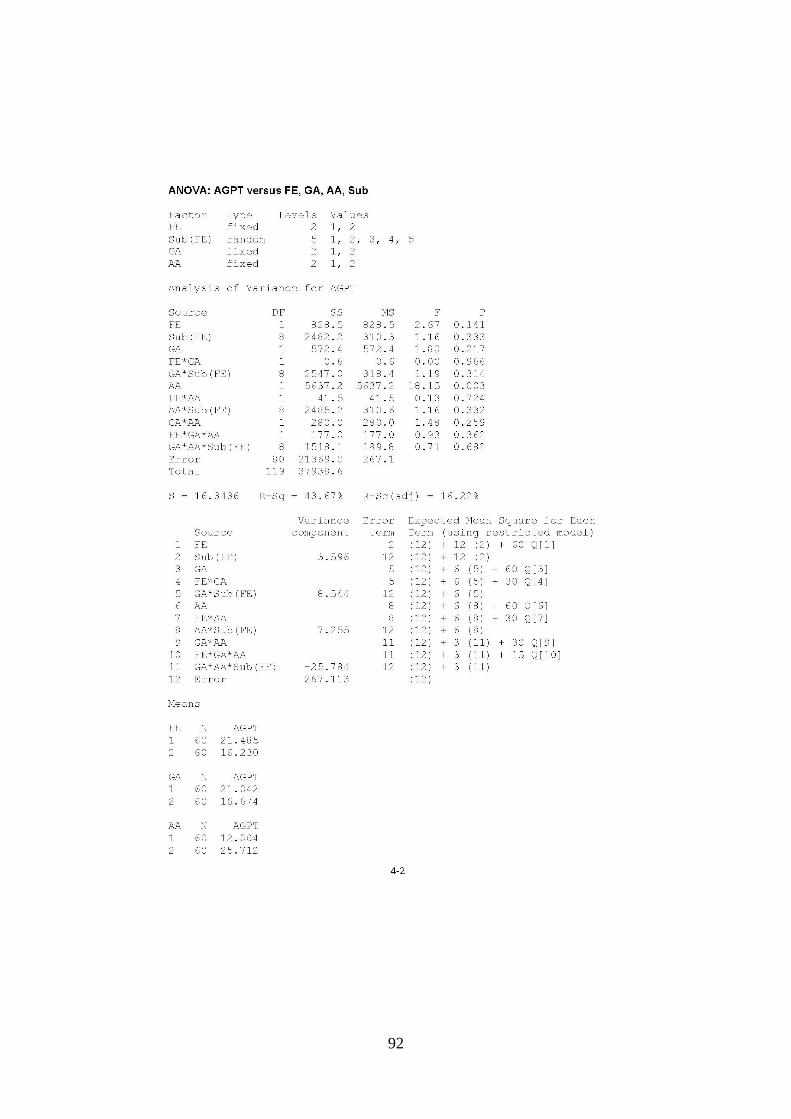
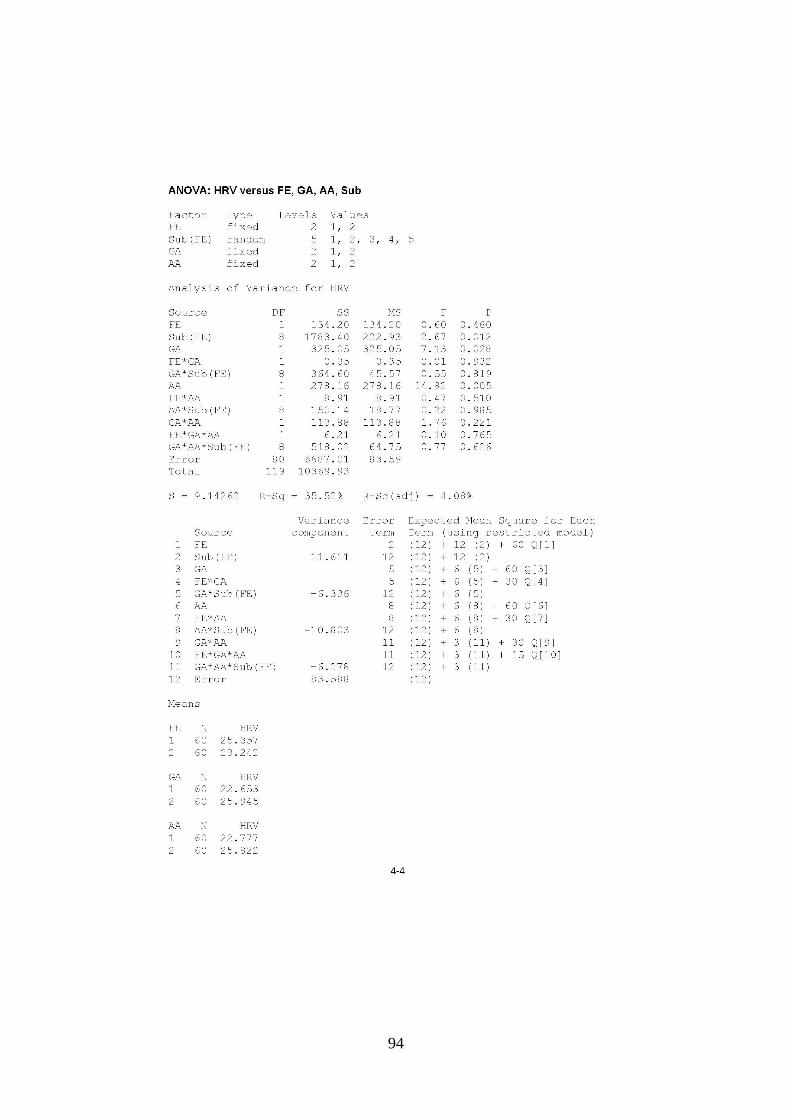
The simulation output data and the subjective rating data, which are shown in
Appendix D, were analyzed with descriptive statistics and analysis of variance (ANOVA)
with MINITAB 15 statistical software to see the overall effect of the independent variables
and their interactions. Both Landing Performance (LP) and Above Glide Path Tracking
(AGPT) data were used for the flight performance to verify how it is affected by different
fight factors, i.e. Approach Area (AA), Gliding Angle (GA), and Flight Experience (FE).
Additionally, in terms of pilot workload and mental stress, NASA-TLX MD rating and HRV-
LF were obtained and processed with each flight factor.
The null hypothesis for this analysis is that the mean value of task groups is not
significantly different. The alpha level, α, used for acceptance and rejection was set to .05. If
the ANOVA shows significance and if the null hypothesis is rejected, it is assumed that at
least one mean value is different from the others. FE was the between-subjects variable tested
Page 55
44
with two levels (SPG and IPG). As the within-subjects variables, two levels of GA (3º and
4.5º) and AA (Non-Populated and Populated) were tested. In this chapter, the effect of each
flight factor on the pilot performance, workload, and stress level was explained and discussed
by both statistical and graphical results.
4.1 Types of Approach Area
4.1.1 Hypotheses test for the AA effect
Hypotheses were tested to verify the relationship between the flight factors (AA) and
flight performances, which are shown by LP and AGPT scores. In addition, the NASA-TLX
score for the subjective workload and HRV-LF ratio for the stress were hypothesized and
tested for their relationships to different flight factors. The results of the ANOVA analysis of
these measurements are shown in detail in Appendix E.
Hypothesis 1a (H1a): The relationship between the level of AA and LP score at
Final Approach to L/D phase of flight.
- H0: AA does not affect pilot‟s LP score.
- H1: AA does affect pilot‟s LP score.
Page 56
45
On the within-subjects variable of the levels of AA (Non-Populated and Populated
area), when a critical α of .05 was set, the LP on the levels of AA was statistically significant,
F(1, 108) = 53.26, p < .05. Thus, the pilot performance was different with respect to the
levels of AA.
Hypothesis 1b (H1b): The relationship between the levels of AA and the glide path
tracking performance.
- H0: AA does not affect the glide path tracking performance.
- H1: AA does affect the glide path tracking performance.
The p-value for the AGPTP was < .05 for the levels of AA. Based on the p-value
obtained, the null hypothesis was rejected. This indicates that the levels of AA had a
statistically significant effect on AGPTP.
Hypothesis 1c (H1c): The relationship between the level of AA and TLX score at
Final Approach to L/D phase of flight.
- H0: AA does not affect pilot‟s TLX score.
- H1: AA does affect pilot‟s TLX score.
Page 57
46
At the specified α = .05 level, the TLX rating score was F(1, 108) = 29.88, p < .05. The
null hypothesis was rejected; thus, the level of AA influenced pilot workload.
Hypothesis 1d (H1d): The relationship between the level of AA and HRV ratio at
Final Approach to L/D phase of flight.
- H0: AA does not affect pilot HRV ratio.
- H1: AA does affect pilot HRV ratio.
Under the same condition above, the HRV on the levels of AA was F(1, 108) = 14.85,
p < .05, thus, pilot stress level depends on types of approach area.
To sum, the results from the statistical test indicated that pilot performance was
significantly influenced by the levels of AA at Final Approach to L/D phase of flight. The
subjective workload rating (TLX) and mental stress level (HRV) were also statistically
different depending on the levels of AA.
Page 58
47
4.1.2 Graphical results related in AA
Types of the approach area were one of the independent variables of this study. Table 3
shows the mean of each dependent variable between Non-Populated and Populated area
groups. Populated group recorded a lower score for the LP and a higher score for the AGPT.
This means Populated group got a bad performance compared to Non-Populated group. The
mean LP score between Non-Populated and Populated group was -1.15 points and -1.68
points, respectively. The difference in AGPT scores between Non-Populated group (mean:
12%) and Populated group (mean: 25.71%) was noticeable with a maximum difference of
13.71%. The TLX mean score between Non-Populated and Populated group was 5.48 points
and 7.2 points, respectively. On HRV, the mean value was 22.78 % for Non-Populated group
and 25.82 % for Populated group. Both TLX and HRV data showed that the Populated area
group had more workload and stress, which leads to bad performance.
Table 3. Mean of LP, AGPT, TLX, and HRV between AA
LP(points) AGPT (%) TLX(points) HRV (%)
Non-Populated -1.15 12.00 5.48 22.78
Populated -1.68 25.71 7.20 25.82
Page 59
48
Figures 6 to 9 show the effect of AA within the levels of GA (3º and 4.5º) for the
dependent variables. The LP score was compared in 3º group. As shown in Figure 6, SN
(student pilots who flew over Non-Populated area) group recorded the best score (mean: -
1.07) and IP (instructor pilots who flew over Populated area) group showed the worst
performance (mean: -1.21). Both SN and IN (instructor pilots who flew over Non-Populated
area) groups recorded better performance than SP (student pilots who flew over Populated
area) and IP. It could be interpreted that the pilot performance was affected by the different
AA within 3º GA (L). In addition, while flying with 4.5º GA (H), IN recorded the best score
(mean: -1.27) and the worst performance (mean: -2.27) was shown by SP. In accordance with
the results of 3º, both SN and IN showed better score than both SP and IP. Thus, the pilot
landing performance was highly affected by the types of area, where they flew over.
Moreover, LP score for the 4.5º (SP: -2.27, IP: -2.07) decreased more than that for the 3º (SP:
-1.20, IP: -1.21). According to the graphical results (Fig. 6) and the statistical test (H1a), it
could be interpreted that pilot performance was affected considerably by flying over the
Populated area as well as flying with 4.5º.
Figure 7 depicts AA effect within the levels of GA for the AGPT score. When flying
with 3º, SN recorded the lowest ratio (mean: 15.99) while SP showed the highest ratio (mean:
31.49). During the flight with 4.5º, IN recorded the lowest score (mean: 10.59) while SP
Page 60
49
showed the highest score (mean: 26.36). The pilots showed better performance when they
flew over the Non-Populated than over the Populated area, which showed that the pilot glide
path tracking performance was affected by the types of AA, where they flew over. In addition,
the pilots showed higher AGPT ratio for the Populated area with 3º than with 4.5º. Thus,
based on graphical (Fig. 7) and statistical result (H1 b), it can be concluded that glide path
tracking performance was highly influenced by flying over the Populated area as well as
flying with 3º.
Page 61
50
Figure 6. Mean LP Score of AA within GA
Note. S, I, L, H, N, P stand for Student, Instructor, 3º, 4.5º, Non-Populated area, Populated area,
respectively, as explained in Chapter 3.
Figure 7. Mean AGPT Ratio of AA within GA
S I S I
L H
N -1.07 -0.73 -1.53 -1.27
P -1.20 -1.21 -2.27 -2.07
-2.50 -2.00 -1.50 -1.00 -0.50 0.00
Pe
na
lty S
co
re
Landing Performance Score
S I S I
L H
N 15.99 9.34 12.10 10.59
P 31.49 27.35 26.36 17.64
0.00
10.00
20.00
30.00
40.00
Perc
enta
ge
Above Glide Path Tracking Score
Page 62
51
The pilots‟ subjective workload rate by NASA-TLX is shown in Figure 8. During the
flight with 3º GA, SP (student pilots who flew over Populated area) rated 6.73 points, while
IN (instructor pilots who flew over Non-Populated area) rated 4.07 points. In accordance with
it, SP rated 9.2 points and IN rated 6.0 points during the flight with 4.5º GA. From the pilot
groups who showed high subjective workload level for the Populated area, the student pilot
group (SPG) recorded a higher score than that of the instructor pilot group (IPG). This meant
that pilot workload was affected by flying over the Populated area. In addition, the workload
level that the pilots showed during the flight with 4.5º was increased compared to the
workload level that the pilots showed during the flight with 3º. Based on the graphical (Fig. 8)
and statistical test (H1C) results, it could be concluded that pilot workload was influenced by
the glide path angle and the landscape of approach area.
As shown in Figure 9, when pilots flew with3º GA, SP recorded the highest score
(mean: 26.65), while IN recorded the lowest (mean: 18.65) on HRV ratio. During the flight
with 4.5º GA, SP recorded the highest ratio (mean: 27.56), while IN recorded the lowest ratio
(mean: 24.24). Moreover, in comparison to the pilots who flew over Non-populated area, the
pilots who flew over Populated area showed higher stress level. This means that pilot stress
level was highly influenced by Populated area that the pilots flew over. In addition, the pilots
showed higher stress level during the flight with 4.5º than during the flight with 3º. From
Page 63
52
these results, it could be interpreted pilot stress level was influenced considerably by flying
over Populated area as well as with 4.5º (Fig. 9 and H1d).
Overall, the pilot performance, workload, and stress level are statistically different
depending on the types of approach area. Pilots showed lower performance, higher workload,
and higher stress level when they flew over Populated area than over Non-Populated area.
Page 64
53
Figure 8. Mean NASA-TLX MD Score of AA within GA
Figure 9. Mean HRV-LF Ratio of AA within GA
S I S I
L H
N 5.00 4.07 6.87 6.00
P 6.73 5.47 9.20 7.40
0.00 2.00 4.00 6.00 8.00
10.00
Sco
re
NASA-TLX Mental Demand Rate
S I S I
L H
N 21.66 18.65 26.55 24.24
P 25.65 24.65 27.56 25.43
0.00
10.00
20.00
30.00
Perc
enta
ge
Heart Rate Variability
Page 65
54
4.2 Levels of Gliding Angle
4.2.1 Hypotheses test for the GA effect
Hypotheses were tested to verify the relationship between the flight factors, GA, and
flight performances, shown by LP and AGPT score. In addition, the NASA-TLX score for
the subjective workload and HRV-LF ratio for the mental stress were hypothesized and tested
for their relationships to different flight factors.
Hypothesis 2a (H2a): The relationship between the level of GA and LP score at
Final Approach to L/D phase of flight.
- H0: GA does not affect pilot‟s LP score.
- H1: GA does affect pilot‟s LP score.
On the within-subjects variable of the levels of GA (3 degree and 4.5 degree), when a
critical value of α (0.05) was set, the LP on the levels of GA was statistically significant F(1,
108) = 27.61, p < .05. This indicated that the pilot performance was different with respect to
the levels of GA.
Page 66
55
Hypothesis 2b (H2b): The relationship between the levels of GA and the glide path
tracking performance.
- H0: GA does not affect the glide path tracking performance.
- H1: GA does affect the glide path tracking performance.
The p-value for the AGPTP was greater than .05 for the levels of GA. Based on the p-
value obtained, the null hypothesis was not rejected. This shows that the levels of GA did not
have any significant effect on AGPTP.
Hypothesis 2c (H2c): The relationship between the level of GA and TLX score at
Final Approach to L/D phase of flight.
- H0: GA does not affect pilot‟s TLX score.
- H1: GA does affect pilot‟s TLX score.
When a critical value of α, .05, was set, TLX rating score was F(1, 108) = 30.2, p < .05.
The null hypothesis was rejected. Therefore, the level of GA did influence pilot workload.
Page 67
56
Hypothesis 2d (H2d): The relationship between the level of GA and HRV ratio at
Final Approach to L/D phase of flight.
- H0: GA does not affect pilot HRV ratio.
- H1: GA does affect pilot HRV ratio.
When a critical value of α, .05, was set, the HRV on the levels of GA was F(1, 108) =
7.12, p< .05. Therefore, the pilot stress level was significantly different depending on levels
of gliding angle.
To sum, the results of statistical test indicated that pilot landing performance was
significantly different with respect to the levels of GA at Final Approach to L/D phase of
flight. However, it revealed that AGTP was not statistically different by the levels of GA. The
subjective workload rating (TLX) and stress level (HRV) were also significantly different
depending on the levels of GA.
4.2.2 Graphical results related in GA
Table 4 illustrated the mean value of each dependent variable between the levels of GA
(3º and 4.5º). The mean LP score of both 3º GA group and 4.5º GA group was -1.05 point and
Page 68
57
-1.78 point, respectively. This showed that the pilots scored low for 4.5º. The difference in
AGPT between 3º (mean: 21.04%) and 4.5º (mean: 16.88%) was 4.16% and this was not
significant. Overall, the pilot showed lower performance for 4.5º than 3º. The TLX score
revealed that the pilots rated higher subjective workload during the flight with 4.5º than with
3º. In addition, the average volume of HRV-LF on each group was 22.64 % for 3º group and
25.95 % for 4.5º group, respectively. The pilots who flew with 4.5º showed more stress level.
Therefore, it could be concluded that the level of GA did significantly influence pilot
performance, subjective workload, and stress level.
Table 4. Mean of LP, AGPT, TLX, and HRV between GA
LP(points) AGPT (%) TLX(points) HRV (%)
3 degree -1.05 21.04 5.32 22.65
4.5 degree -1.78 16.68 7.37 25.95
Figure 10 to 13 showed GA effect within the levels of AA for the dependent variables.
In Non-Populated area group (N), SL (student pilot who flew with 3º GA) recorded the best
score (mean: -1.07) and SH (student pilot who flew with 4.5º GA) showed the worst
performance (mean: -1.53) as shown in Figure 10. Both SLN and ILN recorded better
Page 69
58
performance than SHN and IHN. It could be interpreted that the pilot performance was
affected more by the 4.5º within Non-Populated area than 3º within Non-Populated area.
While flying over Populated area (P), SL recorded the best score (mean: -1.2) and the worst
performance (mean: -2.27) was shown by SH. In accordance with the results of Non-
Populated group, both SLP and ILP showed better scores than both SHP and IHP. Thus, the
pilot performance was highly influenced by flying with 4.5º. Moreover, LP score for Populate
group was higher than that for Non-Populated group. From these results, it could be
interpreted that pilot performance was highly affected by flying with 4.5º as well as over
Populated area. This is supported by the statistical test (H2a and H3a) as shown in this
chapter.
Figure 11 depicted the GA effect within the levels of AA for the AGPT score. When
flying over Non-Populated area (N), SL recorded the lowest score (mean: 15.99), while IL
showed the highest score (mean: 9.34). During the flight over the Populated area (P), IH
recorded the lowest score (mean: 17.64), while SL showed the highest score (mean: 31.49).
IPG showed the better performance for flying with 4.5º for the both Non-Populated and
Populated, while SPG didn‟t show a particular pattern. In addition, the difference of mean
value between 3º and 4.5º groups was small. Therefore, it could be concluded that the levels
of GA didn‟t influence on AGPT performance.
Page 70
59
Figure 10. Mean LP Score of GA within AA
Figure 11. Mean AGPT Ratio of GA within AA
S I S I
N P
L -1.07 -0.73 -1.2 -1.21
H -1.53 -1.27 -2.27 -2.07
-2.5-2
-1.5-1
-0.50
Pen
alty S
core
Landing Performance Score
S I S I
N P
L 15.99 9.34 31.49 27.35
H 12.10 10.59 26.36 17.64
0.00
10.00
20.00
30.00
40.00
Perc
enta
ge
Above Glide Path Tracking Score
Page 71
60
The pilots‟ subjective workload rating by NASA-TLX was shown in Figure 12. In
Non-Populated group (N), SH (student pilots who flew with 4.5º GA) rated 6.87 and IL
(instructor pilots who flew with 3º GA) rated 4.07, while SHP rated 9.2 and ILP rated 5.47
during the flight over Populated area, respectively. The pilots showed high subjective
workload level for the flight with 4.5º. This indicated that pilot workload was more
influenced by the flight with 4.5º than with 3º GA. In addition, the workload level that the
pilots showed during the flight over Populated area was higher than the results shown during
the flight over Non-Populated area. From these results, it can be interpreted that pilot
workload was indeed influenced by the flight with 4.5º as well as over Populated area.
As shown in Figure 13, SHN recorded the highest score (mean: 26.65), and ILN
recorded the lowest (mean: 18.65) on HRV ratio. During flying over Populated area (P), SH
recorded the highest score (mean: 27.56), and IL recorded the lowest (mean: 24.65).
Moreover, the pilots showed high stress levels for flying with 4.5º. This indicated that pilot
stress level was highly affected by flying with 4.5º. In addition, the pilots showed higher
stress level during flying over Populated area than during the flight over Non-Populated area.
From these results, it could be interpreted that the pilot stress level was affected considerably
by the flight with 4.5º as well as over Populated area
Page 72
61
Figure 12. Mean NASA-TLX MD Score of GA within AA
Figure 13. Mean HRV-LF Ratio of GA within AA
S I S I
N P
L 5.00 4.07 6.73 5.47
H 6.87 6.00 9.2 7.40
0.00 2.00 4.00 6.00 8.00
10.00
Score
NASA-TLX Mental Demand Rate
S I S I
N P
L 21.66 18.65 25.65 24.65
H 26.55 24.24 27.56 25.43
0.00
10.00
20.00
30.00
Perc
enta
ge
Heart Rate Variability
Page 73
62
4.3 Levels of Flight Experience
4.3.1 Hypotheses test for the FE effect
Hypotheses were tested to verify the relationship between the levels of FE and flight
performances, shown by LP and AGPT score. In addition, the NASA-TLX score for the
subjective workload and the HRV-LF ratio for the mental stress were hypothesized and tested
for their relationship to different flight factors.
Hypothesis 3a (H3a): The relationship between the level of FE and LP score at
Final Approach to L/D phase of flight.
- H0: FE does not affect pilot‟s LP score.
- H1: FE does affect pilot‟s LP score.
On the between-subjects variable of the levels of FE (student pilot and instructor pilot),
when a critical value α, .05, was set, the LP on the levels of FE was not statistically
significant, F(1, 108) = 0.00, p > .05. Thus, the pilot performance is not significantly
different with respect to the levels of FE.
Page 74
63
Hypothesis 3b (H3b): The relationship between the levels of FE and the glide path
tracking performance.
- H0: FE does not affect the glide path tracking performance.
- H1: FE does affect the glide path tracking performance.
The p-value for the AGPTP was greater than .05 for the levels of FE. Based on the p-
value obtained, the null hypothesis was not rejected. This indicated that the levels of FE did
not have a statistically different effect on AGPTP.
Hypothesis 3c (H3c): The relationship between the level of FE and TLX score at
Final Approach to L/D phase of flight.
- H0: FE does not affect pilot‟s TLX score.
- H1: FE does affect pilot‟s TLX score.
When a critical value α (.05) was set, the TLX rating score was F(1, 108) = 1.26, p
> .05. The null hypothesis was not rejected; thus, the level of FE did not significantly
influence pilot workload.
Page 75
64
Hypothesis 3d (H3d): The relationship between the level of FE and HRV ratio at
Final Approach to L/D phase of flight.
- H0: FE does not affect pilot HRV ratio.
- H1: FE does affect pilot HRV ratio.
When a critical value α (.05) was set, the HRV on the levels of FE was F(1, 108) =
0.61, p > .05, thus, the pilot stress levels were not different for levels of flight experience.
To sum, the results of statistical test indicated that pilot performance was not
significantly different with respect to the levels of FE at Final Approach to L/D phase of
flight. The subjective workload rating (TLX) and stress level (HRV) were not statistically
different depending on levels of FE.
4.3.2 Graphical results related in FE
On the pilot performance, two levels of flight experience (student pilots and instructor
pilots) were evaluated for the LP score and the Above Glide Path Tracking (AGPT) score.
From the Table 5 and Figure 14, the mean values of LP for SPG (student pilot group) and
IPG (instructor pilot group) were -1.52 points and -1.32 points, respectively. The difference
Page 76
65
of LP scores between the groups was small. Although SPG showed higher performance for
the tasks, there was no significant difference on levels of performance between SPG and IPG.
Statistical results, H3a, confirmed this relationship. Figure 15 showed that SPG recorded
higher score (mean: 21.46 %) than IPG (mean: 16.23 %) for the AGPT score. The results of
ANOVA indicated that FE did not have a significant impact on AGPT (H3b, p > .05).
Therefore, the level of FE didn‟t affect either pilot workload or AGPT for this study.
This was coherent to NASA-TLX and HRV-LF results. The average scores of TLX-
MD rating of both groups was represented in Figure 16 for the subjective workload. The
mean scores of SPG and IPG were 6.95 points and 5.73 points, respectively. On the mental
stress, the average score of HRV-LF ratio of both groups were illustrated in Figure 17. It was
25.36 % for SPG and 23.24 % for IPG, respectively. Overall, FE, one of the flight factors
tested, showed no impact on the performance, workload, and stress based on the statistical
results (H3c and H3d).
Table 5. Mean of LP, AGPT, TLX, and HRV between FE
LP(points) AGPT (%) TLX(points) HRV (%)
SPG -1.52 21.49 6.95 25.36
IPG -1.32 16.23 5.73 23.24
Page 77
66
Figure 14. Mean LP Score between SPG and IPG
Figure 15. Mean AGPT Ratio between SPG and IPG
Mean
SPG -1.52
IPG -1.32
-2.00
-1.50
-1.00
-0.50
0.00
Pen
alty S
core
Landing Performance
Mean
SPG 21.49
IPG 16.23
0
10
20
30
Perc
enta
ge
Above Glide Path Tracking Performance
Page 78
67
Figure 16. Mean NASA-TLX MD Score between SPG and IPG
Figure 17. Mean HRV-LF Ratio between SPG and IPG
Mean
SPG 6.95
IPG 5.73
0.0
2.0
4.0
6.0
8.0
Score
NASA-TLX Mental Demand Rating
Mean
SPG 25.36
IPG 23.24
0.0
10.0
20.0
30.0
Perc
enta
ge
Herat Rate Variability-Low Frequency
Page 79
68
CHAPTER FIVE: DISCUSSION
The purpose of this study was to determine the effect of the flight factors on the pilot
performance, workload, and stress level using a flight simulator. The independent variables
included approach areas (AA), gliding angles (GA), and flight experience (FE). The
dependent variables were LP & AGPTP, NASA-TLX, and HRV, with respect to pilot
performance, workload, and stress level. Ten subjects participated in this repetitive
experiment. They were divided into two groups, with respect to their FE, and executed four
scenarios, which consisted of the treatment combinations of GA and AA. Upon completion of
the experiment, collected data were graphically and statistically analyzed. As a result of
repeated-measurements-univariate ANOVA, the following results were revealed.
Firstly, one of the flight factors examined was the level of AA, and its hypothesis was
that the type of AA does affect pilot performance, workload, and stress level. Since the
hypothesis was true, it can be concluded that the levels of AA have a significant impact on
pilot performance, workload, and stress level. This effect was more recognizable in the flight
that flew over Populated area. Secondly, the levels of GA also had significant impact on pilot
performance, workload, and stress level, as shown in the results of hypothesis test. The pilots
showed lower performance, higher workload, and higher stress at 4.5º than that of 3º. Finally,
for the level of FE, a group of student pilots, who had less flight experiences, scored higher
Page 80
69
HRV, NASA-TLX, but lower performance than a group of instructor pilots, who had more
flight experiences. However, the difference of mean value on the measurements was not
statistically significant. The hypothesis test results showed that the level of flight experience
did not have significant impact on the pilot performance, workload, and stress levels. These
results are discussed in detail in the following sections.
5.1 Types of Approach Area
The statistical test and graphical results show that the types of Approach Area (AA,
Non-Populated and Populated area) have an effect on the pilot performance, workload, and
stress level. It seems like the programmed Populated area influenced pilot landing
performance score, NASA-TLX score, and HRV-LF ratio. As an environmental factor on
workload and stress, many objects programmed for the generating Populated area influence
pilots by increasing the density of the pilot‟s visual information. And pilots considered the
flight over Populated area as a new experience and felt stress from the task itself.
For the pilot performance, the pilots recorded the worst score for Populated area on
both LP and AGPT as show in Table 3 and Figures 6 and 7. In general, experience is a very
important variable moderating human performance (Salthouse, 1987) and undoubtedly a
major factor leading to greater effectiveness in performance (Shriver, 1953). So, the flight
Page 81
70
over Populated area became inexperienced work which caused lower performance, higher
workload, and higher stress level than the flight over Non-Populated area, which the pilots
are used to.
Many objects at Final Approach to L/D phase may make the pilots fly higher than the
established glide path at the airport. Thus, flight performance got worse during the flight over
the Populated area than Non-Populated area. The density of visual clues can affect pilots‟
performance at Final Approach to L/D phase. Gibb and Gray (2006) said that the global and
local terrain features allow a pilot to accurately judge the glide path. According to Foyle et al.
(1992), visible texture density and its changes have been proposed as a clue for altitude
awareness, with increasing density associated with higher perceived altitudes. This was
supported by Oshima and Lintern (1992), who found that the pilots flew progressively higher
approaches as the density of the visual information (objects) increased. Similar results were
reported by Lintern and Walker (1991), Lirdan and Koonce (1991), and Reardon (1988).This
simulation resulted in the highest AGPT score for the Populated area.
NASA-TLX results showed that the flight over Populated area increased in pilots‟
subjective workload level. In accordance with TLX results, HRV showed that the pilots who
flew over Populated area were exposed to more stress than those who flew over Non-
Populated area. Tyler and Cushway (1995) reported that there is a significant and direct
Page 82
71
proportional link between workload and stress levels. For example, Sheridan (1979)
explained workload as the stress that people experience from the various stressors such as
ambient (environmental) and performance. In 1983, Hockey stated that stress is usually
considered to be a property of the environment, all other individual factors being equal. The
traditional approach has investigated both noise and temperature as environmental sources of
stress (Hancock & Warm, 1989). In this study, many buildings were programmed in
Populated area. Therefore, it may play a role as an environmental stressor. From this, pilots
can experience stress from the possibility of unexpected accidents while flying over
Populated area.
Moreover, many research reported that the pilot workload varies on the flight task type
and environments. For example, the pilots who fly under IFR showed significantly higher
workload (Wilson, 2002b; Hankins & Wilson, 1998; Hasbrook & Rasmussen, 1970). It was
claimed that IFR flight is a difficult cognitive task resulting in the increased workload. Based
on the study result of Bennett and Schwirzke (1992), the aviation accident rate for IFR flight
during the nighttime was almost eight times greater than that for VFR flight during the
daytime. It can be said that pilot workload, caused by environmental stressor, decreases the
flight performance.
Page 83
72
Moreover, pilots may feel stress from the flight over Populated area. According to
Hancock and Warm (1989), the task itself is considered as a primary influence in the
generation of stress from the integrated view of stress and performance.
Overall, it can be suggested that both the new work conditions (environmental factors)
and the tasks themselves were strongly related to increase in pilot workload and stress.
Therefore, increased workload and stress may cause the different flight performance
depending on the levels of AA.
5.2 Levels of Gliding Angle
The levels of Gliding Angle (GA, 3 degree and 4.5 degree) significantly affected the
pilot performance, workload, and stress level. Pilots showed lower performance, higher
workload, and higher stress levels for the flight with 4.5 degree than with 3 degree GA. It
seems like 4.5 degree ILS task was new experience task, difficult task, and the task that
caused time pressure to the pilots.
Usually, the pilots have to follow the ILS procedure that is established with 3º GA to
land on the runway. Unlike this 3º ILS, the task programmed in this study was to do 4.5° ILS,
which was a new experience for both participant groups. Accordingly, the pilots who flew
with 4.5º ILS became novices in the tasks. However, the pilots who flew with 3º ILS could be
Page 84
73
an expert for these tasks. In 1988, Chi et al. stated that experts were faster and error free than
novices at performing skills related to the tasks. While novices will use effort and time
consuming knowledge-based-behaviors on the tasks, experts will be able to aggregate these
behaviors into schemas which can then be enacted at a skill based level (Rasmussen, 1983;
Stanton et al., 2009). As a result, there is a difference on the cognitive capacity that affects
decision making. This is supported by Boehm-David et al. (2007) who reported that the pilot
performance obtained from simulated IFR flight decreased gradually as the degree of GA
increased. From Table 4 and Figure 6, the lower pilot performance on AGPT is recorded by
3º ILS. AGPT performance of the pilots was highly affected by density of visual clues
(buildings) at Final Approach to L/D phase as explained in Section 5.1. When the pilots fly
with 4.5º ILS, the effect of visual clues may be less on the flight.
According to pilot performance, 4.5º ILS is considered a difficult task for the pilots in
this study. It is verified by the NASA-TLX results: the pilots rated higher subjective
workload level for the 4.5º ILS. As reported by Boehm-Davis et al. (2007), the participants‟
ratings of subjective workload obtained from NASA-TLX data increased gradually as the
degree of GA increased. Various studies also showed that the NASA-TLX is sensitive to
changes in mental workload (Collet et al., 2009; DiDomenico & Nussbaum, 2008). Figure 8
shows that 4.5º ILS task generated more stress, which means that the pilots consider 4.5º ILS
Page 85
74
as the difficult task. According to Cnossen et al. (2004) and Vicente et al. (1987), an increase
in task demands (difficulty) is accompanied by an increase in mental workload. Again, Tyler
and Cushway (1995) reported that there is a significant and direct proportional link between
workload and stress levels. In other words, it can be said that mental stress level increases as
degree of task difficulty increases. Many researchers reported the increase of a HRV-LF
volume as an increase in the difficulty of task. For example, Paritala (2009) also reported a
HRV-LF increase for the mental task compared to that for physical task. Seong et al. (2004)
reported that a HRV-LF increased for the mental task. Malliani et al. (1991) reported that
mental stress, induced by arithmetic calculation, increased a HRV-LF.
Another possible reason for increase of stress level is time pressure. Hendy et al. (2001)
stated that time pressure affected operator performance, error production, and judgment of
workload from the information-processing model. Hence, time pressure is claimed as a
principal stressor in the human information-processing context. For example, Andrew and
Parris (1972) reported that the productivity of NASA scientists and engineers is highly
affected by time pressure. In this study, the distance from the touchdown point on the runway
to decision height (DH, the altitude that pilots decide whether they continue to land) was
getting shorter for the 4.5º ILS. In the cockpit, the pilots pay attention to many important
tasks (e.g. to communicate with air traffic control, to supervise instruments, to look outside of
Page 86
75
cockpit, etc.) to make safe flight at any given time. The pilots who are at the most loaded
phase of flight may be busier because the total time that the pilots can spend to land on the
runway is reduced for 4.5º ILS task. This study‟s results support those reports mentioned
above.
5.3 Levels of Fight Experience
The levels of Flight Experience (FE, less-experienced (student) and experienced
(instructor) pilots) did not influence pilot performance, workload, and stress level. It seems
that the differences of performance, workload, and stress level between groups were reduced
by the effect of both the new work conditions (Populated approach area and 4.5 degree ILS)
and the flight done at the most loaded phase of flight in this study.
As shown in Figures 14 and 15, IPG recorded a higher score than SPG for the LP and
AGPT scores. However, the difference between both groups‟ score was not statistically
significant. The new work conditions of GA and AA could be applied for both groups. In
general, experience is a very important variable that moderates human performance
(Salthouse, 1987) and undoubtedly it is a major factor leading to greater effectiveness in
performance (Shriver, 1953). Mostly, the experts show the better performance than the
Page 87
76
novices (Stokes et al., 1997; Wiggins & O‟Hare, 1995; Fisk et al., 1992; Livingston & Borko,
1989).
However, this study showed that the levels of experience didn‟t affect the pilot
performance. In 1988, Chi et al. stated that experts are faster and error free than novices at
performing skills related to the tasks. While novices will use effort and time consuming
knowledge-based-behaviors on the tasks, experts will be able to aggregate these behaviors
into schemas which can then be enacted at a skill based level (Rasmussen, 1983; Stanton et
al., 2009). As a result, there is a difference in the cognitive capacity affecting decision
making.
Additionally, the flight at Final Approach to L/D phase, which is the most loaded
phase of flight, increases that pilot workload (Hankins and Wilson, 1998; Sekiguchi et al.,
1978; Opmeer & Krol, 1973). In this study, new work conditions may increase workload on
both groups at Final Approach to L/D phase. Moreover, this simulation flight was supposed
to be done under the most loaded phase of flight. Tyler and Cushway (1995) reported that
there is a significant and positive link between workload and stress levels. Therefore, FE
made small difference in statistics on performance, workload, and stress level, although SPG
recorded lower performance and represented the higher subjective workload rating, as well as
mental stress level.
Page 88
77
CHAPTER SIX: COCLUSIONS
6.1 Conclusions
The study investigated the overall effect of flight factors on the pilot performance,
workload, and stress level. The results showed that the pilots recorded lower performance,
higher workload, and higher stress level when they were flying both at 4.5º and over
Populated area (e.g. large city) than both at 3º and over the Non-Populated area (e.g. grass
field, river, etc.). However, the pilot performance, workload, and stress level between
experienced pilots and novice pilots were not significantly different for this experiment.
Based on these results, the following issues can be considered.
The design process of developing new procedures (LDLP, SCDA, Steep Approach, etc.)
for the landing of aircrafts should be considered from the aspects of pilot workload, safety,
passenger comfort, and economy. However, the economy factor is likely to be considered
first, even over safety and pilot workload. In particular, the workload of the crew in the
cockpit is very high since they need to change configuration, decelerate speed, and flare to
land on the runway. Generally, these new procedures require increased height, decreased
thrust (power), and delayed configuration to help reduce fuel consumption and noise
problems. However, this would increase pilot workload at Final Approach to L/D phase
Page 89
78
because pilots would be busier by attempting steeper approach that makes the shorter Final
Approach to L/D segment.
There are obvious safety issues related to the allowance of structures in the
navigational airspace, particularly at Final Approach to L/D area. However, economic
development desires of land owners and developers to expand and provide new housing
facilities are unlimited. Structures encroaching upon the area need to remain clear for safe
operation of aircraft because development of airport areas can cause problems by
constructing many skyscrapers that cause steeper approach for the aircraft. Therefore,
development at Final Approach to L/D segment needs to be limited since it increases pilot
workload and causes safety concern based on the results of this study.
Conclusively, in order to reduce the workload and stress that can cause human errors, it
is highly recommended to carefully examine the impact of new flight procedures on pilot
workload and stress before they are implemented. In addition, safety issues related to
development in the navigational airspace should be considered in terms of pilot performance,
workload, and stress, although, in this study, all pilots made a safe landing under simulated
flight factors such as Populated area and 4.5 degree ILS.
The study provides useful information for researchers interested in the performance,
workload, and stress in aviation, but the results themselves are important. In particular, for
Page 90
79
the risk and safety management to improve aviation safety, these results may be useful to
policy makers in developing policy on new approach procedures such as Steep Approach by
providing reference data. In addition, the results help to manage navigational airspace of
airports in big cities by showing the effect of obstacles on pilots who fly at Final Approach to
L/D segment.
6.2 Findings, Limitations, and Suggested further research
Findings from this study are:
(1) Pilot‟s workload was affected by the levels of gliding angle and approach area.
(2) Pilots kept higher glide path when they were flying over Populated area (e.g. large
city) than over Non-Populated area (e.g. country town).
(3) Low Frequency band in HRV is sensitive to the consequence of sympathetic
activity (rest-tilt maneuver, mental stress, hemorrhage, coronary occlusion, etc.).
(4) The individual rating scale, Mental Demand (MD) of NASA-TLX, corresponds
well to pilot‟s workload indication.
It is important to note that these results may be restricted to the conditions examined in
this study for the following reasons. First, methodological limitations (e.g., the artificial and
controlled airspace situation) have to be considered. In the presence of such stressful real-
Page 91
80
world factors (e.g. other traffic, communications with air traffic controller, etc.), pilots may
be more likely to experience severe stress from heightened risk, causing increased workload.
Second, participants began each simulation when the aircraft was already on the descending
approach angle. Allowing the pilots to capture the glide path from an “en-route” phase of
flight may produce different results. Finally, these results are limited to the similar category
of aircraft, Cessna 172 R. Medium and heavy category aircrafts may show differences in
results since those have different capabilities and characters in flight. All of these conditions
should be examined in future research before a solid conclusion can be made.
For enhancing the validity of the results, further studies can be suggested by
performing this research and surveying the literature. The suggested further studies are:
(1) To use many subjects, including female pilots, to enhance the validity of the
research. It is worldwide trend that aviation field allow female pilots.
(2) To include other factors to enhance the reliability of the result. For example, these
factors might include a night time flight, various weather condition, etc.
(3) To extend the experiment from the beginning of the flight to the completion of the
flight in order to strengthen the validity of the study.
(4) To do the experiment with different aircrafts such as carrier aircrafts, fighter jets,
and helicopters.
Page 92
81
APPENDIX A: UCF CONSENT FORM
Page 94
83
APPENDIX B: APPROVAL OF HUMAN RESEARCH
Page 95
84
APPENDIX C: SUBJECTIVE QUESTIONNAIRE (NASA-TLX)
Page 99
88
APPENDIX D: COLLECTED DATA
Data Set #1
Page 102
91
APPENDIX E: STATISTICAL TEST RESULTS
Page 106
95
REFERENCES
Ahmadi, K. & Alireza, K. (2007). Stress and job satisfaction among Air Force military pilots.
Journal of Social Sciences, 3(3), 159-163.
Airbus. (2006). A318 – Steep approach operation. Retrieved from
http://www.smartcockpit.com/.../A318_Steep_Approach_Operations.pdf.
Akselrod, S., Golden, D. S., Ubel, F. A., Shannon, D. C. & Cohen, R. J. (1981). Power
spectrum analysis of heart rate fluctuation: A quantitative probe of beat to beat
cardiovascular control. Science, 213(4504), 220-222.
Andrew, F. M., & Farris, G. F. (1972). Time pressure and performance of scientists and
engineers: A five year panel study. Organizational Behavior and Human Performance,
8(2), 185-200.
Bainbridge, L. (1974). The adaptation of cognitive processes to task demands and mental
capacity: Some reasons for the lack of correlation between objective and subjective mental
workload. Le Travail Humain, 37 (2), 279-302.
Battiste, V., & Bortolussi, M. (1988). Transport pilot workload: A comparison of two
subjective techniques. Proceedings of the Human Factors and Ergonomics Society 32nd
Annual Meeting (pp. 150-154). Santa Monica, CA: Human Factors Society and Ergonomic
Society.
Bennett, C. T., & Schwirzke, M. (1992). Analysis of accidents during instrument approaches.
Aviation, Space, and Environmental Medicine, 63(4), 253-261.
Boehm-Davis, D. A., Casali, J. G., Kleiner, B. M., Lancaster, J. A., Saleem, J. J., &
Wochinger, K. (2007). Pilot performance, strategy, and workload while executing
approaches at steep angles and with lower landing minima. Human Factors, 49(5), 759-
772.
Borg, G. A. (1982). Psychophysical bases of perceived exertion. Medicine and Science in
Sports and Exercise, 14(5), 377-381.
Page 107
96
Brotheridge, C. M. (2001). A comparison of alternative models of coping: Identifying
relationships among coworker support, workload, and emotional exhaustion in the
workplace. International Journal of Stress Management, 8(1), 1-14.
Byers, J. C., Bittner, A. C., & Hill, S. G. (1989). Traditional and raw Task Load Index (TLX)
correlations: Are paired comparisons necessary? In A. Mital (Ed.), Advances in industrial
ergonomics and safety: 1 (pp.481-485). London, UK: Taylor & Francis.
Calvert, E. S. (1954). Visual judgments in motion. The Journal of Navigation, 7(3), 233-251.
Carlisle, D. (2001). Pilots stress and what to do about it. Business and commercial aviation,
89(5), 92-97.
Cerutti, S., Bianchi, A. M., & Mainardi, L. T. (1995). Spectral analysis of the heart rate
variability signal. In M. Malik, A. J. Camm (Eds), Heart Rate Variability (pp.63-74)
Armonk, NY: Futura Publishing company, Inc.
Chi, M. T. H., Glaser, R., & Farr, M. J. (1988). The Nature of Expertise. Hillsdale, New
Jersey: Lawrence Erlbaum Associate Publishers.
Christ, R. E., Hill, S. G., Byers, J. C., Lavecchia, H. M., Zaklad, A. L., & Bittner A. C.
(1993). Applications and validation of workload assessment techniques (Tech. Rep. No.
974). Alexandria, VA: U.S. Army Research Institute for the Behavioral and Social
Sciences.
Cnossen, F., Meijman, T., & Rothengatter, T. (2004). Adaptive strategy changes as a function
of task demands: A study of car drivers. Ergonomics, 47(2), 218-236.
Collet, C., Averty, P., & Dittmar, A. (2009). Autonomic nervous system and subjective
ratings of strain in air-traffic control. Applied Ergonomics, 40(1), 23-32.
Cooper, G. E., & Harper, R. P. (1969). The use of pilot rating in the evaluation of aircraft
handling qualities (NASA TN-D-5153). Moffett Field, CA: NASA Ames Research Center.
Corlett, E. N. & Bishop, R. P. (1976). A technique for assessing postural discomfort.
Ergonomics, 19(2), 175-182.
Page 108
97
Corwin, W. H., Sandry-Garza, D. L., Biferno, M. H., Boucek, G. P., Logan, A. L., Jonsson, J.
E., & Metalis, S. A. (1989). Assessment of crew workload measurement methods,
techniques, and procedures: Process, methods and results (Report WRDC-TR-89-7006).
Wright-Patterson Air Force Base, OH: Wright Research and Development Centre, Air
Force Systems Command.
Cox-Fuenzalida, L. E., Swickert, R., & Hittner, J. B. (2004). Effects of neuroticism and
workload history on performance. Personality and Individual Differences, 36(2), 444-456.
Cox-Fuenzalida, L. E. (2007). Effect of workload history on task performance. Human
Factors, 49(2), 277-291.
Cuevas, H. (2003). The pilot personality and individual difference in the stress response.
Proceedings of the Human Factors and Ergonomics Society 47th Annual Meetings
(pp.1092-1096). Santa Monica, CA: Human Factors and Ergonomics Society.
Cumming, R. W., & Croft, P. G. (1973). Human information processing under varying task
demand. Ergonomics, 16(5), 581-586.
Dahlstrom, N., & Nahlinder, S. (2006). A comparison of two recorders for obtaining in-flight
heart rate data. Applied Psychophysiology and Biofeedback, 31(3), 273-279.
DiDomenico, A., & Nussbaum, M. A. (2008). Interactive effects of physical and mental
workload on subjective workload assessment. International Journal of Industrial
Ergonomics, 38(11-12), 977-983.
Dussault, C., Jouanin, J. C., Philippe, M., & Guezennec, C. Y. (2004). EEG and ECG
changes during selected flight sequences. Aviation, Space, and Environmental Medicine,
75(10), 889-897.
Dussault, C., Jouanin, J. C., Philippe, M., & Guezennec, C. Y. (2005). EEG and ECG
changes during simulator operation reflect mental workload and vigilance. Aviation, Space,
and Environmental Medicine, 76(4), 344-351.
Page 109
98
Edens, E. S. (1992). Individual differences underlying pilot cockpit error (Doctorial
dissertation, George Mason University). Retrieved from
http://oai.dtic.mil/oai/oai?verb=getRecord&metadataPrefix=html&identifier=ADA236107.
Elmenhorst, E. M., Vejvoda, M., Maass, H., Wenzel, J., Plath, G., Schubert, E., & Basner, M.
(2009). Pilot workload during approaches: Comparison of simulated standard and noise-
abatement profiles. Aviation, Space, and Environmental Medicine, 80(4), 364-370.
Farmer, E. W., van Rooij, J., Riemersma, J., Jorna, P., & Moraal, J. (2000). Handbook of
Simulator-Based Training. Brookfield, VT: Ashgate Publishing Limited.
Fauvel, J. P., Cerutti, C., Quelin, P., & Laville, M. (2000). Mental stress-induced increase in
blood pressure is not related to baroreflex sensitivity in middle-aged healthy men. Journal
of Hypertension, 35(4), 887-891.
Federal Aviation Administration. United States standard for terminal instrument procedures
(TERPS). Retrieved from
http://www.faa.gov/regulations_policies/orders_notices/index.cfm/go/document.informatio
n/documentID/11698.
Fitts, P. M. (1966). Cognitive aspects of information processing: III. Set for speed versus
accuracy. Journal of Experimental Psychology, 71(6), 849-857.
Fisk, A. D., & Rogers, W. A. (1992). The application of consistency principles for the
assessment of skill development. In J. W., Regian, & V. J., Shute (Eds), Cognitive
approaches to automated instruction (pp 171-194). Hillsdale, NJ: Lawrence Erlbaum
Associates.
Foyle, D. C., Kaiser, M. K., & Johnson, W. W. (1992). Visual cues in low-level flight:
Implication for pilotage, Training, Simulation, and Enhanced/Synthetic vision system.
From American Helicopter Society 48th Annual Forum (pp. 253-260).
Frasca international, Inc, 2010, Qualification approval guide document (No. CERT 144253
Rev.B).
Page 110
99
Gawron, V. J., Schiflett, S. G., & Miller, J. C. (1989). Measures of in-flight workload. In R.
S., Jensen (Ed.), Aviation psychology (pp. 240-287). Aldershot, Brookfield: Gower
Technical.
Gibb, R., & Gray, R. (2006). Terrain orientation theory for a visual approach to landing.
Proceedings of the Human Factors and Ergonomics Society 50th Annual Meeting. Santa
Monica, CA: Human Factors and Ergonomics Society.
Goldberg, R. A., & Stewart, M. R. (1980). Memory overload or expectancy effect?
„Hysteresis‟ revisited. Ergonomics, 23(12), 1173-1178.
Gopher, D. & Donchin, E. (1986). Workload-An examination of the concept. In K. R., Boff,
L., Kaufman, & J. P., Thomas (Eds.), Handbook of Perception and Human
performance,II(pp.41-1 to 41-49). New York, NY: Wiley.
Gundel, A., Polyakov, V. V., & Zulley, J. (1997). The alteration of human sleep and
circadian rhythms during space flight. Journal of Sleep Research, 6(1), 1-8.
Hancock, P. A. & Warm, J. S. (1989). A dynamic model of stress and sustained attention.
Human Factors, 31(5), 519-537.
Hankins, T. C., & Wilson, G. F. (1998). A comparison of heart rate, eye activity, EEG and
subjective measures of pilot mental workload during flight. Aviation, Space, and
Environmental Medicine, 69(4), 360-367.
Hart, S. G., & Hauser, J. R. (1987). In-flight application of three pilot workload measurement
techniques. Aviation, Space, and Environmental Medicine, 58(5), 402-410.
Hart, S. G., & Staveland, L. E. (1988), Development of NASA-TLX (Task Load Index):
Results of Empirical and Theoretical Research. In P. A., Hancock, N., Meshkati (Eds.),
Human mental workload (pp. 139-183). New York, NY: Elsevier.
Hasbrook, A. H., & Rassmussen, P. G. (1970). Pilot heart rate during in-flight simulated
instrument approaches in a general aviation aircraft. Aerospace Medicine, 41(10), 1148-
1152.
Page 111
100
Hatton, C., Brown, R., Caine, A., & Emerson, E. (1995). Stressors, coping strategies, and
stress related outcomes among direct care staff in staffed houses for people with learning
disabilities. Mental Handicap Research, 8(4), 252-271.
Heinrich, H. W., Petersen, D., & Roos, N. (1931). Industrial accident prevention: A safety
management approach (1st ed.). New York, NY: McGraw-Hill.
Hendy, K. C., Farrell, P. S. E., & East, K. P. (2001). An information-processing model of
operator stress and performance. In P. A., Hancock, & P. A., Desmond (Eds.), Stress,
Workload, and Fatigue (pp.34-80). Mahwah, NJ: Lawrence Erlbaum Associate.
Henn, S. M. (1996), MAI 34/01 p.4317, Pacific Lutheran University.
Hilburn, B., Jorna, P. G. A. M., & Parasuraman, R. (1995). The effect of advanced ATC
automation on mental workload and monitoring performance: An empirical investigation
in Dutch airspace. Proceedings of the 8th International Symposium on Aviation Psychology,
1, 387-391. Columbus, OH: The Ohio State University.
Hill, S. G., Lavecchia, H. P., Bittner, A. C., Byers, J. C., Zaklad, A. L., & Christ R. E., (1992).
Comparison of four subjective workload rating scales. Human Factors, 34(4), 429-439.
Hockey, R. (1983). Stress and fatigue in human performance. Chichester, New York: Wiley.
Howell, D. C. (1987). Statistical Methods for Psychology (2nd ed.). Boston, MA: Duxbury
Press.
Humphrey, J. H. (1998). Job Stress. Needman Heights, MA: Allyn & Bacon.
International Civil Aviation Organization. (2004). Outlook for air transport to the year 2015.
Retrieved from http://www.icao.int/icao/en/atb/fep/C304_Outlook_En.pdf.
International Civil Aviation Organization. (2010). Annual report of the council(2009).
Retrieved from http://www.icao.int/annualreports/.
Jamal, M. (1985). Relationship of job stress to job performance: A study of managers and
Blue-Collar workers. Human Relations, 38(5), 409-424.
Page 112
101
Johnson, W. W., & Phatak, A. V. (1989). Optical variables and control strategy used in a
visual hover task. Proceeding of the IEEE International Conference on Systems, Man and
Cybernetics (pp. 719-724). Cambridge, MA: Institute of Electrical and Electronics
Engineers.
Jorgensen, A. H., Garde, A. H., Laursen, B., & Jensen, B. R. (1999). Applying the concept of
workload to IT work. From the Virtual Proceedings of CybErg: The Second International
Virtual Conference on Ergonomics. Perth, Australia: International Ergonomics
Association/Curtin University of Technology.
Kakimoto, Y., Nakamura, A., Tarui, H., Nagasawa, Y., & Yagura, S. (1988). Crew workload
in JASDF C-1 transport flights: 1. Change in heart rate and salivary cortisol. Aviation,
Space, and Environmental Medicine, 59(6), 511-516.
Kamath, M. V., & Fallen, E. L. (1993). Power spectral analysis of heart rate variability: A
non-invasive signature of cardiac autonomic functions. Critical Reviews in Biomedical
Engineering, 21(3), 245-311.
Kanki, B. G. (1996). Stress and aircrew performance: A team-level perspective. In J. E.,
Driskell, & E., Salas (Eds.), Stress and human performance (pp. 127-162). Mahwah, NJ:
Lawrence Erlbaum Associates.
Kantowitz, B. H., & Sorkin, R. D. (1983), Human factors: understanding people-system
relationships. NewYork, NY: Wiley.
Kantowitz, B. H. (1987). Mental workload. In P. A. Hancock (Ed.), Human Factors
Pshychology (pp. 81-121). New York, NY: Elsevier Science Pub. Co.
Kantowitz, B. H., & Casper, P. A. (1988). Human workload in aviation. In E. L., Wiener, &
D. C., Nagel (Eds.), Human factors in aviation (pp. 157-162). San Diego, CA: Academic
Press.
Katz, L. C. (1997). Assessment of aircrew stress (Report No. 97-37). Fort Rucker, Alabama:
U.S. Army Aeromedical Research Laboratory.
Page 113
102
Kirmeyer, S. L., & Dougherty, T. W. (1988). Workload, tension, and coping: Moderating
effects of supervisor support. Personnel Psychology, 41(1), 125-139.
Kitney, R. & I., Rompelman, O. (1977). Analysis of the interaction of the human blood
pressure and thermal systems. In J., Perkins (Ed.), Biomedical Computing (pp. 49-54).
London, UK: Pitman Medical.
Kraft, C. L. (1978). A psychophysical contribution to air safety: Simulator studies of visual
illusions in night visual approaches. In: H. L., Pick, H. W., Leibowitz, J. E., Singer, A.,
Steinschneider., & H. W., Stevenson (Eds.). Psychology: From Research to Practice
(pp.363-385). New York, NY: Plenum Press.
Lazarus, R. S., & Folkman, S. (1984). Stress, appraisal, and coping. New York, NY:
Springer.
Lewis, M. F., & Mertens, H. W. (1979). Pilot performance during simulated approaches and
landings made with various computer-generated visual glide path indicators. Aviation,
Space, and Environmental Medicine, 50(10), 991-1002.
Lindholm, E., & Cheatham, C. M. (1983). Autonomic activity and workload during learning
of a simulated aircraft carrier landing task. Aviation, Space, and Environmental Medicine,
54(5), 435-439.
Lintern, G., & Walker, M. B. (1991). Scene content and runway breadth effects on simulated
landing approaches. The International Journal of Aviation Psychology, 1(2), 117-132.
Lirdan, G., & Koonce, J. M. (1991). Display magnifications for simulated landing approaches.
The International Journal of Aviation Psychology, 1(1), 59-72.
Livingston, C., & Borko, H. (1989). Expert-novice differences in teaching: A cognitive
analysis and implications for teacher education. Journal of Teacher Education, 40(4), 36-
42.
Page 114
103
Lysaght, R. J., Hill, S. G., Dick, A. O., Plamondon, B. D., Wherry, R. J., Zaklad, A. L., &
Bittner, A. C. (1989). Operator workload: Comprehensive review and evaluation of
operator workload methodology (ARI Technical Report 851). Fort Bliss, TX: US Army
Research Institute, Field unit.
Magnusson, S. (2002). Similarities and differences in psychophysiological reactions between
simulated and real air-to-ground missions. The International Journal of Aviation
Psychology, 12(1), 49-61.
Malliani, A., Pagani, M., Lombardi, F., & Cerutti, S. (1991). Cardiovascular neural regulation
explored in the frequency domain. Circulation, 84, 482-492.
McCormick, E. J., & Sanders, M. S. (1993). Human factors in Engineering and Design (7th
ed.). New York: McGraw-Hill, Inc.
Meglino, B. M. (1977). Stress and performance: Are they always incompatible? Supervisory
Management, 22(3), 2-12.
Mertens, H. W. (1978). Comparison of the visual perception of a runway model in pilots and
non-pilots during simulated night landing approach. Aviation, Space, and Environmental
Medicine, 49(9), 1043-1055.
Meshkati, N., Hancock, P. A., Rahimi, M., & Dawes, S. M. (1995). Techniques in mental
workload assessment. In J. R. Wilson, & E. N., Corlett (Eds.), Evaluation of Human Work:
a practical ergonomics methodology (2nd ed.)(pp.749-782). Bristol, PA: Taylor & Francis
Ltd.
Moray, N. (1988). Mental workload since 1979. International Review of Ergonomics, 2, 123-
150.
Moray, N., Dessouky, M. I., Kijowski, B. A., & Adapathya, R. (1991). Strategic behavior,
workload, and performance in task scheduling. Human Factors, 33, 607-629.
Page 115
104
Moroney, W. F., Biers, D. W., Eggemeier, F. T., & Mitchell, J. A. (1992). Comparison of two
scoring procedures with the NASA Task Load Index in a simulated flight task.
Proceedings of the IEEE National Aerospace Electronics Conference (pp. 734-740).
Dayton, OH: Institute of Electrical and Electronics Engineers.
Moroney, W. F., Biers, D.W., & Eggemeier, F. T. (1995). Some measurement and
methodological considerations in the application of subjective workload and measurement
techniques. The International Journal of Aviation Psychology, 5(1), 87-106.
Murai, K., Hayashi, Y., Nagata, N., & Inokuchi, S. (2004). The mental workload of a ship's
navigator using heart rate variability. Interactive Technology and Smart Education, 1(2),
127 - 133.
Muse, L., Harris, S. & Field, H. (2003). Has the inverted-U theory of stress and job
performance had a fair test? Human Performance, 16(4), 349-364.
Nagel, D. C. (1988). Human error in aviation operations, In E. L., Wiener, & D. C., Nagel
(Eds.), Human Factors in Aviation (pp.263-303). San Diego, CA: Academic Press.
Nataupsky, M., & Abbott, T. S. (1987). Comparison of workload measures on computer-
generated primary flight displays. Proceedings of the Human Factors and Ergonomic
Society 31st Annual Meeting (pp. 548-552). Santa Monica, CA: Human Factors and
Ergonomic Society.
National Aeronautic and Space Administration. (2004). Small aircraft transportation system.
Retrieved from http://www.nasa.gov/centers/langley/news/factsheets/SATS.html.
National Transportation Safety Board, (1998 to 2005), Annual review of aircraft accident
data: US air carrier operations. Retrieved from http:// www.ntsb.gov/Publictn/A_stat.htm.
Nygren, T. E. (1991). Psychometric properties of subjective workload measurement
techniques: Implications for their use in the assessment of perceived mental workload,
Human Factors, 33(1), 17-33.
O'Hare, D., Wiggins, M., Batt, R., & Morrison, D. (1994). Cognitive failure analysis for
aircraft accident investigation. Ergonomics, 37(11), 1855-1869.
Page 116
105
Opmeer, C. H., Krol, J. P. (1973). Towards an objective assessment of cockpit workload. I.
Physiological variables during different flight phases. Aerospace Medicine, 44(5), 527-532.
Orasanu, J. M., & Backer, P. (1996). Stress and Military Performance. In J. E., Driskell, & E.,
Salas (Eds.), Stress and Human Performance (pp. 89-125). Mahwah, NJ: Lawernce
Erlbaum Associates.
Oshima, C. R., & Lintern, G. (1992). Effects of scene content and horizon on glide slope
control. Proceeding of the IEEE International Conference on Systems, Man, and
Cybernetics. Chicago, IL: Institute of Electrical and Electronics Engineers.
Pagani, M., Lombardi, F., Guzzetti, S., (1986). Power spectral analysis of heart rate and
arterial pressure variabilities as a marker of sympatho-vagal interaction in man and
conscious dog. Circulation Research, 59(2), 178-193.
Pagani, M., Furlan, R., Pizzinelli, P., Crivellaro, W., Cerutti, S., & Malliani, A. (1989).
Spectral analysis of R-R and arterial pressure variabilities to assess sympatho-vagal
interaction during mental stress in humans. Journal of Hypertension, Supplement, 7(6), 14-
15.
Palmisano, S., & Gillam, B. (2005). Visual perception of touchdown point during simulated
landing. Journal of Experimental Psychology: Applied, 11(1), 19-32.
Paritala, S. A. (2009). Effects of physical and mental tasks on heart rate variability (Master
Thesis, Louisiana State University). Retrieved from http://etd.lsu.edu/docs/available/etd-
08222009-204359/unrestricted/thesis.pdf.
Penaz, J., Roukenz, J., & Van, D. W. H. J. (1968). Spectral analysis of some spontaneous
rhythms in the circulation. In H., Drischel, & N., Tiedt (Eds.), Biokybernetik (pp.233).
Leipzig, Germany: Karl Marx University.
Petersen, D. (1996). Human-error reduction and safety management (3rd ed.). New York,
NY: Van Nostrand Reinhold.
Polar Electro. (2010). S810i manual. Retrieved from
http://www.polar.fi/en/support/product_support?product=3126.
Page 117
106
Rasmussen, J. (1983). Skills, rules, and knowledge; signals, signs, and symbols, and other
distinctions in human performance models. IEEE Transactions on Systems, Man, and
Cybernetics, 13, 257-266.
Reardon, K. A. (1988). The effects of nested texture on a landing judgment task. Proceedings
of the Human Factors and Ergonomic Society 32nd Annual Meeting (pp. 10-14). Santa
Monica, CA: Human Factors Society.
Reid, G. B., Shingledecker, C. A., & Eggemeier, F. T. (1981). Application of conjoint
measurement to workload scale development. Proceedings of the Human Factors Society
25th Annual Meeting (pp.522-525). Santa Monica, CA: Human Factors Society.
Reason, J. (1990). Human Error. Cambridge, UK: Cambridge University Press.
Rob, E. (2001). Steep approach at London city airport. Retrieve from
http://www.storksmt.com/downloads/Aerospace/FS/.../6-2104142/PAG_22.PDF.
Roman, J. A. (1965). Risk and responsibility as factors affecting heart rate in test pilots:
Flight research program 2. Aerospace Medicine, 36, 518-523.
Roscoe, A. H. (1975). Heart rate monitoring of pilots during steep-gradient approaches.
Aviation, Space, and Environmental Medicine, 46(11), 1410-1413.
Roscoe, A. H. (1993). Heart rate as a psychophysiological measure for in-flight workload
assessment. Ergonomics, 36, 1055-1062.
Salthouse, T. A. (1987). The role of experience in cognitive aging. Annual review of
gerontology and geriatrics, 7, 135-158.
Sanders, A. F. (1983). Towards a model for stress and human performance. Acta
Psychologica, 53, 61-97.
Sarno, K., Wickens, C. D. (1995). The role of multiple resources in predicting time-sharing
efficiency: An evaluation of three workload models in a multiple task setting. International
Journal of Aviation Psychology, 5(1), 107-130.
Page 118
107
Sato, N., Miyake, S., Akatsu, J., & Kumashiro, M. (1995). Power spectral analysis of heart
rate variability in healthy young women during the normal menstrual cycle. Psychosomatic
Medicine, 57(4), 331-335.
Sauvet, F., Jouanin, J. C., Langrume, C., Van Beers, P., Papelier, Y., & Dussault, C. (2009).
Heart Rate Variability in novice pilots during and after a multi-leg cross-country flight.
Aviation, Space, and Environmental Medicine, 80(10), 862-869.
Sayers, B. M. (1973). Analysis of heart rate variability. Ergonomics, 16, 17-32.
Schvaneveldt, R. W. (1969). Effects of complexity in simultaneous reaction-time tasks.
Journal of Experimental Psychology, 81, 289-296.
Schvaneveldt, R. W., Reid, G. B., Gomez, R. L., & Rice, S. (1998). Modeling mental
workload (AFRL-HE-WP-SR-2000-1000). Wright Patterson AFB, OH: US Airforce
Research Laboratory Human Effectiveness Directorate Crew System Interface Division.
Sekiguchi, C., Handa, Y., Gotoh, M., Kurihara, Y., Nagasawa, A., & Kuroda, I. (1978).
Evaluation method of mental workload under flight condition. Aviation, Space, and
Environmental Medicine, 49(7), 920-925.
Seong, J. S., Lee, T. M., Shin, W. S., Kim, Y. R., Yoon, Y. R., & Yoon, H. M. (2004). The
Analysis of Mental Stress using Time-Frequency Distribution of Heart Rate Variability
Signal. Proceedings of the 26th Annual International Conference of the IEEE EMBS. San
Francisco, CA: Institute of Electrical and Electronics Engineers.
Serfaty, D., Entin, E. E., & Volpe, C. (1993). Adaptation to stress in team decision making
and coordination. Proceedings of the Human Factors and Ergonomics Society 37th annual
meeting (pp. 1228-1232). Santa Monica, CA: Human Factors and Ergonomics Society.
Searle, B., Bright, J. E. H., & Bochner, S. (1999). Testing the 3-factor model of occupational
stress: The impact of demands, control and social support on a mail sorting task. Work &
Stress, 13(3), 268-279.
Searle, B., Bright, J. E. H., & Bochner, S. (2001). Helping people to sort it out: The role of
social support in the job strain model. Work & Stress, 15(4), 328-346.
Page 119
108
Senders, J. W., & Moray, N. P. (1991). Human Error: Cause, Prediction and Reduction.
Hillsdale, NJ: Lawrence Erlbaum Associates.
Sheridan, T. B. (1979). Definitions, models and measures of human workload. In Moray, N.
(Ed.). Mental Workload: Its theory and measurement (pp.219-233). New York, NY:
Plenum Press.
Shively, R., Battiste, V., Matsumoto, J., Pepiton, D., Bortolussi, M., & Hart, S. G. (1987). In
flight evaluation of pilot workload measures for rotorcraft research. Proceedings of the
Fourth Symposium on Aviation Psychology (pp. 637-643). Columbus, OH: Department of
Aviation, Ohio State University.
Shriver, B. M. (1953). Age and behavior (Research project No.21-0202-005). Randolph Field,
TX: USAF School of Aviation Medicine.
Srivastava, A. K. & Krishna, A. (1991). A test of inverted U hypothesis of stress performance
relationship in the industrial context. Psychological Studies, 36(1), 34-38.
Stanton, N. A., Salmon, P. M., Walker, G. H., & Jenkins, D. P. (2009). Genotype and
phenotype schemata as models of situation awareness in dynamic command and control
teams. International Journal of Industrial Ergonomics, 39(3), 480-489.
Stein, E. S. (1984). The measurement of pilot performance: A master-journeyman approach
(DOT/FAA/CT-83/15). Atlantic, NJ: FAA Technical Center.
Stern, J. A., Walrath, L. C., & Goldstein, R. (1984). The endogenous eyeblink.
Psychophysiology, 21(1), 22-33.
Sterman, M. B., Mann, C. A., Kaiser, D. A., & Suyenobu, B. Y. (1994). Multiband
topographic EEG analysis of a simulated visuo-motor aviation task. International Journal
of Psychophysiology, 16(1), 49-56.
Steptoe, A., Evans, O., & Fieldman, G. (1997). Perceptions of control over work: Psycho-
physiological response to self-paced and externally-paced tasks in an adult population
sample. International Journal of Psychophysiology, 25(3), 211-220.
Page 120
109
Stokes, A. F., Kemper, K., & Kite, K. (1997). Aeronautical decision making, cue recognition,
and expertise under time pressure. In C. Zsambok & G. Klein (Eds.), Naturalistic decision
making (pp. 183-196). Mahwah, NJ: Lawrence Erlbaum Associates.
Sweller, J., Van Merriënboer, J., & Paas, F. (1998). Cognitive architecture and instructional
design. Educational Psychology Review, 10(3), 251-296.
Transportation Canada. (2004). Approval of Steep Approach Landing Capability of Transport
Category Aeroplanes, AC 525-011. Retrieved from
http://www.tc.gc.ca/CivilAviation/certification/guidance/525/525-011.htm.
Tsang, P. S., & Johnson, W. W. (1989). Cognitive demand in automation. Aviation, Space,
and Environmental Medicine, 60, 130-135.
Tyler, P., & Cushway, D. (1995). Stress in nurses: The effects of coping and social support.
Stress Medicine, 11(4), 243-251.
Ungs, T. J., & Sangal, S. P. (1990). Perception of near earth altitudes by pilots: ascending vs.
descending over both a land and water surface. Aviation Space and Environmental
Medicine, 61(12), 1098-1101.
Urban, J. M., Weaver, J. L., Bowers, C. A., & Rhodenizer, L. (1996). Affects of workload
and structure on team processes and performance: Implications for complex team decision
making. Human Factors, 38(2), 300-310.
Veltman, J. A., & Gaillard, A. W. (1996). Physiological indices of workload in a simulated
flight task. Biological Psychology, 42(3), 323-342.
Veltman, J. A. (2002). A comparative study of psychophysiological reactions during
simulator and real flight. The International Journal of Aviation Psychology, 12(1), 33-48.
Vidulich, M. A., & Tsang, P. S. (1987). Absolute magnitude estimation and relative judgment
approaches to subjective workload assessment. Proceedings of the Human Factors and
Ergonomics Society 31st Annual Meeting (pp.1057-1061). Santa Monica, CA: Human
Factors Society.
Page 121
110
Vidulich, M. A., & Bortolussi, M. R. (1988). Speech recognition in advanced rotorcraft:
Using speech controls to reduce manual control overload. Proceedings of the American
Helicopter Society National Specialists’ Meeting-Automation Applications of Rotorcraft.
Atlanta, GA: Southeast Region of the American Helicopter Society.
Vicente, K. J., Thornton, D. C., & Moray, N. (1987). Spectral analysis of sinus arrhythmia: A
measure of mental effort. Human Factors, 29(2), 171-182.
Vroom, V. H. (1964). Work and Motivation. New York, NY: Wiley Press.
Watson, A. R., Ntuen, C., & Park, E. (1996). Effects of task difficulty on pilot workload.
Computers and Industrial Engineering, 31(1), 487-490.
Wickens, C. D., & Yeh, Y. Y. (1982). The dissociation of subjective ratings and performance.
Proceedings of the IEEE International Conference on Cybernetics and Society (pp. 584-
587). Seattle, WA: Institute of Electrical and Electronics Engineers.
Wickens, C. D., & Hollands, J. G. (2000). Engineering Psychology and Human Performance
(3rd ed.). Upper Saddle River, NJ: Prentice Hall.
Wiegmann, D. A., & Shappell, S. C. (1997). Human Factors Analysis of post-accident data:
Applying theoretical taxonomies of human error. The International Journal of Aviation
Psychology, 7(1), 67-81.
Wiegmann, D. A, & Shappell, S. C. (2001). Human error perspectives in aviation.
International Journal of Aviation Psychology, 11(4), 341-357.
Wierwille, W. S., & Casali. (1983). A validated rating scale for global mental workload
measurement applications. Proceedings of the Human Factors and Ergonomic Society 27th
Annual Meeting (pp. 129-133). Santa Monica, CA: Human Factors Society.
Wiggins, M. W., & O‟ Hare, D. (1995). Expertise in aeronautical weather-related decision
making: A cross-sectional analysis of general aviation pilots. Journal of Experimental
Psychology: Applied, 1(4), 304-319.
Page 122
111
Wilson, G. F. (1993). Air-to-ground training missions: A psycho-physiological workload
analysis. Ergonomics, 36(9), 1071-1087.
Wilson, G. F., & Hankins, T. (1994). EEG and subjective measures of private pilot workload.
Proceedings of the Human Factors and Ergonomic Society 38th Annual Meeting (pp.1322-
1330). Santa Monica, CA: Human Factors Society.
Wilson, G. F. (2001). Psychophysiological in-flight monitoring, In J., Fahrenberg, M.,
Myrtek (Eds.), Progress in ambulatory assessment: Computer-assisted psychological and
psychophysiological methods in monitoring and field studies (pp.435-454). Seattle, WA:
Hogrefe & Huber.
Wilson, G. F., (2002a). Psychophysiological test methods and procedures, In S. G., Charlton,
T. G., O‟Brien (Eds.), Handbook of human factors testing and evaluation (2nd ed.)
(pp.127-156). Mahwah, NJ: Lawrence Erlbaum Associates.
Wilson, G. F. (2002b). An analysis of mental workload in pilots during flight using multiple
psychophysiological measures. The International Journal of Aviation Psychology, 12(1), 3-
18.
Winer, B. J. (1971). Statistical Principles in Experimental design (2nd ed.). New York, NY:
McGraw-Hill.
Woods, D. D. (1990). Modeling and predicting human error. In J., Elkind, S., Card, J.,
Hochberg, & B., Huey (Eds.), Human performance models for computer-aided
engineering (pp.248-274). Boston, MA: Academic Press.
Xie, D., & Salvendy, G. (2000). Prediction of mental workload in single and multiple tasks
environments. International Journal of Cognitive Ergonomics, 4(3), 213-242.
Xiao, Y, Mackenzie, C. F., Harper, B. D. (1996). Simulator limitations and their affects on
decision making. Proceedings of the Human Factors and Ergonomics 40th Annual
Meeting (pp.747-751). Santa Monica, CA: Human Factors and Ergonomics Society.
Page 123
112
Yacavone, D. W. (1993). Mishap trends and cause factors in naval aviation: A review of
naval safety center data, 1986-90. Aviation, Space, and Environmental Medicine, 64(5),
392-395.
Yao, Y. J., Chang, Y. M., Xie, X. P., Cao, X. S., Sun, X. O., & Wu., Y. H. (2008). Heart rate
and respiration responses to real traffic pattern flight. Applied Psychophysiology and
Biofeedback, 33(4), 203-209.
Yerkes, R. M, Dodson, J. D. (1908). The relation of strength of stimulus to rapidity of habit-
formation. Journal of Comparative Neurology and Psychology, 18(5), 459-482.
Ylonen, H., Lyytinen, H., Leino, T., Leppaluoto, J., & Kuronen, P. (1997). Heart rate
responses to real and simulated BA Hawk 51 Flight. Aviation, Space, and Environmental
Medicine, 68(7), 601-605.