17 th Australasian Fluid Mechanics Conference Auckland, New Zealand 5-9 December 2010 Effects of Free-Stream Vorticity on the Blasius Boundary Layer D.A. Pook, J.H. Watmuff School of Aerospace, Mechanical & Manufacturing Engineering RMIT University, Victoria 3083, Australia Abstract CFD results explain the mystery associated with strong streaks in a boundary layer observed experimentally by Watmuff [8] from weak wakes originating upstream of a wind-tunnel contraction. The CFD results show the generation of streamwise vorticity from normal vorticity passing through a wind-tunnel contraction. Introduction Watmuff [8] experimentally demonstrated that weak, almost indiscernible non-uniformity in the free-stream can cause significant local thickening of the boundary layer in the region of a wake. Steady wakes (Re <40) were created with thin wires strung perpendicular to the leading edge of the test section flat plate boundary layer. A wake introduced by a wire in the test section, 7250 diameters upstream, caused a 15% thickening of the boundary layer measured as, (δ * Streak -δ * Blasius )/ δ * Blasius . Surprisingly, streaks generated from a wire upstream of the wind-tunnel 5:1 two- dimensional contraction caused up to 60% thickening, even though they were an order of magnitude weaker, measured as ΔU/U ∞ =0.1% max. The wakes were also an order of magnitude wider leading Watmuff to suggest the increased sensitivity was possibly due to the boundary layer having a preferred spanwise length scale. Kogan et. al. [5] conducted a similar experiment to [8] with a wire shedding a vortex street and wakes strengths significantly stronger. A thickening of the boundary layer is observed that becomes spanwise asymmetric with increasing wake strength. Spanwise non-uniformity of the boundary layer has been noted in many experimental studies of transitional and turbulent boundary layers and the effect of screen non-uniformity has been linked indirectly to the spanwise non-uniformity. Many pre-transitional layers exhibit Klebanoff modes, a low frequency spanwise variation of the layer often visualised as a streak, and often suspected to play a part in bypass transition. Understanding of the results of [8] may provide some insight into streaks in the layer and free-stream disturbances. Watmuff Experiment Description Watmuff [8] placed a single wire of diameter, d= 24.5μm, 7,250d upstream of flat plate with a super-elliptic leading edge. The Re based on wire diameter was 17 thus creating a steady wake that is accurately predicted as a Gaussian profile using the theory of [2], see Figure 1. The wake profile was measured with a total-head tube traverse, 63mm upstream of the leading edge and ΔU/U ∞ found to be approximately 2%. A steady laminar streak (local thickening of the boundary layer) was observed in the region affected by the wake. A single wire of d=254 μm was then placed 9000d upstream of the leading edge, corresponding to 292mm upstream of the wind tunnel 5:1 two-dimensional contraction. The steady wake (Re d =33.9) from this wire was nearly indiscernible when measure 63mm upstream of the leading edge, ΔU/U ∞ =0.1%. However, the width of the wake was an order of magnitude greater and the corresponding steady streak in the boundary layer was measured to be significantly greater than for the wire in the test section. Assessing the streak in layer as the change in δ * relative to the undisturbed Blasius value, the test section wire wake streak created approximately a 15% thickening while the upstream of the contraction wire wake produced up to 60% thickening. Figure 2 visualises the streaks as δ * surfaces and shows the streak from the upstream wake to grow continually downstream while the test-section wire wake maintains a near constant strength. Figure 1. Wakes from wires measured upstream of the leading edge Figure 2. Left-Top: Test section wake streak δ * surface. Left-Bottom: Streamwise δ * (Blue in streak, Green undisturbed Blasius). Right-Top: Upstream wake streak δ * surface. Right-Bottom: Streamwise δ * Figure 3: Exp configuration. 5:1, 2D, 5th order polynomial contraction. Super-elliptic leading edge, 3.81mm half thickness. Dotted lines are wire locations. * Re δ 0.5 Re x ( ) z mm * Re δ 0.5 Re x 0.5 Re x * Re δ 0.5 Re x * Re δ Test Section Wire Wake Upstream of Contraction Wire Wake 2286 1524 43.5 470 229 Dimensions in mm Not drawn to scale Adjustable slot exit 184
Transcript
17th Australasian Fluid Mechanics Conference
Auckland, New Zealand
5-9 December 2010
Effects of Free-Stream Vorticity on the Blasius Boundary Layer
D.A. Pook, J.H. Watmuff
School of Aerospace, Mechanical & Manufacturing Engineering RMIT University, Victoria 3083, Australia
Abstract
CFD results explain the mystery associated with strong streaks in
a boundary layer observed experimentally by Watmuff [8] from
weak wakes originating upstream of a wind-tunnel contraction.
The CFD results show the generation of streamwise vorticity
from normal vorticity passing through a wind-tunnel contraction.
Introduction
Watmuff [8] experimentally demonstrated that weak, almost
indiscernible non-uniformity in the free-stream can cause
significant local thickening of the boundary layer in the region of
a wake. Steady wakes (Re <40) were created with thin wires
strung perpendicular to the leading edge of the test section flat
plate boundary layer.
A wake introduced by a wire in the test section, 7250 diameters
upstream, caused a 15% thickening of the boundary layer
measured as, (δ*Streak-δ
*Blasius)/ δ
*Blasius. Surprisingly, streaks
generated from a wire upstream of the wind-tunnel 5:1 two-
dimensional contraction caused up to 60% thickening, even
though they were an order of magnitude weaker, measured
as ∆U/U∞=0.1% max. The wakes were also an order of
magnitude wider leading Watmuff to suggest the increased
sensitivity was possibly due to the boundary layer having a
preferred spanwise length scale.
Kogan et. al. [5] conducted a similar experiment to [8] with a
wire shedding a vortex street and wakes strengths significantly
stronger. A thickening of the boundary layer is observed that
becomes spanwise asymmetric with increasing wake strength.
Spanwise non-uniformity of the boundary layer has been noted in
many experimental studies of transitional and turbulent boundary
layers and the effect of screen non-uniformity has been linked
indirectly to the spanwise non-uniformity.
Many pre-transitional layers exhibit Klebanoff modes, a low
frequency spanwise variation of the layer often visualised as a
streak, and often suspected to play a part in bypass transition.
Understanding of the results of [8] may provide some insight into
streaks in the layer and free-stream disturbances.
Watmuff Experiment Description
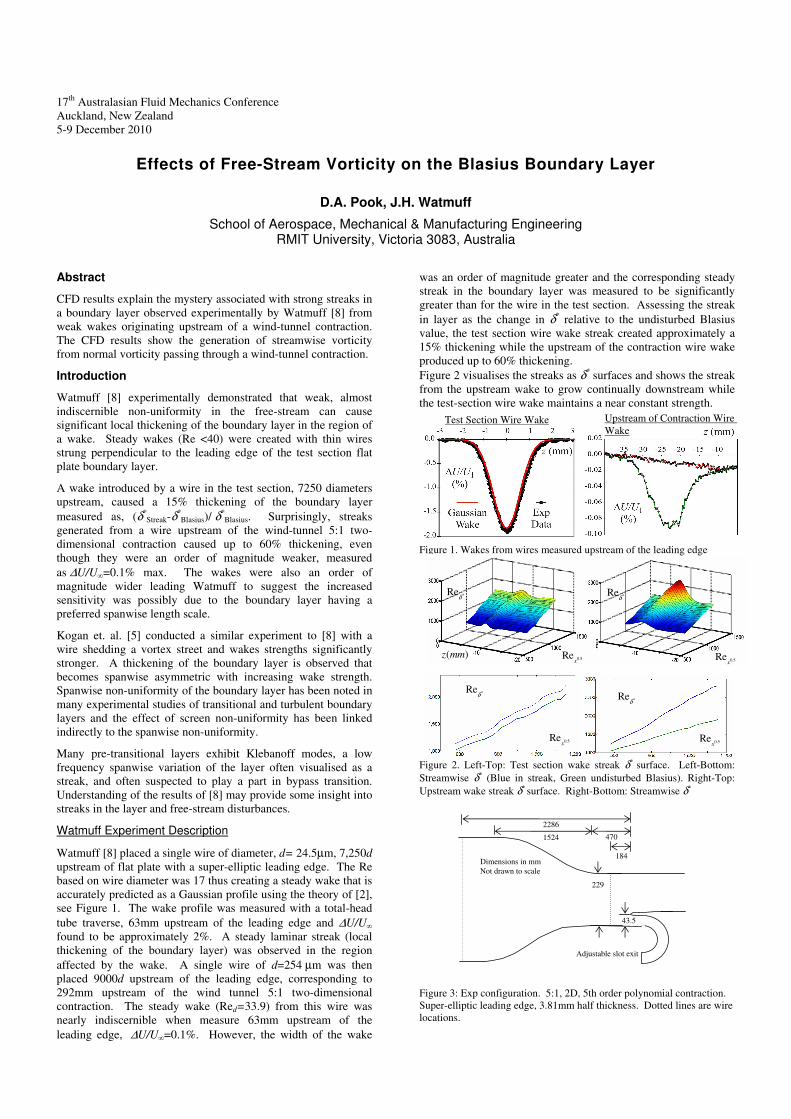
Watmuff [8] placed a single wire of diameter, d= 24.5µm, 7,250d
upstream of flat plate with a super-elliptic leading edge. The Re
based on wire diameter was 17 thus creating a steady wake that is
accurately predicted as a Gaussian profile using the theory of [2],
see Figure 1. The wake profile was measured with a total-head
tube traverse, 63mm upstream of the leading edge and ∆U/U∞
found to be approximately 2%. A steady laminar streak (local
thickening of the boundary layer) was observed in the region
affected by the wake. A single wire of d=254 µm was then
placed 9000d upstream of the leading edge, corresponding to
292mm upstream of the wind tunnel 5:1 two-dimensional
contraction. The steady wake (Red=33.9) from this wire was
nearly indiscernible when measure 63mm upstream of the
leading edge, ∆U/U∞=0.1%. However, the width of the wake
was an order of magnitude greater and the corresponding steady
streak in the boundary layer was measured to be significantly
greater than for the wire in the test section. Assessing the streak
in layer as the change in δ* relative to the undisturbed Blasius
value, the test section wire wake streak created approximately a
15% thickening while the upstream of the contraction wire wake
produced up to 60% thickening.
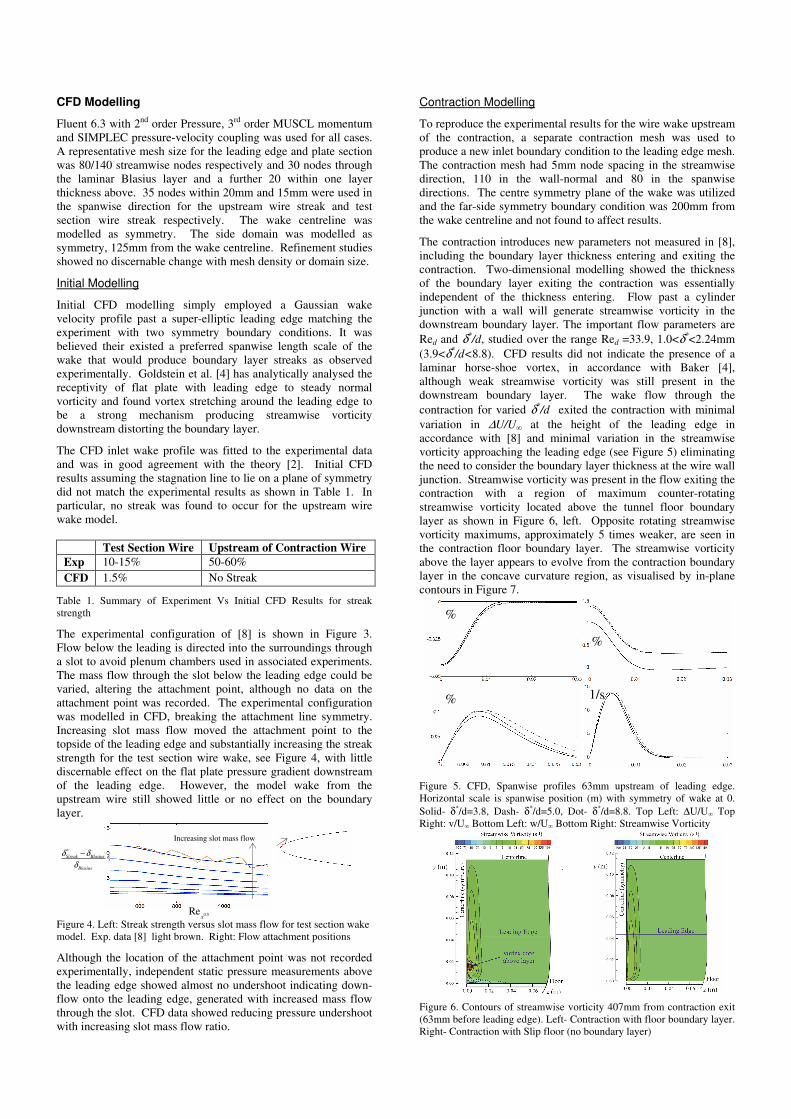
Figure 2 visualises the streaks as δ* surfaces and shows the streak
from the upstream wake to grow continually downstream while
the test-section wire wake maintains a near constant strength.
Figure 1. Wakes from wires measured upstream of the leading edge
Figure 2. Left-Top: Test section wake streak δ* surface. Left-Bottom:
Streamwise δ* (Blue in streak, Green undisturbed Blasius). Right-Top:
Upstream wake streak δ* surface. Right-Bottom: Streamwise δ*
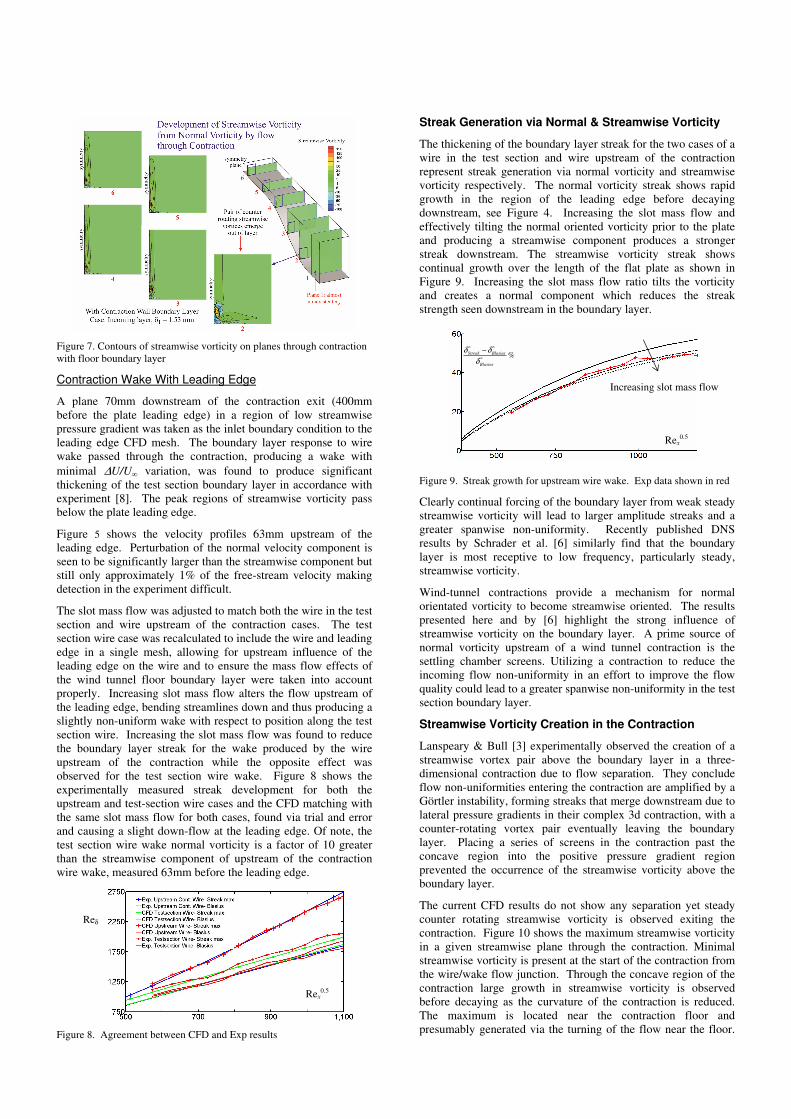
Figure 3: Exp configuration. 5:1, 2D, 5th order polynomial contraction.
Super-elliptic leading edge, 3.81mm half thickness. Dotted lines are wire
locations.
*Reδ
0.5Rex
( )z mm
*Reδ
0.5Rex
0.5Rex
*Reδ
0.5Rex
*Reδ
Test Section Wire Wake Upstream of Contraction Wire
Wake
2286
1524
43.5
470
229
Dimensions in mm
Not drawn to scale
Adjustable slot exit
184
CFD Modelling
Fluent 6.3 with 2nd order Pressure, 3rd order MUSCL momentum
and SIMPLEC pressure-velocity coupling was used for all cases.
A representative mesh size for the leading edge and plate section
was 80/140 streamwise nodes respectively and 30 nodes through
the laminar Blasius layer and a further 20 within one layer
thickness above. 35 nodes within 20mm and 15mm were used in
the spanwise direction for the upstream wire streak and test
section wire streak respectively. The wake centreline was
modelled as symmetry. The side domain was modelled as
symmetry, 125mm from the wake centreline. Refinement studies
showed no discernable change with mesh density or domain size.
Initial Modelling
Initial CFD modelling simply employed a Gaussian wake
velocity profile past a super-elliptic leading edge matching the
experiment with two symmetry boundary conditions. It was
believed their existed a preferred spanwise length scale of the
wake that would produce boundary layer streaks as observed
experimentally. Goldstein et al. [4] has analytically analysed the
receptivity of flat plate with leading edge to steady normal
vorticity and found vortex stretching around the leading edge to
be a strong mechanism producing streamwise vorticity
downstream distorting the boundary layer.
The CFD inlet wake profile was fitted to the experimental data
and was in good agreement with the theory [2]. Initial CFD
results assuming the stagnation line to lie on a plane of symmetry
did not match the experimental results as shown in Table 1. In
particular, no streak was found to occur for the upstream wire
wake model.
Test Section Wire Upstream of Contraction Wire
Exp 10-15% 50-60%
CFD 1.5% No Streak
Table 1. Summary of Experiment Vs Initial CFD Results for streak
strength
The experimental configuration of [8] is shown in Figure 3.
Flow below the leading is directed into the surroundings through
a slot to avoid plenum chambers used in associated experiments.
The mass flow through the slot below the leading edge could be
varied, altering the attachment point, although no data on the
attachment point was recorded. The experimental configuration
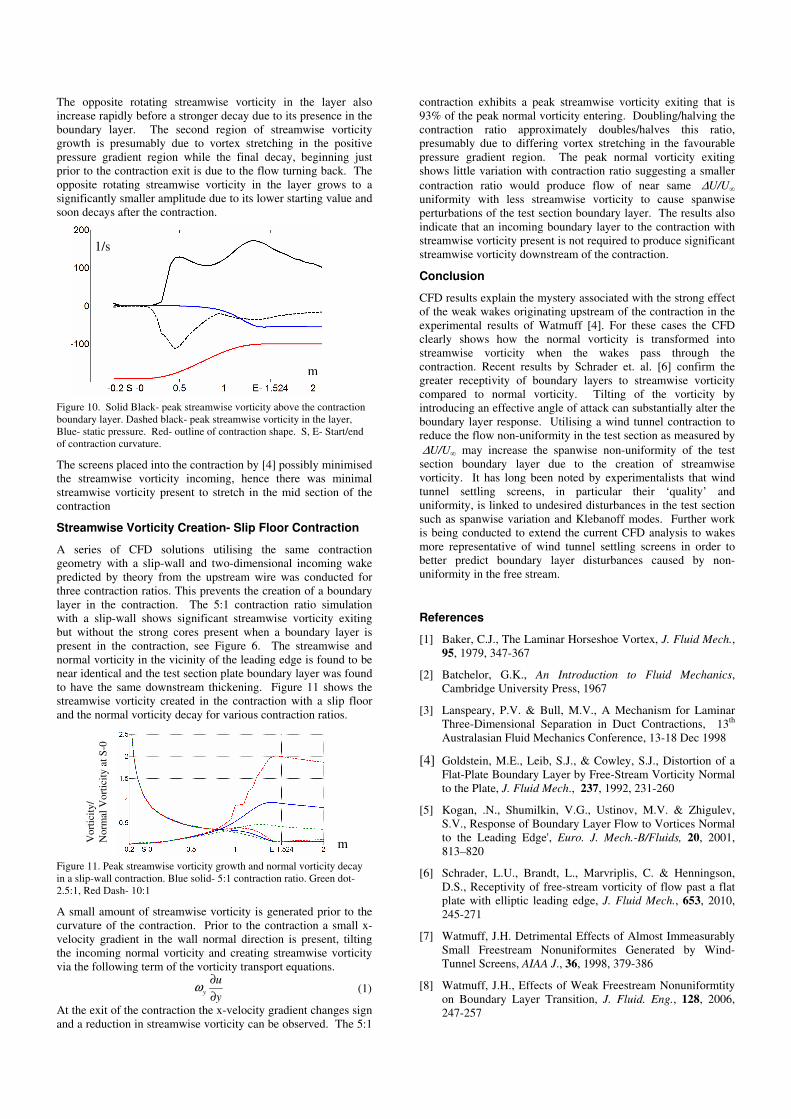
was modelled in CFD, breaking the attachment line symmetry.
Increasing slot mass flow moved the attachment point to the
topside of the leading edge and substantially increasing the streak
strength for the test section wire wake, see Figure 4, with little
discernable effect on the flat plate pressure gradient downstream
of the leading edge. However, the model wake from the
upstream wire still showed little or no effect on the boundary
layer.
Figure 4. Left: Streak strength versus slot mass flow for test section wake
model. Exp. data [8] light brown. Right: Flow attachment positions
Although the location of the attachment point was not recorded