Page 1
Louisiana State University Louisiana State University
LSU Digital Commons LSU Digital Commons
LSU Master's Theses Graduate School
3-4-2020
Effects of Freshwater Inflow on Nekton Assemblages and Blue Effects of Freshwater Inflow on Nekton Assemblages and Blue
Crab Populations in Southeastern Louisiana Crab Populations in Southeastern Louisiana
Caleb Benjamin Taylor
Follow this and additional works at: https://digitalcommons.lsu.edu/gradschool_theses
Part of the Marine Biology Commons, and the Terrestrial and Aquatic Ecology Commons
Page 2
EFFECTS OF FRESHWATER INFLOW ON NEKTON
ASSEMBLAGES AND BLUE CRAB POPULATIONS IN
SOUTHEASTERN LOUISIANA
A Thesis
Submitted to the Graduate Faculty of the
Louisiana State University and
Agricultural and Mechanical College
In partial fulfillment of the
requirements for the degree of
Master of Science
in
The School of Renewable Natural Resources
by
Caleb Benjamin Taylor
B.S., The University of Southern Mississippi 2015
May 2020
Page 3
ii
ACKNOWLEDGEMENTS
I cannot thank Dr. Megan La Peyre enough for her patience and guidance throughout this
process, as well as for the opportunity to further my career aspirations and challenge my
capabilities. I acknowledge my committee members, Dr. Julie Lively and Dr. Andy Nyman for
their assistance and advice along the way. Dr. Mike Kaller and Dr. Matt Faldyn, both of you
helped expand my statistical repertoire, thank you. To the La Peyre lab (past, present, and
future): team work makes the dream work. My field work (and much of my lab work) would not
have been possible without Dani Marshall, Sam Moore, Nick Coxe, and Dr. Eva Hillman. Ellis
Chapman and Tyler Wilkinson, thank you both for help in the field. I thank Louisiana
Department of Wildlife and Fisheries’ Trebor Victoriano and company at Pass a Loutre wildlife
Management Area, and Mandalay National Wildlife Refuge Manager Brian Pember for
providing lodging during field sampling. There are many others, you know who you are; and
though I doubt you will ever read this, I appreciate you all none the less.
This contribution was made possible through the funding of Louisiana Department of
Wildlife and Fisheries in support of the U.S. Geological Survey’s Louisiana Fish and Wildlife
Cooperative Research Unit. Field work was supported through Dr. Andy Nyman and the Coastal
Protection and Restoration Association.
Page 4
iii
TABLE OF CONTENTS
ACKNOWLEDGEMENTS ............................................................................................................ ii
LIST OF TABLES ......................................................................................................................... iv
LIST OF FIGURES ........................................................................................................................ v
ABSTRACT .................................................................................................................................. vii
1. INTRODUCTION ................................................................................................................... 1
2. METHODS ............................................................................................................................ 12
2.1 STUDY SITES ............................................................................................................... 12
2.2 SAMPLING DESIGN & DATA COLLECTION ......................................................... 15
2.3 DATA ANALYSES ....................................................................................................... 19
3. RESULTS .............................................................................................................................. 22
3.1 ENVIRONMENTAL ..................................................................................................... 22
3.2 NEKTON ....................................................................................................................... 24
3.3 ISOTOPE ....................................................................................................................... 40
4. DISCUSSION ........................................................................................................................ 43
5. BIBLIOGRAPHY ................................................................................................................. 55
APPENDIX A. BLUE CRAB LIFE CYCLE DESCRIPTION .................................................... 63
APPENDIX B. MISSISSIPPI RIVER FLOW FIGURES ............................................................ 65
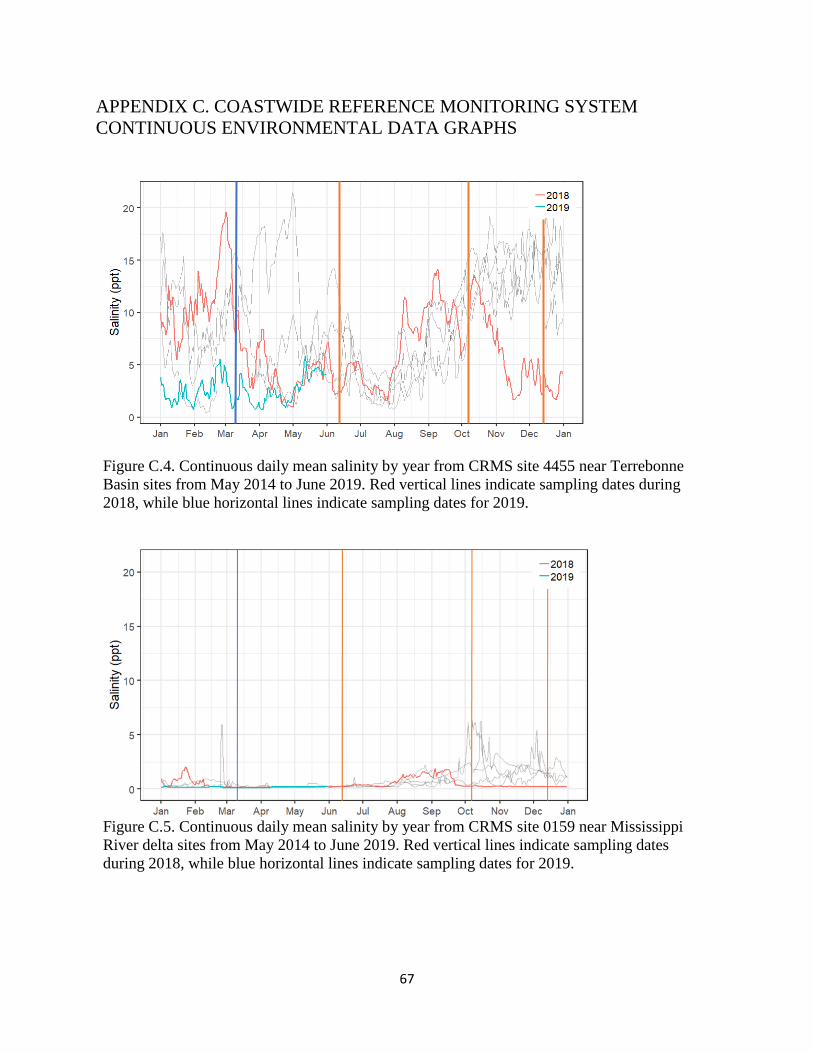
APPENDIX C. COASTWIDE REFERENCE MONITORING SYSTEM CONTINUOUS
ENVIRONMENTAL DATA GRAPHS ....................................................................................... 67
VITA ............................................................................................................................................. 70
Page 5
iv
LIST OF TABLES
Table 3.1. Discrete hydrological and environmental variables (mean ± 1 SE) collected
quarterly for summer, fall, winter 2018, and spring 2019 within Mississippi River Delta
(active delta) and Terrebonne Basin (inactive delta) concurrent with nekton sampling. ............. 23
Table 3.2. Crustacean and fish species listed separately in order of numerical abundance
from 96 throw trap samples. ......................................................................................................... 25
Table 3.3. Crustacean and fish species listed separately in order of numerical abundance
from 96 bag seine samples.. .......................................................................................................... 26
Table 3.4. ANOSIM and SIMPER results for comparison of nekton densities by habitat
type and season within throw trap samples................................................................................... 36
Table 3.5. Mean (SE) δ13C and δ15N stable isotope values by delta and species. ........................ 41
Page 6
v
LIST OF FIGURES
Figure 1.1. Past deltaic lobes of the Mississippi River in order from oldest to youngest,
the lobes are (1) Maringouin, (2) Teche, (3) St. Bernard, (4) Lafourche, (5) modern
(Plaquemines-Balize), and (6) Atchafalaya. Source: (National Research Council 2006) .............. 5
Figure 2.1 Field study site locations within A) Terrebonne Basin and B). Mississippi
River Delta, Louisiana, USA. ..................................................................................................... 14
Figure 3.1 Continuous hydrologic data (water temperature (˚C) and salinity) from CRMS
sites nearest sample sites. .............................................................................................................. 23
Figure 3.2. Total crustacean abundance reported by gear type and habitat.. ................................ 29
Figure 3.3. Total fish abundance reported by gear type and habitat.. ........................................... 31
Figure 3.4 Nekton Species richness reported by gear type and habitat. ....................................... 32
Figure 3.5. J’ Evenness index reported by gear type and habitat (marsh edge, ME; open
water, OW) for each delta. ............................................................................................................ 34
Figure 3.6. Non-metric multidimensional scaling ordination 2-D bi plots of Bray-Curtis
dissimilarity indexes of nekton species composition for each basin by season and habitat. ........ 35
Figure 3.7. Blue crab, young of the year (YOY) (<30mm carapace width) reported by
gear type and habitat for each delta. ............................................................................................. 37
Figure 3.8. Blue crab biomass reported by gear type and habitat for each delta. ......................... 39
Figure 3.9. Regression of A) nekton species richness, B) log transformed nekton
biomass (g m-2), C) Young of the year blue crab densities, and D) blue crab
biomass (g m-2) against submerged aquatic vegetation (SAV) biomass (g m-2)........................... 40
Figure 3.10. Bi-plot of Mean ±SE δ13C and δ15N stable isotope values for nekton and
dominant vegetation species within active and inactive deltas. .................................................... 42
Figure A.1. Simplified Blue Crab life cycle. ................................................................................ 63
Figure B.1. Regression of commercial blue crab landings within the Mississippi River
Delta plotted against Mississippi River mean annual discharge for years 1999 – 2016. .............. 65
Figure B.2. Mississippi River water gauge height at Baton Rouge, LA, from daily means
from April, 2018, to April, 2019.. ................................................................................................. 65
Page 7
vi
Figure B.3. Mississippi River delta commercial blue crab landings and Mississippi
River mean yearly discharge from 2000 to 2016. ......................................................................... 66
Figure C.1. Continuous daily mean salinity by year from CRMS site 4455 near
Terrebonne Basin sites from May 2014 to June 2019. ................................................................. 67
Figure C.2. Continuous daily mean salinity by year from CRMS site 0159 near
Mississippi River delta sites from May 2014 to June 2019. ......................................................... 67
Figure C.3. Continuous daily mean water temperature by year from CRMS site 4455 near
Terrebonne Basin sites from May 2014 to June 2019. ................................................................. 68
Figure C.4. Continuous daily mean water temperature by year from CRMS site 0159 near
Mississippi River delta sites from May 2014 to June 2019.. ........................................................ 68
Figure C.5. Continuous daily mean water temperature by year from CRMS site 4455 near
Terrebonne Basin sites from May 2014 to June 2019. ................................................................. 69
Figure C.6. Continuous daily mean water temperature by year from CRMS site 0159 near
Mississippi River delta sites from May 2014 to June 2019. ......................................................... 69
Page 8
vii
ABSTRACT
Estuaries along the northern Gulf of Mexico represent some of the most productive
ecosystems in the world, providing vital habitat for many recreationally and commercially
valuable species, including the blue crab, Callinectes sapidus. The mixing of fresh river and
saline ocean water in coastal estuaries contribute to this productivity. Dominated by large river
influences and consisting of multiple estuaries, Louisiana contributes the largest commercial
fishery in the Gulf of Mexico, and remains, on average, the largest supplier of blue crabs in the
nation. However, across southeast Louisiana, freshwater flow is largely dependent on Mississippi
River discharge, which is highly variable and changing rapidly due to multiple factors including
river leveeing and changing precipitation patterns. As Louisiana is experiencing high rates of
coastal land loss, large restoration projects diverting river sediment and water into adjacent
estuaries further impact freshwater flow, yet the impacts on dependent nekton species, including
the economically important blue crab, remain largely unknown. Managers lack basic data on
population dynamics, habitat use and environmental factors influencing blue crabs in the region.
For this study, we quantified nekton species assemblages and blue crab populations seasonally
using throw traps (N=96) and bag seines (N=96) within an active delta characterized by high
freshwater flow (Mississippi River Delta) and an inactive delta characterized by low freshwater
flow (Terrebonne Basin). Nekton species composition differed between both deltas, though
differences for crustacean and fish densities, nekton species richness, and blue crab densities
were largely seasonally driven and reflected individual species life history. Both deltas supported
similar densities of recently settled, juvenile blue crabs during fall when abundances were
highest within both deltas. Panaeid shrimp were largely absent from active delta sites, though
densities where consistently high in the inactive delta during summer and fall. The most
Page 9
viii
pronounced differences between the active and inactive deltas largely occurred in the spring
during an extended period of flooding for the Mississippi River, which in 2019 exceeded
previous river flows in both volume and length of time providing a stark contrast between the
deltas. This unusually high riverine flow provides some indication of the impact that extended,
high river flow may have on nekton assemblages and habitat availability within an estuary. As
changes in freshwater flow are associated with numerous water quality and habitat availability
effects, determining direct linkages to nekton and economically important species remains
critical, and may be location and estuarine dependent.
Page 10
1
1. INTRODUCTION
The history of the marshes of the Mississippi River Delta is inextricably intertwined with the history of the river itself. Like some ancient god, it broods over the coastal plain, implacable in its power, its
purpose inscrutable. With its sediment it spawns the flat, verdant marshes of the delta, nourishes them with its nutrients, and finally abandons them to senesce slowly under the influence of time and
subsidence, while it renews the cycle elsewhere along the coast. -- James Gosselink
The Ecology of Delta Marshes of Coastal Louisiana: A Community Profile
Most fishery production worldwide occurs within coastal regions, and is largely
associated with coastal upwelling, tidal mixing, and land-based runoff including major river flow
(Caddy & Bakun, 1994). Terrestrially enriched river discharge can positively influence
biological processes (growth, survival, recruitment) that affect fisheries production (Grimes,
2001). Alterations in riverine outflow could potentially devastate coastal fishery landings, yet
demand for freshwater resources has caused many rivers to run dry. For instance, the Colorado
River historically flowed into the Gulf of California, yet has gradually been diverted for use by
cities and agriculture since the completion of the Hoover Dam in 1935 (Lavın & Sánchez, 1999).
Not only has decreased freshwater flow to the Gulf of California been shown to be a root cause
of decreased growth and a confounding factor in the endangerment of a fish species (Totoaba
macdonaldi), but it is also correlated with a decrease in shrimp total catch (Galindo-Bect et al.,
2010). Within Apalachicola Bay, Florida, high river flow (> 30,000 cfs) for over 100 days was
correlated with reduced oyster landings (Wilber, 1992). The balance of mixing fresh and salt
water in estuaries is highly variable across systems and within systems; understanding how
estuarine resources, fisheries and functions respond to changing flows remains critical to helping
manage these systems and the fisheries that depend on them (Alber, 2002).
Within the United States, the Magnuson-Stevens Fisheries Conservation and
Management Act of 1976 was enacted to ensure sustainability of fisheries. In 1996, this act was
Page 11
2
amended to acknowledge the importance of essential fisheries habitat. The addition of essential
fisheries habitat recommends fishery managers to include habitat – the basis of healthy fisheries
– in their management regimes to ensure the long term sustainability of fisheries and fishing
communities (Rosenberg et al., 2000). Since river flow has been shown to impact estuarine
resources related to primary (habitat) and secondary production (fisheries), it is vital that we
strive to understand the relationships between flow and habitat to sustain our fisheries (Alber,
2002). In particular, river effects are most noticeable in oligotrophic seas such as the Gulf of
Mexico and the Mediterranean Sea where processes associated with river flow from the
Mississippi and Rhone Rivers, the presence of a wide shelf, and mixing from winds create
favorable reproductive conditions for many species (Lloret et al., 2004). Fishery landings from
Louisiana waters surrounding the Mississippi River, the largest river system in North America,
contribute some 70-80% annually to the total fishery landings of the Gulf of Mexico (Grimes,
2001). Similar to other estuarine regions, freshwater flow here is generally considered to be one
of the most influential factors affecting biotic community structure and production for estuarine
nekton communities (Piazza & La Peyre, 2011).
Estuarine dependent species comprise over 50% of U.S. commercial fisheries landings
(Houde & Rutherford, 1993). Louisiana consistently leads Gulf landings due to catch of five
major species: Gulf menhaden (Brevoortia patronus), brown shrimp (Farfantepenaeus aztecus),
white shrimp (Litopenaeus setiferus), Eastern oysters (Crassostrea virginica), and blue crabs
(Callinectes sapidus); all of which are estuarine dependent (Keithly & Roberts, 2017). This high
production relates to generally enhanced nutrient cycling and land-based nutrients driving high
primary production rates within estuaries (Jordan & Peterson, 2012). This impacts the fisheries
Page 12
3
not just through impacts to water quality, but through impacts on habitat availability, food
availability, and the interaction of fixed habitat availability with overlying water quality.
Freshwater flow can influence fishery production through transport of detritus and
nutrients, as well as transport and deposition of sediments, reduction of salinity, and mixing and
transport of water masses (Jordan & Peterson, 2012). Nutrient transport strongly influences
productivity of wetland vegetation, phytoplankton, and seagrasses, which in turn influences
distributions of many juvenile fish and shellfish either directly or through the food chain. For
instance, increased nitrogen inputs into the Gulf of Mexico from the Mississippi River, alongside
wetland loss, has caused increased eutrophication and hypoxia along coastal shelf waters (Mitsch
et al., 2005). Nitrogen loads from the Mississippi River are partially denitrified by anaerobic
bacteria and assimilated by wetland plants, yet algae (normally nutrient limited within estuarine
systems) can bloom in warmer months with increased nitrogen loads derived from agricultural
runoff and pollutants, which can lead to alterations in estuarine trophic structure and ultimately
hypoxic conditions along coastal shelf waters (Mitsch et al., 2005).
Changes in freshwater flow have been directly linked to fisheries production. For
example, in Matagorda Bay, Texas, quality of organic matter was found to be higher following
low salinity events driven by freshwater flow, ultimately contributing to enhanced oyster
production (Marshall et al., 2019). Within Louisiana, extended low salinities from flooding
resulted in negative impacts on oyster survival, recruitment, and growth in Breton Sound (La
Peyre et al., 2013). Similarly, another study concluded that lower estuarine salinities from
diversions or increased freshwater flow during peak recruitment periods may reduce overall
growth rates and productivity of white shrimp (Litopenaeus setiferus) and brown shrimp
(Farfantepenaeus aztecus) in affected areas (Rozas & Minello, 2011). In contrast, Gambusia
Page 13
4
affinis was found to have higher growth rates in response to increased freshwater flow derived
from the Caernarvon diversion in Breton Sound, Louisiana (Piazza & La Peyre, 2010).
While changes in water quality may have direct effects on fisheries, they also indirectly
influence them through impacts on habitat characteristics, and the interaction of available fixed
habitat with overlying water quality. The Mississippi River’s immense fishery productivity is not
only related to riverine processes, but also habitat those processes create. The Mississippi River
delta is composed of vast wetlands and shallow water areas created through sediment deposition
(mostly fine grained clays and silts) draining from an area of 3,344,560 km2 over thousands of
years (Coleman, 1988). The Mississippi River drainage basin covers a vast amount of the
continent, stretching from the Rocky Mountains in the west, the Appalachians to the east, and the
Precambrian shield in Canada on the northern boundary. Sediment from these regions
continuously washes towards the Gulf of Mexico through the many tributaries leading into the
Mississippi River channel, resulting in fluvial deltaic deposition (sedimentation and building of
land) from the shoreline to the continental shelf edge at a faster rate than waves and tides can
redistribute it. This process slowly built the entire southeast Louisiana region known as the
Mississippi River Deltaic Plain from the Chandeleur Islands in the east to Vermilion Bay in the
west. The system formed this region through successive switching of major deltaic lobe
complexes involving the meandering, altering courses of the river channels filling in and
changing over time, known as the deltaic lobe process (Frazier, 1967).
Page 14
5
Figure 1.1. Past deltaic lobes of the Mississippi River in order from oldest to youngest, the lobes
are (1) Maringouin, (2) Teche, (3) St. Bernard, (4) Lafourche, (5) modern (Plaquemines-Balize),
and (6) Atchafalaya. Source: (National Research Council 2006)
Marshes still under the direct influence of riverine processes are considered active deltas,
while marshes no longer under direct influence of riverine processes are referred to as inactive
deltas. Inactive deltas depend largely on local rainfall for freshwater inputs and resuspension of
sediments for inputs of mineral matter (Nyman et al., 1990). Currently only the Plaquemine-
Balize or Mississippi River Delta at the mouth of the Mississippi River and the Wax Lake Outlet
and Atchafalaya Delta at the mouth of the Atchafalaya River are active (Figure 1). While active
deltaic processes slowly accrete new land, inactive deltas degrade, subside, and erode naturally
over time due to the absence of riverine connectivity and subsequent domination of marine
processes (Day et al., 2007).
Historically, subsidence and accretion offset one another in the region. However, since the
early 1900s, a myriad of anthropogenic and natural processes have caused land loss in coastal
Louisiana to far exceed land gain (Day et al., 2000). Levee construction along the Mississippi
Page 15
6
River in the early half of the century disconnected many estuaries from riverine sources and the
nutrient and sediment deposition provided from them during annual flooding; thus salt water
intrusion, subsidence and subsequent marsh loss have been relatively rapid and widespread
(Wissel & Fry, 2005). Other research has identified dredging of canals through coastal marshes
in the area to contribute a large percentage to subsequent erosion (Turner, 1997). The
introduction and invasion of nutria, a semi-aquatic rodent hailing from South America, is also
attributed to be a contributing factor in facilitating marsh conversion to open water through
herbivory on wetland vegetation (Scarborough & Mouton, 2007). Coastal wetland loss in
Louisiana is currently greater than all other states in the continuous United States combined, and
in the 1960’s was recognized as one of the most rapidly changing coastlines on the planet (Day
et al., 2000). From 1932 to 2016, Louisiana has lost approximately 4,833 km2 representing close
to 25% of the 1932 land area. Wetland change in the region has slowed since peaking in 1970
with a further reduction in rate of loss since 2010. However, projected increases in relative sea
level rise as well as major storms could alter this trajectory in the future (Couvillion et al.,
2017).Over the last few decades, significant focus and investment seek to combat land loss and
protect coastal communities in Louisiana.
One noteworthy strategy has been to partially divert Mississippi River flow into
subsiding, inactive deltas in order to reinitiate natural land building processes that created the
Mississippi River deltaic plain. The most recent coastal master plan has assigned $5 billion
dollars towards future diversion projects (LACPRA, 2017). Initially, these river diversions
(Caernarvon and Davis Pond) were built to mediate salinities, and have been implicated in
causing negative impacts on wetland ecosystem function and structure due to increased nutrient
loads and insufficient sediment delivery (Poormahdi et al., 2018). Future planned diversions, or
Page 16
7
“sediment” diversions, are being designed as larger, deeper structures engineered to transport
greater quantities of sediment and river water to subsiding marshes to develop land more resilient
to hurricane damage and erosion (Amer et al., 2017). Current working diversions along the
Mississippi River include the Davis Pond Freshwater Diversion, Caernarvon Diversion, Fort St.
Phillip Diversion, West Bay Sediment Diversion and the Channel Armor Gap Crevasse. Future
planned restoration projects such as the mid-Barataria Bay diversion may further impact
estuarine organisms along the Louisiana coastline.
Changes in riverine flow, from altered precipitation and river management (i.e., diversions,
dams) alter dynamics of estuarine environments and have been shown to affect the abundance
and distribution of nekton within estuaries (Rozas et al., 2005). Caernarvon Freshwater
Diversion began reintroducing Mississippi river water into the Breton Sound, Louisiana in 1991,
and was found by two studies to have either no effect or an increase in general biomass and
densities for nekton assemblages including some ecologically and economically important
estuarine species (de Mutsert & Cowan, 2012; Piazza & La Peyre, 2011). Other studies have
linked oyster growth and mortality to flow (La Peyre et al., 2003, 2013, 2014), and white and
brown shrimp growth and production (Rozas & Minello, 2011 to river flow, and the consequent
effects on water quality and fixed habitat locations. In general, the relationships are often
species-dependent, and time-dependent. In Louisiana, Guillory (2000) noted an association of
commercial blue crab harvest with high Mississippi River discharge, but suggested this does not
necessarily imply causality. Limited work has been done to explicitly examine how freshwater
flow may impact blue crabs (West, 2016).
The blue crab is a common portunid (swimming crab) inhabiting nearshore coastal and
estuarine environments from Nova Scotia to northern Argentina, and supports the most
Page 17
8
prodigious commercial crab fishery in the United States (Perry & VanderKooy 2015; National
Marine Fisheries Service, 2017). Nationally, landings for the species have valued over $150
million dollars per year since 2008, with value generally increasing annually. Total landings
have been reported as high as 117,000 metric tons in 1993, and has remained above 60,000
metric tons every year since with the exception of 59,797 metric tons in 2013 (National Marine
Fisheries Service 2017). The Gulf States Marine Fisheries Commission recommends
management action for blue crabs for the five states along the Gulf of Mexico (Perry &
VanderKooy 2015). Of the Gulf States, Louisiana contributes over half of total blue crab
landings with over 18,143 metric tons reported annually. Furthermore, Louisiana is consistently
the largest domestic supplier of blue crabs in the nation (Bourgeois et al., 2014). Despite this, the
blue crab fishery within the state was overfished in 1995, 2013, and 2015, and assessment
models show that juvenile abundance is in a general decline (West et al., 2016). While
significant work has examined and attempted to model organism response to changes in river
flow (Wilkinson et al., 2006; Wang et al., 2017; Wissel & Fry, 2005) , we lack explicit data on
potential impacts of river flow on blue crabs, including direct impacts (i.e., density, size class
distribution), and indirect impacts (i.e., diets, habitat) on populations in the region. Research
focused on understanding influential environmental conditions coupled with food web analyses
may lead to a better understanding of the blue crab stock and its habitat in Louisiana (West at al.,
2018).
The link between habitat and riverine influence on blue crab abundance has been
explored in other regions, such as along the Atlantic coast (Hines et al., 1987; Ma et al., 2010;
Posey et al., 2005). Within the Chesapeake Bay, juvenile blue crabs grew faster in submerged
aquatic vegetation habitat than unvegetated habitat, implying that conditions favoring submerged
Page 18
9
aquatic vegetation growth could provide better food availability for early stage blue crabs
(Perkins-Visser et al., 1996). However, this study focused on one submerged aquatic vegetation
species (Zostera marina), and did not specify substrate type. Another study within the same
system analyzed outputs from a Chesapeake Bay Ecosystem Model to assess water quality and
submerged aquatic vegetation impacts on blue crabs, suggesting that reduced nutrient input could
enhance blue crab biomass (Ma et al., 2010). Within North Carolina, lower salinities within a
small river dominated estuary were associated with greater survivorship, more rapid molting, and
greater crab dry weight when compared to higher salinity areas (Posey et al., 2005). In Texas,
reduced freshwater flow (alongside overfishing, shrimp trawl bycatch, and habitat loss or
degradation) were suggested to be largely responsible for declines in abundance and commercial
harvest of blue crabs (Sutton & Wagner, 2007). This study did not address impacts on different
blue crab size classes and occurred largely within an environment with limited freshwater
influence. While informative, many of these studies may not be applicable to the larger river
dominated estuaries in the Gulf of Mexico with generally higher rates of flow, non-point source
nutrient inputs, high turbidity and extensive marsh landscape.
Freshwater flow may also influence blue crab populations through impacts on their food
resources (Wissel & Fry 2005; Hoeinghaus & Davis, 2007). Food availability has been found to
influence young juveniles in seagrass beds, and may be similarly important in defining the
distribution of juvenile and adult blue crabs in other habitats, which can be determined through
use of stable isotope analyses within animal and plant tissue (Perkins-Visser et al., 1996).
Animals acquire stable isotope δ13C and δ15N compositions from diets that are often habitat
specific; therefore recording changes in stable isotopes provides a means to quantify the diet of
organisms in the field while giving insight into habitat use (Fry et al., 2003). Stable isotopes have
Page 19
10
proven useful to determine food sources and trophic levels of blue crabs in response to
restoration (Llewellyn & LaPeyre, 2010), and may prove useful in identifying impacts of altered
flow on changes in habitat and dietary subsidies, which could indirectly impact overall
population densities. Increased inputs of nitrates to estuarine systems can influence primary
producer uptake, which may increase phytoplankton productivity and alter the quality and
quantity of food sources (Bucci et al., 2007). Consumers retain the δ13C signatures of foods they
ingest and when analyzed in combination with δ15N from aquatic plant and animal tissues, a
consistent separation between trophic levels is reflected (Deniro & Epstein, 1981).
The Louisiana coastal zone encompasses approximately 37,780 km2 of lowland plains,
inactive and active deltaic lobes and open water. Although approximately a quarter of these
wetlands have been lost in the past 84 years, the area continues to support 30% of the total
commercial fisheries in the United States, largely due to dynamics associated with the
Mississippi River. Anthropogenic controls (levees and dams) throughout the drainage basin have
contributed to reduced capacity for sediment accretion along the Louisiana coastal zone,
allowing for subsidence and relative sea level rise to outpace sediment accretion throughout the
Mississippi River deltaic plain (Couvillion et al., 2017). Restoration efforts in Louisiana
reintroducing freshwater flow to subsiding, inactive deltas may further alter biotic community
structure and production for estuarine nekton communities (Piazza & La Peyre, 2011).
Considering the continuous change occurring within Louisiana’s estuaries, understanding how
these complex processes and alterations will impact estuarine ecosystems as a whole, as well as
with economically important species, such as the blue crab would be helpful in managing our
fisheries and habitats. More explicit information about riverine influence on blue crab habitat,
diet and abundance in the region would help to better understand and manage this species in
Page 20
11
Louisiana and the Gulf of Mexico in the face of continuous habitat degradation (West et al.,
2016). This study has three objectives aimed at understanding how freshwater flow affects
estuarine nekton communities, blue crab abundance and trophic characteristics. Specifically, the
project goals are (1) to compare nekton communities in an active and an inactive delta (2) to
compare juvenile blue crab densities and abundance between an inactive and an active delta; and
(3) to compare δ13C and δ15N stable isotopes from blue crabs, primary producers and potential
blue crab prey within an active and inactive delta.
Page 21
12
2. METHODS
2.1.STUDY SITES
Two delta systems were identified for sampling for this project. We selected an active
delta site, the Mississippi River Delta, and an inactive delta site, Lake Mechant and Mud Lake,
located in Terrebonne Basin (Figure 2.1).
2.1.1. Mississippi River Delta “active delta”
The largest active delta system within Louisiana, the modern day Plaquemine-Balize
Delta (also called “Bird’s foot Delta”), lies at the southern end of Plaquemines Parish, south of
Venice, Louisiana, within the northern Gulf of Mexico. The Mississippi River began its current
course through the Balize delta around 800 to 1,000 years ago (Coleman, 1988). Average
monthly salinities within this active delta ranged from 0.1 to 6.44, with a mean of 0.8 ± 0.1 (Jan
2010-Oct 2019, Coastwide Reference Monitoring System site 0159; Figure 3.1). Average water
temperature for the same time period ranged from 5.2˚C to 31.5˚C with a mean of 19.6 ± 0.8˚C.
Natural and man-made passes meander through the marsh and are characterized by deep
channels and shallow sand bars scoured by high flows. The area’s marshes are dominated by
Roseau cane, Phragmites australis, alongside emergent stands of Zizaniopsis miliacea (cut
grass), Salix nigra (black willow), Salix exigua (sandbar willow), Lantana camara (lantana),
Sambucus canadensis (elderberry), Myriophyllum spicatum (Eurasian water milfoil),
Potamogetun spp. (pond weed), Colocasia esculenta (elephant ears), and Sagitaria platyphylla
(duck potato). Diurnal tides here are largely influenced by wind speed and direction (Rabalais et
al., 1995) with water levels largely influenced by wind speed and direction.
Page 22
13
2.1.2. Terrebonne Basin “inactive delta”
Terrebonne basin occupies the abandoned deltaic lobes of the Teche and Lafourche, within the
Mississippi River deltaic plain. Lake Mechant and Mud Lakes in Terrebonne basin (inactive
deltaic complex) are the locations of our low flow sites (Figure 2.1). Average monthly salinities
ranged from 1.1 to 18.6 with a mean of 8.1 (0.4) (January 2010 to October 2019; Coastwide
Reference Monitoring System site 4455; Figure 3.1). Average monthly water temperature from
the same time period ranged from 11.5˚C to 31.6˚C with a mean of 23.4 (0.5)˚C. The
surrounding marsh is dominated by Spartina patens (saltmeadow cordgrass), alongside many
other species including but not limited to: Spartina alterniflora (smooth cordgrass), Juncus
roemereanus (black rush), and Phragmites australis (Roseau cane). In contrast to the active sites,
inactive delta sites represent an area with rapidly eroding and subsiding marsh due to lack of
access to alluvial sedimentation and little restoration impacts. Similar to active delta sites, tides
here are diurnal and water levels are largely dependent on wind speed and direction.
Page 23
14
Figure 2.1 Field study site locations within A) Terrebonne Basin and B). Mississippi River
Delta, Louisiana, USA. Colored dots indicate selected study sites for sampling in spring,
summer, fall and winter; black dots indicate CRMS site locations used for continuous
environmental data.
Page 24
15
2.2. SAMPLING DESIGN & DATA COLLECTION
Within each selected delta, six sites were haphazardly selected using a stratified random
sampling design. Each site consisted of a GPS location with a 100 m radius circle, where two
sampling stations were selected within shallow water of depths less than 2 m. The two sampling
stations within each site included one haphazardly placed along marsh edge (<1 m from marsh
edge in open water) and one within open water (>3 m from marsh edge). Sites were sampled
seasonally (May and June: summer 2018, September and October: fall 2018, December: winter
2018, and March: spring 2019; 2 deltas X 2 sample areas X 3 sites X 2 habitats X 4 dates = 96
samples).
2.2.1. Environmental
Upon approaching each site, water quality data were collected using a YSI model 556
multiprobe (Yellow Springs Instruments, Yellow Springs, OH) to determine water temperature
(C˚), salinity, dissolved oxygen (mg l-1), and conductivity (S/m). A secchi disk was used to
determine water clarity (cm). Data were also downloaded from the closest Coast wide Reference
Monitoring System (CRMS) continuous data recorders to the study sites (inactive delta, CRMS
4455; active delta, CRMS 0159).
2.2.2. Nekton
To characterize nekton assemblages, each site was sampled using two gear types: a 1-m2
throw trap and 5-m long by 2-m deep bag seine with a 3-mm square mesh. The throw trap
consisted of a 1-m x 1-m x 0.66-m (height) aluminum frame with 1.6- mm knotless nylon mesh
sides. To facilitate sampling in water greater than 0.66-m deep the nylon mesh was extended
above the frame to a total height of 1.25 m. A 1-m2 PVC square was integrated into the top of the
Page 25
16
extended netting and buoyed by net floats. For throw trap deployment, a 22 ft. Boston whaler
research skiff was slowly idled to the sample area before tossing the gear from the vessel’s bow.
Water depth for throw trap samples was determined by calculating the mean of five depth
measurements (cm) within the trap; with one measurement at each corner and one in the center.
Bottom type was recorded as either mud bottom, hard bottom, or submerged aquatic vegetation.
For throw trap samples, percent cover of submerged aquatic vegetation was estimated. If
submerged aquatic vegetation was present, all aboveground biomass was collected. Submerged
aquatic vegetation was placed into labeled bags and on ice for transport to the laboratory at
Louisiana State University Agricultural Center. Once in the lab, submerged aquatic vegetation
samples were sorted according to species, dried in a forced air drying oven at 60˚C to a constant
weight and weighed to the nearest 0.001-g dry weight to determine submerged aquatic vegetation
biomass (g m-2). Nekton within throw trap samples were cleared with a 1-m bar seine with 3-
mm square mesh until the seine was empty of nekton for three consecutive clearings. All nekton
from throw trap samples were placed into a labeled bag and onto ice for transport to the
laboratory at LSU AgCenter.
Upon completion of throw trap sampling, the 5x2-m bag seine was pulled adjacent to the
area previously sampled for 10 m. Bag seines are commonly used for sampling fishes in shallow
water and have been shown to capture a greater number of species than other gears within these
habitats (Crane & Kapuscinski, 2018). Water depth was determined by a single measurement
using a depth pole just before pulling the net. All seine samples were collected, bagged, labeled
and placed on ice for transportation to the laboratory at LSU AgCenter.
All nekton were returned to the laboratory for identification to species or lowest feasible
taxon. Individuals of each species were then counted, measured to the nearest 0.1-mm total
Page 26
17
length for fishes and shrimps and nearest 0.1-mm carapace width for crabs. Organisms were
then weighed to the nearest 0.001-g wet-weight to determine blotted wet biomass (g) using an
Ohaus Adventurer model top-loading laboratory balance (Ohaus Corp., Pinebrook, NJ, U.S.A.).
Twenty five individuals were randomly chosen and subsampled from each species numbering
over 25 individuals per sample. Blue crabs sex was also recorded.
2.2.3. Stable Isotope
2.2.3.1.Field sampling
Adult and juvenile blue crabs, primary producers, and potential blue crab prey species
were collected from all sites to compare diets and trophic characteristics of blue crabs between
the two deltas (active and inactive) in summer 2018 through the use of stable isotopes (δ13C,
δ15N). The most abundant nekton species common between both deltas were collected (Menidia
beryllina, Anchoa mitchilli, Palaemonetes spp.) from throw trap and bag seine samples post
laboratory analysis. At all sampling sites, crab traps and dip nets were used to sample for two
size classes of blue crabs (juvenile < 90-cm, adult > 90-cm). Crab traps were deployed for 24
hours. Bait within traps was securely bound and closed off from consumption using fine wire
mesh as to not be ingested and influence isotope values within blue crabs. A minimum of 3 crabs
were collected for each sample site within deltas. Only male adult blue crabs were analyzed due
to higher site fecundity compared to females. A minimum of three stems were collected from
dominant primary producers from adjacent marsh or waters within the 100 m radius of sample
sites. Phragmites australis, a dominant emergent plant located within both deltas represented the
C3 carbon pathway, primary producer samples. Spartina alterniflora was the dominant C4 plant
collected on adjacent marsh within inactive sites, while active sites were dominated by P.
Page 27
18
australis. Submerged aquatic vegetation was sampled when present, with Myriophyllum
spicatum used for analysis due to occurrence within both deltas. Particulate organic matter
(POM) Water samples were collected by filling two dark brown 200ml bottles with water on site
at 50-cm depth below water surface and placed on ice before being returned to the laboratory.
Benthic macro – algae (Cladophora spp.) were also collected from sites when present. All
samples collected were placed in separate sterile bags, labeled and frozen for transport to the lab
at LSU AgCenter.
2.2.4. Laboratory methods
In the lab, plant tissue and muscle tissue samples were rinsed with distilled water,
cleaned, and dried (Hoeinghaus & Davis, 2007). Muscle tissue was used for all animals except
adult blue crabs, where hepatopancreas tissue was used. Blue crab hepatopancreas tissue was
extracted, and frozen in the lab. Hepatopancreas tissue was used since isotope values in this
tissue reflect the short term diet of the blue crab (~ 3 weeks; Llewellyn & La Peyre 2011).
Hepatopancreas tissue underwent hexane decantations before being dried at 60˚C to constant
weight. Potential blue crab prey were dried at 60˚C in a drying oven until constant weight. Plant
samples were rinsed with deionized water and new growth clipped before drying at 60˚C in a
drying oven until weight was constant. Dried material was then ground into powder using mortar
and pestle (WiglBug for plant tissue; Dentsply Rinn, Elgin, Illinois, U.S.A.) before weighing and
loading samples. Water samples were filtered using 2 micron thick, pre-burned glass filters using
suction. Filters were dried at 60˚C in a drying oven until weight was constant upon subsequent
measurements. All dried powder sample weights within tins was calculated depending on
carbon/nitrogen ratios of tissue used, using the online tool provided by University of California
Page 28
19
Davis Isotope Analysis Facility (https://stableisotopefacility.ucdavis.edu/), where the samples were
shipped for analyses.
2.3. DATA ANALYSES
For all analyses, a significance level of alpha of p < 0.05 was used. Data residuals were
tested for normality using Shapiro-Wilks test. Unless otherwise indicated, mean (standard error)
are presented.
2.3.1. Environmental
Discrete salinity, water temperature, water depth and dissolved oxygen ranges are listed
in results. Summary statistics (means, standard error) were calculated for environmental
variables.
2.3.2. Nekton
Species richness was determined for all samples. Shannon- Weiner diversity index (H’)
and Pielou’s Evenness Index (J’) were calculated for each throw trap and bag seine sample.
Shannon diversity index was calculated as:
H' = -Σpilnpi
where pi is the proportion of individuals found in the ith species. Using the Shannon-
Weiner index, Pielou’s evenness index was calculated as:
J’= H’/ ln(S)
Evenness ranges from 1-0 with higher numbers being more even and lower numbers reflecting
communities that are more skewed.
Page 29
20
All data were analyzed using the R programming language R version 3.5.3 (2019-03-11)
- "Great Truth" - ©2019, RStudio, inc). Generalized linear models with negative binomial
distributions (glm.nb()) and a log link were performed on nekton crustacean or fish abundance
(seine) and densities (throw trap), and young of the year blue crab abundance and densities.
Linear models (lm()) were performed on J’ evenness and blue crab biomass. Generalized linear
models (glm()) with Poisson distribution and log link was performed on nekton species richness.
All response variables were tested separately by gear type (throw trap, seine) and habitat (marsh
edge and open water) by deltas (inactive, active), season, and the interaction of delta and season
as fixed effects. Blue crab biomass was log transformed log(x +1) to meet assumptions of
homogeneity of variance. All final model residuals met assumptions of normality and
homogeneity of variance or was determined accurate due to fit statistics.
A post-hoc pairwise Tukey test with significant interaction was used on all models to
determine significant differences between the interaction of delta and season with adjusted p
values through the emmeans() function in R. The effect of delta on nekton community structure
was analyzed by season and habitat using a two-way analysis of similarity (ANOSIM) (anosim(),
R package ‘Vegan’; Oksanen et al., 2013). ANOSIM tests for differences between groups based
on the relative abundance of species. A Bray – Curtis dissimilarity matrix was created using raw
nekton abundance data from throw trap samples. ANOSIM was performed on the Bray-Curtis
dissimilarity matrix of nekton community species to determine similarities or differences based
on the test statistic R, ranging from -1 to 1, where positive values indicate differences among
groups. If differences were found (R > 0.30), an analysis of similarity of percentages (SIMPER,
R Package ‘Vegan’; Oksanen et al., 2013) procedure was performed on nekton community
abundance data using delta as a factor to determine species responsible for assemblage
Page 30
21
differences between deltas. The effect of delta on nekton communities was further visualized
using a non-metric multidimensional scaling plot (NMDS, package ‘Vegan’; Oksanen et al.,
2013) to display relative association among species assemblages for each delta. Plots used have a
stress (measure of distortion of ordination of multidimensional species data) of less than 0.20.
2.3.3. Isotope
Only sites containing over three adult blue crabs and three juvenile blue crabs were used
for final analyses, and both size classes were analyzed separately. T-tests were used to compare
differences of mean δ13C and δ15N values between delta s by individual species.
Page 31
22
3. RESULTS
3.1. ENVIRONMENTAL
Discrete environmental variables measured are reported below (Table 3.1). Active and
inactive deltas differed greatly in salinity and submerged aquatic vegetation, but only slightly in
temperature and dissolved oxygen. Water temperature ranged between 8˚C and 29˚C with a
mean of 19.0 ± 1.2 ˚C for active sites, while inactive sites temperature ranged slightly higher
from 11˚C to 32˚C with a mean of 21.4 ± 1.1 ˚C. Highest temperatures were recorded in summer
and lowest in winter across both deltas. Salinity ranged from 0.1 during spring sampling to 0.2
for all other sampling events with a mean of 0.18 ± 0.01 within active delta sites. Salinity for
inactive delta sites ranged from 0.2 during winter sampling to 7 during fall sampling with a mean
of 2.6 ± 0.2. Dissolved oxygen ranged from 4 mg l-1 during fall sampling to 11.3 during summer
sampling for active delta sites, with a mean of 8.1 ± 0.4 mg l-1. Dissolved oxygen recorded for
inactive delta sites ranged from 4.9 mg l-1 during fall sampling to 10.8 mg l-1 for winter sampling
with a mean of 8.3 ± 0.2 mg l-1. Mean overall submerged aquatic vegetation biomass for active
sites was over two times as high as inactive delta sites (active: 51.8 ± 9.6, inactive: 20.9 ± 6.0;
F1=9.5, p < 0.01; Table 3.1).
Page 32
23
Figure 3.1 Continuous hydrologic data (water temperature (˚C) and salinity) from CRMS sites
nearest sample sites. Dotted lines indicate CRMS site 0159 from the active delta, while solid
lines indicate CRMS site 4455 within the inactive delta. Vertical blue lines denote sampling
dates.
Table 3.1. Discrete hydrological and environmental variables (mean ± 1 SE) collected quarterly
for summer, fall, winter 2018, and spring 2019 within Mississippi River Delta (active delta) and
Terrebonne Basin (inactive delta) concurrent with nekton sampling. Mean depth (cm) for throw
trap (TT) and bag seine (BS) samples, salinity, water temperature (˚C), dissolved oxygen (mg l-1)
were recorded using a YSI Model 556 multiprobe. Submerged aquatic vegetation (SAV) dried
biomass (g m-2) was recorded for TT samples.
summer fall winter spring
Active Inactive Active Inactive Active Inactive Active Inactive
depth (TT) (cm) 37.2(3.1) 57.6(3.5) 39.8(5.7) 47.3(3.0) 30.4(2.9) 39.8(3.5) 43.8(3.7) 49.2(3.6)
depth (BS) (cm) 36.8(2.6) 56.8(2.6) 40.7(3.8) 47.3(2.1) 30.8(2.1) 39.6(2.4) 43.8(2.6) 52.0(2.4)
salinity 0.2(0) 2.5(0.4) 0.2(0) 5.1(0.6) 0.2(0) 1.3(0.3) 0.1(0) 1.6(0.4)
temperature (˚C) 28.2(0.2) 30.0(0.4) 26.6(0.2) 27.2(0.2) 9.9(0.3) 12.6(0.2) 11.2(0.1) 15.8(0.4)
DO(mg l-1) 7.0(0.6) 7.5(0.5) 5.0(0.1) 6.9(4.3) 10.6(0.1) 10.3(0.1) 9.9(0.1) 8.5(0.2)
SAV biomass
(TT) (g m-2) 101.5(24.6) 36.0(18.5) 77.2(18.5) 33.1(13.6) 9.9(3.9) 8.2(3.4) 18.7(9.1) 6.7(4.1)
Page 33
24
3.2. NEKTON
A total of 34,215 individuals from 46 species were collected in 96 throw trap throws and
96 bag seine hauls. Throw traps collected 5,135 individuals (active: 2,102, inactive: 3,033) from
41 species (Table 3.2), while bag seines collected 29,079 total individuals (active: 6,411,
inactive: 22,668) from 43 species (Table 3.3).
Page 34
25
Table 3.2. Crustacean and fish species listed separately in order of numerical abundance from 96
throw trap samples by habitat (marsh edge, ME; open water, OW). Total catch % corresponds to
the percentage of individuals caught relative to the total individuals within each delta.
THROW TRAP
Active Delta Inactive Delta Both Deltas
Species ME OW Total % ME OW Total % Total %
CRUSTACEANS
P. pugio 0 0 0 0 523 1196 1719 56.7 1719 33.5
M. ohione 522 594 1116 53.1 0 0 0 0 1116 21.7
C. sapidus 113 151 264 12.6 136 118 254 8.4 518 10.1
F. aztecus 0 0 0 0 134 54 188 6.2 188 3.7
Panopaeidae spp. 3 5 8 0.4 12 15 27 0.9 35 0.7
R. harrisi 2 0 2 0.1 9 3 12 0.4 14 0.3
L. setiferus 0 0 0 0 2 2 4 0.1 4 0.1
FISH
B. patronus 0 0 0 0 347 118 465 15.3 465 9.1
L. parva 102 101 203 9.7 22 51 73 2.4 276 5.4
C. shufeldti 63 81 144 6.9 1 20 21 0.7 165 3.2
A. mitchilli 3 4 7 0.3 83 32 115 3.8 122 2.4
M. cephalus 83 0 83 3.9 5 2 7 0.2 90 1.8
P. latipinna 4 62 66 3.1 0 1 1 0 67 1.3
M. undulatus 1 0 1 0 44 23 67 2.2 68 1.3
M. beryllina 19 18 37 1.8 17 4 21 0.7 58 1.1
G. affinis 10 32 42 2 0 0 0 0 42 0.8
Lepomis spp. 13 13 26 1.2 0 0 0 0 26 0.5
E. lyricus 8 11 19 0.9 0 0 0 0 19 0.4
S. scovelli 7 7 14 0.7 2 7 9 0.3 23 0.4
D. maculatus 9 8 17 0.8 0 0 0 0 17 0.3
Fundulidae spp. 2 14 16 0.8 0 0 0 0 16 0.3
G. bosc 0 0 0 0 13 4 17 0.6 17 0.3
L. miniatus 6 4 10 0.5 0 0 0 0 10 0.2
E. pisonis 2 4 6 0.3 0 0 0 0 6 0.1
H. formosa 0 4 4 0.2 1 0 1 0 5 0.1
A. spatula 2 1 3 0.1 0 0 0 0 3 0.1
G. oceanicus 1 2 3 0.1 0 0 0 0 3 0.1
M. punctatus 2 1 3 0.1 1 0 1 0 4 0.1
L. microlophus 2 0 2 0.1 0 5 5 0.2 7 0.1
F. grandis 0 1 1 0 3 0 3 0.1 4 0.1
L. rhomboides 0 0 0 0 1 5 6 0.2 6 0.1
M. gulosus 0 0 0 0 7 0 7 0.2 7 0.1
L. griseus 2 0 2 0.1 0 0 0 0 2 0
Table 3.2 continued.
Page 35
26
THROW TRAP
Active Delta Inactive Delta Both Deltas
Species ME OW Total % ME OW Total % Total %
C. arenarius 0 1 1 0 1 0 1 0 2 00
C. nebulosus 0 1 1 0 0 0 0 0 1 0
F. jenkensi 1 0 1 0 1 0 1 0 2 0
A. xenica 0 0 0 0 2 0 2 0.1 2 0
C. spilopterus 0 0 0 0 0 2 2 0.1 2 0
C. variegatus 0 0 0 0 1 0 1 0 1 0
Gobiidae spp. 0 0 0 0 0 0 0 0 0 0
L. xanthurus 0 0 0 0 0 1 1 0 1 0
S. plagiusa 0 0 0 0 1 1 2 0.1 2 0
Total Abundance 982 1120 2102 1369 1664 3033 5135
Table 3.3. Crustacean and fish species listed separately in order of numerical abundance from 96
bag seine samples by habitat type (marsh edge, ME; open water, OW). Total % corresponds to
the percentage of individuals caught relative to the total individuals within each delta.
BAG SEINE
MRD TB Both Deltas
Species ME OW Total % ME OW Total % Total %
CRUSTACEANS
P. pugio 0 0 0 0 5403 9462 14865 65.6 14865 51.1
M. ohione 1517 1306 2823 44 0 0 0 0 2823 9.7
F. aztecus 0 0 0 0 440 589 1029 4.5 1029 3.5
L. setiferus 2 0 2 0 435 428 863 3.8 865 3
C. sapidus 240 236 476 7.4 170 183 353 1.6 829 2.9
Panopaeidae spp. 2 3 5 0.1 8 13 21 0.1 26 0.1
Cambaridae spp. 23 0 23 0.4 0 0 0 0 23 0.1
Panaeidae spp. 0 0 0 0 4 0 4 0 4 0
R. harissi 4 3 7 0.1 0 0 0 0 7 0
FISH
B. patronus 21 9 30 0.5 1594 1664 3258 14.4 3288 11.3
L. parva 362 263 625 9.7 159 122 281 1.2 906 3.1
M. beryllina 260 219 479 7.5 291 122 413 1.8 892 3.1
A. mitchilli 130 9 139 2.2 241 331 572 2.5 711 2.4
P. latipinna 209 424 633 9.9 1 0 1 0 634 2.2
M. undulatus 18 1 19 0.3 223 333 556 2.5 575 2
C. shufeldti 158 89 247 3.9 25 32 57 0.3 304 1
Lepomis spp. 140 85 225 3.5 0 0 0 0 225 0.8
Table 3.3 continued.
Page 36
27
BAG SEINE
Active Delta Inactive Delta Both Deltas
Species ME OW Total % ME OW Total % Total %
M. cephalus 107 5 112 1.7 38 21 59 0.3 171 0.6
D. maculatus 71 63 134 2.1 0 0 0 0 134 0.5
F. grandis 38 38 76 1.2 37 0 37 0.2 113 0.4
G. affinis 71 28 99 1.5 3 0 3 0 102 0.4
L. rhomboides 0 0 0 0 29 84 113 0.5 113 0.4
L. miniatis 27 44 71 1.1 7 5 12 0.1 83 0.3
C. variegatus 6 36 42 0.7 5 2 7 0 49 0.2
S. scovelli 18 11 29 0.5 11 15 26 0.1 55 0.2
A. xenica 0 0 0 0 19 0 19 0.1 19 0.1
B. chrysoura 0 0 0 0 1 19 20 0.1 20 0.1
C. arenarius 1 0 1 0 3 14 17 0.1 18 0.1
C. nebulosus 0 0 0 0 7 10 17 0.1 17 0.1
E. lyricus 25 1 26 0.4 0 0 0 0 26 0.1
E. pisonis 10 5 15 0.2 0 0 0 0 15 0.1
G. bosc 0 0 0 0 10 13 23 0.1 23 0.1
H. formosa 1 33 34 0.5 0 0 0 0 34 0.1
L. xanthurus 0 0 0 0 5 26 31 0.1 31 0.1
A. spatula 1 2 3 0 0 0 0 0 3 0
Caranx spp. 3 0 3 0 0 0 0 0 3 0
C. spilopterus 4 0 4 0.1 1 1 2 0 6 0
E. argenteus 0 0 0 0 2 0 2 0 2 0
F. jenkensi 14 0 14 0.2 0 0 0 0 14 0
Fundulidae spp. 1 3 4 0.1 0 0 0 0 4 0
F. chrysotus 1 0 1 0 0 0 0 0 1 0
Gobiidae spp. 0 0 0 0 0 1 1 0 1 0
G. broussonnetii 1 0 1 0 0 0 0 0 1 0
L. microlophus 4 3 7 0.1 1 3 4 0 11 0
M. curema 1 0 1 0 0 0 0 0 1 0
M. punctatus 0 1 1 0 0 0 0 0 1 0
S. marina 0 0 0 0 1 1 2 0 2 0
S. plagiusa 0 0 0 0 0 1 1 0 1 0
Total Abundance 3491 2920 6411 9174 13495 22669 29080
For both gear types, abundance and biomass were highly correlated, so only abundance
data results are presented (r = 0.76, p < 0.0001). Nekton abundance was also highly correlated with
crustacean abundance for each gear type, so crustacean and fish abundance are presented
Page 37
28
separately only (TT: r = 0.88, p <0.001; BS: r = 0.96, p <0.001). Crustacean and fish species
richness were highly correlated for bag seines (r = 0.73, p < 0.0001) and throw traps (r = 0.91, p
<0.0001), thus only total nekton species richness was analyzed for throw traps and bag seines.
Total nekton species richness was also correlated with H’ diversity index (r = 0.77, p < 0.001), and
thus H’ is not reported in results.
3.2.1. Crustacean Abundance
Throw trap crustacean densities within active sites ranged from 0 to 134 ind. m-2, with a
mean of 29 ± 5.3 ind. m-2. Densities within the inactive delta ranged from 0 to 341 ind. m-2 with
a mean of 46 ± 10.3 ind. m-2. Crustacean densities for marsh edge and open water varied
significantly by season (ME:F3=9.9, p<0.0001; OW: F3=3.7, p<0.009), with no significant
difference by delta or the interaction of delta by season (Figure 3.2). Marsh edge differences are
largely explained by fall crustacean densities being significantly higher than spring and summer
sampling. Open water differences are largely explained by summer densities being higher than
spring and winter (Figure 3.2).
Bag seine crustacean catch per unit effort within the active delta ranged from 0 to 423
with a mean of 70 ± 13.3, while inactive delta crustacean catch per unit effort ranged from 0 to
3,555 with a mean of 357 ± 86. Crustacean catch per unit effort for marsh edge differed
significantly between deltas (F1=9.5, p< 0.002), with no significant difference by season or the
interaction of delta by season (Figure 3.2). Marsh edge crustacean catch within the active delta
was significantly lower than within the inactive delta (contrast estimate = -1.28). Open water
crustacean catch per unit effort differed significantly by season and delta (F3 = 2.7, p< 0.04; F1 =
21.4, p < 0.0001), but not for the interaction of season by delta (Figure 3.2). Open water
crustacean catch per unit effort for inactive sites was significantly higher than active sites. Open
Page 38
29
water crustacean catch per unit effort for summer, fall, and winter samples were significantly
higher than spring.
A. B.
C. D.
Figure 3.2. Total crustacean abundance reported by gear type and habitat. A.) Throw trap,
marsh edge (ME); B.) Throw trap, open water (OW); C.) Bag seine, marsh edge (ME); D.)Bag
seine, open water (OW). Letters above bars denote significant statistical differences (p<0.05).
3.2.2. Fish Abundance
Throw trap fish densities within the active delta ranged from 0 to 147 ind. m-2 with a
mean of 14.8 ± 3.6 ind. m-2, while inactive delta fish densities ranged from 0 to 188 ind. m-2 with
a mean of 18.2 ±5.2 ind. m-2. Densities of fish for marsh edge and open water varied
significantly by the delta and season interaction (ME: F1, 3 = 8.3, p < 0.0001; OW: F1,3 = 16.2, p <
0.0001), but not by individual season or delta (Figure 3.3). The significant interaction for marsh
edge samples was largely explained by fish densities for the active delta spring being
significantly lower than all other season and delta combinations, with the exception of fall within
A A
A B
A B
A B
B
A
AB
B
A A
B
B
B
Page 39
30
the inactive delta, which did not differ from any other season by delta combination. Open water
fish densities were significantly greater in fall within the active delta compared to all other delta
and season combinations which were similar, with the exception of spring active delta samples
which were significantly lower (Figure 3.3).
Bag seine fish catch per unit effort within active sites ranged from 0 to 385, and had a
mean of 64 ±12.8. Fish catch per unit effort within inactive sites ranged from 0 to 1151, with a
mean of 115 ± 25.7. Fish catch per unit effort within marsh edge and open water bag seine
samples varied significantly by the delta and season interaction (ME: F1,3 =5.4, p<0.0009; OW:
F1,3 = 18.7, p < 0.0001; Figure 3.3). The interaction for marsh edge samples is largely explained
by low catch per unit effort for spring active delta sites being significantly lower than summer
within the same delta, as well as fall and spring catch per unit effort within the inactive delta
(Figure 3.3). Catch per unit effort during winter in active delta sites were also significantly lower
than spring in the inactive delta. The interaction for open water samples can largely be explained
due to spring active delta fish catch per unit effort being significantly lower than all other
seasons within the active delta and all seasons within the inactive delta. Furthermore, within
active delta open water samples, fall catch per unit effort was significantly higher than winter.
Inactive delta spring open water fish catch per unit effort were significantly higher than summer
and winter active delta and fall and summer within the inactive delta. Fall fish catch per unit
effort within the active delta open water samples were significantly higher than winter samples
within the same delta.
Page 40
31
A. B.
C. D.
Figure 3.3. Total fish abundance reported by gear type and habitat. A.) Throw trap, marsh edge
(ME); B.) Throw trap, open water (OW); C.) Bag seine, marsh edge (ME); D.)Bag seine, open
water (OW). Letters above bars denote statistically significant differences (p<0.05).
3.2.3. Species Richness
Throw trap nekton species richness for the active delta ranged from 0 to 11 species m-2
with a mean of 4.5 ± 0.4 species m-2, while nekton species richness for inactive throw trap
samples ranged from 0 to 9 species m-2 with a mean of 4.4 ± 0.3 species m-2. Density of species
richness for marsh edge differed significantly by season (F1,3=6.6, p<0.001; Figure3.4), with
spring richness being significantly lower than fall and summer. Open water species richness
densities differed significantly by the interaction of delta and season (F1,3=, p<0.001; Figure 3.4)
with active delta richness densities for spring significantly lower than summer and winter
richness for the active delta, as well as fall, spring, and summer for the inactive delta.
AB A AB A B
AB
B
A
B
A
AB
B
A A
B
B
B
Page 41
32
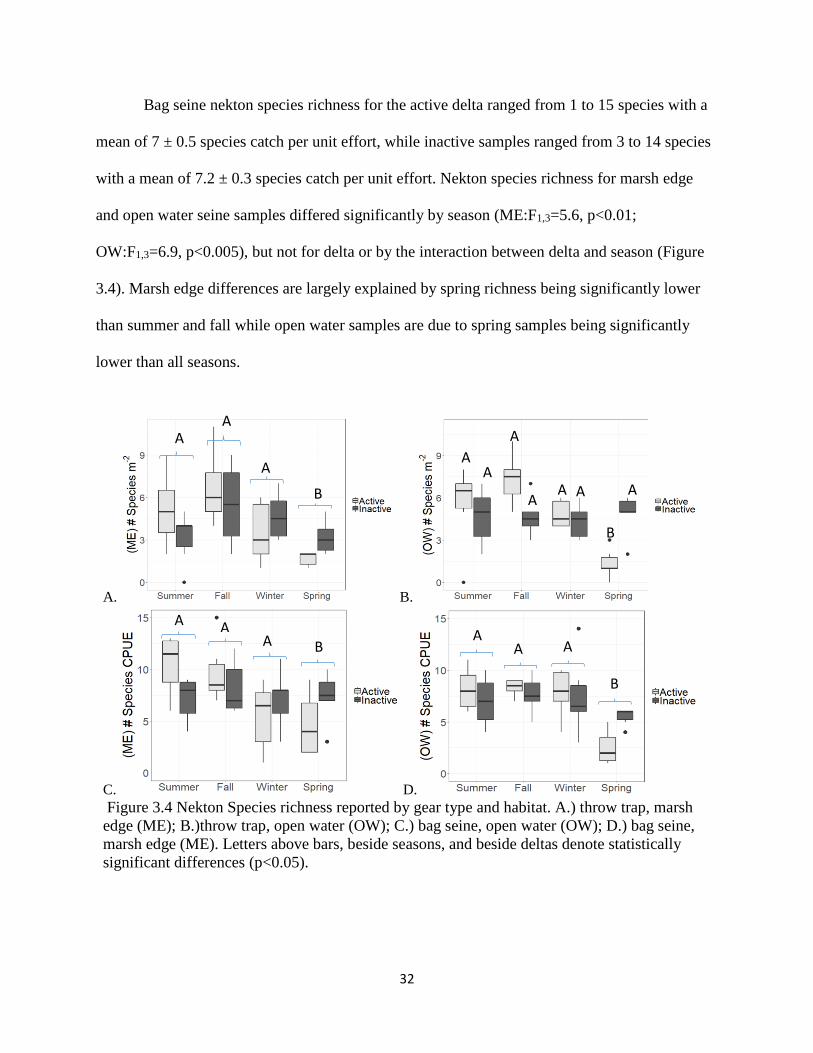
Bag seine nekton species richness for the active delta ranged from 1 to 15 species with a
mean of 7 ± 0.5 species catch per unit effort, while inactive samples ranged from 3 to 14 species
with a mean of 7.2 ± 0.3 species catch per unit effort. Nekton species richness for marsh edge
and open water seine samples differed significantly by season (ME:F1,3=5.6, p<0.01;
OW:F1,3=6.9, p<0.005), but not for delta or by the interaction between delta and season (Figure
3.4). Marsh edge differences are largely explained by spring richness being significantly lower
than summer and fall while open water samples are due to spring samples being significantly
lower than all seasons.
A. B.
C. D.
Figure 3.4 Nekton Species richness reported by gear type and habitat. A.) throw trap, marsh
edge (ME); B.)throw trap, open water (OW); C.) bag seine, open water (OW); D.) bag seine,
marsh edge (ME). Letters above bars, beside seasons, and beside deltas denote statistically
significant differences (p<0.05).
A A
B
A
A A AB
B
A
A
A
A A A
BB
A
A
A
AB B
Page 42
33
3.2.4. J’ evenness index
Pielou’s Evenness index J’ (calculated for total nekton) from throw trap samples within
active and inactive deltas ranged from 0 to 1 per m-2, with active sites having a mean of 0.6 ±
0.05 per m-2 and inactive having a mean of 0.6 ± 0.04 per m-2. J’ differed significantly for open
water by the season and delta interaction (F1,3 = 7.2, p < 0.0006; Figure 3.5), with marsh edge
differences between delta, season, and the interaction between delta and season not statistically
significant (Figure 3.5). The significant differences for the open water season and delta
interaction is largely explained by spring active delta sites’ J’ being significantly lower than all
other seasons within the same delta, as well as all seasons except for summer in the inactive
delta.
Bag seine J’ for the active delta ranged from 0 to 0.98 with a mean of 0.6 ± 0.04, while
inactive J’ ranged from 0.06 to 0.97 with a mean of 0.47 ±0.03. J’ for seine marsh edge samples
differed significantly only by delta (ME: F1 = 8.1, p < 0.006; Figure 3.5), but not by season or by
the interaction of delta and season. The marsh edge significant variance is largely explained by
summer active delta sites’ J’ being significantly higher than spring in the inactive delta. J’ for
open water samples differed by seasons (OW: F3=3.0, p<0.007; Figure 3.5), but not by delta or
by the interaction between delta and seasons. Open water samples variance is largely explained
by J’ within spring samples being significantly lower than J’ within summer and fall samples.
Page 43
34
A. B.
C. D. Figure 3.5. J’ Evenness index reported by gear type and habitat (marsh edge, ME; open water,
OW) for each delta. A.) throw trap and B.) bag seine water. Letters above bars denote
statistically significant differences (p<0.05).
3.2.5. Species Composition
ANOSIM of Bray-Curtis dissimilarity matrix results demonstrated significant differences
in nekton species composition between deltas for marsh edge and open water throw trap samples
for all seasons (Table 3.4). SIMPER analysis further demonstrated individual species most
responsible for these differences (Table 3.4). NMDS of Bray-Curtis dissimilarity matrix of
species between deltas were also plotted for visualization, with NMDS permutations reaching a
solution in 2 dimensions with stress < 0.15 for each analysis (Figure 3.6). Fall NMDS may have
insufficient data for accurate NMDS plotting as indicated by low stress (2d, stress = 0.0008).
A A AB
B
B
A
A
A
A A A A
A B
Page 44
35
A. B.
C. D.
E. F.
G. H.
Figure 3.6 Non-metric multidimensional scaling ordination 2-D bi plots of Bray-Curtis
dissimilarity indexes of nekton species composition by season and basin. Denoted are Summer
(marsh edge:A, open water:B), Fall(marsh edge:C, open water:D), Winter(marsh edge:E, open
water: F), and Spring(marsh edge:G, open water:H) throw trap samples by habitat (marsh
edge, open water) for active (red) and inactive deltas (blue).
Stress: 0.025 Stress: 0.028
Page 45
36
Table 3.4 ANOSIM and SIMPER results for comparison of nekton densities by habitat type
(marsh edge, ME; open water, OW) and season within throw trap samples. Presented are the
Global R for significant ANOSIM tests (p < 0.01), along with the top five dominant species and
SIMPER results for percentage distribution of dominant specie showing dissimilarity in species
composition between deltas.
Summer Fall Winter Spring
Habitat: ME OW ME OW ME OW ME OW
Global R: 0.75 0.92 0.62 0.59 0.61 0.78 0.70 0.92
P. pugio 50.3 12.7 4.2 36.8 35.7 26.0 23.8
M. ohione 7.9 23.1 33.4 27.4 20.0 16.6 18.0 B. patronus 15.1 9.8 8.6 31.0 19.9
C. sapidus 3.2 5.5 11.1 6.7 7.8 7.4 5.4
C. shufeldti 10.8 3.5 4.6 6.3 6.8
F. aztecus 8.7 4.4 13.5
L. parva 8.9 7.9
A. mitchilli 5.6 5.9
M. cephalus 10.3
Cumulative percentage 52.8 48.5 69.7 57.9 81.2 75.5 87.6 86.2
3.2.6. Blue Crab Young of the Year
Blue crab young of the year densities from throw traps for the active delta ranged from 0
to 22 ind. m-2 with a mean of 5 ± 0.9 ind. m-2, while young of the year for inactive sites ranged
from 0 to 33 ind. m-2 with a mean of 4.9 ± 0.9 ind. m-2. Blue crab young of the year densities for
marsh edge and open water throw trap samples differed significantly by the delta and season
interaction (ME: F1,3=7.3, p<0.0001; OW: F1,3=4.7, p<0.002). The marsh edge significant
interaction derives from fall densities from both deltas, and winter inactive densities being
significantly higher than all summer, and active delta winter and spring densities. The
significant interaction for young of the year blue crab densities within open water throw trap
samples can be largely explained by active delta fall young of the year blue crab densities being
significantly higher than spring and summer within the same delta, as well as summer inactive
Page 46
37
delta samples. Fall young of the year blue crab densities within inactive samples were also
significantly higher than inactive summer and active delta spring samples.
Bag seine blue crab young of the year catch per unit effort for the active delta ranged
from 0 to 126 with a mean of 10 ± 3.6, while inactive delta blue crab young of the year catch per
unit effort ranged from 0 to 71 with a mean of 8 ± 1.9. Blue crab young of the year catch per unit
effort for marsh edge and open water seine samples differed significantly by the delta and season
interaction (ME: F1,3=8.4, p<0.0001;OW: F1,3=3.3, p<0.02). The marsh edge significant
interaction is largely explained by fall catch per unit effort for both habitats, and winter inactive
delta catch per unit effort being significantly higher than all summer, and active delta winter and
spring catch per unit effort. Open water significant interaction can be largely explained by fall
catch per unit effort for both deltas, and winter inactive being significantly higher than summer
and spring for both deltas.
A. B.
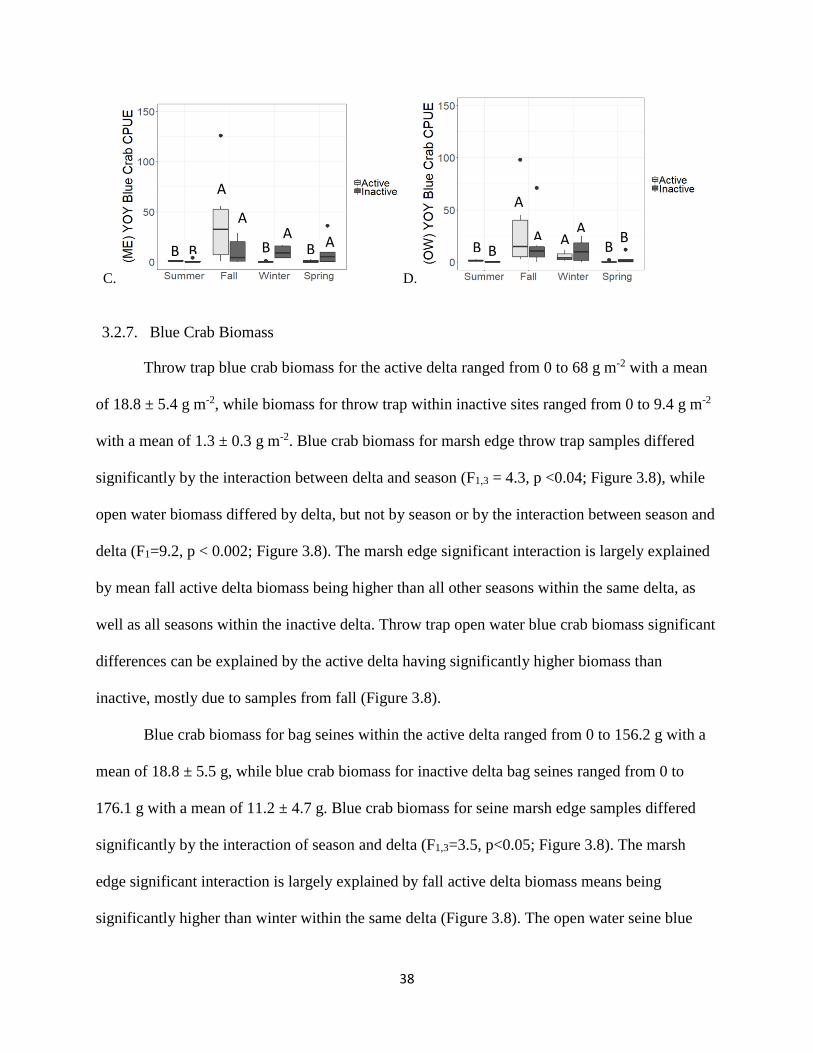
Figure 3.7. Blue crab, young of the year (YOY) (<30mm carapace width) reported by gear
type and habitat for each delta. A.) throw trap, marsh edge (ME); B.) throw trap, open water
(OW); C.) bag seine, marsh edge (ME); D.) bag seine, open water (OW). Letters above bars
denote statistically significant differences (p<0.05). Figure 3.7 continued.
A
B B
A
A A
B
A
B B A
BB
B B B
A
A
A
A
B
Page 47
38
C. D.
3.2.7. Blue Crab Biomass
Throw trap blue crab biomass for the active delta ranged from 0 to 68 g m-2 with a mean
of 18.8 ± 5.4 g m-2, while biomass for throw trap within inactive sites ranged from 0 to 9.4 g m-2
with a mean of 1.3 ± 0.3 g m-2. Blue crab biomass for marsh edge throw trap samples differed
significantly by the interaction between delta and season (F1,3 = 4.3, p <0.04; Figure 3.8), while
open water biomass differed by delta, but not by season or by the interaction between season and
delta (F1=9.2, p < 0.002; Figure 3.8). The marsh edge significant interaction is largely explained
by mean fall active delta biomass being higher than all other seasons within the same delta, as
well as all seasons within the inactive delta. Throw trap open water blue crab biomass significant
differences can be explained by the active delta having significantly higher biomass than
inactive, mostly due to samples from fall (Figure 3.8).
Blue crab biomass for bag seines within the active delta ranged from 0 to 156.2 g with a
mean of 18.8 ± 5.5 g, while blue crab biomass for inactive delta bag seines ranged from 0 to
176.1 g with a mean of 11.2 ± 4.7 g. Blue crab biomass for seine marsh edge samples differed
significantly by the interaction of season and delta (F1,3=3.5, p<0.05; Figure 3.8). The marsh
edge significant interaction is largely explained by fall active delta biomass means being
significantly higher than winter within the same delta (Figure 3.8). The open water seine blue
B B
A
A AB
A
B B
B B
A
A
B A
BC
AC
Page 48
39
crab biomass means differed significantly by season (F3=7.9, p <0.0002), but not between delta
or by the interaction between season and delta. The significance was largely due to higher
biomass within fall for both deltas when compared to all other seasons (Figure 3.8).
A. B.
C. D.
Figure 3.8. Blue crab biomass reported by gear type and habitat for each delta. A.)throw trap,
marsh edge (ME); B.)throw trap, open water (OW); C.) bag seine, marsh edge (ME); D.) bag
seine, open water (OW). Letters above bars denote statistically significant differences
(p<0.05).
3.2.8. Species – Environment Relationships
Regression models of throw trap catch for nekton species richness individuals m-2, nekton
biomass g m-2, young of the year blue crab densities individuals m-2, and blue crab biomass g m-2
against submerged aquatic vegetation biomass g m-2 were all statistically significant, but had low
R2 values(Figure 3.9). CCA models examining species-environment relationships (salinity,
A
B B B
AB
AB
A
AB
B AB
AB
AB
A B
A
B B B B B B B
Page 49
40
temperature, water depth, turbidity, submerged aquatic vegetation) on throw trap assemblages
were not significant.
A. B.
C. D.
Figure 3.9. Regression of A) nekton species richness, B) log transformed nekton biomass (g m-
2), C) Young of the year blue crab densities, and D) blue crab biomass (g m-2) against
submerged aquatic vegetation (SAV) biomass (g m-2). Grey area represents 95% confidence
intervals.
3.3. ISOTOPE
Mean δ13C values did not vary significantly between deltas for any species. Phragmites
australis tissue, benthic macro algae (benthic macro algae, BMA) tissue, and grass shrimp
muscle tissue mean δ15N values were also similar for both deltas. Myriophyllum spicatum
R2 = 0.16, p < 0.001 R
2 = 0.14, p < 0.001
R2= 0.09, p < 0.002 R
2= 0.16, p < 0.001
Page 50
41
(submerged aquatic vegetation) samples mean δ15N values varied by delta, with active delta
submerged aquatic vegetation means being two times higher than inactive sites. Adult and
juvenile Callinectes sapidus mean δ15N values varied between deltas, with active delta values 1.6
times higher than inactive sites for adult blue crabs, and 1.5 times for juvenile blue crabs (Table
3).
Table 3.5. Mean (SE) δ13C and δ15N stable isotope values by delta and species.
n= sample size, primary producers were pooled using triplicate samples at three sites.
Active Delta Inactive Delta
SPECIES n δ13C (‰) δ15N (‰) δ13C (‰) δ15N (‰)
Adult Callinectes sapidus 9 -23.9 (0.5) 13.2 (0.2) -25.5 (1.0) 8.2 (0.4)
Palaemonidae spp. 9 -22.1 (0.5) 12.2 (1.0) -22.3 (0.1) 11.2 (0.8)
Juvenile Callinectes sapidus 9 -22.5 (0.3) 12.7 (0.1) -21.9 (1.4) 8.3 (0.4)
Menidia beryllina 9 -24.5 (0.1) 15.9 (0.1) -23.5 (0.6) 11 (0.6)
Phragmites australis 3 -26.8 (0.2) 2.4 (1.5) -27.9 (0.3) 4.8 (0.3)
Myriophyllum spicatum 3 -21.5 (1.8) 8.9 (0.7) -15.9 (0.2) 4.4 (0.3)
Cladophora spp. 3 -21.8 (0.3) 7.9 (2.1) -22.3 (1.5) 5.3 (1.1)
Spartina alterniflora 4
-13.5 (0.2) 4.9 (0.3)
Page 51
42
Figure 3.10. Bi-plot of Mean ±SE δ13C and δ15N stable isotope values for nekton and
dominant vegetation species within active and inactive deltas.
Page 52
43
4. DISCUSSION
Nekton, blue crab abundance and nekton species richness differences were seasonally
driven, reflecting individual species life history, with most pronounced differences occurring
within and between deltas during the winter and spring when river flow was highest within the
active delta. This high river flow was associated with reduced salinity, temperature, and
submerged aquatic vegetation habitat within active delta sites compared to warmer seasons
within the same delta. During this time, decreased densities of nekton species and species
richness were evident in comparison to the inactive delta which did not experience these altered
water quality or habitat conditions during spring. Differences between the active and inactive
delta largely occurred during the extended period of high riverine flow, which in 2019, exceeded
previous river flows in both volume and duration providing a stark contrast between the deltas.
This unusually high riverine flow, however, provides some indication of the impact that
extended, high river flow may have on nekton assemblages and habitat availability within an
estuary. What is not clear, is whether the lower abundances of nekton were due to displacement
or increased habitat availability through flooding of often inaccessible marsh surfaces. Mean
Gulf menhaden and shrimp landings in Louisiana have been found to positively correlate with
sea level anomalies; thus variation in sea level could also play a role in nekton distribution
(Morris et al., 1990). As changes in freshwater flow are associated with numerous water quality
and habitat availability effects, determining direct linkages to nekton and economically important
species remains critical, and may be location and estuarine dependent.
Despite an increasing number of studies examining nekton assemblages in estuarine
shallow water environments, differences in habitats sampled, gear types used, and sample size
result in variable results. In particular, comparisons of “marsh edge” and “open water” habitat
Page 53
44
sampling highlights significant differences depending on distance from edges, and bottom type
for “open water”, and whether marsh edge is within the emergent vegetation or within the water
of shallow water areas. Differences have been previously identified when moving from within
the marsh surface, across the marsh/water interface, and away from the marsh into open water
habitat (i.e., Baltz et al., 1993, Peterson & Turner, 1994, Raposa & Oviatt, 2000, Kanouse et al.,
2006). Furthermore, studies have shown that variables, such as shoreline morphology landscape
location, and bottom characteristics (i.e., submerged aquatic vegetation or bare substrate) are
often associated with different nekton assemblages, but difficult to control for (La Peyre &
Birdsong 2008; Castellanos & Rozas, 2001; Fry et al., 2003, Jerabek et al., 2017; Kanouse et al.,
2006; Raposa & Roman, 2001). Additionally, differences in gear types limit the ability to
compare actual numbers as opposed to just trends. For example, Louisiana Department of
Wildlife and Fisheries uses seine nets for nekton sampling, however comparison with this
study’s data remains difficult due to differences in mesh size, and sampling technique (LDWF,
2002). Despite this variation in descriptions of habitat, this and past studies support the
overwhelming consensus that nekton in general, assemble in habitats providing structure;
although the composition of the assemblages may vary.
Nekton species densities (throw trap) and abundance (bag seines) measured in this study
fall within the wide range of previously reported values within similar shallow water, estuarine
habitats in Louisiana; though studies within tidally influenced, active deltas in the region are
lacking. For this study, mean nekton densities for the active delta were 44 ± 7.9 ind. m-2, while
inactive delta densities were 63.9 ± 10.8 ind. m-2. Previous studies within estuaries in Louisiana
have reported nekton densities ranging from 4 to 485 ind. m-2 (Thom et al., 2004, Jerabeck et al.,
2017; Kanouse et al., 2006, Piazza & La Peyre, 2007). Within the active Atchafalaya River
Page 54
45
Delta, one study reported nekton densities of 22 ind. m-2 within several shallow water habitats,
slightly lower than densities within active sites (Castellanos and Rozas, 2001). For this study,
mean nekton catch per unit effort for seine hauls was 88.9 ± 12.2 catch per unit effort for active
delta sites and 268 ± 49.7 catch per unit effort for the inactive delta. Previous studies using
seines within Louisiana estuaries have reported nekton catch ranging from 69 to 227 catch per
unit effort (Thom et al., 2004; La Peyre & Birdsong, 2008). Active delta nekton assemblages
were comparable to other studies within tidal freshwater marsh. Nekton species composition for
inactive and active deltas were largely dominated by crustaceans, with Palaemonid species (grass
and river shrimp) comprising from 44 % to 65% of total catch for both gear types for both deltas.
The dominance of crustaceans (predominately grass and river shrimp) alongside blue crabs
within tidal freshwater and oligohaline marshes has been reported in previous studies in
Louisiana, Texas, and Virginia similar to our results (Castellanos & Rozas, 2001; Rozas &
Odum, 1987; Zimmerman et al., 1990). Panaeid shrimp contributed a large percentage to inactive
delta samples, similar to other studies within brackish and salt marshes, (Hettler Jr., 1989; Rozas
& Minello, 2015; Jerabeck et al., 2017; Kanouse, et al., 2006) though these species were absent
from fresher waters within active delta sites. Other studies within tidally influenced freshwater
marshes also report few Panaeid shrimp, though within both the Atchafalaya River and the
diversion influenced upper Breton Sound, studies have reported higher densities of C.
variegatus, sheepshead minnow (Piazza & La Peyre, 2007; Castellanos & Rozas, 2001).
Castellanos & Rozas also reported a higher percentage of fish within Atchafalaya River Delta
samples (> 65%) than ours (44% for both gears within active sites), which could be due to
sampling different habitats during fewer seasons.
Page 55
46
Though differences between deltas were evident during winter and spring, season was found
to be the most influential factor in determining nekton community characteristics within both
deltas. Seasonality and life history traits of individual species may be a large driver of
differences between nekton communities within both deltas, with the exception of spring
sampling, when there were large increases in discharge from historic flooding of the Mississippi
River for active delta sites. Temperature and salinity are generally held as key environmental
variables that drive estuarine organisms life history (Neuparth et al., 2002). For example, both
deltas experienced higher densities of blue crabs during fall sampling than any other season,
similar to previous research looking at blue crab larval dispersion within the northern Gulf of
Mexico which reports high numbers of blue crab megalopae settlement to occur in the fall
(between August and September within the Mississippi bight, just east of the Mississippi River
delta (Perry et al., 2003).
While suitable habitat is important for settling blue crab megalopae, many other factors can
influence larval dispersal including currents, winds, and timing of recruitment (Etherington &
Eggleston, 2000). Another estuarine dependent decapod crustacean, brown shrimp (F. aztecus),
has been found to be most abundant in estuaries in the northern Gulf of Mexico from February to
March, followed by a peak from August to September (Rogers et al., 1993). Estuarine
recruitment of brown shrimp post larvae occurs when the strongest atmospheric cold fronts pass
through which result in significant shelf-estuarine exchanges and organismal transport (Rogers et
al., 1993). These seasonal (winter) events often dominate and override astronomically driven
tides in the northern Gulf (Denes & Caffrey, 1988). Brown shrimp was most abundant during fall
sampling within the inactive delta, and absent here during winter sampling. Estuarine densities of
another commercially important species, the gulf menhaden (Brevoortia patronus) is largely
Page 56
47
dependent on life history. A similar seasonal peak can be explained for gulf menhaden
(Brevoortia patronus). B. patronus spawns offshore in fall through winter, and larvae are carried
into estuaries where they metamorphose into juveniles. Juveniles then spend spring and their first
summer in estuaries before migrating offshore by fall (Vaughan et al., 2007). This study found
highest numbers of B. patronus occurred in both deltas during spring sampling as would be
predicted based on their life history.
Seasonal variation in environmental and water quality variables may impact nekton
assemblages directly, through impacts on salinity and temperature, and indirectly, through
salinity and temperature impacts on submerged aquatic vegetation. Submerged aquatic
vegetation seasonal growth patterns can influence availability of structured habitat for nekton
within upper estuaries. While greatest submerged aquatic vegetation biomass was recorded
during early fall sampling for this study, studies focused explicitly on submerged aquatic
vegetation indicate peak biomass during summer months, though this may vary depending on
water clarity, temperature, or even nutrient concentrations (Hillmann et al., 2019; Cho &
Poirrier, 2005; Orth et al., 2010). Greater submerged aquatic vegetation biomass and diversity
were also found with lower salinity environments across coastal Louisiana (Hillmann et al.,
2019).
Changes in submerged aquatic vegetation biomass impact structural habitat available to
nekton, and, in this study, partially explained nekton richness, density and blue crab densities
specifically. These findings are similar to findings from Aransas Bay, Texas, as well as in the
Atchafalaya Delta, Louisiana, which found highest abundance of nekton species within
structured habitat (submerged aquatic vegetation or emergent marsh) when compared with
unvegetated mud bottom (Castellanos & Rozas, 2001; Kanouse et al., 2006; Rozas & Minello,
Page 57
48
1998). Another study across coastal Louisiana found five times higher nekton densities in
submerged aquatic vegetation when compared with marsh edge or mud bottom (La Peyre &
Gordon, 2012). These findings are important when examining effects of flow as submerged
aquatic vegetation prevalence and biomass has been found to be impacted by amount of
freshwater flow. Previous research shows that flow and lower salinities from Carnaervon
diversion coincided with increased growth of submerged aquatic vegetation within flow areas
compared to a more saline reference area, suggesting that higher flow could benefit nekton
community diversity through increased habitat (Rozas et al., 2005). However, within this study
lowest submerged aquatic vegetation biomass occurred from sampling during periods of highest
river discharge, implicating a possible lagged effect relating higher flow and increased
submerged aquatic vegetation biomass.
Density estimates for many species among different habitats could further be influenced
through other hydrodynamic processes such as tidal movement (Rozas & Minello, 1997) or sea
level anomalies (Morris et al., 1990). Water depths within samples were consistently lower for
active sites, and shallowest depths were reported for both sites during winter sampling. One
study along the Connecticut coast found flooding depth, duration, and frequency within
Phragmites australis marshes were significantly reduced compared with Spartina alterniflora
marshes, meaning nekton could not use P. australis marsh interior as much as S. alterniflora
interior (Osgood et al., 2003). However, these findings may not be applicable to Louisiana
coastal marshes due largely to spatial and temporal differences. Active delta marshes are
dominated by P. australis, while the inactive delta marshes are more variable, though dominated
by S. alterniflora. These differences in emergent vegetation species alone could alter availability
of flooded marsh habitat for nekton usage. Another study found Spartina production to be highly
Page 58
49
correlated with mean monthly sea level anomalies during the summer growing period, and that
Gulf menhaden (Brevoortia patronus) and Panaeid shrimp landings in Louisiana were positively
correlated with lagged (to account for life cycle) mean sea level anomalies (Morris et al., 1990).
Thus, primary and secondary production can increase with increased but intermittent marsh
inundation depending on sea level anomalies.
Water levels vary temporally and spatially for each delta, and freshwater flow from the
Mississippi River is generally highest during winter and spring. Lower numbers reported during
these seasons could be due to not sampling interior marsh surface. Research in Florida actually
noted an increase in species richness with decreasing flows due to invasion by marine species,
and suggested other metrics be analyzed as well as diversity to set flow criteria (Palmer et al.,
2015). Physical characteristics of marsh edge such as slope is also a factor in determining
nekton community structure. One study found that shallower slopes support more organisms and
resident species than steeper slopes, though marsh edges with steeper slopes support more
diverse and species rich assemblages (La Peyre & Birdsong, 2008). Though marsh edge type and
slope was not accounted for in this study, variation in these factors between sites and deltas
could impact nekton assemblages and blue crab population dynamics.
High freshwater flow for winter and spring in the active delta created more variation
throughout the sampling period when compared to the inactive delta, which is reflected in higher
variation of nekton assemblage characteristics in the active delta sites. Variation from flow can
influence nekton through altering salinity, temperature, and water depth. Magnitude of
freshwater flow has been shown to influence nekton along other estuaries, and extreme flow
where frequency or severity becomes too great can lower species diversity and abundance,
possibly explaining differences within spring samples (Olin et al., 2015). Furthermore,
Page 59
50
temperature has been shown to be a contributing factor to the distributions of marine organisms,
and lower temperatures within active sites during winter and spring associated with high flow
may not only lower submerged aquatic vegetation biomass, but also alter nekton densities
(Leffler, 1972). Thus, timing of flows could negatively or positively influence estuarine nekton;
possibly depending on water temperature. Contrary to active delta sites, inactive delta sites’
temperature was less variable, and nekton communities were generally less so as well.
Studies have demonstrated the importance of freshwater flow to estuarine systems in
determining estuarine function and ecosystem health, though freshwater flow is difficult to
quantify within the Louisiana coastal region (Benson, 1981). Differences among nekton species
assemblages between deltas can be further attributed to variations in salinity by delta. Salinity
has been shown to be an important factor structuring nekton communities within estuaries, and to
be highly negatively correlated to riverine freshwater flow (Greenwood et al., 2007; Piazza & La
Peyre, 2011). Panaeid shrimp were largely absent from active delta sites, yet densities were
consistently high in the inactive delta during summer and fall. Brown (F. aztecus) and white
shrimp (L. setiferus) use estuaries as nurseries, though the role of salinity in their production is
complex (Doeru et al., 2016). Our results are similar to previous research in that these species
had higher densities associated with higher salinities (Zimmerman et al., 1990).
Selected gear types had different patterns when compared with each other, though richness
was similar between both. Total nekton densities for the inactive delta were 1.5 times greater
than the active delta for throw trap samples, while bag seine differences were greatly
exaggerated with the inactive delta abundance being 3.5 times greater within inactive than active.
Throw traps were adequate in effectively sampling both areas, yet bag seine effort varied due to
extremely soft, mud bottom within active sites most notably during winter and spring. Catch
Page 60
51
efficiencies for bag seines have been shown to be highly variable due to environmental
characteristics, which is problematic when environmental characteristics are related to the
treatment (Rozas & Minello, 1997). For instance, seining over soft substrate within different sites
may have altered catch efficiencies, which could have confounded nekton abundance numbers.
Specifically within active delta sites, soft bottom and steep drop offs at several sites made
effective seining almost impossible, while inactive sites where characterized by firmer substrate
and more consistent depths gently sloping away from the marsh edge, making sampling with bag
seines here more effective. Furthermore, previous research suggests abundances cannot be
accurately measured using seines in submerged aquatic vegetation or emergent marsh, further
impeding results (Orth & Vanmontfrans, 1987). Gear types could further impact nekton results
through species selectivity. Juvenile Penaeid shrimp have been found to avoid seines by
burrowing into the substrate, and small, epibenthic species are more difficult to remove from
throw traps than pelagic or semi-pelagic organisms (Rozas & Minello, 1997)
Past research has suggested that riverine flow quantity and timing affect nekton species
abundance and recruitment of resident consumers, thus understanding this relationship is of
utmost importance in regards to river management and biological resources (Piazza & La Peyre,
2007; Piazza & La Peyre, 2011). Previous studies have reported positive relationships between
freshwater flow and blue crab landings in Texas, Florida, and Louisiana (Doering & Wan, 2018;
Guillory, 2000; Powell et al., 2002; Wilber, 1994). However, these studies are limited in that
they do not explain the mechanisms that drive these trends, hypothesizing possible causes such
as increased juvenile habitat or increased nutrient and detrital flow indirectly enhancing food
supply from increased flows. Guillory (2000) analyzed Louisiana Department of Wildlife and
Fisheries blue crab commercial landings from 1960 to 1997 with corresponding annual discharge
Page 61
52
in cubic feet per second from the Mississippi River gauge at Tarbert’s Landing, reporting
increased commercial landings associated with increased discharge. Using the same gauge and
Louisiana Department of Wildlife and Fisheries commercial blue crab landing data from 1999 to
2016, a negative correlation between landings from the active Mississippi River Delta and
discharge is evident (r = -0.56, p = 0.02; Figure B.1). However, data on effort were not available
to validate this finding.
Enriched δ15N values from primary producers, nekton species, and blue crabs suggest that
trophic webs within the active delta are supported through riverine influence - freshwater flows
have been shown to carry distinct stable isotope values that can be traced through the estuarine
food web, providing a tool for examining connections between freshwater flows and estuarine
consumers (Fry, 2002). Stable isotope analysis within this study was useful to confirm
allochtonous support of the trophic system within the active delta, but not relative contributions
of primary producers towards blue crab diets. Future research aimed at better understanding blue
crab dietary contributions and trophic support from freshwater flow should address these
shortcomings by including analyses of more potential sources, including samples of particulate
organic matter (POM) and detritus.
Diversions may provide increased production due to increased nutrient input. Our study
complements other research in that the active delta contained higher biomass of submerged
aquatic vegetation (Hillmann et al., 2019), though not during winter and early spring. Regardless,
blue crab densities were comparable to inactive delta sites with less flow and less submerged
aquatic vegetation, and overall nekton abundance – contrary to other research – was not strongly
correlated with higher submerged aquatic vegetation biomass. Species richness, nekton biomass,
young of the year blue crab abundance, and blue crab biomass regressions against submerged
Page 62
53
aquatic vegetation biomass were significant, however r squared was very low for all analyses.
Furthermore, Louisiana Department of Wildlife and Fisheries fisheries independent seine data
from 2013 to 2018 show a mean catch per unit effort of 4.2 for blue crabs for active sites, while
mean seine catch per unit effort within the inactive delta was reported to be over twice as high at
8.5 crabs per seine.
Gear efficiency differences may also be responsible for the different catch per unit effort
patterns between deltas. For our study, blue crab densities within throw traps for both deltas
were similar, with the exception of winter and early spring sampling; thus variation in gear
capture efficiency between areas could also explain differences in catch per unit effort for
Louisiana Department of Wildlife and Fisheries data. Louisiana Department of Wildlife and
Fisheries commercial blue crab landings for both regions from 1999 to 2016 show landings to
also be higher in the inactive delta than active delta, though this area is more accessible with a
higher amount of crabbers. Highest densities of recently settled blue crabs were found during fall
months within our study, similar to others (Aguilar et al., 2005; Rabalais et al., 1995; Sutton &
Wagner, 2007; Thomas et al., 1990). This may suggest flow effects from sediment diversions are
likely most important to consider during this period of settlement for blue crab populations in
Louisiana. This complements previous research which has suggested operating river diversions
to minimize effects to mating females during spring, as well as the spawning period in the fall
(Peyronnin et al., 2017).
Overall, both deltas supported similar densities of nekton species, though assemblages
differed. There was a distinct seasonal trend within both deltas, reflecting individual species life
histories as well as temperature driven submerged aquatic vegetation cycles and salinities.
Seasonal variation was most pronounced within the active delta during winter and spring, the
Page 63
54
periods of highest flow resulting in low salinity, temperatures, and reduced submerged aquatic
vegetation alongside increased variation in nekton communities in the active delta than the
inactive delta. Flow can affect water quality and habitat, and the timing and quantity is likely
important in determining nekton community structure and habitat availability. As changes in
freshwater flow are associated with numerous water quality and habitat availability effects,
determining direct linkages to estuarine nekton and economically important species remains
critical, and may be location and estuarine dependent.
Page 64
55
BIBLIOGRAPHY
Aguilar, R., Hines, A. H., Wolcott, T. G., Wolcott, D. L., Kramer, M. A., & Lipcius, R. N. (2005). The
timing and route of movement and migration of post-copulatory female blue crabs, Callinectes
sapidus Rathbun, from the upper Chesapeake Bay. Journal of Experimental Marine Biology and
Ecology, 319(1), 117-128. doi:https://doi.org/10.1016/j.jembe.2004.08.030
Alber, M. (2002). A conceptual model of estuarine freshwater inflow management. Estuaries, 25(6),
1246-1261. doi:10.1007/bf02692222
Amer, R., Kolker, A. S., & Muscietta, A. (2017). Propensity for erosion and deposition in a deltaic
wetland complex: Implications for river management and coastal restoration. Remote Sensing of
Environment, 199, 39-50. doi:https://doi.org/10.1016/j.rse.2017.06.030
Benson, N. G. (1981). The freshwater inflow to estuaries issue. Fisheries, 6(5), 8-10.
Boesch, D. F., Josselyn, M. N., Mehta, A. J., Morris, J. T., Nuttle, W. K., Simenstad, C. A., & Swift, D. J.
P. (1994). Scientific Assessment of Coastal Wetland Loss, Restoration and Management in
Louisiana. Journal of Coastal Research, i-103.
Bourgeois, M., Marx, J., & Semon, K. (2014). Louisiana blue crab fishery management plan. Louisiana
Department of Wildlife and Fisheries.
Bucci, J., Showers, W., Rebach, S., DeMaster, D., & Genna, B. (2007). Stable isotope analyses (δ15 N
and δ13 C) of the trophic relationships of Callinectes sapidus in two North Carolina estuaries.
Estuaries and Coasts - ESTUARIES COASTS, 30, 1049-1059. doi:10.1007/BF02841395
Caddy, J. F., & Bakun, A. (1994). A tentative classification of coastal marine ecosystems based on
dominant processes of nutrient supply. Ocean & Coastal Management, 23(3), 201-211.
doi:https://doi.org/10.1016/0964-5691(94)90019-1
Caley, M. J., Carr, M. H., Hixon, M. A., Hughes, T. P., Jones, G. P., & Menge, B. A. (1996).
RECRUITMENT AND THE LOCAL DYNAMICS OF OPEN MARINE POPULATIONS.
Annual Review of Ecology and Systematics, 27(1), 477-500.
doi:10.1146/annurev.ecolsys.27.1.477
Castellanos, D. L., & Rozas, L. P. (2001). Nekton use of submerged aquatic vegetation, marsh, and
shallow unvegetated bottom in the Atchafalaya River delta, a Louisiana tidal freshwater
ecosystem. Estuaries, 24(2), 184-197. doi:10.2307/1352943
Cho, H. J., & Poirrier, M. A. (2005). Seasonal growth and reproduction of Ruppia maritima L. sl in Lake
Pontchartrain, Louisiana, USA. Aquatic Botany, 81(1), 37-49.
Coleman, J. M. (1988). Dynamic changes and processes in the Mississippi River delta. GSA Bulletin,
100(7), 999-1015. doi:10.1130/0016-7606(1988)100<0999:Dcapit>2.3.Co;2
Couvillion, B. R., Beck, H., Schoolmaster, D., & Fischer, M. (2017). Land area change in coastal
Louisiana (1932 to 2016) (3381). Retrieved from Reston, VA:
http://pubs.er.usgs.gov/publication/sim3381
Page 65
56
Crane, D. P., & Kapuscinski, K. L. (2018). Capture efficiency of a fine mesh seine in a large river:
Implications for abundance, richness, and diversity analyses. Fisheries Research, 205, 149-157.
doi:https://doi.org/10.1016/j.fishres.2018.04.018
Day, J. W., Boesch, D. F., Clairain, E. J., Kemp, G. P., Laska, S. B., Mitsch, W. J., . . . Whigham, D. F.
(2007). Restoration of the Mississippi Delta: Lessons from Hurricanes Katrina and Rita. Science,
315(5819), 1679-1684. doi:10.1126/science.1137030
Day, J. W., Britsch, L. D., Hawes, S. R., Shaffer, G. P., Reed, D. J., & Cahoon, D. (2000). Pattern and
process of land loss in the Mississippi Delta: A Spatial and temporal analysis of wetland habitat
change. Estuaries, 23(4), 425-438. doi:10.2307/1353136
de Mutsert, K., & Cowan, J. H. (2012). A Before–After–Control–Impact Analysis of the Effects of a
Mississippi River Freshwater Diversion on Estuarine Nekton in Louisiana, USA. Estuaries and
Coasts, 35(5), 1237-1248. doi:10.1007/s12237-012-9522-y
Denes, T. A. & Caffrey, J. M. (1988) Changes in seasonal water transport in a Louisiana estuary,
Fourleague Bay, Louisiana. Estuaries 11, 184 -191
Deniro, M. J., & Epstein, S. (1981). Influence of diet on the distribution of nitrogen isotopes in animals.
Geochimica et Cosmochimica Acta, 45(3), 341-351. doi:https://doi.org/10.1016/0016-
7037(81)90244-1
Doering, P. H., & Wan, Y. (2018). Ecohydrological controls on blue crab landings and minimum
freshwater inflow to the Caloosahatchee Estuary, Florida. Wetlands Ecology & Management,
26(2), 161-174. doi:10.1007/s11273-017-9563-x
Doerr, J. C., Liu, H., & Minello, T. J. (2016). Salinity selection by juvenile brown shrimp
(Farfantepenaeus aztecus) and white shrimp (Litopenaeus setiferus) in a gradient tank. Estuaries
and Coasts, 39(3), 829-838.
Etherington, L. L., & Eggleston, D. B. (2000). Large-scale blue crab recruitment: linking postlarval
transport, post-settlement planktonic dispersal, and multiple nursery habitats. Marine Ecology
Progress Series, 204, 179-198.
Frazier, D. E. (1967). Recent Deltaic Deposits of the Mississippi River: Their Development and
Chronology. Gulf Coast Association of Geological Societies Transactions, 17, 29.
Fry, B. (2002). Conservative mixing of stable isotopes across estuarine salinity gradients: a conceptual
framework for monitoring watershed influences on downstream fisheries production. Estuaries,
25(2), 264-271.
Fry, B., Baltz, D. M., Benfield, M. C., Fleeger, J. W., Gace, A., Haas, H. L., & Quiñones-Rivera, Z. J.
(2003). Stable isotope indicators of movement and residency for brown shrimp (Farfantepenaeus
aztecus) in coastal Louisiana marshscapes. Estuaries, 26(1), 82-97. doi:10.1007/bf02691696
Galindo-Bect, M. S., HernÁNdez-AyÓN, J. M., LavÍN, M. F., Diaz, M. A. H., Hinojosa, F. D., & Zavala,
J. A. S. (2010). DISTRIBUTION OF PENAEID SHRIMP LARVAE AND POSTLARVAE IN
THE UPPER GULF OF CALIFORNIA. Crustaceana, 83(7), 809-819.
Page 66
57
Gotham, K. F. (2016). Coastal Restoration as Contested Terrain: Climate Change and the Political
Economy of Risk Reduction in Louisiana. Sociological Forum, 31(S1), 787-806.
doi:10.1111/socf.12273
Graham, D. J., Perry, H., Biesiot, P., & Fulford, R. (2012). Fecundity and egg diameter of primiparous
and multiparous blue crab Callinectes sapidus (Brachyura: Portunidae) in Mississippi waters.
Journal of Crustacean Biology, 32(1), 49-56.
Greenwood, M., Matheson Jr, R., McMichael Jr, R., & MacDonald, T. (2007). Community structure of
shoreline nekton in the estuarine portion of the Alafia River, Florida: differences along a salinity
gradient and inflow-related changes. Estuarine, Coastal and Shelf Science, 74(1-2), 223-238.
Grimes, C. B. (2001). Fishery Production and the Mississippi River Discharge. Fisheries, 26(8), 17-26.
doi:10.1577/1548-8446(2001)026<0017:Fpatmr>2.0.Co;2
Guillory, V. (2000). Relationship of blue crab abundance to river discharge and salinity. Paper presented
at the Proc. Ann. Conf. SE Assoc. Fish Wildl. Agen.
Heck Jr., K. L., Hays, G., & Orth, R. J. (2003). Critical evaluation of the nursery role hypothesis for
seagrass meadows. Marine Ecology Progress Series, 253, 123-136.
Hettler Jr, W. F. (1989). Nekton use of regularly-flooded saltmarsh cordgrass habitat in North Carolina,
USA. Marine ecology progress series. Oldendorf, 56(1), 111-118.
Hillmann, E. R., DeMarco, K., & La Peyre, M. K. (2019). Salinity and water clarity dictate seasonal
variability in coastal submerged aquatic vegetation in subtropical estuarine environments. Aquatic
Biology, 28, 175-186.
Hines, A. H., Jivoff, P. R., Bushmann, P. J., van Montfrans, J., Reed, S. A., Wolcott, D. L., & Wolcott, T.
G. (2003). Evidence for sperm limitation in the blue crab, Callinectes sapidus. Bulletin of Marine
Science, 72(2), 287-310.
Hines, A. H., Lipcius, R. N., & Haddon, A. M. (1987). Population dynamics and habitat partitioning by
size, sex, and molt stage of blue crabs Callinectes sapidus in a subestuary of central Chesapeake
Bay. Marine Ecology Progress Series, 36(1), 55-64.
Hoeinghaus, D. J., & Davis, S. E. (2007). Size-based trophic shifts of saltmarsh dwelling blue crabs
elucidated by dual stable C and N isotope analyses. Marine Ecology Progress Series, 334, 199-
204.
Houde, E. D., & Rutherford, E. S. (1993). Recent trends in estuarine fisheries: Predictions of fish
production and yield. Estuaries, 16(2), 161-176. doi:10.2307/1352488
Jerabek, A., Darnell, K. M., Pellerin, C., & Carruthers, T. J. (2017). use of Marsh edge and Submerged
Aquatic vegetation as Habitat by Fish and Crustaceans in Degrading Southern louisiana Coastal
Marshes. southeastern geographer, 57(3), 212-230.
Jivoff, P. (1997). The Relative Roles of Predation and Sperm Competition on the Duration of the Post-
Copulatory Association between the Sexes in the Blue Crab, Callinectes sapidus. Behavioral
Ecology and Sociobiology, 40(3), 175-185.
Page 67
58
Jivoff, P., & Hines, A. H. (1998). Female behaviour, sexual competition and mate guarding in the blue
crab,Callinectes sapidus. Animal Behaviour, 55(3), 589-603.
doi:https://doi.org/10.1006/anbe.1997.0646
Joe West, H. B., Jeff Marx, Joseph E. Powers. (2016). Update Assessment of Blue Crab in Louisiana
Waters 2016 Report. Retrieved from
Jordan, S. J., & Peterson, M. S. (2012). Contributions of Estuarine Habitats to Major Fisheries. Estuaries:
classification, ecology, and human impacts, 17.
Kanouse, S., La Peyre, M. K., & Nyman, J. A. (2006). Nekton use of Ruppia maritima and non-vegetated
bottom habitat types within brackish marsh ponds. Marine Ecology Progress Series, 327, 61-69.
Keithly, W. R., & Roberts, K. J. (2017). Commercial and Recreational Fisheries of the Gulf of Mexico. In
C. H. Ward (Ed.), Habitats and Biota of the Gulf of Mexico: Before the Deepwater Horizon Oil
Spill: Volume 2: Fish Resources, Fisheries, Sea Turtles, Avian Resources, Marine Mammals,
Diseases and Mortalities (pp. 1039-1188). New York, NY: Springer New York.
La Peyre, M. K., & Birdsong, T. (2008). Physical variation of non-vegetated marsh edge habitats, and use
patterns by nekton in Barataria Bay, Louisiana, USA. Marine Ecology Progress Series, 356, 51-
61.
La Peyre, M. K., Eberline, B. S., Soniat, T. M., & La Peyre, J. F. (2013). Differences in extreme low
salinity timing and duration differentially affect eastern oyster (Crassostrea virginica) size class
growth and mortality in Breton Sound, LA. Estuarine, Coastal and Shelf Science, 135, 146-157.
doi:https://doi.org/10.1016/j.ecss.2013.10.001
La Peyre, M. K., & Gordon, J. (2012). Nekton density patterns and hurricane recovery in submerged
aquatic vegetation, and along non-vegetated natural and created edge habitats. Estuarine, Coastal
and Shelf Science, 98, 108-118.
LACPRA. (2017). Louisiana's Comprehensive Master Plan for a Sustainable Coast. Retrieved from
Baton Rouge, LA:
Lavın, M. F., & Sánchez, S. (1999). On how the colorado river affected the hydrography of the upper
Gulf of California. Continental Shelf Research, 19(12), 1545-1560.
doi:https://doi.org/10.1016/S0278-4343(99)00030-8
Leffler, C. (1972). Some effects of temperature on the growth and metabolic rate of juvenile blue crabs,
Callinectes sapidus, in the laboratory. Marine Biology, 14(2), 104-110.
Llewellyn, C., & LaPeyre, M. K. (2010). Evaluating ecological equivalence of created marshes:
comparing structural indicators with stable isotope indicators of blue crab trophic support.
Estuaries and Coasts, 34(1), 172-184. doi:10.1007/s12237-010-9297-y
Lloret, J., Palomera, I., Salat, J., & Sole, I. (2004). Impact of freshwater input and wind on landings of
anchovy (Engraulis encrasicolus) and sardine (Sardina pilchardus) in shelf waters surrounding the
Ebre (Ebro) River delta (north-western Mediterranean). Fisheries Oceanography, 13(2), 102-110.
doi:10.1046/j.1365-2419.2003.00279.x
Louisiana Department of Wildlife and Fisheries (2002) Marine Fisheries Division: Field Procedures
Page 68
59
Manual, Version 02-1 Louisiana Department of Wildlife and Fisheries, Office of fisheries,
Marine Fisheries Division, Baton Rouge, Louisiana
Marshall, D. A., Lebreton, B., Palmer, T., De Santiago, K., & Beseres Pollack, J. (2019). Salinity
disturbance affects faunal community composition and organic matter on a restored Crassostrea
virginica oyster reef. Estuarine, Coastal and Shelf Science, 226, 106267.
doi:https://doi.org/10.1016/j.ecss.2019.106267
Mitsch, W. J., Day, J. W., Zhang, L., & Lane, R. R. (2005). Nitrate-nitrogen retention in wetlands in the
Mississippi River Basin. Ecological Engineering, 24(4), 267-278.
doi:https://doi.org/10.1016/j.ecoleng.2005.02.005
Morris, J. T., Kjerfve, B., & Dean, J. M. (1990). Dependence of Estuarine Productivity on Anomalies in
Mean Sea Level. Limnology and Oceanography, 35(4) 926-930.
Neuparth, T., Costa, F. O., & Costa, M. H. (2002). Effects of temperature and salinity on life history of
the marine amphipod Gammarus locusta. Implications for ecotoxicological testing.
Ecotoxicology, 11(1), 61-73.
Nyman, J. A., Delaune, R. D., & Patrick, W. H. (1990). Wetland soil formation in the rapidly subsiding
Mississippi River Deltaic Plain: Mineral and organic matter relationships. Estuarine, Coastal and
Shelf Science, 31(1), 57-69. doi:https://doi.org/10.1016/0272-7714(90)90028-P
O'Connell, M. T., Franze, C. D., Spalding, E. A., & Poirrier, M. A. (2005). Biological Resources of the
Louisiana Coast: Part 2. Coastal Animals and Habitat Associations. Journal of Coastal Research,
146-161.
Oksanen, J., Blanchet, F. G., Kindt, R., Legendre, P., Minchin, P. R., O’hara, R. B., ... & Oksanen, M. J.
(2013). Package ‘vegan’. Community ecology package, version, 2(9), 1-295.
Olin, J. A., Stevens, P. W., Rush, S. A., Hussey, N. E., & Fisk, A. T. (2015). Loss of seasonal variability
in nekton community structure in a tidal river: evidence for homogenization in a flow-altered
system. Hydrobiologia, 744(1), 271-286.
Orth, R. J., & Vanmontfrans, J. (1987). Utilization of a seagrass meadow and tidal marsh creek by blue
crabs Callinectes sapidus. I. Seasonal and annual variations in abundance with emphasis on post-
settlement juveniles. Marine Ecology Progress Series, 41, 283.
Orth, R. J., Williams, M. R., Marion, S. R., Wilcox, D. J., Carruthers, T. J., Moore, K. A., ... & Batiuk, R.
A. (2010). Long-term trends in submersed aquatic vegetation (SAV) in Chesapeake Bay, USA,
related to water quality. Estuaries and Coasts, 33(5), 1144-1163.
Osgood, D. T., Yozzo, D. J., Chambers, R. M., Jacobson, D., Hoffman, T., & Wnek, J. (2003). Tidal
hydrology and habitat utilization by resident nekton inPragmites and Non-Phragmites Marshes.
Estuaries, 26(2), 522-533.
Palmer, T., Montagna, P., Chamberlain, R., Doering, P., Wan, Y., Haunert, K., & Crean, D. (2015).
Determining the effects of freshwater inflow on benthic macrofauna in the Caloosahatchee
Estuary, Florida. Integrated environmental assessment and management, 12.
doi:10.1002/ieam.1688
Page 69
60
Perkins-Visser, E., Wolcott, T. G., & Wolcott, D. L. (1996). Nursery role of seagrass beds: enhanced
growth of juvenile blue crabs (Callinectes sapidus Rathbun). Journal of Experimental Marine
Biology and Ecology, 198(2), 155-173. doi:https://doi.org/10.1016/0022-0981(96)00014-7
Perry, H., Johnson, D. R., Larsen, K., Trigg, C., & Vukovich, F. (2003). Blue crab larval dispersion and
retention in the Mississippi Bight: testing the hypothesis. Bulletin of Marine Science, 72(2), 331-
346.
Perry, H. M., & VanderKooy, S. (2015). The blue crab fishery of the Gulf of Mexico, United States: a
regional management plan: Gulf States Marine Fisheries Commission.
Peyronnin, N., Caffey, R., Cowan, J., Justic, D., Kolker, A., Laska, S., . . . Twilley, R. (2017). Optimizing
sediment diversion operations: working group recommendations for integrating complex
ecological and social landscape interactions. Water, 9(6), 368.
Piazza, B. P., & La Peyre, M. K. (2007). Restoration of the annual flood pulse in Breton Sound,
Louisiana, USA: habitat change and nekton community response. Aquatic Biology, 1(2), 109-119.
Piazza, B. P., & La Peyre, M. K. (2010). Using Gambusia affinis growth and condition to assess estuarine
habitat quality: a comparison of indices. Marine Ecology Progress Series, 412, 231-245.
Piazza, B. P., & La Peyre, M. K. (2011). Nekton community response to a large-scale Mississippi River
discharge: Examining spatial and temporal response to river management. Estuarine, Coastal and
Shelf Science, 91(3), 379-387. doi:https://doi.org/10.1016/j.ecss.2010.11.001
Poormahdi, S., Graham, S. A., & Mendelssohn, I. A. (2018). Wetland Plant Community Responses to the
Interactive Effects of Simulated Nutrient and Sediment Loading: Implications for Coastal
Restoration Using Mississippi River Diversions. Estuaries and coasts, 41(6), 1679-1698.
Posey, M. H., Alphin, T. D., Harwell, H., & Allen, B. (2005). Importance of low salinity areas for
juvenile blue crabs, Callinectes sapidus Rathbun, in river-dominated estuaries of southeastern
United States. Journal of Experimental Marine Biology and Ecology, 319(1), 81-100.
doi:https://doi.org/10.1016/j.jembe.2004.04.021
Post, D. M. (2002). Using stable isotopes to estimate trophic position: models, methods, and assumptions.
Ecology, 83(3), 703-718.
Powell, G. L., Matsumoto, J., & Brock, D. A. (2002). Methods for determining minimum freshwater
inflow needs of Texas bays and estuaries. Estuaries, 25(6), 1262-1274.
Rabalais, N. N., Burditt, J. R. F., Coen, L. D., Cole, B. E., Eleuterius, C., Heck, J. K. L., . . . Zimmerman,
R. J. (1995). Settlement of Callinectes Sapidus Megalopae on Artificial Collectors in Four Gulf of
Mexico Estuaries. Bulletin of Marine Science, 57(3), 855-876.
Raposa, K. B., & Roman, C. T. (2001). Seasonal habitat-use patterns of nekton in a tide-restricted and
unrestricted New England salt marsh. Wetlands, 21(4), 451-461.
Rogers, B. D., Shaw, R. F., Herke, W. H., & Blanchet, R. H. (1993). Recruitment of postlarval and
juvenile brown shrimp (Penaeus aztecus Ives) from offshore to estuarine waters of the
northwestern Gulf of Mexico. Estuarine, Coastal and Shelf Science, 36(4), 377-394.
Page 70
61
Rosenberg, A., Bigford, T. E., Leathery, S., Hill, R. L., & Bickers, K. (2000). Ecosystem approaches to
fishery management through essential fish habitat. Bulletin of Marine Science, 66(3), 535-542.
Rozas, L. P., & Minello, T. J. (1997). Estimating densities of small fishes and decapod crustaceans in
shallow estuarine habitats: a review of sampling design with focus on gear selection. Estuaries,
20(1), 199-213.
Rozas, L. P., & Minello, T. J. (1998). Nekton use of salt marsh, seagrass, and nonvegetated habitats in a
south Texas (USA) estuary. Bulletin of Marine Science, 63(3), 481-501.
Rozas, L. P., & Minello, T. J. (2011). Variation in penaeid shrimp growth rates along an estuarine salinity
gradient: Implications for managing river diversions. Journal of Experimental Marine Biology
and Ecology, 397(2), 196-207. doi:https://doi.org/10.1016/j.jembe.2010.12.003
Rozas, L. P., & Minello, T. J. (2015). Small-scale nekton density and growth patterns across a saltmarsh
landscape in Barataria Bay, Louisiana. Estuaries and Coasts, 38(6), 2000-2018.
Rozas, L. P., Minello, T. J., Munuera-Fernández, I., Fry, B., & Wissel, B. (2005). Macrofaunal
distributions and habitat change following winter–spring releases of freshwater into the Breton
Sound estuary, Louisiana (USA). Estuarine, Coastal and Shelf Science, 65(1), 319-336.
doi:https://doi.org/10.1016/j.ecss.2005.05.019
Rozas, L. P., & Odum, W. E. (1987). Fish and macrocrustacean use of submerged plant beds in tidal
freshwater marsh creeks. Marine Ecology Progress Series, 38, 101-108.
Sanchez-Rubio, G., Perry, H. M., Biesiot, P. M., Johnson, D. R., & Lipcius, R. N. (2011). Climate-related
hydrological regimes and their effects on abundance of juvenile blue crabs (Callinectes sapidus)
in the northcentral Gulf of Mexico. Fishery Bulletin, 109(2), 139-146.
Scarborough, J., & Mouton, E. (2007). Nutria harvest distribution 2006–2007 and a survey of nutria
herbivory damage in coastal Louisiana in 2007. Fur and Refuge Division, Louisiana Department
of Wildlife and Fisheries, New Iberia, USA.
Sutton, G., & Wagner, T. (2007). Stock assessment of blue crab (Callinectes sapidus) in Texas coastal
waters: Texas Parks and Wildlife Department, Coastal Fisheries Division.
Tankersley, R. A., Wieber, M. G., Sigala, M. A., & Kachurak, K. A. (1998). Migratory Behavior of
Ovigerous Blue Crabs Callinectes sapidus: Evidence for Selective Tidal-Stream Transport. The
Biological Bulletin, 195(2), 168-173. doi:10.2307/1542824
Thom, C. S. B., La Peyre, M. K., & Nyman, J. A. (2004). Evaluation of nekton use and habitat
characteristics of restored Louisiana marsh. Ecological Engineering, 23(2), 63-75.
Thomas, J., Zimmerman, R., & Minello, T. (1990). Abundance patterns of juvenile blue crabs
(Callinectes sapidus) in nursery habitats of two Texas bays. Bulletin of Marine Science, 46(1),
115-125.
Townsend, M. H., Zhang, X., Sigrist, M., & Christensen, V. (2010). Using a fisheries ecosystem model
with a water quality model to explore trophic and habitat impacts on a fisheries stock: A case
Page 71
62
study of the blue crab population in the Chesapeake Bay. Ecological Modelling, 221(7), 997-
1004. doi:https://doi.org/10.1016/j.ecolmodel.2009.01.026
Turner, R. E. (1997). Wetland loss in the northern Gulf of Mexico: multiple working hypotheses.
Estuaries, 20(1), 1-13.
Vaughan, D. S., Shertzer, K. W., & Smith, J. W. (2007). Gulf menhaden (Brevoortia patronus) in the U.S.
Gulf of Mexico: Fishery characteristics and biological reference points for management.
Fisheries Research, 83(2), 263-275. doi:https://doi.org/10.1016/j.fishres.2006.10.002
Wang, H., Chen, Q., Hu, K., & LaPeyre, M. K. (2017). A modeling study of the impacts of Mississippi
River diversion and sea-level rise on water quality of a deltaic estuary. Estuaries and Coasts,
40(4), 1028-1054. doi:10.1007/s12237-016-0197-7
Warwick, R. M., & Clarke, K. R. (1991). A comparison of some methods for analysing changes in
benthic community structure. Journal of the Marine Biological Association of the United
Kingdom, 71(1), 225-244.
Wilber, D. H. (1992). Associations between freshwater inflows and oyster productivity in Apalachicola
Bay, Florida. Estuarine, Coastal and Shelf Science, 35(2), 179-190.
doi:https://doi.org/10.1016/S0272-7714(05)80112-X
Wilber, D. H. (1994). The influence of Apalachicola River flows on blue crab, Callinectes sapidus, in
north Florida. Fishery Bulletin, 92(1), 180-188.
Wilkinson, J. M., Marshall, L. G., & Lundberg, J. G. (2006). River behavior on megafans and potential
influences on diversification and distribution of aquatic organisms. Journal of South American
Earth Sciences, 21(1), 151-172. doi:https://doi.org/10.1016/j.jsames.2005.08.002
Wissel, B., & Fry, B. (2005). Tracing Mississippi River influences in estuarine food webs of coastal
Louisiana. Oecologia, 144(4), 659-672. doi:10.1007/s00442-005-0119-z
Zimmerman, R. J., Minello, T. J., Castiglione, M., & Smith, D. (1990). Utilization of marsh and
associated habitats along a salinity gradient in Galveston Bay.
Page 72
63
APPENDIX A. BLUE CRAB LIFE CYCLE DESCRIPTION
The blue crab life cycle involves planktonic, nektonic, and benthic stages that are
dependent on the different salinity gradients and habitats within entire estuaries and coastal
marine waters, thus it is vital to understand the complex life cycle of the species to understand
potential vulnerabilities (Perry & VanderKooy, 2015) (Figure 2). Females migrate to brackish
waters of the upper estuary to mate, timing the event to the female’s pubertal (or final) molt.
Mating involves intricate interactions between males and females, as well as other competing
males, throughout the process (Jivoff & Hines, 1998). Courtship behavior in males is elicited by
release of a pheromone in the urine of receptive pubertal molt females. Males then guard the
females up to seven days post copulation until her shell has hardened (Jivoff, 1997).
Figure A.1. Simplified Blue Crab life cycle.
Source:https://www.chesapeakequarterly.net/V11N2/side2/
Contrary to most estuarine species, mating and spawning occur at different times for the
blue crab, with spawning usually occurring within two months of mating in spring, summer, and
fall. Females migrate from lower salinities in upper estuaries to higher salinities along the coast
Page 73
64
and offshore before spawning. Spawning tends to occur in waters when temperatures and
salinities are favorable for hatching of eggs and growth of larvae (over 19˚C, 21 ppt) and females
having mated in the fall may delay spawning until the following spring brings improved
conditions (Perry & VanderKooy, 2015). Most females spawn more than once and have the
potential to spawn up to 18 times throughout a lifetime (which lasts around 3 years in the Gulf of
Mexico) (Hines et al., 2003). Eggs develop within “sponges” along the underside of the apron,
are small, and occur in large numbers per brood (upwards of 2.8 x 10⁶) (Graham et al., 2012).
However, little is known about the relationship between spawning stock and recruitment ( Perry
& VanderKooy, 2015).
Larvae develop in the offshore waters above the continental shelf, and release of larvae is
dependent on many variables associated with tides, light, and salinities (Tankersley et al., 1998).
Larvae ontogeny includes seven (occasionally eight) zoeal stages and a megalopal stage before
tides and winds transport megalopae larvae back within estuaries where settlement and further
development occurs. Settlement of postlarvae, recruitment of young juveniles, and post
settlement processes including dispersal comprise a critical period in the life history of blue crabs
that can determine the abundance and distribution of young juveniles (Caley et al., 1996). These
processes can be strongly influenced by food access and the availability of structured habitat
including submerged aquatic vegetation, course woody debris, oyster reef, and salt marshes
(Heck et al., 2003). Furthermore, Increased coastal erosion leading to barrier island loss could
reduce landward current strength and tidal pull (not as strong as when concentrated through
inlets) thus decreasing chances that drifting larval crabs would reach essential inshore habitats
(O'Connell et al., 2005).
Page 74
65
APPENDIX B. MISSISSIPPI RIVER FLOW FIGURES
Figure B.1. Regression of commercial blue crab landings within the
Mississippi River Delta plotted against Mississippi River mean annual
discharge for years 1999 – 2016. Grey area represents 95% confidence
intervals.
Figure B.2. Mississippi River water gauge height at Baton Rouge, LA, from
daily means from April, 2018, to April, 2019. Vertical, green lines indicate
sampling dates.
R = - 0.56, p = 0.02
Page 75
66
Figure B.3. Mississippi River delta commercial blue crab landings and Mississippi River mean
yearly discharge from 2000 to 2016.
Discharge Landings
Page 76
67
APPENDIX C. COASTWIDE REFERENCE MONITORING SYSTEM
CONTINUOUS ENVIRONMENTAL DATA GRAPHS
Figure C.4. Continuous daily mean salinity by year from CRMS site 4455 near Terrebonne
Basin sites from May 2014 to June 2019. Red vertical lines indicate sampling dates during
2018, while blue horizontal lines indicate sampling dates for 2019.
Figure C.5. Continuous daily mean salinity by year from CRMS site 0159 near Mississippi
River delta sites from May 2014 to June 2019. Red vertical lines indicate sampling dates
during 2018, while blue horizontal lines indicate sampling dates for 2019.
Page 77
68
Figure C.6. Continuous daily mean water temperature by year from CRMS site 4455 near
Terrebonne Basin sites from May 2014 to June 2019. Red vertical lines indicate sampling
dates during 2018, while blue horizontal lines indicate sampling dates for 2019.
Figure C.7. Continuous daily mean water temperature by year from CRMS site 0159 near
Mississippi River delta sites from May 2014 to June 2019. Red vertical lines indicate sampling
dates during 2018, while blue horizontal lines indicate sampling dates for 2019.
Page 78
69
Figure C.8. Continuous daily mean water temperature by year from CRMS site 4455 near
Terrebonne Basin sites from May 2014 to June 2019. Red vertical lines indicate sampling
dates during 2018, while blue horizontal lines indicate sampling dates for 2019.
Figure C.9. Continuous daily mean water temperature by year from CRMS site 0159 near
Mississippi River delta sites from May 2014 to June 2019. Red vertical lines indicate sampling
dates during 2018, while blue horizontal lines indicate sampling dates for 2019.
Page 79
70
VITA
Caleb Taylor was born in 1992 in McComb, Mississippi. Growing up, he witnessed coastal
erosion, hurricanes, and an oil spill diminish and degrade the Louisiana coast over years of
family fishing trips out of Grand Isle, Port Fourchon, and Leeville, and was driven to a
profession of protecting fragile coastal ecosystems and the people that rely on them. After
graduating from Parklane Academy in 2011, he attended the University of Southern Mississippi,
finding employment as a student worker in the evolutionary ecology lab and teaching
introductory biology as a teaching assistant. In May 2015, after graduating with honors, he
interned with the Center for Research and Development within the Gulf Coast Research Lab in
Ocean Springs, Mississippi. Since then, he has lived in Alaska, Texas, and Louisiana, working in
one aspect or another of coastal fisheries management. Caleb joined the coastal restoration
ecology lab within the department of Renewable Natural Resources at Louisiana State University
in early January, 2018, to learn how estuarine species relate to their changing habitats and
environments. He has since kept busy working to better the graduate student experience at LSU
and within his department through student government, while continuing to focus on research
and academics. Caleb anticipates graduating in May, 2020, and plans to continue working
towards protecting and sustaining coastal and marine ecosystems.