Fuel Cell Research Effects of Fuel and Air Impurities on PEM Fuel Cell Performance 2010 Annual Merit Review Fernando Garzon Los Alamos National Laboratory Project ID #FC045 This presentation does not contain any proprietary, confidential, or otherwise restricted information
Transcript
Fuel Cell Research
Effects of Fuel and Air Impurities on PEM Fuel Cell Performance
2010 Annual Merit Review
Fernando Garzon
Los Alamos National Laboratory
Project ID #FC045
This presentation does not contain any proprietary, confidential, or otherwise restricted information
Fuel Cell Research
Researchers
Tommy RockwardEric Brosha
Jerzy ChlistunoffAdriana Fernandez
Tom SpringerFrancisco Uribe
John DaveyIdoia Urdampilleta (CIDETEC)
Brian Kienitz (LBL)
Thomas Zawodzinski (Univ of Tenn, ORNL)
Thiago Lopes (University of Sao Paolo)
Fuel Cell Research
• Project start date FY-07• Project end date FY-11• Percent complete 80%
• Costs:
• Fuel and air purification systems add cost
• Impurity effects decrease fuel cell lifetime
• Performance: Impurities and contaminants decrease fuel cell performance
• Total project funding– DOE share %100
• Funding received in FY09 -800K
• Funding for FY010- 1M
Timeline
Budget
Barriers
Collaborators:
Overview
Ammonia impurity studies
X-ray Tomography
Modeling
S impurity studies
Fuel cell impurity studies
Fuel Cell Research
Relevance
• Objectives– Understand the effects of fuel cell operation with less than pure fuel and air;
simulate “real world” operation.– Understand how impurities affect DOE fuel cell cost and performance targets– Contribute to the scientific understanding of impurity-fuel cell component
interactions and performance inhibition mechanisms– Develop science based models of impurity interactions upon fuel cell
performance– Experimental validation of models– Develop mitigation strategies and methods
• Impact– Lowing cost of fuel cell operation by improving performance and increasing
lifetime
Fuel Cell Research
Technical Approach• Impurities affect fuel cells in many ways:
– Electrocatalyst poisoning e.g. H2S, CO and SO2 adsorption onto Pt catalysts
– Reduce ionomer conductivity- Na+, Ca++, NH3
– Block proton access to electrochemically active interface
– Mass transport of water in ionmer may be reduced
– GDLs may become hydrophilic and flood at high current densities
•Fabricate and operate fuel cells under controlled impurity gases
–Multi-gas mixing manifolds and FC test stations–Pre-blend impurity gases–Measure performance–Steady state and cycling conditions
• Collection of a sample of anode and cathode exhaust water for fluorine ion concentration testing
• Polarization tests— 0.95V -0.40V
• CV Analysis for electrochemical surface area changes 0.100V – 0.5V,
Degradation of fuel cell performance with respect to baseline
Increased fuel cell losses in the kinetic region
Cathode ECSA not significantly different
The effect of hydrogen sulfide at this concentration would probably be recoverable by air purging or voltage pulsing
Fuel Cell Research
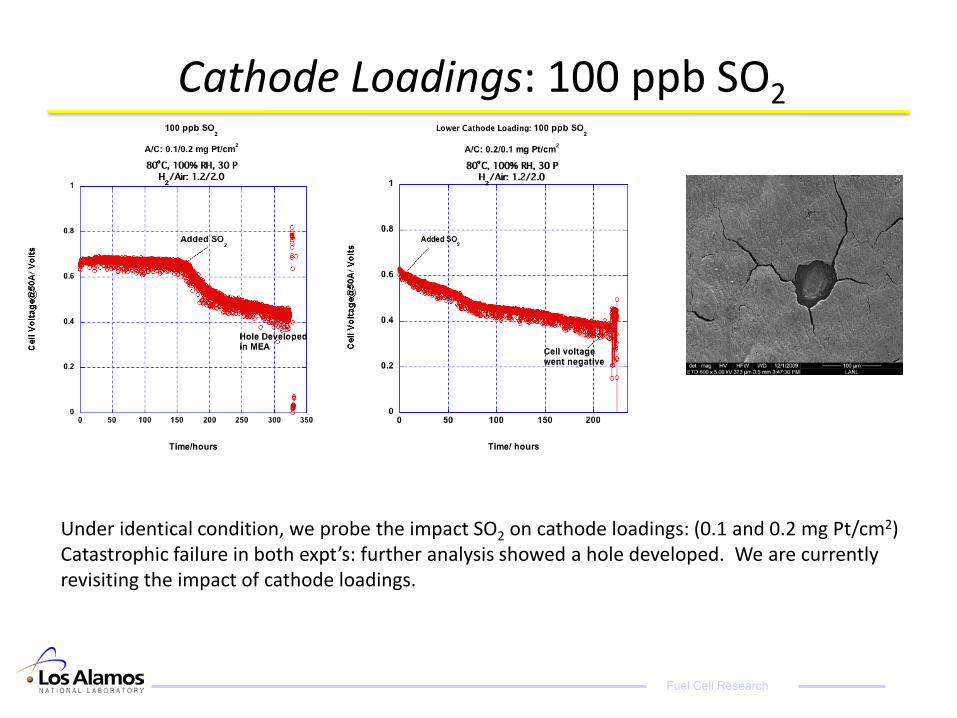
Cathode Loadings: 100 ppb SO2
Under identical condition, we probe the impact SO2 on cathode loadings: (0.1 and 0.2 mg Pt/cm2)Catastrophic failure in both expt’s: further analysis showed a hole developed. We are currently revisiting the impact of cathode loadings.
Fuel Cell Research
Cathode Impurities:100 ppb SO2 Studies: 500h test milestone
Two cells were tested using 100ppb SO2 in the cathode (LANL MEA vs Commercial)Losses were both ~200 mV, Recovery stage showed very little performance increase
Fuel Cell Research
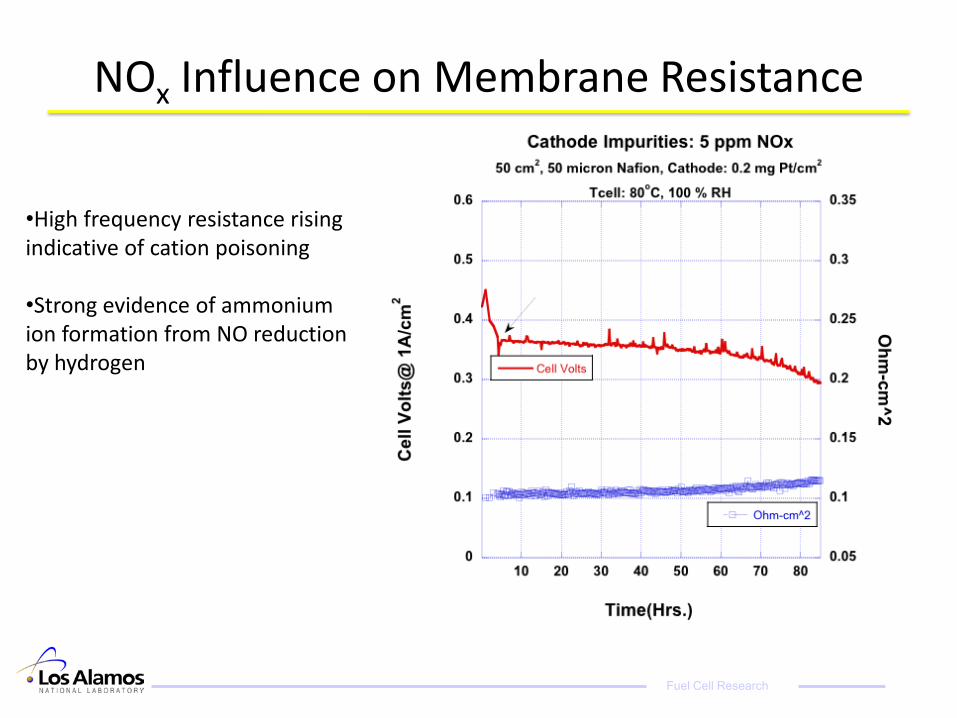
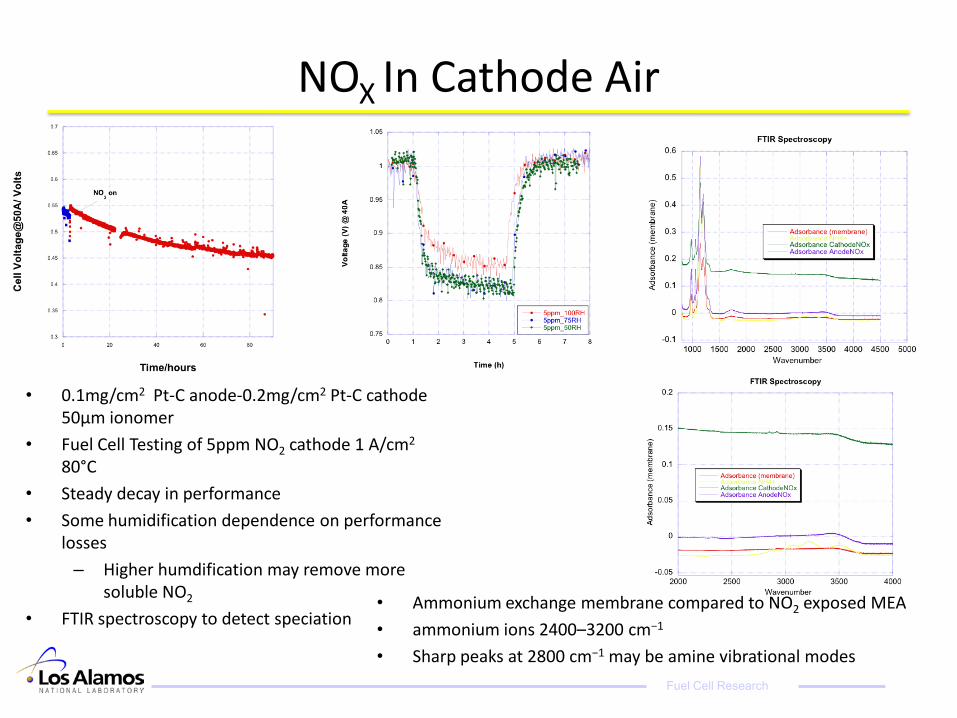
NOx Influence on Membrane Resistance
•High frequency resistance rising indicative of cation poisoning
•Strong evidence of ammonium ion formation from NO reduction by hydrogen
Fuel Cell Research
NOx tests: On and Off Cycling
• 5 ppm NO2 exposure• 0.8 A/cm2 constant current• Full recovery after short-term exposure• Increasing RH did significantly change recovery rate
Fuel Cell Research
Long-term-NOx tests
•5 ppm NO2 exposure•1 A/cm2 constant current•Steady state response is reached•Probably ammonia water flux equilibrium
Fuel Cell Research
Ammonia Air or Fuel Impurities
Air Sources:
• Agriculture environment:
- Potential source of ammonia (NH3)
- Ammonia can also be present in industrial environments
• Potential impact of NH3 on the cathode of a PEMFC
Slide 12
Fuel Sources
Conversion of a fossil fuel into a hydrogen-rich gas:
- Byproduct of autothermal reforming process (if nitrogen is present)
• Reforming process three main byproducts:
- CO, H2S, NH3
• Ammonia, as a fuel impurity, affects the performance of a PEMFC1,2
• There is also evidence3 that the concentration profile of cations across the membrane changes with the current density
Fuel Cell Research
Possible Effects of Ammonia on PEMFCs Oxygen reduction reaction (ORR)
– Reduction of available active Pt sites for ORR– NH3 oxidation
Nafion®
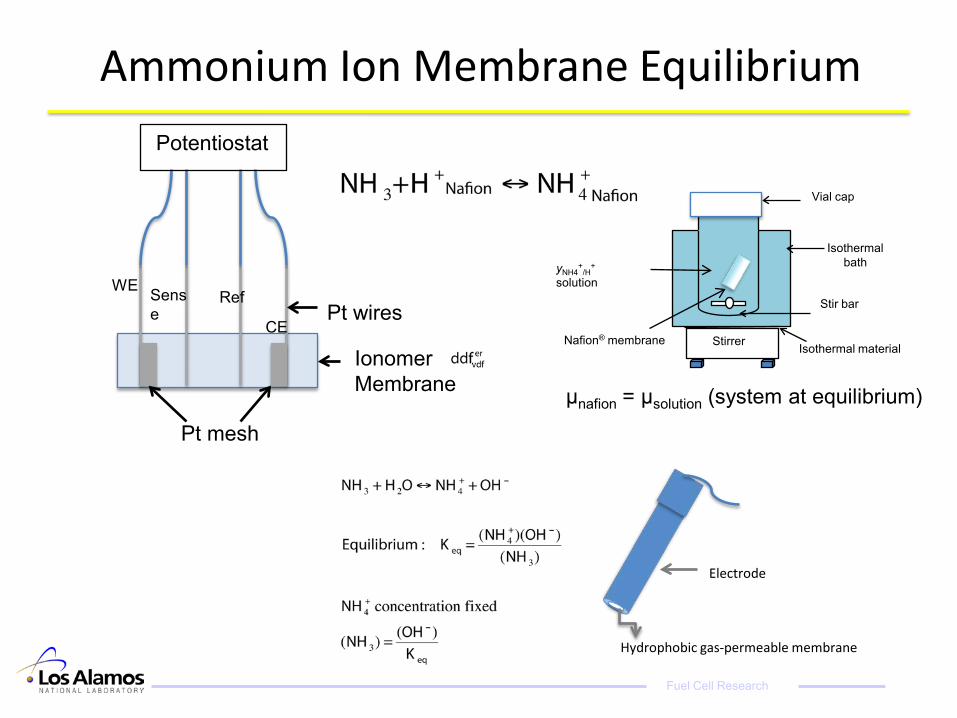
– NH3 in a PEMFC (acid media) forms NH4+
and bonds with sulfonic groups
NH3 + H+ NH4+
R – SO3- + NH4
+ R – SO3NH4
– Reduction of water content in membrane (Membrane conductivity and ORR5)
– λH+ = 20 6
– λNH4+ = 13 6
Slide 13
5. F. Uribe, T. Zawodzinski, S. Gottesfeld, J. Electrochemical Society, 149, A293 (2002); 6. R Halseid, P. J. S. Vie and R. Tunold, J. Electrochemical Society, 151, A381 (2004)
Fuel Cell Research
Ammonia in the Air (cathode)
Slide 14
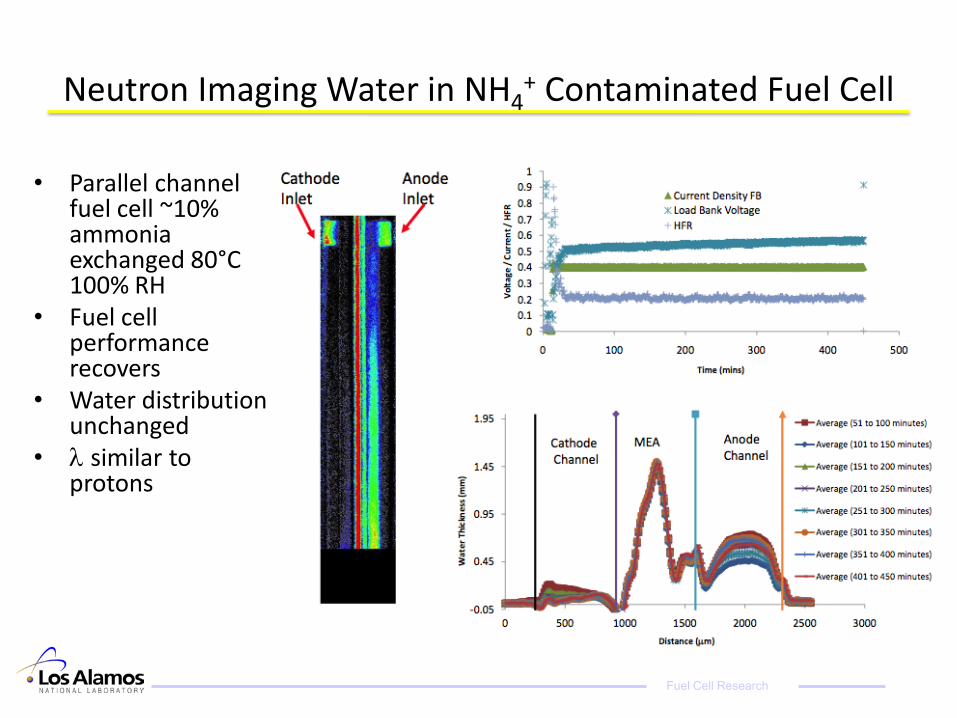
1ppm NH3 on the cathode side, versus the time of contamination. Anode/Cathode/Cell:800C; Anode/Cathode: 0.2/0.2mgPtxcm-2; Nafion® 117; 30/30psi back pressure.
• The increase in High Frequency Resistance (HFR) alone does not explain the loss in fuel cell performance
•Performance degradation increases with concentration
48ppm NH3 on the cathode side 800CAnode/Cathode: 0.2/0.2mgPtxcm-2
Nafion® 117; 30/30psi of back pressure
IR corrected voltages
IR corrected voltages
Fuel Cell Research
ORR in Presence of Ammonium Ions RDE study
Slide 15
• Ammonium decreases both the onset potential and current of the oxygen reduction reaction
•RDE Linear Sweep Voltammetryfor oxygen reaction reduction on a polycrystalline platinum electrode, 1600rpms. 10mV/s-1, in 0.1M HClO4 at 250C, at different [NH4
+] added as (NH4)ClO4
•Ammonium ions mainly affects the ORR in the fuel cell operating potential region (the higher [NH3], the higher iORR losses)
Fuel Cell Research
PEMFC Cathode Exposed to NH3
Slide 16
•PEMFC exposed to 48ppm NH3 on the cathode side•Anode/Cathode/Cell: 800C•Anode/Cathode: 0.2/0.2mgPtxcm-2
• Voltage drop related to HFR increase: 11.5mV• % of losses related to HFR increase: 6.3%
•Recovery time after PEMFC cathode exposed to 48ppm NH3 for 1h, at different current densities•Recover rate is much faster at high current densities•Water Flux rather than ammonium ion oxidation is the primary recovery mechanism
Fuel Cell Research
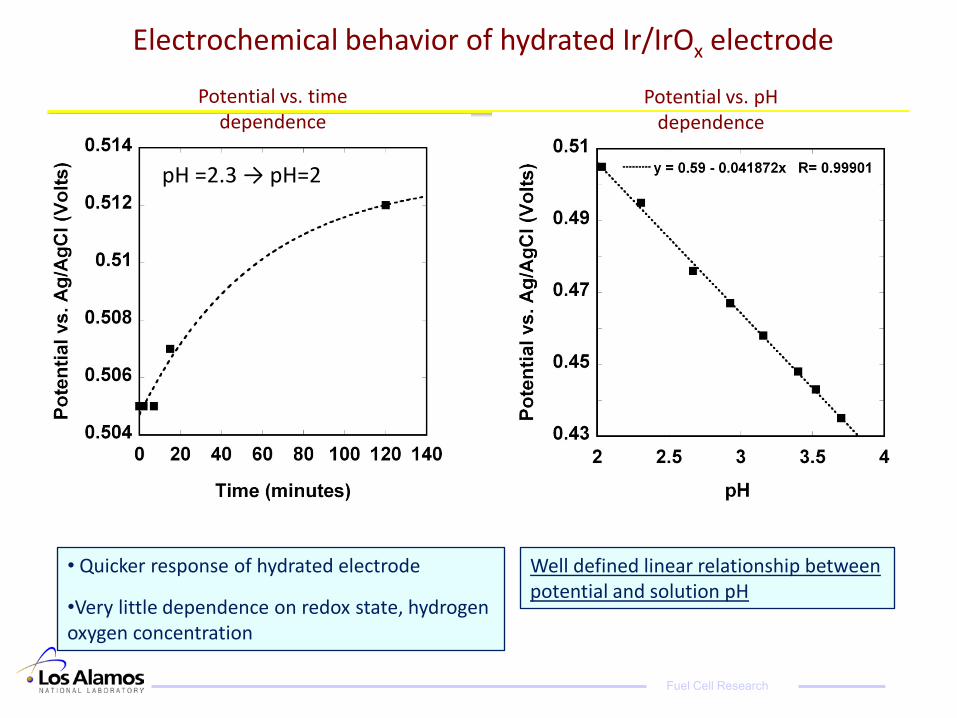
Cation impurity effects on ORR
• Cation impurities affect ionomer conductivity, water (aH2O) and H+ (aH+) activities and affect oxygen reduction kinetics
• Lowered conductivity of Nafion® complicates quantitative estimates of the impurity effects on the ORR kinetics
• Determination of the interfacial activity of H+ would greatly improve understanding of the impurity effects on ORR and fuel cell performance
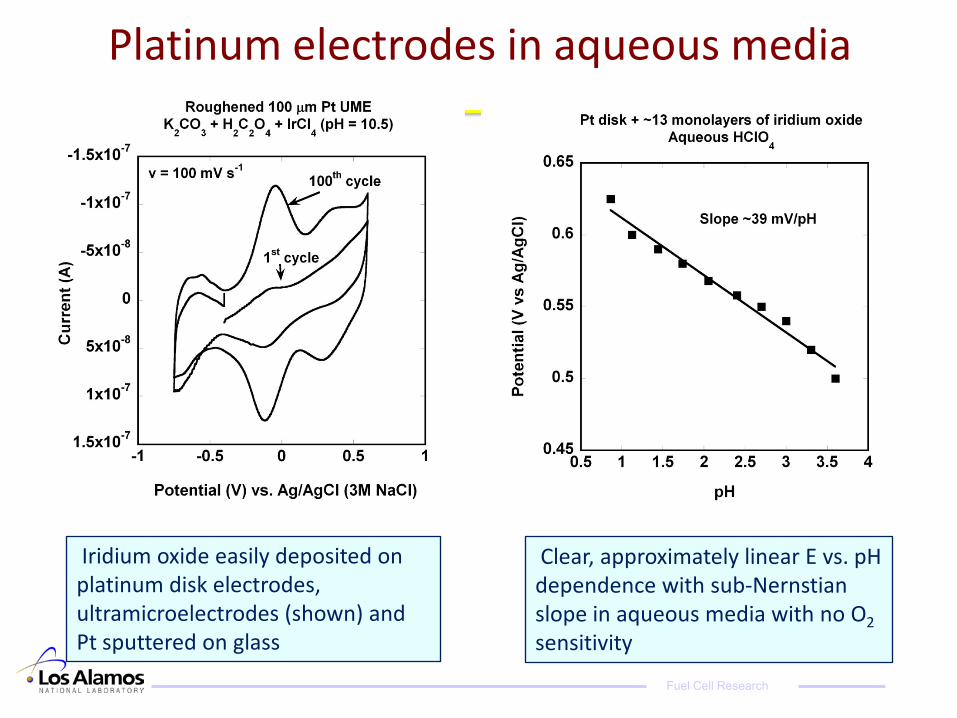
• Iridium oxide-coated Au electrodes have been used as pH sensors in aqueous electrolyte solutions
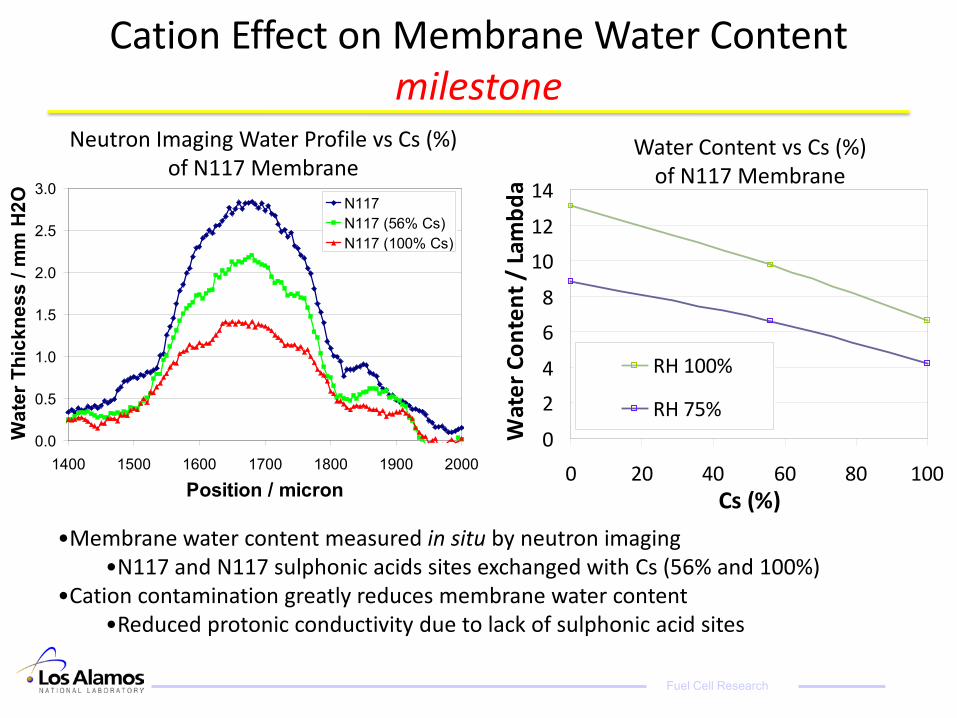
Neutron Imaging Water Profile vs Cs (%) of N117 Membrane
•Membrane water content measured in situ by neutron imaging•N117 and N117 sulphonic acids sites exchanged with Cs (56% and 100%)
•Cation contamination greatly reduces membrane water content •Reduced protonic conductivity due to lack of sulphonic acid sites
Fuel Cell Research
Summary• H2S anode poisoning/durability test completed
– low concentrations do not appear to affect durability
• SO2 long term testing completed – low concentrations do not appear to affect durability
• NOx fuel cell poisoning shown to be largely reversible• NH3 poisoning was shown to behave like cation
contamination – Anode or cathode introduction produces similar fuel cell response– water equilibrium is the predominate removal mechanism
• Some cationic impurities were shown to change water concentration in fuel cells
Fuel Cell Research
Future Work• Measurements of proton activities in
operating fuel cells– Study effects of cation impurities on proton
concentrations in electrodes– Validate modeling
• Continue studies of cation removal mechanisms
• Investigate the effects of gas phase contaminants on ultra low loading fuel cells
Fuel Cell Research
We gratefully acknowledge funding from the US DOE Office of Fuel Cell Technologies
Fuel Cell Research
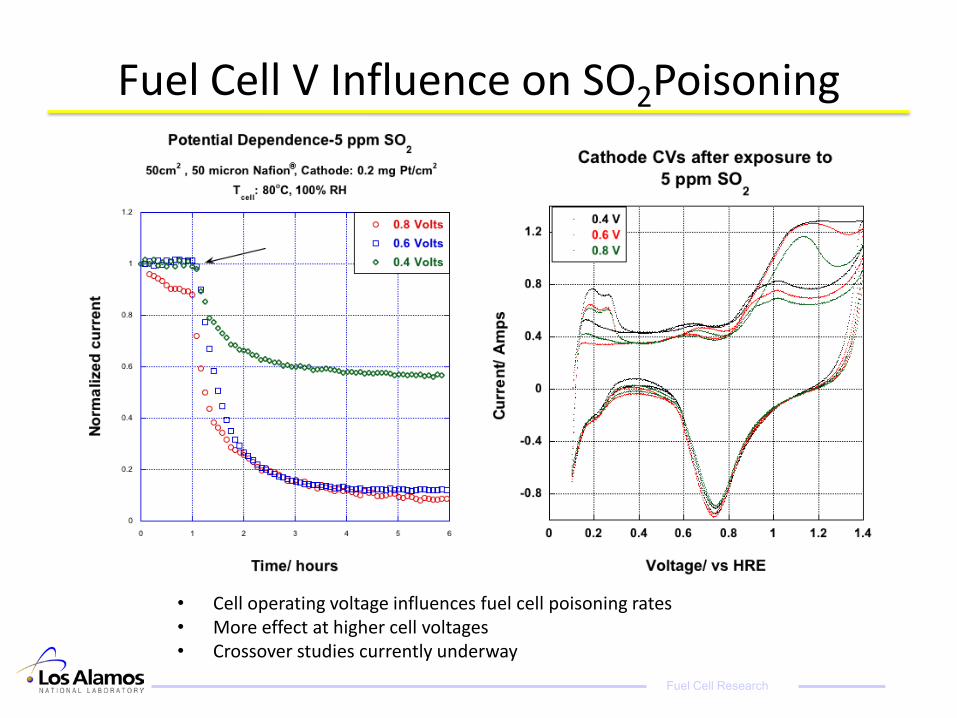
Fuel Cell V Influence on SO2Poisoning
• Cell operating voltage influences fuel cell poisoning rates• More effect at higher cell voltages• Crossover studies currently underway
Fuel Cell Research
Sulfur on Pt Anodes and Cathodes
The effect of sulfur on adsorption of hydrogen on Pt(111):
voltammetricprofiles for hydrogen desorption at the indicated sulfur coverage in 0.1 M H2SO4solution;
(B) hydrogen coverage versus sulfur coverage (in monolayers) S hurts H adsorption
Y. E. Sung, W. Chrzanowski, A. Zolfaghari, G. Jerkiewicz, A. Wieckowski, Journal of the American Chemical Society 119, 194 (1997)
•SO2 adsorption on to RRDE cathode•Sulfur adsorption strongly affects Oxygen reduction kinetics and pathways•Note large generation of peroxide for 0.37 of monolayer coverage