EFFECTS OF GROWTH RATE AND PARENTAL PREDATION RISK ON FLEDGING OF RHINOCEROS AUKLETS (CERORHINCA MONOCERATA) Anne Harfenist B.Sc., University of Western Ontario, 1979 THESIS SUBMITTED IN PARTIAL FULFILLMENT OF THE REQUIREMENTS FOR THE DEGREE OF MASTER OF SCIENCE in the Department of Biological Sciences 0 Anne Harfenist 1991 SIMON FRASER UNIVERSITY August 1991 All rights resewed. This work may not be reproduced in whole or in part, by photocopy or other means, without the permission of the author.
Transcript
EFFECTS OF GROWTH RATE AND PARENTAL PREDATION RISK
ON FLEDGING OF RHINOCEROS AUKLETS
(CERORHINCA MONOCERATA)
Anne Harfenist
B.Sc., University of Western Ontario, 1979
THESIS SUBMITTED IN PARTIAL FULFILLMENT OF
THE REQUIREMENTS FOR THE DEGREE OF
MASTER OF SCIENCE
in the Department
of
Biological Sciences
0 Anne Harfenist 1991
SIMON FRASER UNIVERSITY
August 1991
All rights resewed. This work may not be reproduced in whole or in part, by photocopy
or other means, without the permission of the author.
APPROVAL
. . Name : Anne Harfenist
Degree: Master of science
Title of Thesis: Effects of Growth Rate and Parental Predation Risk on Fledging of Rhinoceros Auklets (Cerorhinca monocerata).
~xamining Committee:
br. R.C. =-g, Associate Professor, Senior Supervisor
Dr. A.S. Harestad, Associate Professor
Dr. K. Vermeer, Research Scient.i.s't, Canadian Wildlife Service
Dr J.N.M. Smith, Professor, University of B&&h Columbia, External Examiner
Date Approved L w h 4 1991 I -
-. I hereby grant t o Simon Fraser U n l v e r s l t y the r i g h t t o lend
my thes i s , p ro j ec t o r extended essay' ( t he ? I f l e o f which 1s shown below) ' 4
t o users o f the Slmon Fraser Un i ve rs i t y Library, and t o make p a r t i a l o r
sl ngle copies on ly f o r such users o r I n response t o a request f r.om the
l i brary o f any o ther un lve rs l t y , o r o the r educatlona l I n s t i t u t Ion, on
i t s own behal f o r f o r one o f I t s users. I f u r t h e r agree
f o r m u l t l p l e copying o f t h i s work f o r scho la r l y purposes
by me o r the Dean o f Graduate Studles. I t I s understood
o r publication o f t h l s work f o r f l nanc la l gaIn s h a l l not
w i thout my w r i t t e n permissfon.
T 1 t l e o f Thes l s/Project/Extended Essay
t h a t permission
may be granted
t h a t . copy I ng
be a l lowed
Author: -
(s ignature)
Abstract
Variation in growth and age and mass at fledging of nestling
rhinoceros auklets (~erorhinca monocerata) was studied on Pine
Island, British Columbia, in 1989 and 1990. Mass at fledging was
positively related to growth rate, whereas age at fledging was
inversely related to growth rate in both years. The results of a
supplementary feeding study in 1989 showed that food-supplemented
chicks grew faster and fledged at a younger age and heavier mass
than did unsupplemented chicks, replicating the patterns observed
in unmanipulated nestlings. A significant seasonal decline in mass
at 10 days of age was found in both years of the study. Mass at
fledging also declined with hatch date, but there was no
significant effect of hatch date on chick growth, suggesting that
the observed patterns can not be attributed to a seasonal decline
in food availability. These results are examined with respect to
the predictions of a model which has been derived using a life
history approach to the fledging decision in alcids.
In 1990, the effects of predation risk on parental
provisioning were examined. Chicks in high and low risk areas of
the colony hatched on approximately the same date, received similar
amounts of food to 46 days of age, grew at the same rate, reached
similar peak masses and fledged at similar masses. However, chicks
in high predation areas fledged at a younger age than did chicks in
low predation areas. These data are consistent with the hypothesis
that parents in high risk areas terminated provisioning several
days before those in lower risk areas. The inverse relationship
iii
between mass at fledging and age at fledging was significant in
both high and low risk areas. The regression line for the high
risk habitats lies below that for the low risk habitats, as
predicted by a model which examines optimal time of fledging from
the perspective of the parents.
Acknowledsements
I would like to take this opportunity to thank my committee
members for their part in producing this thesis. Ron Ydenberg, my
senior supervisor, spentmany hours discussing both the theoretical
framework of this research and the interpretation of the results
with me. Alton Harestad and Kees Verxneer provided guidance during
the planning of the project and patiently worked through previous
drafts of this manuscript.
One person alone could not have chased four hundred
uncooperative rhinoceros auklet chicks around their convoluted
burrows. I was assisted in my field work by Yolanda Morbey in 1990
and Laura Nagel in 1989. I thank Yolanda for her ever-enthusiastic
help and I apologise that the summer was not as cold, wet or stormy
as I had warned her it would be. Laura had to endure rougher
conditions and constant adaptations to the surprises offered by my
first field season, and I thank her also.
Life on Pine Island would not have been the same without the
incredible hospitality and warm friendship offered by the
lightkeepers who allowed us to invade their island home. In
particular, I thank Doug and Gwen Fraser for answering my unending
questions about life on the coast; I salute Doug for trying at
least one bite of anything I cooked and stand in awe of Gwen's
creation of the most decadent desserts in the world. I also
- greatly enjoyed the time I spent with the Nicholsons. I thank
Richard and Carole for all our discussions of politics, religion,
sex and everything else not discussed in polite company. Carlin
v
and Ryland made sure I was never lonely and completed the
preliminary field work on the behavioural ecology of midnight
turkeys upon which I may base my Ph.D. As for Isaac, well, Isaac
was busy growing his hair.
The lightkeepers, along with personnel at the Canadian Coast
Guard in Victoria, also provided invaluable logistical support,
without which my work would have been more difficult and less
successful. They ensured that my supplies and mail (not
necessarily listed in order of importance) arrived at my tentstep
and for this I thank them. The occassional work crews that stayed
on the island provided comraderie, a lot of laughs and beer (also
not necessarily in order of importance).
I must also take this opportunity to acknowledge the influence
of Lorna on my work. She explained to me my real motives for
studying seabirds on isolated islands; may all her romances be
harlequins.
My research was supported primarily by a generous grant from
the Erna and Victor Hasselblad Foundation to R.C. Ydenberg.
Additional support was provided by the Anne ~allge Ecological
Scholarship Fund to myself and a DFO/NSERC science Subvention grant
to R.C. Ydenberg. Two years of NSERC Postgraduate Scholarships and
a Graduate Fellowship Award from SFU supported me when I ventured
back into the city.
TABLE OF CONTENTS
.................................................. Approval ii
Abstract .................................................. iii
.......................................... Acknowledgements v
List of Tables ............................................ viii List of Figures ........................................ ix
I . GENERAL INTRODUCTION ................................ 1
2.1 Growth parameters of rhinoceros auklet chicks in supplementary feeding study, Pine Island, 1989 ...... 13
2.2 Growth parameters of rhinoceros auklet chicks from undisturbed burrows on Pine Island in 1989 and 1990 ................................................ 17
3.1 Plot characteristics and predation risk of high and low predation plots, Pine Island, 1990 .............. 36
3.2 Growth parameters of rhinoceros auklet chicks from high and low predation areas of Pine Island,
viii
LIST OF FIGURES
Figure
Relationship between mass and age at fledging in undisturbed burrows in 1989 and 1990 ................ Relationship between age at fledging and growth rate in undisturbed burrows in 1989 and 1990 ............. Relationship between mass at fledging and growth rate in undisturbed burrows in 1989 and 1990 ........ Frequency distributions of growth rate for supplemented, unsupplemented and undisturbed rhinoceros auklet chicks in 1989 .................... Relationship between mass and age at fledging for supplemented and unsupplemented rhinoceros auklet ........... chicks in the supplementary feeding study
Relationship between mass at fledging and hatch date ............. in undisturbed burrows in 1989 and 1990
Relationship between mass at ten days and hatch date ............. in undisturbed burrows in 1989 and 1990
Relationship between growth rate and hatch date in undisturbed burrows in 1989 and 1990 ................ Relationship between fledging mass and fledging age in six feeding manipulation studies on Atlantic ............................................. puffins
Relationship between fledging mass and fledging age in nestling Atlantic puffins from five colonies in ................................... Europe and Canada
Cumulative tally of predation events recorded in high predation plots between June 23 and August 26, ................................... 1990, Pine Island
Relationship between chick age and burrow load in .............. high predation and low predation plots
Relationship between age and mass at fledging in .............. high predation and low predation plots
Page
10
11
12
14
15
18
19
20
22
25
37
38
41
Figure Page
3.4 Relationship between hatch date and mass at fledging in high predation and low predation plots ........... 42
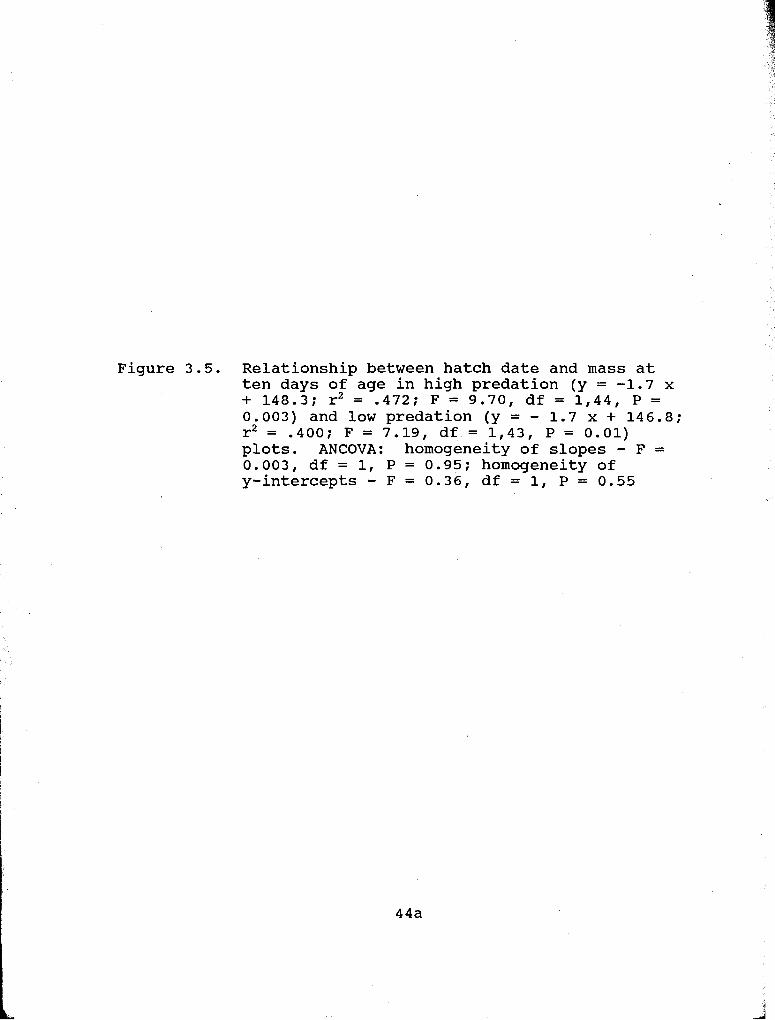
3.5 Relationship between hatch date and mass at ten days of age in high predation and low predation plots .... 44
3.6 Relationship between hatch date and growth rate in high predation and low predation plots .............. 45
CHAPTER I
GENERAL INTRODUCTION
Behavioural ecology involves the study of behavioural
strategies in relation to environmental factors. This approach has
recently been applied to fledging behaviour in the Alcidae, an
avian family of interest because of the extensive inter- and intra-
specific variation in nestling developmental patterns.
Specifically, the mass and age at fledging have been examined with
respect to fitness trade-offs faced by the nestlings and their
parents.
In a series of dynamic programming models, the optimal time of
fledging has been considered from the perspective of both the
nestling and the parent (Ydenberg 1989, Clark and Ydenberg 1990a).
Both models assume that the chick faces a trade-off between a
relatively safe nest habitat with low growth and a more dangerous
ocean habitat with potentially higher growth. From the chick's
perspective, optimal time of fledging is calculated as the best
time to make the transition between the two habitats, assuming that
natural selection will favour the fledging decision that maximizes
survival to breeding (Ydenberg 1989). The optimum is expected to
be sensitive to variation in growth rate.
The optimum time of fledging must also be considered from the
parental perspective, because it seems likely that parents control
fledging to some degree through food deliveries (Bertram 1988).
Assuming a cost of reproduction (reviewed by Reznick 1985, Nur
1
1987), parents face a trade-off between current and future
reproduction and natural selection should favour behaviour that
maximizes lifetime reproductive success (Williams 1966). In long-
lived species that experience high survival costs as a result of
breeding activities, selection should favour behaviours that reduce
the cost of a single breeding effort (Williams 1966, Stearns 1980) . For many species of alcids, provisioning the nestlings at the
colony exposes the adults to a risk of predation (eg. Harris 1980,
Kaiser 1989, Nelson 1989). However, as a review of predation risk
as a cost of reproduction points out (Magnhagen 1991), few studies
have shown that individuals adopt different strategies according to
predation risk. The second fledging model incorporates predation
risk and makes predictions about changes in parental behaviour in
the face of such risk (Clark and Ydenberg 1990a).
The optimum fledging time predicted from the perspective of
the parent differs from that predicted from the chick's perspective
(Clark and Ydenberg 1990a). This parent-offspring conflict is
expected because the fitness interests of the nestlings and parents
differ; parents are selected to invest less than the offspring are
selected to demand (Trivers 1974). The degree of difference should
be sensitive to predation risk as the costs to the parents change.
In this thesis, I examine variation in fledging behaviour of
nestling rhinoceros auklets (Cerorhinca monocerata) in light of the
predictions of the two models discussed above. In Chapter 11, I
use intra- and inter-annual comparisons of the natural variation
found at one colony as well as the results of an experimental
manipulation of growth rates to test the predictions of the first
model. In Chapter 111, I examine the effects of predation risk on
parental provisioning strategies and on chick fledging.
CHAPTER I1
VARIATION IN CHICK AGE AND MASS AT FLEDGING
Introduction
Among species in the family Alcidae, there is high intra-
specific variability in juvenile life histories (reviewed in Gaston
1985, Harris and Birkhead 1985, Ydenberg 1989). Developmental
parameters such as nestling growth rate, peak mass, age at fledging
and mass at fledging may vary over a breeding season, within and
between colonies as well as between years. Rhinoceros auklets
(Cerorhinca monocerata) , for example, fledge between 43 and 65 days of age at 50 - 85 % of adult body mass (Vermeer and Cullen 1979,
this study). The observed variation in juvenile development is
often characterized as a proximate response to factors such as
variations in food availability and quality, nest site quality or
ambient temperature (eg. Nettleship 1972, Vermeer and Cullen 1979,
Gaston 1985) . Few researchers, however, have discussed how
selective pressures might influence the evolution of behaviour in
response to this environmental variation.
Life history theory provides an evolutionary view of the
patterns in the time of fledging found in alcids. Ydenberg (1989)
considered the question of when to fledge as the best time for the
- chick to make the transition between two habitats with contrasting
- fitness characteristics: the nest and the ocean. Assuming that
the burrow represents a safe environment in which growth is slow,
whereas the ocean offers a potentially higher growth rate at a
higher risk of mortality, the optimal time of fledging can be
calculated using dynamic programming (Ydenberg 1989).
The predicted optimal time of fledging is sensitive to the
chick growth rate in the nest. When growth in the nest varies, the
model predicts a negative relationship between mass and age at
fledging, with faster growing chicks fledging heavier and at a
younger age than slower growing chicks (see Ydenberg 1989, Fig. 5).
The model also predicts a seasonal decline in mass at fledging;
variation in growth rate is expected to contribute to this decline.
Rhinoceros auklets exhibit one of the widest ranges of growth
rate, age at fledging and mass at fledging of alcids; these
parameters vary both within and between years (Leschner 1976,
Vermeer and Cullen 1979, Wilson 1977, Bertram 1988). My study was
designed to examine the variation in the time of fledging in
rhinoceros auklets at one colony, using three comparisons: 1)
natural intra-annual growth rate variation in 1989 and 1990, 2)
experimentally induced variation in growth rate in 1989 and 3)
natural inter-annual variation between 1989 and 1990. The
predictions tested were that faster growing nestlings would fledge
earlier and at a higher mass than more slowly growing young, thus
producing an overall negative relationship between the age and mass
at fledging. The model also predicts a seasonal decline in
- fledging mass and the data were examined for this effect.
Materials and Methods
In mid-June, 1989, approximately 120 rhinoceros auklet burrows
on Pine Island, B.C. (50•‹ 58' N;127O 41' W) were excavated for use
in a supplementary feeding study. Excavation involved digging
holes through the roof of burrow tunnels until the entire burrow
was accessible; between visits, access holes were covered with
cedar shingles, soil and moss. All chicks found were weighed to
the nearest 2.5 g on a 500 g Pesola scale and wing lengths were
measured to the nearest millimetre, from the wrist to the tip of
the flattened wing, using Vernier calipers. Once the primaries
began to emerge, wing lengths were measured from the wrist to the
feather tip using a flexible plastic ruler. Burrows containing
incubating adults were immediately covered because adults are
extremely sensitive to disturbance in the burrows during this phase
(Leschner 1976, Wilson 1977). These burrows were rechecked after
ten days.
Nine newly-hatched chicks (i.e., with wet downy plumage) were
found and were measured every day for two weeks. The regression of
age on wing length described by the data from these known-age
nestlings was used to assign ages to all other chicks in this
study. Wing length is considered a reliable estimator of chick age
because it is relatively independent of the nutritional status of
the chick (Vermeer and Cullen 1979). However, the variation in
wing length for a given age increases after the first two weeks
(Leschner 1976, Wilson 1977), and so only burrows that contained
chicks under two weeks of age upon initial excavation were used in
the supplementary feeding study. The known-age chicks were not
included in any further studies.
When the chicks in the study burrows reached 13 days of age
and were capable of swallowing experimentally proferred fish, they
were assigned alternately to one of two experimental groups:
Supplemented - Chicks between 13 days of age and fledging were fed 30 g of freshly thawed surf smelt (Hvpomesus
pretiosus) every second day as a supplement to
the food delivered to them by their parents.
Thirty grams was chosen because it approximates
the mean mass of fish brought per trip by
provisioning adults to their chicks on Pine
Island in July 1985 and 1986 (Bertram and Kaiser
1988). Chicks were weighed and measured before
being fed (N = 55) . Unsupplemented - Chicks were handled as above but not given any
supplementary fish (N = 55) . Growth rates were calculated for each chick as the slope of
the regression line relating chick age and mass between the
beginning of the experiment (13 days) and 37 days of age. This
interval corresponds closely to the linear portion of the chick
growth curve, which extends from about 10 to 38 days. Fledge dates
were taken as the first day a chick was not found in its burrow.
Mass at fledging is the mass on the last day the chick was weighed.
In 1989, an additional 65 burrows in undisturbed areas of the
colony were used for inter-annual comparisons of chick growth and
fledging. The burrows were excavated as outlined above, but the
nestlings were not disturbed between 10 and 42 days of age. After
42 days, the chicks were weighed and measured every second day
until fledging. In 1990, a similar protocol was followed to
monitor a group of 70 undisturbed burrows. In both years, daily
growth rates for these undisturbed birds were calculated for each
chick as: (mass at 42 days of age - mass at 10 days of age)/32. Age and mass at fledging were determined as in the supplementary
feeding experiment.
Comparisons of hatch date, mass at various ages, growth, peak
mass, mass at fledging, age at fledging and date at fledging were
made using a one-way ANOVA procedure. ANCOVA tests were used to
compare the regression statistics describing chick growth
parameters. All statistical analyses were performed using the
SYSTAT software package (Wilkinson 1989).
In both studies outlined above, some study burrows became
inaccessible during the breeding season: burrows became connected
to neighbouring tunnels or the habitat was judged too fragile to
support repeated disturbances. All data from these burrows were
excluded from analyses. Similarly excluded were data from four
chicks that had not fledged by the time I left the island and two
chicks that left their burrows before being fully feathered. All
six of these chicks had very low growth rates. Thus, the final
sample sizes (42 supplemented and 45 unsupplemented chicks in the
supplementary feeding study; 56 and 53 undisturbed burrows in 1989
- and 1990, respectively) were smaller than the initial numbers.
~esults
The inverse relationship between mass at fledging and age at
fledging for undisturbed chicks was significant in both 1989 and
1990 (Fig. 2.1) ; the slope of the regression was steeper in the
latter year. Confirming that the early fledgers were indeed the
fastest growers, a significant negative relationship between age at
fledging and growth rate was also found in both years (Fig. 2.2).
AS expected, mass at fledging and growth rate were significantly
positively related in 1989 and 1990 (Fig. 2.3).
The experimental supplementary feeding of rhinoceros auklet
chicks significantly increased the growth rate of supplemented
chicks above that of unsupplemented chicks (Table 2.1), but within
the range found for undisturbed chicks (Fig. 2.4) . The mean
growth rate for the undisturbed chicks was higher than that for the
supplemented birds (F = 16.78, df = 1,99, P = c 0.001), indicating
that the extensive handling of chicks involved in the experimental
procedure had a negative influence on chick growth. Fledging mass
was significantly greater in the supplemented birds than in the
unsupplemented birds. In contrast, age and date at fledging were
significantly lower in the supplemented nestlings. No differences
were found between treatments in hatch date and mass at 13 days;
these two parameters were measured before the manipulations began.
A significant inverse relationship between mass and age at
. fledging occurred in both the supplemented and unsupplemented
groups (Fig. 2.5). The slopes of the two regression lines are the
same, but the former line is higher over the range measured.
Figure 2.1. elations ship between mass and age at fledging in undisturbed burrows in 1989 (y = -5.1 x + 663.4; r2 = .699; F = 125.23, df = 1,54, P < 0.001) and 1990 (y = -7.0 x + 729.4; r2 = .600; F = 76.42, df = 1,51, P < 0.001). ANCOVA: homogeneity of slopes - F = 4.44, df = 1, P = 0.037
age at fledging (days)
50 60
age at fledging (days)
Figure 2.2. Relationship between age at fledging and growth rate in undisturbed burrows in 1989 (y = -3.0 x + 77.9: r2 = .462; F = 46.43, df = 1,54, P < 0.001) and 1990 (y = -2.1 x + 68.6; r2 = .367; F = 29.62, df = 1,51, P < 0.001). ANCOVA: homogeneity of slopes - F = 2.08, df = 1, P = 0.152; homogeneity of y-intercepts - F = 74.16, df = 1, P < 0.001
lla
growth (g/day)
3 4 5 6 7 8 9 1 0
growth (g/day)
llb
Figure 2.3. Relationship between mass at fledging and growth rate in undisturbed burrows in 1989 ( y = 21.8 x + 212.5; r2 = .651; F = 100.70, df = 1 , 5 4 , P c 0.001) and 1990 ( y = 22.8 x + 198.1; r2 = .508; F = 52.72, df = 1.,51, P < 0.001). ANCOVA: homogeneity of slopes - F = 0.07, df = 1, P = 0.792; homogeneity of y- intercepts - F = 137.27, df = 1, P < 0.001
growth (g/day)
3 4 5 6 7 8 Q 1 0 1 1
growth (g/dny)
Table 2.1. Growth parameters of rhinoceros auklet chicks in supplementary feeding study, Pine Island, 1989.
SUPPLEMENTED (N = 42)
- -
Mean S.D.
Hatch datea 17.0 5.14
Mass at 13 days (g) 170.5 16.96
Growth (g/day) 7.4 .75
Peak mass (g) 415.8 19.65
Mass at fledging (g) 411.1 22.67
Age at fledging (d) 50.0 3.91
Fledge datea 66.9 6.36
UNSUPPLEMENTED (N = 45)
--
Mean S.D.
a day 1 = June 1 P < 0.001
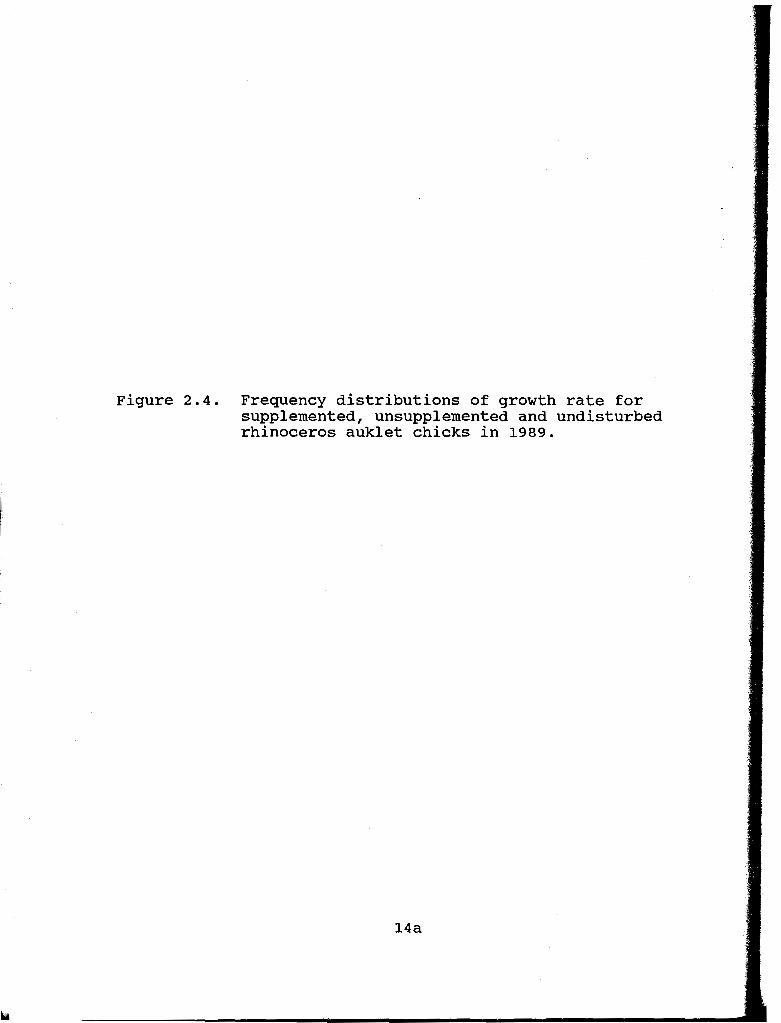
Figure 2.4. Frequency distributions of growth rate for supplemented, unsupplemented and undisturbed rhinoceros auklet chicks in 1989.
10 -
5 - - -
0 I I 40 4.3 5 0 55 OX) 65 7D 73
Undisturbed - 1989
0 L 40 45 5 0 55 OX) 65 7D 7 3 8D 8.5 8.0 05
gw& (p/dayl
14b
Figure 2.5. Relationship between mass and age at fledging for supplemented (y = -2.0 x + 511.6; r2 = .120; F = 5.48, df = 1,40, P = 0.024) and unsupplemented (y = -2.9 x + 534.9; r2 = .229; F = 12.76, df = 1,43, P = 0.001) rhinoceros auklet chicks in the supplementary feeding study. ANCOVA: homogeneity of slopes - F = 0.58, df = 1, P = 0.449; homogeneity of y-intercepts - F = 18.82, df = 1, P < 0.001
age at fledging (days)
Unsupplanented
50 60
age at fledging (days)
Growth parameters of undisturbed chicks in 1989 and 1990 are
given in Table 2.2. Mass at 10 and 42 days, growth, and mass at
fledging were significantly higher in 1989 than in 1990. Hatch and
fledge dates and age at fledging, however, were the same in both
years.
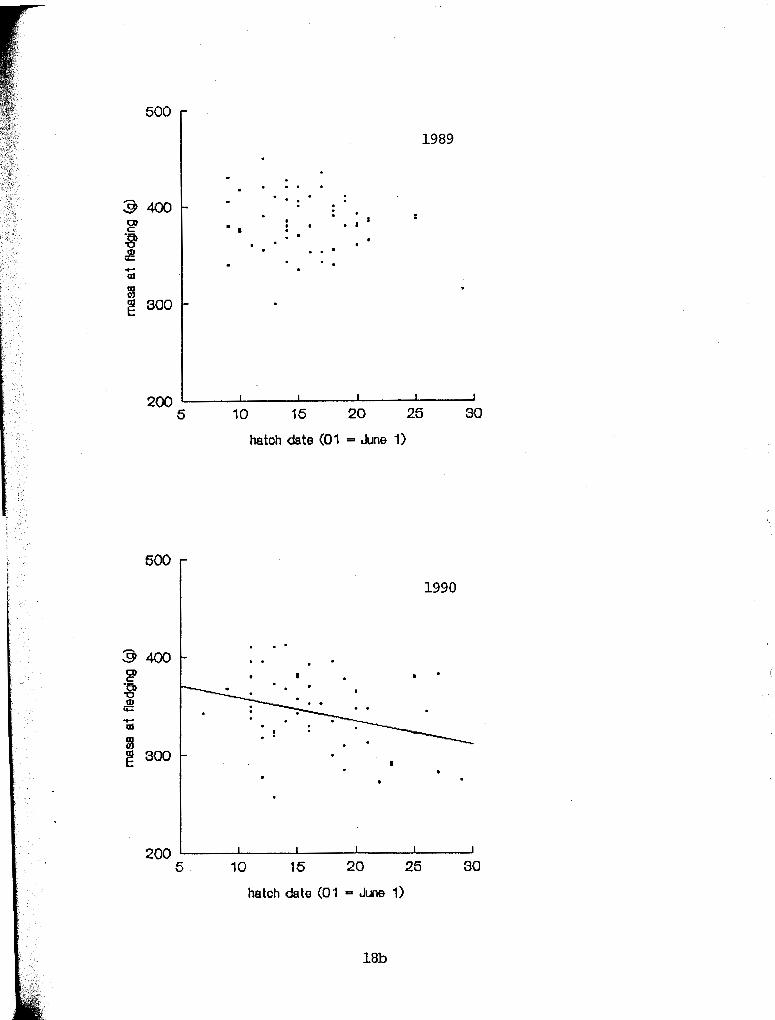
Mass at fledging declined with hatch date in both years of the
study; however, the decline was significant only in 1990 (Fig.
2.6). The slopes of the relationships were similar between years,
but the intercept was significantly higher in 1989. A significant
seasonal decline in mass at 10 days was found for the undisturbed
chicks in both years (Fig. 2.7) . As above, the slopes of the
regressions were the same between years, but the intercept was
significantly higher in 1989. Thus, after standardizing for hatch
date, chicks in 1989 were heavier both at ten days of age and at
fledging than were chicks in 1990. Hatch date was not
significantly related to growth rate in either year (Fig. 2.8).
Discussion
The model of alcid fledging behaviour from the chick's
perspective produced three main predictions (Ydenberg 1989).
~irstly, mass at fledging and age at fledging should be inversely
related. Secondly, mass and age at fledging should vary with
. growth rate: faster growing chicks should fledge earlier and at a
. heavier mass than slower growing chicks. Thirdly, fledging mass
should decline over the season.
The natural intra-annual variation in growth rates in both
Table 2 .2 . Growth parameters of rhinoceros auklet chicks from undisturbed burrows on Pine Island in 1989 and 1990 .
1989 (N = 56) 1 9 9 0 (N = 53) ---------------- --------------- Mean S. D. Mean S . D . F
Hatch datea 1 5 . 7 4 .27 16 .4 5 .19 0 .54
Mass at 1 0 days (g) 128 .8 12 .94 1 1 7 . 8 1 8 . 8 1 1 2 . 6gb
Mass at 42 days (g) 380 .3 33 .09 321 .7 4 3 . 1 1 63. 71b
Growth (g/day) 7 .9 1 .12 6.4 1 . 2 1 44 .41b
Mass at fledging (g) 383.9 30 .35 343 .5 38.68 37. O o b
Age at fledging (d) 54 .4 4.94 55 .0 4 .27 0 .44
Fledge datea 7 0 . 1 6.62 71 .4 7 . 0 1 0.92
a day 1 = June 1 P ( 0 . 0 0 1
Figure 2.6. Relationship between mass at fledging and hatch date in undisturbed burrows in 1989 (y = -1.5 x + 410.1; r2 = .057; F = 3.27, df = 1/54, P = 0.076) and 1990 (y = -2.4 x + 382.1; r2 = .101; F = 5.76, df = 1,51, P = 0.02). ANCOVA: homogeneity of slopes - F = 0.81, df = 1, P = .369; homogeneity of y-intercepts - F = 7.24, df = 1, P = 0.008
10 15 20 25 30
hatch date (01 - June 1)
10 15 20 25 30
hatch date (01 - June 1)
Figure 2.7. Relationship between mass at ten days of age and hatch date in undisturbed burrows in 1989 (y = - 1.1 x + 145.9; r2 = .129; F = 7.98, df = 1,54, P = 0.007) and 1990 (y = -1.1 x + 136.5; r2 = .099; F = 5.59, df = 1,51, P = 0.022). ANCOVA: homogeneity of slopes - F = 0.006, df = 1, P = 0.94; homogeneity of y-intercepts - F = 12.20, df = 1, P = 0.001
10 15 20 25
hatch date (01 .- June 1)
10 15 20 25 30
hatch date (01 = June 1)
Figure 2.8. Relationship between growth rate and hatch date in undisturbed burrows in 1989 (F = 0.13, df = 1,54, P = 0.72) and 1990 (F = 0.26, df = 1,51, P = 0.61).
10 15 20 25 30
hatch date (01 = June 1)
10 15 20 25 30
hatch date (01 - June 1)
1989 and 1990 produced the predicted patterns. Fledging mass was
positively related to growth rate and fledging age was negatively
related to growth rate. These patterns produce the inverse
relationship between mass and age at fledging predicted by the
model and found in both years of the study. Thus, in the intra-
annual comparisons, rhinoceros auklet chicks that grew faster
fledged at a heavier mass and younger age than those that grew more
slowly.
The supplementary feeding study was designed to test
experimentally the effects of growth on the chick fledging
decision. The supplemented chicks grew faster and, as predicted by
the model, had a higher mean fledge mass and a lower mean fledge
age than did the unsupplemented controls.
Data from the literature on alcids suggests that the trends
described above are not confined to rhinoceros auklets. Harris
(1984, p. 212) has summarized studies of nestling Atlantic puffins
(Fratercula arctics), a close relative of the rhinoceros auklet,
that involved growth rate manipulations. These studies include
supplementary feeding studies, twinning studies and a single-parent
study. A plot of the fledging mass and age from data provided in
~arris' (1984) summary (Fig. 2.9) shows that, as predicted by the
model, those chicks that received supplementary food and grew
faster fledged at a higher mass than did those that received less
food and grew more slowly. Chicks on a restricted food diet
fledged at an older age than did those on a normal diet, as
expected, but no difference in fledging age was found between
21
Figure 2.9. Relationship between fledging mass and fledging age in six feeding manipulation studies on nestling Atlantic puffins (data from Harris 1984, p. 212). ISupplementaryl includes chicks fed either supplementary or unlimited food; 'normal1 includes chicks maintained on a normal diet; lrestrictedl includes twinned chicks, chicks fed by a single adult and chicks fed 80 g food/day. Bars indicate means + S.E. of the study means of each diet level reported by Harris (1984).
normally-fed chicks and those receiving extra food. It should be
noted that the methodology used in these studies was not
standardized and that the 'supplementary1 and 'restrictedt
classifications include a range of treatments. For example,
*restricted1 includes twinned chicks, chicks fed by only one adult
and chicks fed 80 g/day of food.
The inter-annual comparison of chick growth parameters of
rhinoceros auklets on Pine Island did not exhibit the same patterns
as did the intra-annual and experimental comparisons. Although
mass at ten days, growth and mass at fledging were all
significantly higher in 1989 than in 1990, age at fledging was the
same in the two years. The inter-annual comparison is the weakest
of my three tests because other environmental variables such as
predation rate and the post-fledging growth rate are not controlled
between years. As I discuss in greater detail in Chapter 111,
higher predation levels should select for earlier fledging. If
predation by bald eagles (Haliaeetus leucoce~halus) was lower in
1989, the opposing selective pressures of faster growth rate and
lower predation may have counteracted each other, resulting in no
observed difference in fledging age. Although I did not measure
predation in 1989, fisheries data suggest that in 1989 salmon
availability was greater than in 1990 (D. Shutte, DFO, pers. comm. )
Bald eagles, with excellent fishing prospects, may have spent less
. time foraging on rhinoceros auklets in 1989 than they did in 1990.
In contrast to the results of my inter-annual comparisons, in
an inter-annual study of rhinoceros auklets on Triangle Island,
B. C. , Vermeer and Cullen (1979) found the patterns predicted by the
model. Chicks grew faster in 1978 than they did in 1976; they also
fledged at a higher mass and after a shorter nestling period in
1978 than they did in 1976. ~atanuki (1987) reported similar
variation in mass and age at fledging in an inter-annual study of
rhinoceros auklets in Japan: in the year of higher chick growth,
chicks fledged earlier and at a higher mass.
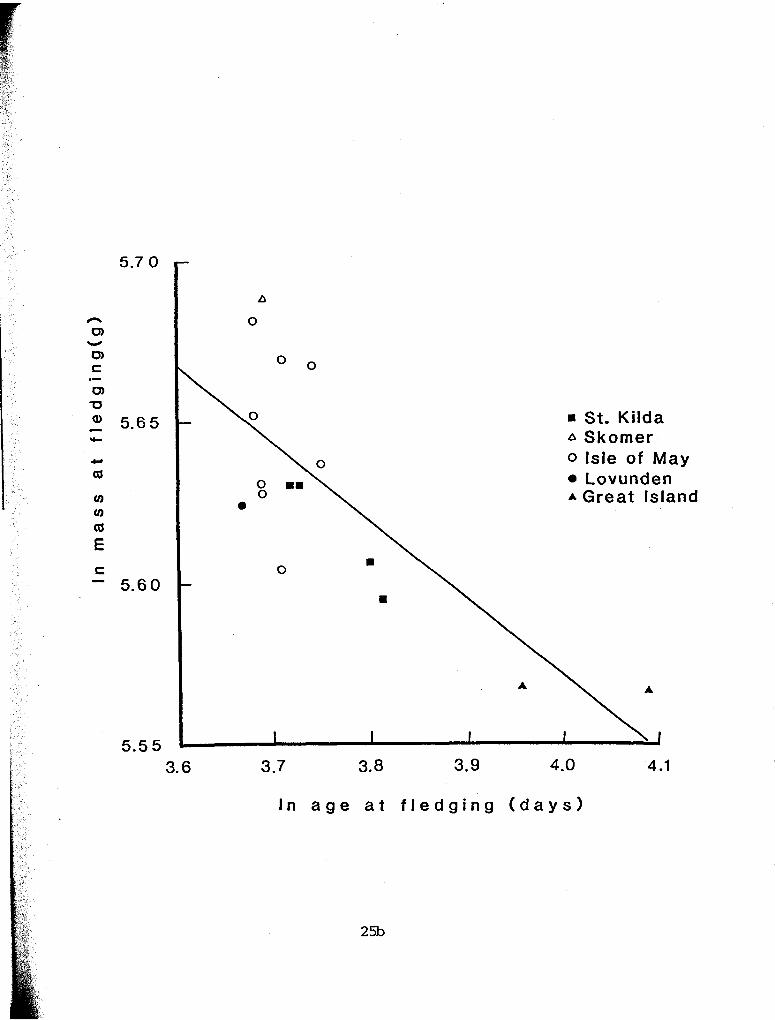
Further evidence of the generality of this negative
relationship between mass and age at fledging may be found in
nestling growth data from five colonies of Atlantic puffins
(summarized in Harris 1984, p. 211) (Fig. 2.10) . The regression of mass at fledging on age at fledging is significant. Unfortunately,
the growth rates for these colonies are not given.
The third prediction of the model is that the optimal mass at
fledging should decrease as the season progresses (Ydenberg 1989).
A seasonal decline in fledging mass was found for undisturbed
chicks in both 1989 and 1990; the relationship was significant in
1990 and a strong trend in 1989. Seasonal declines have also been
reported for many species of alcid including the Atlantic puffin
(Nettleship 1972, Harris 1982), the common rnurre (Uria aalqe)
(Hedgren 1979) and the thick-billed murre (Uria lomvia) (Gaston and
Nettleship 1981, Birkhead and ~ettleship 1982). According to a
life history approach to fledging behaviour, this decline is
expected because the potential for growth is higher at sea, so
chicks that hatch late in the season should accept the risk of
higher mortality in that habitat earlier in order to maximize their
Figure 2.10. Relationship between fledging mass and fledging age in nestling Atlantic puffins from five colonies in Europe and Canada (data from Harris 1984, p. 211). The regression line for the ln- In transformed data is y = - 0 . 2 ~ + 6.5 (r2 = .567; F = 18.32, df = 1,14, P = 0.001).
size at the beginning of winter (Ydenberg 1989).
relationship should be sensitive to differences
rate, producing a shallower slope in years of good
1989). The slope of the regression from 1989,
The slope of the
in chick growth
growth (Ydenberg
a better growth
year, is less than that from 1990, but the difference is not
significant.
Seasonal declines in fledging mass may also be expected if the
availability and/or quality of food declines over the season (eg.
Hedgren and Linnman 1979, Birkhead and Nettleship 1982). However,
if food resources deteriorate during the season, growth rates
should be inversely related to hatch date; no seasonal trend in
growth rate was found for undisturbed birds in either year of this
study. Wilson (1977) suggested that decreasing food resources were
a cause of slower growth and lower fledging mass in late-hatched
rhinoceros auklet chicks in Washington. Wilson (1977) made his
comparisons, however, using the ten earliest- and ten latest-
hatched chicks in his sample. In 1990, I found a sample of six
very late-hatched chicks (hatched after June 30) which I did not
include in my group of undisturbed chicks for that year. The mean
growth rate for these chicks was 4.6 g/day, which is substantially
lower than the mean of 6.4 g/day determined for the undisturbed
chicks; the mean fledge mass of 281.2 g was correspondingly low.
This suggests that, although food availability does not decline
throughout the season on Pine Island, a deterioration in food
resources at the very end of the season may occur. Wilson's (1977)
findings may have been the result of a similar pattern.
26
A negative seasonal trend in egg mass may also contribute to
the decline in fledging mass (Gaston 1985). Birkhead and Harris
(1985) suggested that such a reduction in egg size may be the
outcome of the trade-off faced by late-laying females between lay
date and egg size. They concluded that the best strategy would be
to minimize the delay in laying and produce a smaller egg.
Although egg mass was not measured in this study, due to the high
probability of causing adult desertion, chick mass at 10 days was
measured; chick mass shortly after hatching has been shown to be
related to egg size in thick-billed murres (Birkhead and Nettleship
1982) and razorbills (Alca torda) (Lloyd 1979). A significant
seasonal decline in mass at 10 days was found in 1989 and 1990.
However, because those chicks that were the lightest at 10 days of
age are not those that fledged at the lightest mass, the seasonal
decline in egg mass is not sufficient to explain the trend in
fledging mass.
Another factor which might contribute to the seasonal decline
in fledging mass, particularly in high arctic species, is a decline
in temperature toward the end of the breeding season that may
affect the energy demands of the chicks (Gaston 1985). As the
temperature on Pine Island increased from June through August (Pine
Island weather station, unpublished data), it is unlikely that
temperature affects fledging state of rhinoceros auklets.
In using data from rhinoceros auklets to test the predictions
of a model based on reproductive parameters of common murres, I
have assumed that the trade-off between low growth rate with low
mortality in the nest and potentially higher growth rate with
higher mortality at sea is a general one. The data needed to
determine the applicability of the assumptions to rhinoceros
auklets are lacking. Because chick mortality was very low in the
colony (in 1989, only three of 178 chicks died in the burrow,
giving a daily mortality rate of 3.1 x the assumption of
lower mortality rates in the burrow than at sea is reasonable (see
Appendix 1). In addition, because chick growth rate approaches
zero at the end of the nestling period, it seems reasonable that
chicks have a higher potential growth rate at sea. Thus, although
the shape of the fledging boundary for rhinoceros auklets will
differ from that computed for the common murre, the qualitative
predictions of the model are still valid.
The model discussed above considers fledging from the chick's
perspective, with the assumption that the chick controls the time
of fledging. Fish are often found in rhinoceros auklet burrows
after the chicks have fledged (pers. obs. ) , indicating that, in some cases, the chicks leave even though at least one parent is
still delivering food. This suggests that chicks leave when they
are ready, and are not abandoned by their parents. Citing similar
evidence, Harris (1976) concluded that nestling Atlantic puffins
desert their parents and not visa versa. However, Bertram (1988)
found that rhinoceros auklet parents seem to provision according to
their own schedule and not according to the needs of the chick in
the latter half of the nestling period. Thus, parents may also
control fledging through food deliveries. Chapter I11 will
consider why and how the optimal time of fledging from the parentst
perspective differs from that from the offspring's perspective.
CHAPTER I11
PREDATION RISK AND PARENTAL PROVISIONING:
EFFECTS ON NESTLING GROWTH AND FLEDGING
Introduction
In Chapter 11, I examined the optimal time to fledge from the
perspective of the nestling; I did not consider the role of the
parents in determining the fledging behaviour of the chick.
According to life history theory, breeding adults face a trade-off
between current and future reproduction; individuals should adjust
their behaviour during reproduction to maximize their expected
Cassin's auklets, Ptvchoram~hus aleuticus, Nelson 1989). Because
most seabirds are long-lived and experience low mortality between
breeding seasons (Evans and Nettleship 1985, Hudson 1985),
selection should favour those individuals with behaviours that
reduce mortality during the breeding season (Williams 1966). Adult
seabirds have been known to change their behaviour in response to
the risk of predation. Harris (1980) found that Atlantic puffins
decrease the time spent at the colony and the mass at fledging of
their young in response to predation by great black-backed gulls
(Larus marinus). Similarly, Leach's storm petrels in Japan reduce
their activity and increase the synchrony of their arrivals at the
colony on moonlit nights when the predation rate by slaty-backed
gulls (Larus schistisaaus) is high (Watanuki 1986).
Using data from studies on the Atlantic puffin, Clark and
Ydenberg (1990a) showed that the optimal age at fledging from the
parent's perspective is lower than that from the chick's
perspective and the difference increases when the parent incurs a
higher risk when feeding the chick. Chicks are assumed to fledge
as soon as feeding ceases in this analysis, and the model,
therefore, also predicts that chicks in habitats of high adult
mortality will fledge at a younger age than will those in safer
habitats.
Rhinoceros auklets (Cerorhinca monocerata), a close relative
of Atlantic puffins, are burrow-nesting alcids whose nocturnal
provisioning habits are assumed to be a tactic to avoid predation
(Cody 1973, Vermeer et al. 1979). On breeding colonies along the
coast of British Columbia and Alaska, strong circumstantial
evidence indicates that adults may be subject to predation by bald
eagles (Haliaeetus leucoce~halus) (Degange and Nelson 1982, Kaiser
1989, pers. obs.). If the risk of predation is a significant cost
of reproduction, the provisioning patterns of birds breeding in
high predation areas of a colony and those breeding in low
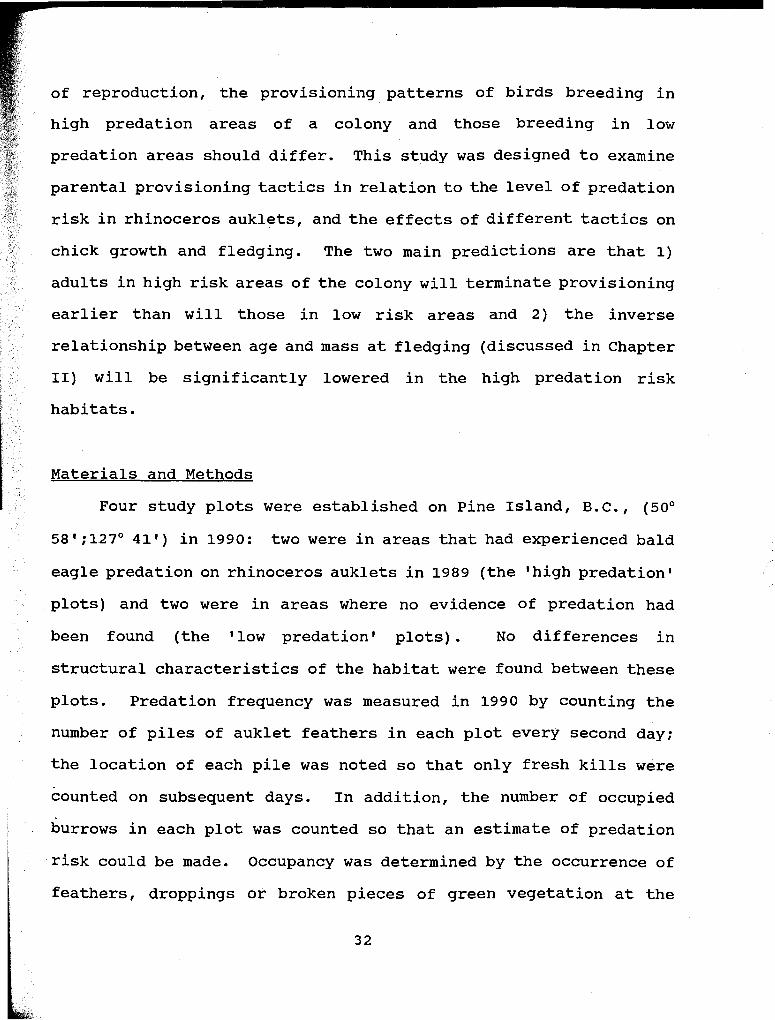
predation areas should differ. This study was designed to examine
parental provisioningtactics in relation to the level of predation
risk in rhinoceros auklets, and the effects of different tactics on
chick growth and fledging. The two main predictions are that 1)
adults in high risk areas of the colony will terminate provisioning
earlier than will those in low risk areas and 2) the inverse
relationship between age and mass at fledging (discussed in Chapter
11) will be significantly lowered in the high predation risk
habitats.
Materials and Methods
Four study plots were established on pine Island, B.C., (50'
58';127O 41') in 1990: two were in areas that had experienced bald
eagle predation on rhinoceros auklets in 1989 (the 'high predation1
plots) and two were in areas where no evidence of predation had
been found (the 'low predation' plots). No differences in
structural characteristics of the habitat were found between these
plots. Predation frequency was measured in 1990 by counting the
number of piles of auklet feathers in each plot every second day;
the location of each pile was noted so that only fresh kills were
counted on subsequent days. In addition, the number of occupied
burrows in each plot was counted so that an estimate of predation
risk could be made. Occupancy was determined by the occurrence of
feathers, droppings or broken pieces of green vegetation at the
burrow entrance.
In mid-June, 25 to 30 active burrows were excavated in each
plot (see Chapter I1 for details of excavation methods). Chicks
were weighed, measured and aged according to the methods outlined
in Chapter 11. All chicks were weighed and measured every four
days between ages 9-10 and 41-42 days. They were then weighed and
measured every second day until fledging. Date and mass at
fledging were determined as described in Chapter 11.
Growth rates were calculated for each chick from the slope of
the regression line relating chick age and mass between 10 and 38
days of age. Hatch date, mass at 10, 38 and 44 days of age, peak
mass, growth, mass at fledging, date of fledging and age at
fledging were compared between high and low predation areas using
a mixed-model nested ANOVA (Sokal and Rohlf 1981, p. 272).
The amount of food delivered to the chicks was estimated using
a hooding procedure (Hatch 1984, Bertram et al. in press). In the
late afternoon, after a chick had been weighed and measured, a hood
of loose weave cotton was placed over the chick's head and tied
into place. The chick was then tethered to a spot near the nest
chamber using a string tied around its leg and to a stake.
Tethering was necessary to prevent hooded chicks wandering from
their burrows (Bertram et al. in press). Early on the following
morning, the hoods and tethers were removed and the burrow was
thoroughly searched for fish left by the parents. Fish were wiped
clean and weighed to the nearest gram on a 300 g Ohaus electronic
balance before being fed to the chick. Thus, these "burrow loadv1
(Hatch 1984) measurements include all the food delivered to a chick
in a night and may be the result of one or both adults feeding.
Hooding began when the chicks were 13-14 days old. Although
I had planned to determine burrow loads for all chicks in excavated
burrows every four days until fledging, in some burrows this proved
impossible. In several burrows, the procedure was not suitable
because the tunnels were located over rock, thus precluding
tethering, or two burrows became joined part way through the
breeding season. On two days of heavy rain I chose not to hood the
downy chicks because of the difficulty in keeping them dry during
handling. In addition, some chicks struggled quite extensively
against either the tether or hood: the nest chamber was disrupted
and there was much loose dirt in the chamber and adjoining tunnel.
This usually happened with chicks that were close to fledging age
and the procedure was not continued for these chicks. Measurements
from those chicks for which burrow load data are not available were
included in growth calculations.
Burrow loads were examined in relation to chick age. The
provisioning patterns of high and low predation areas were compared
using an ANCOVA procedure. ANCOVA tests were also used for
comparisons between predation levels of trends found in chick
growth parameters. All statistical analyses were performed using
the SYSTAT statistical package (Wilkinson 1989).
As described in Chapter 11, a group of 53 undisturbed chicks
was also followed in 1990. The burrows were situated in areas of
RESULTS
No signs of bald eagle predation on rhinoceros auklets were
found in either of the low predation study plots between June 22
and August 29; 25 and 22 feather piles were found in the two high
predation plots during this period (Table 3.1) . Predation was
fairly constant from the beginning of monitoring (7 days after the
mean hatch date) until early August, but ceased almost completely
after the first four days in August (Fig. 3.1). This corresponds
to the pattern of eagle sightings on the island during the day:
more than ten eagles were commonly observed daily in June and July,
whereas only a few eagles were seen after the first week in August.
Predation risk per 1,000 provisioning visits (Table 3.1) was
calculated for each area by dividing the number of predation events
by the estimated total number of adult provisioning trips made into
the area. The latter figure was estimated using the number of
occupied burrows and predation events given in Table 3.1, and
assuming that: 1) each parent visited every second night for the
first 30 days and then twice every three nights until the chick
fledged (based on the regression of burrow load on chick age, given
in Fig. 3.2, and assuming a 30 g load per trip); and 2) depredated
parents were lost after the first 20 days (based on the relatively
constant predation rate during July).
Chick growth parameters are summarized in Table 3.2. There
were no significant differences in any of the measures for the two
plots nested within each predation level, and the data have been
grouped for ease of presentation; however, all statistics were
Table 3.1. Plot characteristics and predation risk of high and low predation plots, Pine Island, 1990.
No. of Occupied Predation Provisioning Predation
Plot Risk Burrows Densitya Events ~ r i ~ s ~ RiskC
1 low 535 0.53 0 34,775 0.00000
2 low 414 0.54 0 26,890 0.00000
3 high 760 0.60 25 43,505 0.00057
4 high 611 0.52 22 35,020 0.00063
a occupied burrows/m2 estimation procedure described in text number of predation events/number of parental provisioning trips
Figure 3.1. Cumulative tally of predation events recorded in high predation plots between June 23 and August 26, 1990, Pine Island. Mean hatching date = 16.5; mean fledging date = 67.4.
P R E D A T I O N E V E N T S - 1 9 9 0
-
d a . t e ( 0 I:= J u n e 1)
Figure 3.2. Relationship between chick age and burrow load in high predation (y = 1.1 x + 3.1; r2 = .472; F = 356.87, df = 1,399, P < 0.001) and low predation (y = 1.0 x + 3.4; r2 = .400; F = 256.33, df = 1,384, P < 0.001) plots. ANCOVA: homogeneity of slopes - F = 0.197, df = 1, P = 0.66; homogeneity of y-intercepts - F = 1.02, df = 1, P = 0.31
20 30 40
ctick age (days)
High
Predation
b w
Predation
ctidc age (days)
Table 3 .2 . Growth parameters of rhinoceros auklet chicks from high and low predation areas of Pine Island, 1990 .
Mass at 1 0 days (g) 120 .5 18 .02 1 2 0 . 1 21 .05 0 .03
Mass at 3 8 days (g) 302 .3 32.03 300.2 40.36 0 .03
Growth (g/day) 6 .6 1 . 2 3 6 .5 1 . 1 7 0 .05
Peak mass (g) 350 .7 24.84 349 .9 43 .18 0 .16
Mass at fledging (g) 346 .3 27.12 341.0 46 .48 0 .36
Age at fledging (d) 50 .9 2 .23 56 .2 4 .33 51. 41b
Fledge datea 67.4 4 .85 71 .6 7 .52 9 .35C
a day 1 = June 1 P < 0 .001 P = 0.003
performed on the full nested-plot design. The only variables that
differed significantly between the high and low predation areas of
the colony were age at fledging and date of fledging: chicks in
high predation areas fledged about five days younger and four days
earlier than did chicks in low predation areas.
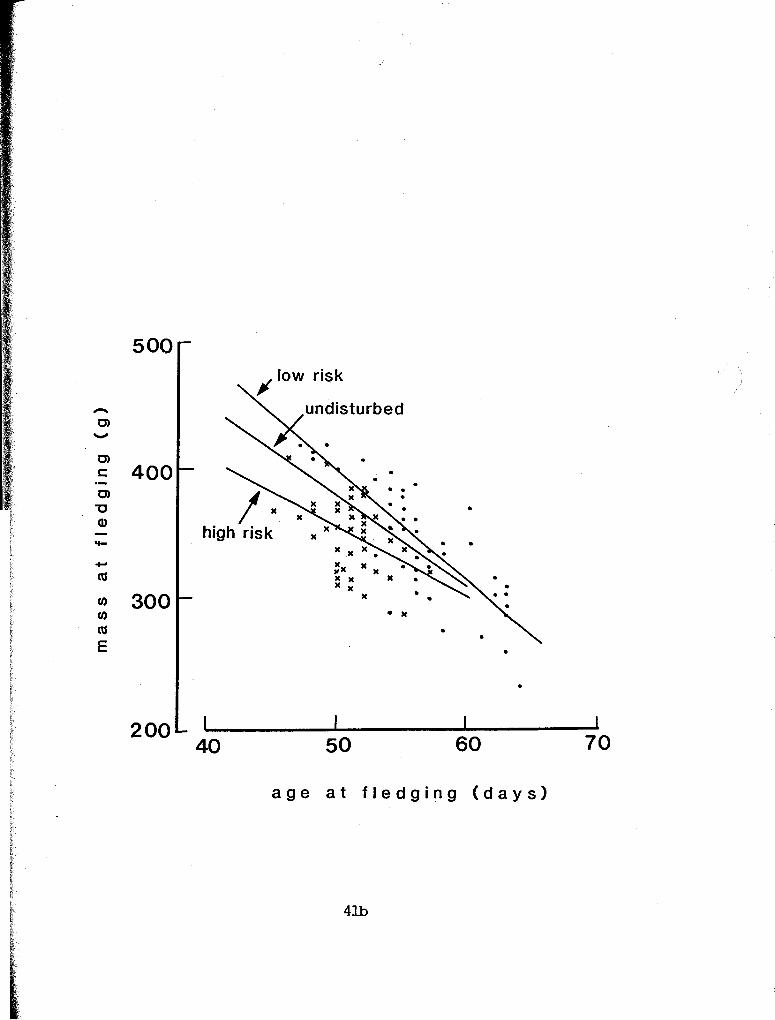
Relationships between mass and age at fledging in the high and
low predation plots are shown in Fig. 3.3. The regression lines do
not differ significantly in slope; the intercept for the former
area is higher. These lines lie above and below, respectively, the
regression line for 1990 undisturbed birds. The inverse
relationship between age at fledging and growth is significant in
both the high (y = - 0.6 x + 54.9; F = 5.63, df = 1,44, P = 0.02)
and low (y = -2.2 x + 70.6; F = 24.90, df = 1,43, P < 0.001)
predation risk habitats. Mass at fledging is positively related to
growth in both high (y = 9.7 x + 282.5; F = 10.63, df = 1,44, P =
0.002) and low (y = 30.1 x + 146.9; F = 58.19, df = 1,43, P <
0.001) risk plots.
There was no difference between the provisioning regressions
from the high and low predation areas (Fig. 3.2) . Data from chicks older than 46 days were not used to fit the lines because most
chicks resisted the hooding procedure at or just after this age.
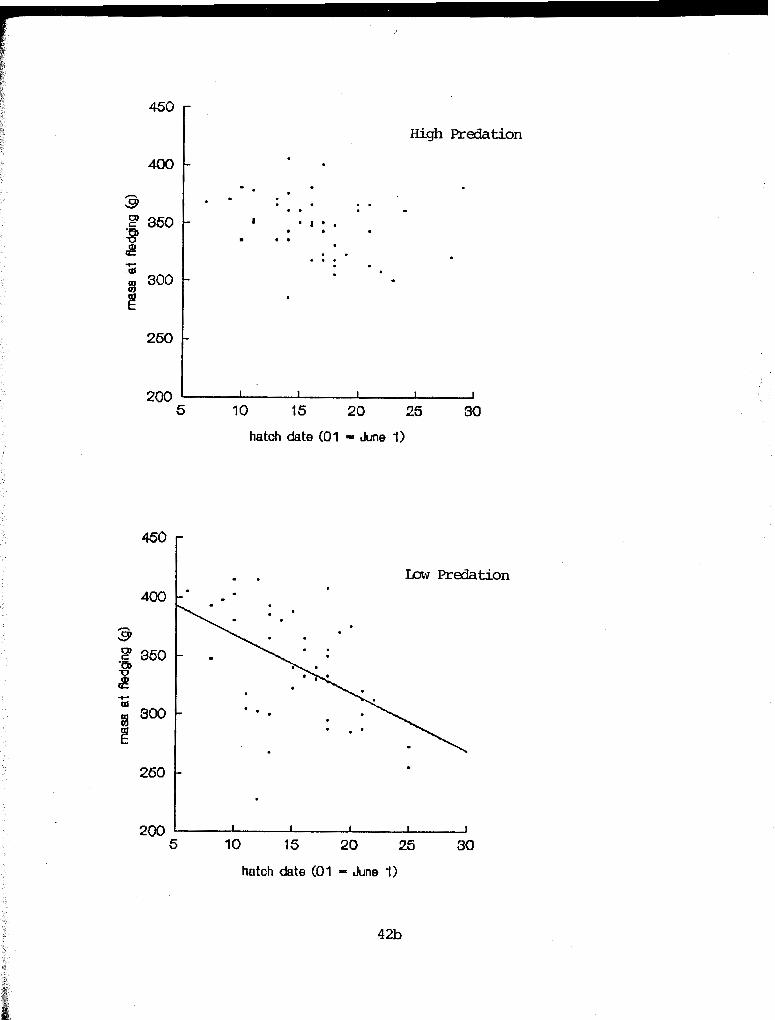
A significant seasonal decline in mass at fledging was found
in the low predation areas only (Fig. 3.4) . The slope of the
regression is steeper for the low predation plots than the high
predation plots. Peak mass also declined through the season in
both high (y = -1.7 x + 379.0; F = 4.82, df = 1,44, P = 0.03) and
40
Figure 3.3. Relationship between age and mass at fledging in high predation (y = -5.3 x + 617.5; r2 = .193; F = 10.50, df = 1/44, P = 0.002) and low predation (y = -8.7 x + 828.5; r2 = .655; F = 81.54, df = 1,43, P < 0.001) plots. ANCOVA: homogeneity of slopes - F = 2.90, df = 1, P = 0.09; homogeneity of y-intercepts - F = 6.50, df = 1, P < 0.001
For undisturbed birds: y = -7.0 x + 729.4; F = 76.4, df = 1,51, P < 0.001
a g e a t f l e d g i n g ( d a y s )
Figure 3.4. y elation ship between hatch date and mass at fledging in high predation (F = 3.66, df = 1,44, P = 0.06) and low predation (y = -5.0 x + 417.9; r2 = .243; F = 13.80, df = 1,43, P = 0.001) plots. ANCOVA: homogeneity of slopes - F = 4.37, df = 1, P = 0.04
High Predation
10 15 20 25
hatch date (01 - June 1)
Low Predation
hatch date (01 - June 1)
low (y = - 5.3 x + 432.0; F = 20.32, df = 1,43, P < 0.001)
predation risk plots. Mass at ten days was inversely related to
hatch date at both levels of predation and the decline was
significant and similar in both (Fig. 3.5). A significant
relationship between hatch date and growth was found in the low
predation areas, but not in the high predation plots (Fig. 3.6).
Discussion
My results suggest that parental behaviour is similar in high
and low predation areas throughout most of the nestling period.
Nestlings in both habitats grew at the same rates, reached similar
peak masses and received the same amounts of food until my
measurements ceased at 46 days of age. In the high predation
areas, however, the chicks fledged at a younger age but not a lower
mass. Thus, it seems that adults in all areas provisioned at the
same rates until the chicks were capable of fledging; shortly after
this time the nestlings from the high predation plots left the
colony while those from the low predation plots continued to be fed
at a rate which provides enough energy for the chicks to maintain,
but not increase, their mass. Unfortunately, due to methodological
problems (see Materials and Methods section), the feeding patterns
of adults with chicks older than 46 days are unknown.
For alcids, there appears to be no consistent relationship
between mass at fledging and post-fledging survival (eg. Lloyd
1976, Hedgren 1981, Harris and Rothery 1985). Thus, once the chick
is capable of fledging, there is no apparent advantage for the
Figure 3.5. Relationship between hatch date and mass at ten days of age in high predation (y = -1.7 x + 148.3; r2 = .472; F = 9.70, df = 1,44, P = 0.003) and low predation (y = - 1.7 x + 146.8; r2 = .400; F = 7.19, df = 1,43, P = 0.01) plots. ANCOVA: homogeneity of slopes - F = 0.003, df = 1, P = 0.95; homogeneity of y-intercepts - F = 0.36, df = 1, P = 0.55
High Predation
- --
10 15 20 25 30
hatch date (01 = June 1)
I m Predation
10 15 20 25
hatch data (01 - June 1)
Figure 3.6. Relationship between hatch date and growth rate in high predation (F = 0.16, df = 1,44, P = 0.687) and low predation (y = -0.1 x + 7.7; r2 = .103; F = 4.92, df = 1,43, P = 0.03) plots.
High
Predation
hatch date (01 - June 1)
IxxrJ
Predation
hatch date (01 = June 1)
parents to continue to feed the chick at a rate sufficient to
increase its mass. This view is supported by the results of this
study: parents in the low predation risk areas of the colony did
not provide enough food for the fully feathered chicks to increase
in mass. The main advantage to a prolonged nest period may be the
safety of the burrow in comparison to the ocean for chicks
(Ydenberg 1989). Another possible advantage is extended time for
continued development. Although no heavier, chicks in low
predation habitats fledged with significantly longer wings (158.9
mm) than did chicks from high predation areas (154.6 mm) (N = 91,
F = 22.11, P < 0.001); other aspects of development may also
proceed during this time.
No significant differences were found in hatch date or mass at
ten days. These two parameters should be unaffected by predation
at the colony as it appears that eagles do not begin to take
auklets regularly until a few days into the latter's chick-rearing
period. Few auklet remains were found on Pine Island in mid-June
at the beginning of this study although feathers are usually
evident for up to a month after first appearing (pers. obs.).
A negative regression of mass at fledging on age at fledging
is apparent in both habitats. This relationship arises from the
interaction of two other patterns consistently found in the studies
discussed in Chapter 11: a positive relationship between mass at
fledging and growth rate and an inverse relationship between age at
fledging and growth rate. The lines for the low and high predation
plots lie on either side of the line for the undisturbed chicks
(chosen without regard for the associated predation risk). This
suggests that my predation study plots do represent the two
extremes on Pine Island. The regression line for the low predation
plots lies above that for the high predation areas, indicating that
a chick growing at a given rate will fledge earlier and & a lighter mass if it inhabits a high predation risk area than if it
lives in a low risk area. The relative position of these two
regression lines is predicted by a model which examines the optimal
time of fledging from the parents1 perspective (Clark and Ydenberg
1990a). This pattern is produced because the cost of reproduction
is greater in the high risk areas and, thus, parents in these areas
maximize reproductive success by ceasing their provisioning trips
earlier, thus forcing the chick to fledge earlier.
It is interesting to note the pattern of predation events on
Pine Island. All but one incident occurred before August 3, which
is three days before the mean fledge date in the two high predation
areas. Thus, the risk of predation apparently declines
substantially during the time when most chicks are fledging. If
adults can track the seasonal changes in eagle numbers, and if
there is an advantage to maintaining the chick in the burrow for
additional time, we might expect that those chicks that had not
fledged by early August should be treated similarly to those in low
predation areas. Because this is not found, it is possible that
adults can not respond to seasonal changes in predation risk and,
therefore, continue to provision according to a previously set
pattern. It is also possible that the continued risk, even if
smaller, still represents a cost to the adult that outweighs any
benefit provided by maintaining the chick in the burrow for a few
extra days.
Because provisioning was measured in terms of burrow loads, it
is possible that the adults from high predation areas made less
frequent provisioning trips, but carried a heavier load on each
trip. However, previous studies on rhinoceros auklets and Atlantic
puffins have found that inter-annual differences in growth rates
resulted from changes in feeding frequency, but not in the amount
of food brought in per feeding trip (Harris and Hislop 1978,
Bertram and Kaiser 1988). Similarly, the risk of kleptoparasitism
by gulls did not affect the size of meals delivered by Atlantic
puffins, but the feeding frequency was lower where the risk was
although increasing the size of the food load per trip while
decreasing the trip frequency would be advantageous to white-tailed
tropicbirds (Phaethon le~turus) attempting to avoid attacks during
arrivals at the colony, the chicks' swallowing capacity sets a
constraint on the meal size. Rhinoceros auklet food loads are
probably not similarly constrained because the chicks are capable
of picking up fish left on the floor of the nest chamber (pers.
obs.). It is also possible that parents from different habitats
were bringing fish which differed in caloric content (Bertram and
Kaiser 1988). Although the types of fish brought were not
quantified in this study, with the exception of five individuals,
all the identifiable fish recovered in the burrow searches were
48
Pacific sandlance (Ammodvtes hexapterus) during most of July, and
Pacific herring (Clupea harensus) at the end of July and beginning
of August. Thus, it seems unlikely that there was a significant
difference in the quality of fish delivered to different regions of
the island.
The results of this study differ from those of other studies
that have examined the effects of risk on provisioning rates and $ chick growth. Harris (1980) compared various reproductive
parameters of Atlantic puffins in Scotland that were subjected to
high and low rates of great black-backed gull predation. Chicks
from high predation areas reached a lower peak mass later and
fledged at an older age and lighter mass than did chicks from lower
predation areas. Although no differences were found in mean number
of feedings or mean mass of loads between the two types of habitat,
Harris (1980) suggested that he had too few observations to be
confident that no difference in feeding rates occurred. Thus, it
seems that the puffins facing a higher risk of predation visit less
frequently or bring in less food, causing their chicks to grow more
slowly.
Similarly, in Newfoundland, Atlantic puffins in areas
subjected to high rates of kleptoparasitism by herring gulls (Larus
arqentatus) fed their chicks less frequently throughout the season
than did birds in areas with lower rates of robbing, and the chicks
in the former group grew slower and fledged at a lower mass
(Nettleship 1972) . The arrival of f ish-carrying puff ins at the
colony tends to be clumped in time; puffins seem to wait offshore
with fish in order to be able to arrive on the colony in groups and
'swamp' the gulls (Harris and Hislop 1978, Rice 1987). This
swamping tactic is an effective anti-robbing technique (Rice 1987),
but results in fewer feeding trips and lower nestling growth rates.
The synchronization of arrivals and departures to and from the
colony by rhinoceros auklets may serve as an anti-predator
technique (Leschner 1976, Wilson 1977, Watanuki 1990).
A nearly identical seasonal decline in mass at ten days was
found in both high and low predation areas. It is unlikely that
this decline was caused by a seasonal reduction in food
availability, because chick growth showed no consistent
relationship with hatch date. As discussed in Chapter 11, the
seasonal reduction in egg size found in some alcids may be a result
of the trade-off a late-laying female faces between lay date and
egg size (Birkhead and Harris 1985).
Seasonal declines in peak and fledging mass have also been
reported in many studies of breeding alcids (eg. Hedgren and
Linnman 1979, Lloyd 1979, Birkhead and Nettleship 1982, Wilson and
Manuwal 1986), although the trends are often not consistent between
colonies or between years (Gaston 1985). In the present study, a
seasonal decline in peak mass is evident in both types of area; the
steeper negative slope in the low predation plots results from the
inverse relationship of hatch date with growth in these areas.
Similarly, a significant inverse relationship between mass at
fledging and hatch date was found in the low predation area and a
strong trend was found in the high predation plots. Although such
seasonal declines may be due to a seasonal decline in available
food in some cases (Birkhead and Nettleship 1982), the lack of
relationship between growth and hatch date for the Pine Island
auklets suggests that other factors are important. The decline is
predicted because later hatching chicks should leave the colony at
an earlier age (and correspondingly lighter mass) in order to take
advantage of the potentially higher growth rate at sea and reach a
high mass before the onset of winter (Ydenberg 1989).
The results outlined above are consistent with those expected
if the observed provisioning pattern is the outcome of parent-
offspring conflict (Trivers 1974) and it is advantageous for the
chick to remain in the burrow. As chicks approach fledging and are
increasingly able to survive at sea, the costs to the parent of
further investment (in terms of decreased parental survival) should
eventually exceed the benefits (in terms of increased chick
survival). At this point, adults should cease feeding even if
chick fitness is not maximized.
As risk of predation may detrimentally affect reproduction in
rhinoceros auklets, and varies in intensity around the colony, why
do the auklets breed at all in dangerous places? Although most of
the periphery of Pine Island is saturated with burrows, auklets
have not colonized the interior of the island. The pattern of
colony expansion on Pine Island seems to indicate that there is an
advantage to nesting on the periphery: the most active area of new
excavations was on the edge of the island next to a heavily
depredated section of the colony. The decrease in predation risk
that might accompany a shift to the interior may be outweighed by
a concomitant increase in risk of injury to birds flying into the
colony at night (Vermeer and Lemon 1986).
CHAPTER I V
GENERAL CONCLUSIONS
In Chapter 11, I used intra- and inter-annual comparisons of
undisturbed nestlings, as well as the results of a supplementary
feeding experiment, to test the predictions of a model that
calculates the optimal fledging decision, from the perspective of
the chick, based on relative mortality and growth rates in the
burrow and at sea (Ydenberg 1989). In intra-annual comparisons in
1989 and 1990, mass at fledging was positively related to growth
rate, whereas age at fledging was inversely related to growth rate.
These patterns produced a significant inverse regression of mass at
fledging on age at fledging in both years: rhinoceros auklet
chicks that grew faster fledged at a heavier mass and younger age
than did those chicks that grew more slowly. These trends are
predicted by the model. The supplementary feeding study
experimentally increased the growth rates of a sample of chicks.
Again, chicks that grew faster fledged earlier and at a higher mass
than did chicks that grew slower.
The inter-annual comparison of chick developmental parameters
does not support the predictions of the model as completely. I
suggest that variables that could not be controlled, such as
oceanic feeding conditions or predation risk, may have been
confounding factors in the inter-annual comparisons and, thus, this
is the weakest test of the model.
I also showed that certain patterns of chick development were
consistent for undisturbed chicks in both years of the study. I
found a seasonal decline in mass at ten days of age and in mass at
fledging. The lack of a similar decline in chick growth rate over
the season suggests that a deterioration of food resources did not
occur. An alternative explanation for the seasonal decline in
fledging mass is provided by the fledging model.
In Chapter 111, I attempted to determine the effect of risk of
predation to the provisioning adult on the behaviour of the parent
and the chick. I found that nestlings in high and low predation
risk habitats hatched at the same time, received the same amount of
food until the age of 46 days and reached similar peak masses.
Chicks in high predation risk areas of the colony, however, fledged
at a younger age but similar mass as did chicks from low risk
areas.
My results suggest that adults1 provisioning behaviour is
similar in all areas of the colony until the chicks are capable of
fledging. Chicks in high risk areas leave their burrows soon after
this point, but chicks in low risk habitats stay in their burrows
for about five more days and continue to be fed at a rate that
maintains their mass. As the chicks approach fledging, the costs
to the parents of continued feeding trips should eventually
outweigh the benefits of keeping the chick in the burrow; the point
at which this happens is expected to be earlier in areas of high
predation risk because the costs to the parents are higher in these
areas. My results are consistent with this interpretation. The
advantage for the chick to remain in the burrow may be the relative
safety of burrows when compared to that at sea or the opportunity
for continued development.
I also found a significant inverse relationship between mass
at fledging and age at fledging in both the high and low predation
risk plots. The regression line for the high risk habitats falls
below that for the low risk habitats; thus, a chick growing at a
given rate will fledge earlier and at a lighter mass if it inhabits
a high risk area than if it inhabits a low risk area. This pattern
is predicted by a model that considers the optimal time of fledging
from the perspective of the parents (Clark and Ydenberg 1990a).
The general correspondence of my results to the predictions
generated by a life history approach to optimal time of fledging in
rhinoceros auklets supports the validity of this approach. It
suggests that relative mortality and growth rates in burrows and at
sea and predation risk to provisioning parents are important
variables in the determination of time of fledging.
One important factor that is still unknown is the nature of
the parent-chick interactions around the time of fledging. The
models considered here predict how the optimal fledging age should
change with variation in other parameters from the perspective of
either the chick or the adult. Due to methodological difficulties,
I was unable to determine the sequence of events at fledging and it
is still unclear to what extent the chick or parent control the
time of fledging. A more appropriate approach may be to model the
fledging decision as the outcome of an evolutionary conflict
between parents and offspring using a dynamic ESS model, as was
done by Clark and Ydenberg (1990b) for dovekies (Alle alle).
Future research should examine this process.
LITERATURE CITED
Ainley, D.G. and D.P DeMaster. 1980. survival and mortality in a population of Adelie Penguins. Ecology 61: 522-530.
Bertram, D.F. 1988. ~rovisioning of nestlings by parent Rhinoceros Auklets. M.Sc. Thesis, Simon Fraser University, Burnaby , B . C .
Bertram, D.F. and G.W. Kaiser. 1988. ~onitoring growth and diet of nestling Rhinoceros Auklets to gauge prey availability. Canadian Wildlife Service Tech. Report Series No. 48.
Bertram, D.F:, G.W. Kaiser and R.C. Ydenberg. 1991. Patterns in the provisioning and growth of nestling Rhinoceros Auklets. Auk (in press).
Birkhead, T.R. and M.P. Harris. 1985. Ecological adaptations for breeding in the Atlantic Alcidae. Pp. 205-231 In: The Atlantic Alcidae. D.N. Nettleship and T.R. Birkhead (eds). Academic Press, Toronto, Ont.
Birkhead, T.R. and D.N. Nettleship. 1982. The adaptive significance of egg size and laying date in Thick-billed Murres Uria lomvia. Ecology 63: 300-306.
Clark, C.W. and R.C. Ydenberg. 1990a. The risks of parenthood I. General theory and applications. Evol. Ecol. 4: 21-34.
Clark, C.W. and R.C. Ydenberg. 1990b. The risks of parenthood 11. Parent-offspring conflict. Evol. Ecol. 4: 312-325.
Cody, M.L. 1973. Coexistence, coevolution and convergent evolution in seabird communities. Ecology 54: 31-44.
DeGange, A.R. and J.W. Nelson. 1982. Bald Eagle predation on nocturnal seabirds. J. Field Ornithol. 53: 407-409.
Evans, P.G.H. and D.N. Nettleship. 1985. Conservation of the Atlantic Alcidae. Pp. 428-488 In: The Atlantic Alcidae. D.N. Nettleship and T.R. Birkhead (eds). Academic Press, Toronto, Ont .
Gaston, A.J. 1985. Development of the young in the Atlantic Alcidae. Pp. 319-354 In: The Atlantic Alcidae. D.N. ~ettleship and T.R. Birkhead (eds). ~cademic Press, Toronto, Ont .
Gaston, A.J. and D.N. Nettleship. 1981. The Thick-billed Murres of Prince Leopold Island. Canadian Wildlife Service Monograph Series No. 6.
Harris, MOP. 1976. Lack of a 'desertion period1 in the nesting life of the Puffin Fratercula arctica. Ibis 118: 115-118.
Harris, M.P. 1980. Breeding performance of Puffins Fratercula arctica in relation to nest density, laying date and year. Ibis 122: 193-209.
Harris, M.P. 1982. Seasonal variation in fledging weight of the Puffin Fratercula arctica. Ibis 124: 100-103.
Harris, M.P. 1984. The Puffin. T & AD Poyser, Ltd., Calton, England.
Harris, M.P. and T.R. Birkhead. 1985. Breeding ecology of the Atlantic Alcidae. Pp. 155-204 In: The Atlantic Alcidae. D.N. Nettleship and T.R. Birkhead (eds). Academic Press, Toronto, Ont.
Harris, M.P. and J.R.G. Hislop. 1978. The food of young Puffins Fratercula arctica. J. Zool., Lond. 185: 213-236.
Harris, M.P. and P. Rothery. 1985. The post-fledging survival of young Puffins Fratercula arctica in relation to hatching date and growth. Ibis 127: 243-250.
Hatch, S.A. 1984. Nestling diet and feeding rates of Rhinoceros Auklets in Alaska. Pp. 106-115 In: Marine Birds: their feeding ecology and commercial fisheries relationships. D.N. Nettleship, G.A. Sanger and P.P Springer (eds). Canadian Wildlife Service Special Publication.
Hedgren, S. 1979. Seasonal variation in fledging weight of Guillemots Uria aalae. Ibis 121: 356-361.
Hedgren, S. 1981. Effect of fledging weight and time of fledging on survival of Guillemot Uria aalqe chicks. Ornis Scand. 12: 51-54.
Hedgren, S. and A, Linnman. 1979. Growth of Guillemot Uria aalae chicks in relation to time of hatching. Ornis Scand. 10: 29-36.
Hudson, P.J. 1985. Population parameters for the Atlantic Alcidae. Pp. 233-261 In: The Atlantic Alcidae. D.N. Nettleship and T.R. Birkhead (eds). Academic Press, Toronto, Ont .
Kaiser, G.W., 1989. Nightly concentrations of Bald Eagles at an auklet colony. Northwestern Naturalist 70: 12-13.
Leschner, L.L. 1976. The breeding biology of the Rhinoceros Auklet on Destruction Island. M.Sc. Thesis, University of Washington, Seattle, WA.
Lloyd, C.S. 1976. The breeding biology and survival of the Razorbill Alca torda L. Ph.D. thesis, University of Oxford, Oxford. (cited in Gaston 1985)
Lloyd, C.S. 1979. Factors affecting breeding of Razorbills Alca torda on Skokholm. Ibis 121: 165-176.
Magnhagen, C. 1991. Predation risk as a cost of reproduction. TREE 6: 183-186.
Nelson, D.A. 1989. Gull predation on Cassinls Auklet varies with the lunar cycle. Auk 106: 495-497.
Nettleship, D.N. 1972. Breeding success of the Common Puffin (Fratercula arctica L.) on different habitats at Great Island, Newfoundland. Ecol. Monogr. 42: 239-268.
Nur, N. 1988. The cost of reproduction in birds: an examination of the evidence. Ardea 76: 155-168.
Reznick, D. 1985. Costs of reproduction: an evaluation of the empirical evidence. Oikos 44: 257-267.
Rice, J. 1987. Behavioural responses of Common Puffins to kleptoparasitism by herring gulls. Can. J. 2001. 65: 339-347.
Schaffner, F.C. 1990. Food provisioning by White-tailed Tropicbirds: effects on the developmental pattern of chicks. Ecology 71: 375-390.
Sokal, R.R. and F.J. Rohlf. 1981. Biometry. W.H. Freeman and Co., San Francisco, CA.
Stearns, S. 1980. A new view of life-history evolution. Oikos 35: 266-281.
Vermeer, K. and L. Cullen. 1979. Growth of Rhinoceros Auklets and Tufted Puffins, Triangle Island, British Columbia. Ardea 67: 22-27.
Vermeer, K., L. Cullen and M. Porter. 1979. A provisional explanation of the reproductive failure of Tufted Puffins Lunda cirrhata on Triangle Island, British columbia. Ibis 121: 348- 354.
Vermeer, K. and M. Lemon. 1986. ~esting habits and habitats of Ancient Murrelets and Cassinls Auklets in the Queen Charlotte Islands, British Columbia. Murrelet 67: 33-44.
Watanuki, Y. 1986. Moonlight avoidance behavior in Leach's Storm-petrels as a defense against Slaty-backed Gulls. Auk 103: 14-22.
Watanuki, Y. 1987. Breeding biology and foods of Rhinoceros Auklets on Teuri Island, Japan. Proc. NIPR Symp. Polar Biol. 1: 175-183.
Watanuki, Y. 1990. Daily activity patterns of Rhinoceros Auklets and kleptoparasitism by Black-tailed Gulls. Ornis. Scand. 21: 28-36.
Williams, G.C. 1966. Adaption and Natural Selection. Princeton University Press, Princeton, NJ.
Wilkinson, L. 1989. SYSTAT: The System for Statistics. SYSTAT, Inc., Evanston, IL.
Wilson, U.W. 1977. A study of the biology of the rhinoceros auklet on Protection Island, Washington. M.Sc. Thesis, University of Washington, Seattle, WA.
Wilson, U.W. and D.A. Manuwal. 1986. Breeding biology of the Rhinoceros Auklet in Washington. Condor 88: 143-155.
Ydenberg, R.C. 1989. Growth-mortality trade-offs and the evolution of juvenile life histories in the Alcidae. Ecology: 1494-1506.
APPENDIX 1
One of the assumptions of the optimal fledging models
considered in this thesis (Ydenberg 1989, Clark and Ydenberg 1990a)
is that the mortality rate for chicks is greater at sea than that
in the burrows. In 1989, three of 178 chicks died in the burrow,
giving a daily mortality rate of 3.1 x 10⁻⁴. The daily mortality r!
of chicks at sea can be estimated as follows: Given a 7
% annual mortality for adults (the mean value for Atlantic puff ins,
from Hudson 1985), of 356 parents (2 x 178), 24.9 will die each
year. Assuming a constant breeding population size, this means
that 24.9 breeding spaces will open each year. Thus, of the 175
chicks alive at the end of the nestling period, 150.1 (175 - 24.9) will die prior to breeding. If the young reach maturity in their
fourth year, this mortality will occur over 1406 [(4 x 365) + 1 - 551 days. The corresponding daily mortality rate (m) is determined
from the equation 175e-m(1406) = 24.9. Solving this equation yields
m = 1.4 x
Thus, given the assumptions outlined above, the daily
mortality rate for chicks is approximately 4.5 times higher at sea
than in the burrow. The assumptions are likely to be conservative,
as the mortality rate in the sea is probably highest immediately