Effects of Heat of Vaporization and Octane Sensitivity on Knock-Limited Spark Ignition Engine PerformanceMatthew A. Ratcliff, Jonathan Burton, Petr Sindler, Earl Christensen, Lisa Fouts, and Robert L. McCormick National Renewable Energy Laboratory
Citation: Ratcliff, M.A., Burton, J., Sindler, P., Christensen, E. et al., “Effects of Heat of Vaporization and Octane Sensitivity on Knock-Limited Spark Ignition Engine Performance,” SAE Technical Paper 2018-01-0218, 2018, doi:10.4271/2018-01-0218.
Abstract
Knock-limited loads for a set of surrogate gasolines all having nominal 100 research octane number (RON), approximately 11 octane sensitivity (S), and a heat of
vaporization (HOV) range of 390 to 595 kJ/kg at 25°C were investigated. A single-cylinder spark-ignition engine derived from a General Motors Ecotec direct injection (DI) engine was used to perform load sweeps at a fixed intake air temperature (IAT) of 50 °C, as well as knock-limited load measurements across a range of IATs up to 90 °C. Both DI and pre-vaporized fuel (supplied by a fuel injector mounted far upstream of the intake valves and heated intake runner walls) experiments were performed to separate the chemical and thermal effects of the fuels’ knock resistance. The DI load sweeps at 50°C intake air temperature showed no effect of HOV on the knock-limited performance. The data suggest that HOV acts as a thermal contributor to S under the conditions studied.
Measurement of knock-limited loads from the IAT sweeps for DI at late combustion phasing showed that a 40 vol% ethanol (E40) blend provided additional knock resistance at the highest temperatures, compared to a 20 vol% ethanol blend and hydrocarbon fuel with similar RON and S. Using the pre-vaporized fuel system, all the high S fuels produced nearly identical knock-limited loads at each temperature across the range of IATs studied. For these fuels RON ranged from 99.2 to 101.1 and S ranged from 9.4 to 12.2, with E40 having the lowest RON and highest S. The higher knock-limited loads for E40 at the highest IATs examined were consistent with the slightly higher S for this fuel, and the lower engine operating condition K values arising from use of this fuel. The study highlights how fuel HOV can affect the temperature at intake valve closing, and consequently the pressure-temperature history of the end gas leading to more negative values of K, thereby enhancing the effect of S on knock resistance.
Introduction
There is a significant opportunity to improve spark-ignition (SI) engine efficiency through the combined application of more efficient engine designs and oper-
ating strategies, and improved fuels [1]. The benefits of improved SI engine efficiency are enhanced national security through reduction of dependence on petroleum imports [2], reduced costs to consumers [3], and protection of the environ-ment [4]. In the United States and around the world, govern-ments are requiring significant vehicle fuel economy improve-ments to achieve these benefits [5,6].
The primary fuel related engine design and operational strategies that improve efficiency are increased compression ratio (CR), the combined effects of engine downsizing and turbocharging, operating the engine at lower speeds, cylinder deactivation, exhaust gas recirculation (EGR), and utilizing direct injection (DI) [1,7,8]. Increasing CR increases the ther-modynamic efficiency of the engine [9], while also increasing the temperature and pressure of the unburned fuel-air mixture resulting in engine knock at high loads. Thus, while increasing CR can be used to improve part load efficiency, it is limited by the knock resistance of the fuel. Engines exhibit lower
efficiency when operated at light loads because of parasitic losses. Downsizing, turbocharging, and DI are used to operate engines at higher load over a larger portion of the engine map [10]. Similarly, operating at lower engine speeds or down-speeding requires higher load to achieve the same power. Downsizing and down-speeding also reduce friction in the engine resulting in improved efficiency. Cylinder deactivation is used at light loads to increase the load and hence efficiency in the remaining cylinders [11]. All these strategies to operate the engine at higher loads also result in higher temperature and pressure of the unburned fuel-air mixture, and thus are limited by engine knock.
Spark-timing retard is applied at high load conditions to mitigate knock but at the expense of reduced efficiency due to less ideal combustion phasing, reduced torque, and increased exhaust temperature [12]. At very high loads fuel enrichment is also used to reduce knock and control exhaust temperature to prevent engine and catalyst damage - but at the expense of high carbon monoxide and hydrocarbon emissions [13].
The high-efficiency engine design and operation strate-gies described above can all be pursued more aggressively-that
NREL/CP-5400-70443. Posted with permission. Presented at WCX18: SAE World Congress Experience, 10-12 April 2018, Detroit, Michigan.
2 EFFECTS OF HEAT OF VAPORIzATION ANd OCTANE SENSITIVITy
is, with less use of spark timing retard and fuel enrichment-if the engine is using a more highly knock resistant fuel. For example, an analysis of several studies suggests that an increase of 1 CR unit requires a research octane number (RON) increase of approximately 5 units [14]. Fuel properties that affect knock resistance include RON, motor octane number (MON), octane sensitivity (S = RON – MON), and heat of vaporization (HOV). Modern engines, especially downsized boosted engines, operate under conditions where increased RON and increased S (or decreased MON) cause increased knock resistance [15,16]. This effect has been described in terms of octane index (OI)-a fuel’s actual resis-tance to autoignition [17]-where:
OI RON= - *K S (1)
For downsized boosted engines K is negative at the most knock-limited operating conditions, such that increasing S increases OI [18].
While retaining stoichiometric conditions, EGR improves efficiency by reducing pumping losses at light and interme-diate loads and by reduced heat transfer because of lower peak temperature [7]. The specific heat ratio Cp/Cv (or γ) also increases with EGR which improves the efficiency of the conversion of heat into work. Also, Alger and coworkers have shown that the lower in-cylinder temperature caused by EGR reduces engine knock and that each percentage increase in EGR is equivalent to an octane number increase of 0.5 [8].
DI enables higher power density in downsized boosted engines primarily by reducing the fuel-air mixture tempera-ture through evaporative cooling [19, 20, 21, 22, 23]. These studies suggest that cooling for hydrocarbon fuels provides the same effect as an increase of roughly 5 octane number units-adequate to allow increasing compression ratio by 1 unit [15]. Evaporative cooling also improves engine volumetric efficiency by reducing pumping losses at part load [19]. Ethanol exhibits a much higher HOV than hydrocarbon gasolines, and thus ethanol blends can produce a significant increase in evaporative cooling and measured fuel knock resistance [19, 21, 22, 23, 24, 25, 26, 27]. Kasseris and Heywood present experiments and analysis showing that charge cooling can range from roughly 15°C for E0 to 30°C at E50 and as high as 50°C for E85 blends, and that these values are about 70% of the thermodynamic maximum possible cooling [22].
An important study by Foong and coworkers revealed the impact of evaporative cooling from ethanol blending on the RON measured in the Cooperative Fuels Research (CFR) engine by ASTM D2699 [28]. These researchers found little impact of increased HOV on RON up to approximately 30 to 40 volume percent (vol%) ethanol, but at higher HOV levels RON was significantly higher relative to values measured using a modified test method with heating of the intake air to remove the HOV effect. The authors suggest that at ethanol levels above about 30%, HOV cooling is so large that the intake mixture becomes saturated and liquid droplets are being inducted into the CFR engine. This study has been interpreted by others (but not by the original study authors) as indicating that the RON test captures the increased HOV from ethanol blends, and is supported by DI engine studies of fuels having differing ethanol content but matched RON where no addi-tional knock resistance was observed [13, 29, 30]. Yet these
studies conflict with other studies cited above, and with the well-established effect of evaporative cooling in DI engines and the greater degree of cooling observed for ethanol blends.
Sluder and coworkers [25] addressed this apparent contra-diction by pointing out that in studies showing an HOV benefit, HOV is covariant with S [22,23,26]. However, studies that fixed S while varying HOV did not show additional knock benefit for higher HOV fuels [13,25,31]. Based on these studies, Sluder and coworkers suggest that HOV be considered as a thermal component to S. However, S has a different effect on knock resistance at different engine operating conditions and this may also be true for HOV. The work described here is part of a larger effort to characterize the HOV of gasoline blends, examine the effect of HOV on knock and emissions at various engine conditions, and potentially learn how to leverage HOV to improve engine performance using specific operation strategies.
Methods
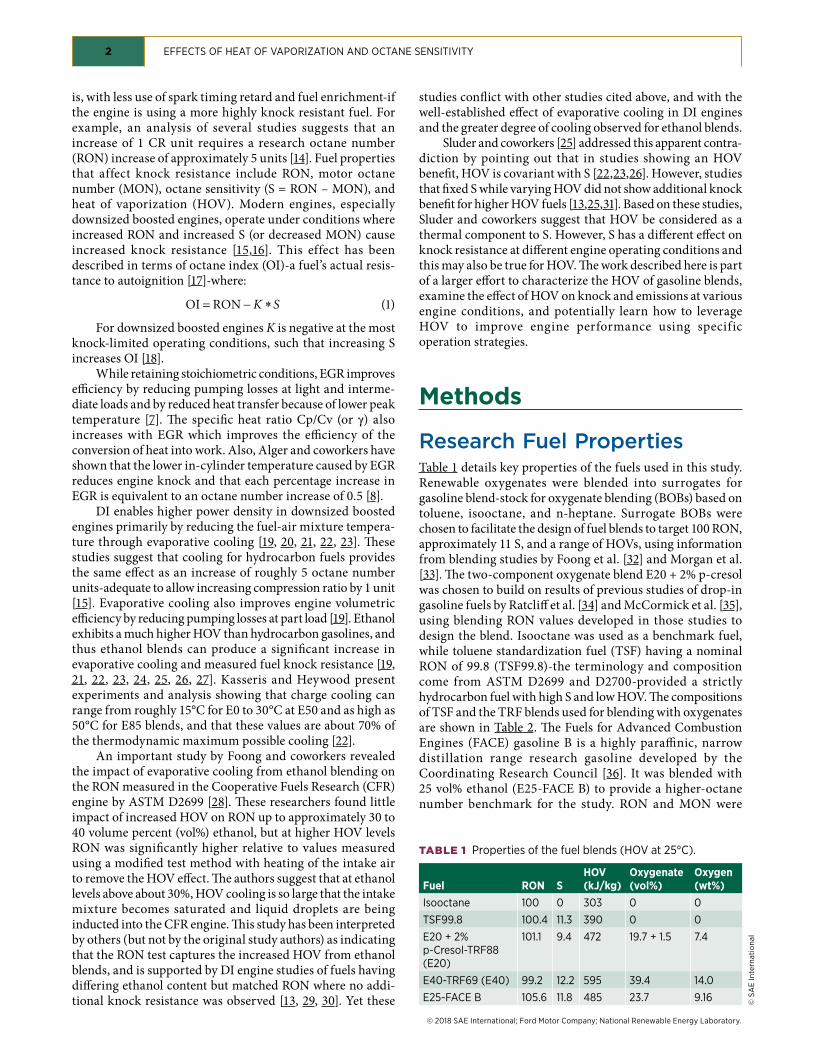
Research Fuel PropertiesTable 1 details key properties of the fuels used in this study. Renewable oxygenates were blended into surrogates for gasoline blend-stock for oxygenate blending (BOBs) based on toluene, isooctane, and n-heptane. Surrogate BOBs were chosen to facilitate the design of fuel blends to target 100 RON, approximately 11 S, and a range of HOVs, using information from blending studies by Foong et al. [32] and Morgan et al. [33]. The two-component oxygenate blend E20 + 2% p-cresol was chosen to build on results of previous studies of drop-in gasoline fuels by Ratcliff et al. [34] and McCormick et al. [35], using blending RON values developed in those studies to design the blend. Isooctane was used as a benchmark fuel, while toluene standardization fuel (TSF) having a nominal RON of 99.8 (TSF99.8)-the terminology and composition come from ASTM D2699 and D2700-provided a strictly hydrocarbon fuel with high S and low HOV. The compositions of TSF and the TRF blends used for blending with oxygenates are shown in Table 2. The Fuels for Advanced Combustion Engines (FACE) gasoline B is a highly paraffinic, narrow distillation range research gasoline developed by the Coordinating Research Council [36]. It was blended with 25 vol% ethanol (E25-FACE B) to provide a higher-octane number benchmark for the study. RON and MON were
TABLE 1 Properties of the fuel blends (HOV at 25°C).
measured by ASTM D2699 and D2700, respectively. Based on detailed gas chromatographic analysis using ASTM D6729, the total HOV was calculated as detailed in reference [24].
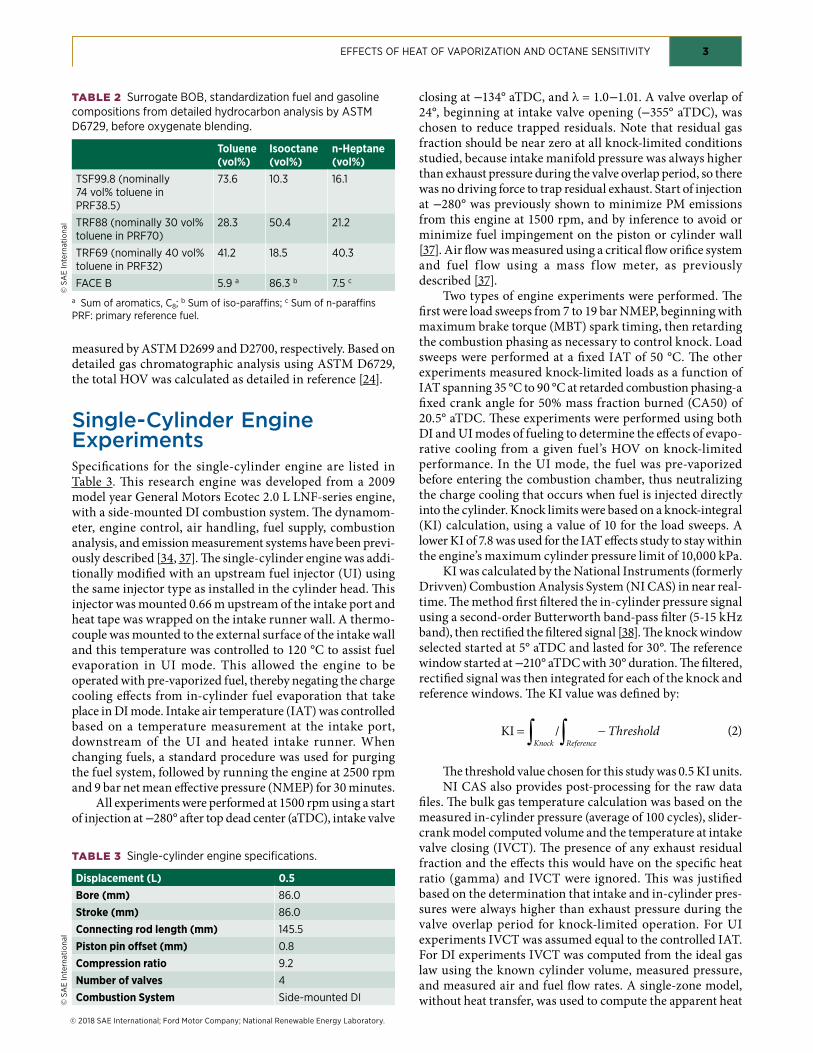
Single-Cylinder Engine ExperimentsSpecifications for the single-cylinder engine are listed in Table 3. This research engine was developed from a 2009 model year General Motors Ecotec 2.0 L LNF-series engine, with a side-mounted DI combustion system. The dynamom-eter, engine control, air handling, fuel supply, combustion analysis, and emission measurement systems have been previ-ously described [34, 37]. The single-cylinder engine was addi-tionally modified with an upstream fuel injector (UI) using the same injector type as installed in the cylinder head. This injector was mounted 0.66 m upstream of the intake port and heat tape was wrapped on the intake runner wall. A thermo-couple was mounted to the external surface of the intake wall and this temperature was controlled to 120 °C to assist fuel evaporation in UI mode. This allowed the engine to be operated with pre-vaporized fuel, thereby negating the charge cooling effects from in-cylinder fuel evaporation that take place in DI mode. Intake air temperature (IAT) was controlled based on a temperature measurement at the intake port, downstream of the UI and heated intake runner. When changing fuels, a standard procedure was used for purging the fuel system, followed by running the engine at 2500 rpm and 9 bar net mean effective pressure (NMEP) for 30 minutes.
All experiments were performed at 1500 rpm using a start of injection at −280° after top dead center (aTDC), intake valve
closing at −134° aTDC, and λ = 1.0−1.01. A valve overlap of 24°, beginning at intake valve opening (−355° aTDC), was chosen to reduce trapped residuals. Note that residual gas fraction should be near zero at all knock-limited conditions studied, because intake manifold pressure was always higher than exhaust pressure during the valve overlap period, so there was no driving force to trap residual exhaust. Start of injection at −280° was previously shown to minimize PM emissions from this engine at 1500 rpm, and by inference to avoid or minimize fuel impingement on the piston or cylinder wall [37]. Air flow was measured using a critical flow orifice system and fuel f low using a mass f low meter, as previously described [37].
Two types of engine experiments were performed. The first were load sweeps from 7 to 19 bar NMEP, beginning with maximum brake torque (MBT) spark timing, then retarding the combustion phasing as necessary to control knock. Load sweeps were performed at a fixed IAT of 50 °C. The other experiments measured knock-limited loads as a function of IAT spanning 35 °C to 90 °C at retarded combustion phasing-a fixed crank angle for 50% mass fraction burned (CA50) of 20.5° aTDC. These experiments were performed using both DI and UI modes of fueling to determine the effects of evapo-rative cooling from a given fuel’s HOV on knock-limited performance. In the UI mode, the fuel was pre-vaporized before entering the combustion chamber, thus neutralizing the charge cooling that occurs when fuel is injected directly into the cylinder. Knock limits were based on a knock-integral (KI) calculation, using a value of 10 for the load sweeps. A lower KI of 7.8 was used for the IAT effects study to stay within the engine’s maximum cylinder pressure limit of 10,000 kPa.
KI was calculated by the National Instruments (formerly Drivven) Combustion Analysis System (NI CAS) in near real-time. The method first filtered the in-cylinder pressure signal using a second-order Butterworth band-pass filter (5-15 kHz band), then rectified the filtered signal [38]. The knock window selected started at 5° aTDC and lasted for 30°. The reference window started at −210° aTDC with 30° duration. The filtered, rectified signal was then integrated for each of the knock and reference windows. The KI value was defined by:
KI = -ò ò/Knock ReferenceThreshold (2)
The threshold value chosen for this study was 0.5 KI units.NI CAS also provides post-processing for the raw data
files. The bulk gas temperature calculation was based on the measured in-cylinder pressure (average of 100 cycles), slider-crank model computed volume and the temperature at intake valve closing (IVCT). The presence of any exhaust residual fraction and the effects this would have on the specific heat ratio (gamma) and IVCT were ignored. This was justified based on the determination that intake and in-cylinder pres-sures were always higher than exhaust pressure during the valve overlap period for knock-limited operation. For UI experiments IVCT was assumed equal to the controlled IAT. For DI experiments IVCT was computed from the ideal gas law using the known cylinder volume, measured pressure, and measured air and fuel flow rates. A single-zone model, without heat transfer, was used to compute the apparent heat
TABLE 2 Surrogate BOB, standardization fuel and gasoline compositions from detailed hydrocarbon analysis by ASTM d6729, before oxygenate blending.
Toluene (vol%)
Isooctane (vol%)
n-Heptane (vol%)
TSF99.8 (nominally 74 vol% toluene in PRF38.5)
73.6 10.3 16.1
TRF88 (nominally 30 vol% toluene in PRF70)
28.3 50.4 21.2
TRF69 (nominally 40 vol% toluene in PRF32)
41.2 18.5 40.3
FACE B 5.9 a 86.3 b 7.5 c
a Sum of aromatics, C8; b Sum of iso-paraffins; c Sum of n-paraffins PRF: primary reference fuel.
release rates (AHRR) from the average in-cylinder pressure of 100 cycles [39,40]. Calculation of AHRR utilized a constant specific heat ratio of 1.34 for all cases.
Results
Engine-Fuel PerformanceFigure 1 shows results for the DI load sweeps versus the CA50 metric for combustion phasing. The performance benefit from fuels that have S ≈ 11 compared with isooctane (S = 0) is clear. A load of 1500 kPa NMEP was the highest output achievable for isooctane because nearly 17°of spark retard (relative to MBT spark timing) was required to control knock. The resulting late combustion phasing at CA50 ≈ 24° aTDC just avoided combustion instability, which manifested as coeffi-cient of variation >2% for NMEP with more retarded CA50. In contrast, only ≈ 6° of spark retard was required to control knock for the high S fuels at 1500 kPa NMEP. Minimizing combustion phasing retard implies higher thermal efficiency because the phasing is closer to optimal (i.e., MBT). These results require that K in equation (1) is negative at retarded spark timing. Note that even higher loads could be achieved from the high S fuels by retarding combustion phasing further. However, an upper NMEP limit of 1900 kPa was imposed because this load corresponded with peak cylinder pressures during knocking cycles at or near General Motor’s recom-mended limit of 10,000 kPa; this threshold triggered an auto-matic attenuation of fuel injection rate to protect the engine.
The three S ≈ 11 fuels all produced essentially the same performance, within experimental error. Thus, at these condi-tions, knock-limited performance appears to be independent of the fuels’ HOV (ranging from 390 kJ/kg to 595 kJ/kg at 25°C), suggesting that HOV effects on knock resistance are included in S under these operating conditions. This is
consistent with the theory of HOV being a thermal contributor to S proposed by Sluder et al. [25].
Figure 2 shows NMEP across a range of IATs at late combustion phasing (CA50 held constant at 20.5° aTDC) for both DI and UI fueling. Tables of the data presented in Figure 2, along with other parameters investigated, are shown in the appendix, Tables A-1 and A-2. Comparing results for UI versus DI mode, much higher knock-limited load is achiev-able with DI because of charge cooling. For isooctane the increase in NMEP ranges from 100 to 200 kPa. For TSF99.8 and E20 the average NMEP difference is about 200 kPa at 50°C, but increases to 250 to 300 kPa at higher temperatures. For E40 the average NMEP increase for DI is over 400 kPa at 75 and 90°C IAT. Comparing the high-S fuels with isooctane, much higher loads are obtained at all IAT values, indicating the K in equation (1) is less than zero for all experiments reported in Figure 2. Finally, varying HOV had little effect on load in UI mode as the high-S fuels achieved approximately the same load at a given IAT.
The most significant observation from Figure 2 is the much higher NMEP achieved by E40 at 75°C (+125 kPa) and 90°C (+150 kPa) relative to E20 and TSF99.8. The E40 exhib-ited slightly higher S than the other fuels, however K is expected to become more positive as IAT increases suggesting that this effect should diminish. Significantly higher evapora-tive cooling of the intake charge would be expected for E40, but appears to have little effect at 50°C or lower IAT, consistent with the proposal that HOV is incorporated into S.
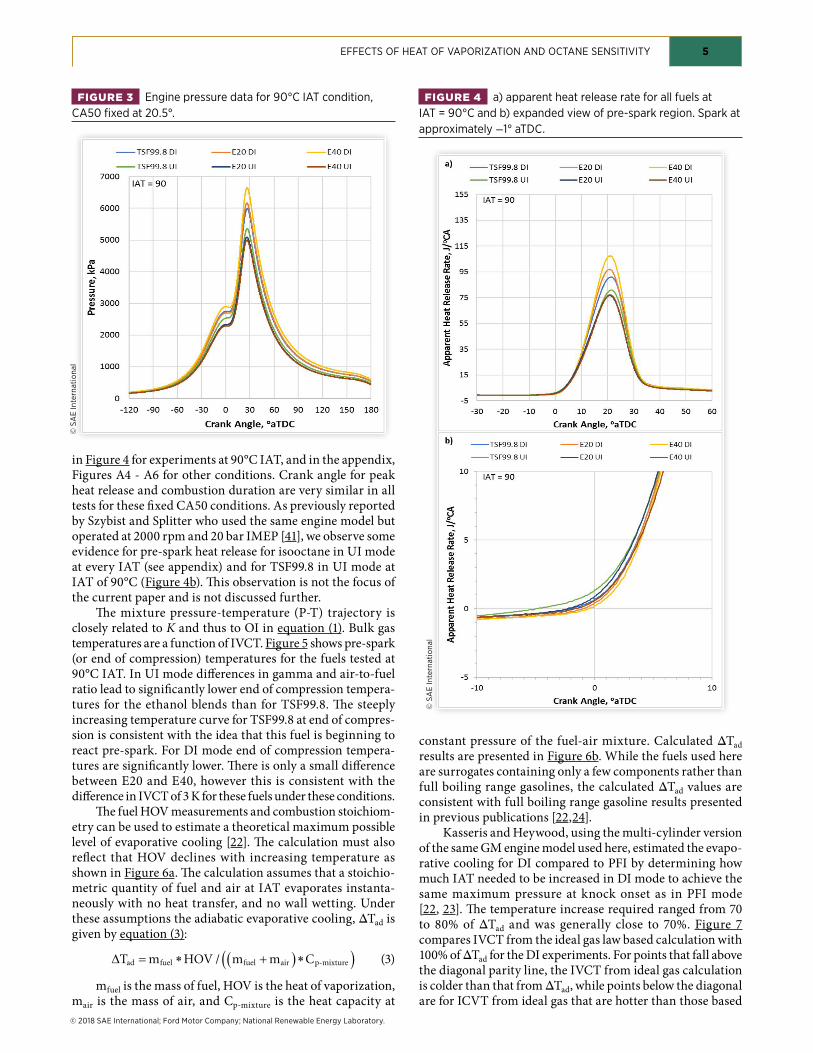
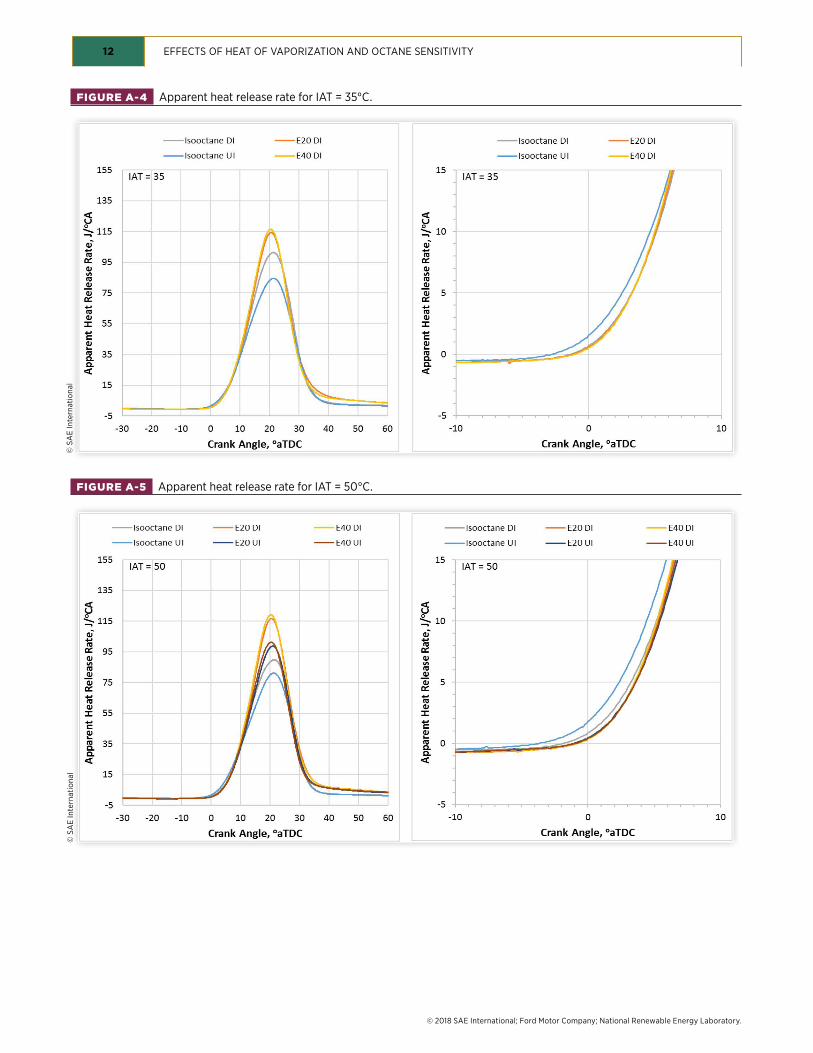
Combustion AnalysisCylinder pressure versus crank angle results for all experi-ments at 90°C IAT are shown in Figure 3. Results from other temperatures are shown in the appendix, Figures A1 - A3.Because CA50 is held constant, these plots are all very similar for a given IAT with almost identical crank angle for peak pressure, but show a decrease in pressure with reduced load. Apparent heat release rates versus crank angle are are shown
FIGURE 1 dI load sweeps versus CA50 combustion phasing at IAT = 50 °C and 1500 rpm. MBT combustion phasing was maintained up to the knock-limit (KI > 10), and then spark timing was retarded to maintain this value of KI as load was increased.
FIGURE 2 Results of IAT sweeps using both dI and UI modes at 1500 rpm and CA50 held constant at 20.5° aTdC. Knock limit defined as KI ≥ 7.8. Fuel HOV values shown are for25°C.
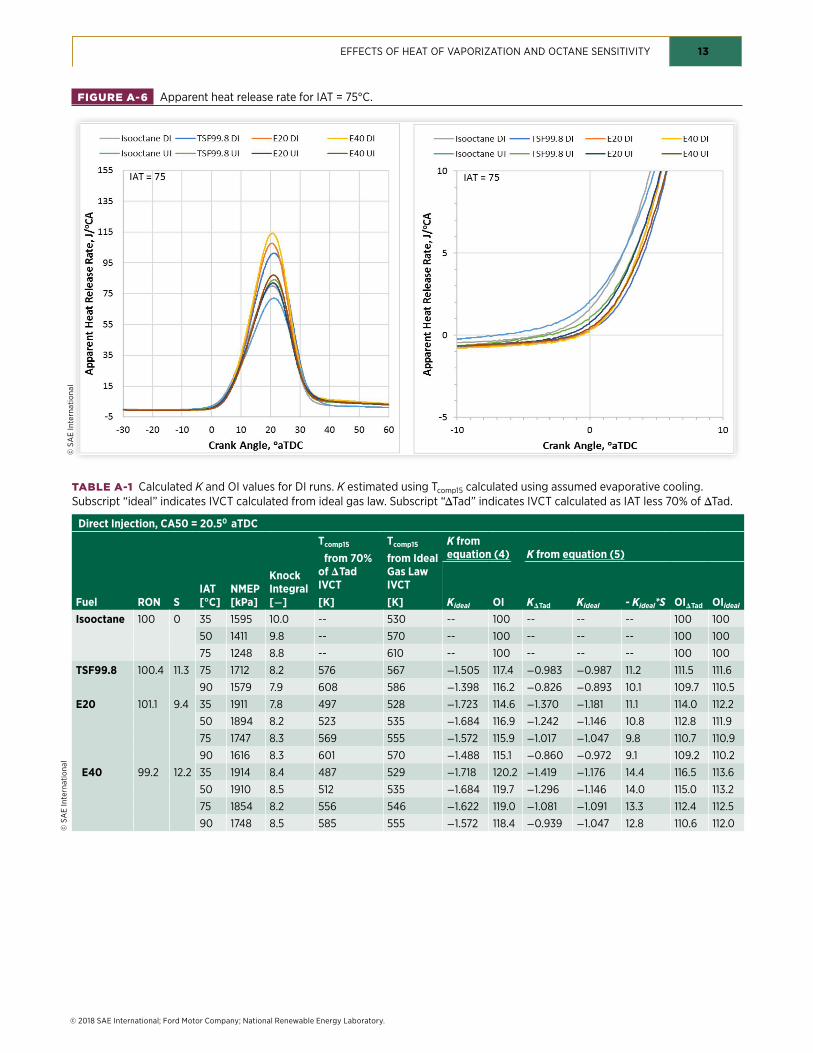
in Figure 4 for experiments at 90°C IAT, and in the appendix, Figures A4 - A6 for other conditions. Crank angle for peak heat release and combustion duration are very similar in all tests for these fixed CA50 conditions. As previously reported by Szybist and Splitter who used the same engine model but operated at 2000 rpm and 20 bar IMEP [41], we observe some evidence for pre-spark heat release for isooctane in UI mode at every IAT (see appendix) and for TSF99.8 in UI mode at IAT of 90°C (Figure 4b). This observation is not the focus of the current paper and is not discussed further.
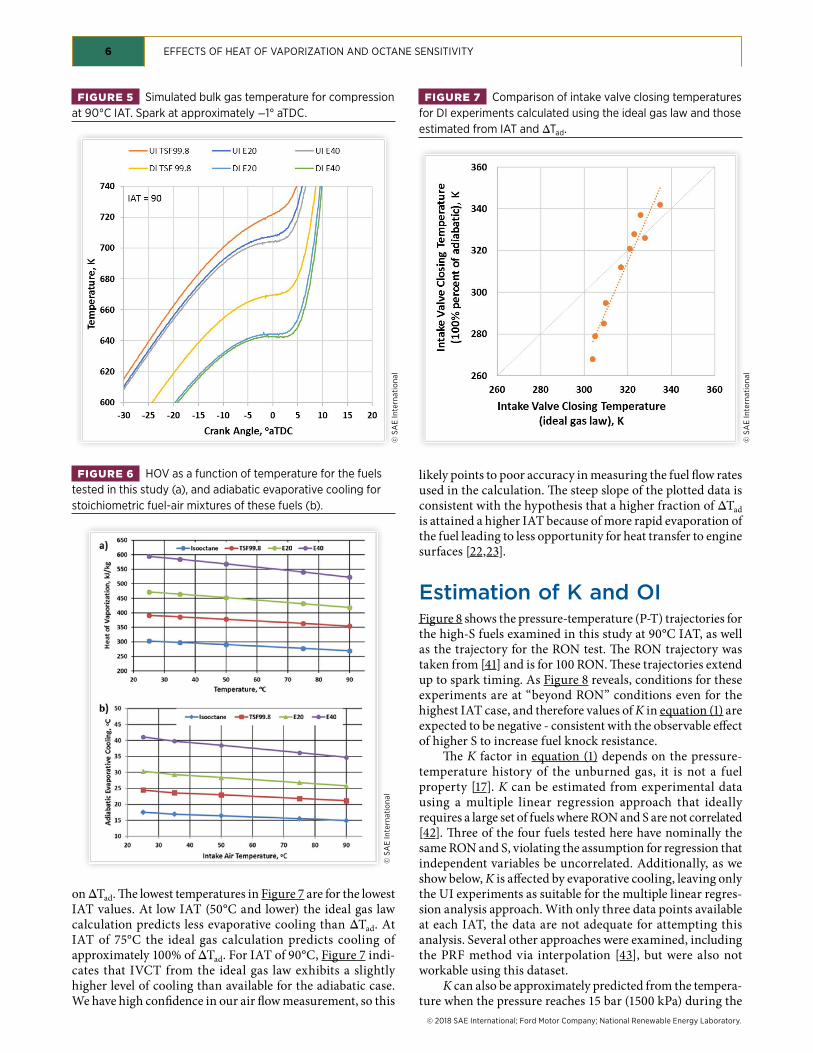
The mixture pressure-temperature (P-T) trajectory is closely related to K and thus to OI in equation (1). Bulk gas temperatures are a function of IVCT. Figure 5 shows pre-spark (or end of compression) temperatures for the fuels tested at 90°C IAT. In UI mode differences in gamma and air-to-fuel ratio lead to significantly lower end of compression tempera-tures for the ethanol blends than for TSF99.8. The steeply increasing temperature curve for TSF99.8 at end of compres-sion is consistent with the idea that this fuel is beginning to react pre-spark. For DI mode end of compression tempera-tures are significantly lower. There is only a small difference between E20 and E40, however this is consistent with the difference in IVCT of 3 K for these fuels under these conditions.
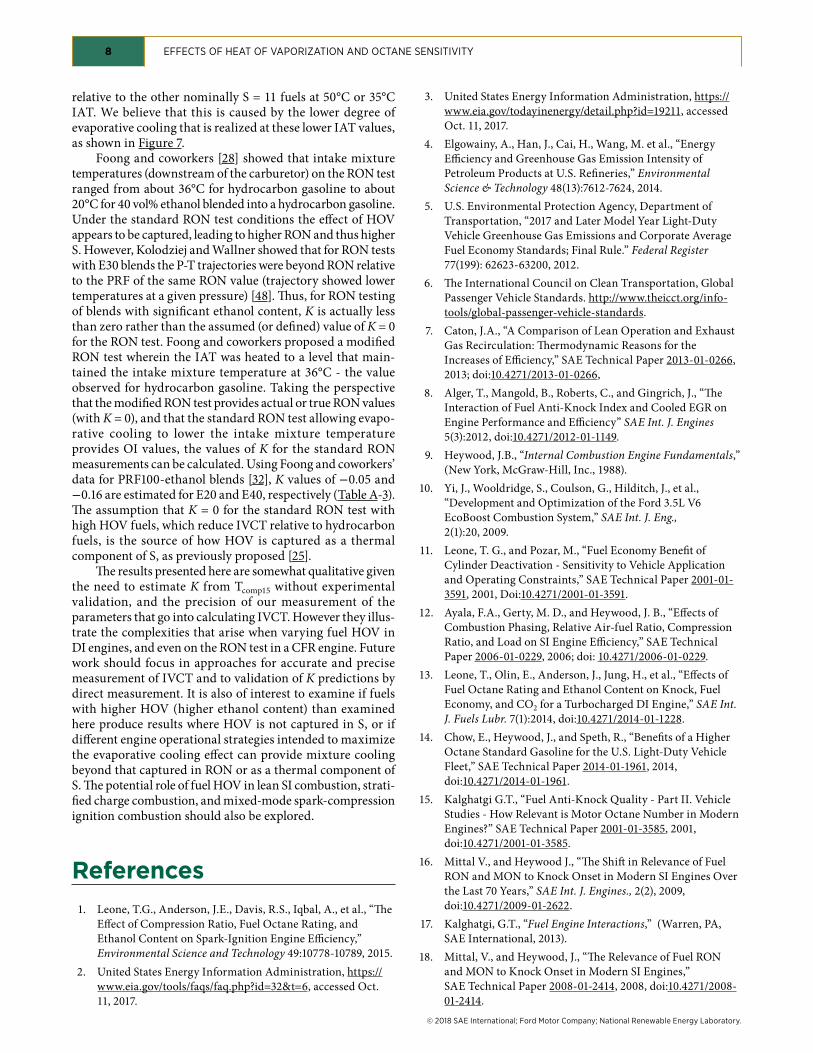
The fuel HOV measurements and combustion stoichiom-etry can be used to estimate a theoretical maximum possible level of evaporative cooling [22]. The calculation must also reflect that HOV declines with increasing temperature as shown in Figure 6a. The calculation assumes that a stoichio-metric quantity of fuel and air at IAT evaporates instanta-neously with no heat transfer, and no wall wetting. Under these assumptions the adiabatic evaporative cooling, ΔTad is given by equation (3):
DT m HOV m m Cad fuel fuel air p-mixture= * +( )*( )/ (3)
mfuel is the mass of fuel, HOV is the heat of vaporization, mair is the mass of air, and Cp-mixture is the heat capacity at
constant pressure of the fuel-air mixture. Calculated ΔTad results are presented in Figure 6b. While the fuels used here are surrogates containing only a few components rather than full boiling range gasolines, the calculated ΔTad values are consistent with full boiling range gasoline results presented in previous publications [22,24].
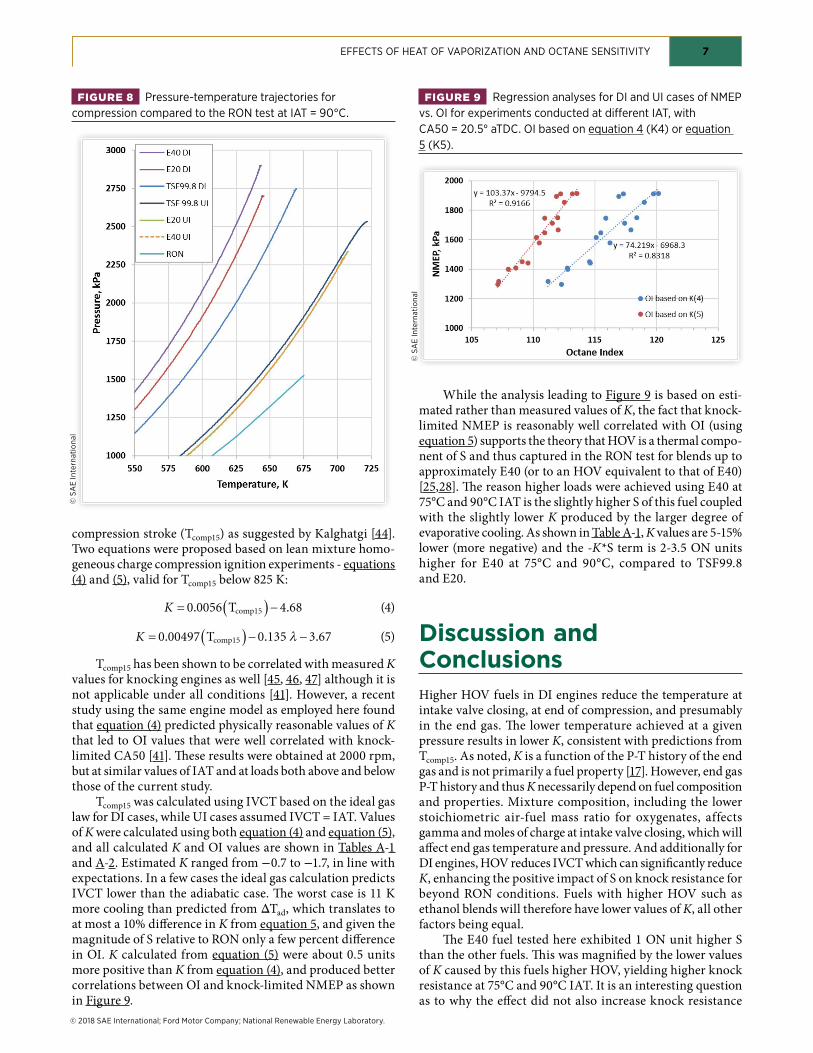
Kasseris and Heywood, using the multi-cylinder version of the same GM engine model used here, estimated the evapo-rative cooling for DI compared to PFI by determining how much IAT needed to be increased in DI mode to achieve the same maximum pressure at knock onset as in PFI mode [22, 23]. The temperature increase required ranged from 70 to 80% of ΔTad and was generally close to 70%. Figure 7 compares IVCT from the ideal gas law based calculation with 100% of ΔTad for the DI experiments. For points that fall above the diagonal parity line, the IVCT from ideal gas calculation is colder than that from ΔTad, while points below the diagonal are for ICVT from ideal gas that are hotter than those based
FIGURE 3 Engine pressure data for 90°C IAT condition, CA50 fixed at 20.5°.
on ΔTad. The lowest temperatures in Figure 7 are for the lowest IAT values. At low IAT (50°C and lower) the ideal gas law calculation predicts less evaporative cooling than ΔTad. At IAT of 75°C the ideal gas calculation predicts cooling of approximately 100% of ΔTad. For IAT of 90°C, Figure 7 indi-cates that IVCT from the ideal gas law exhibits a slightly higher level of cooling than available for the adiabatic case. We have high confidence in our air flow measurement, so this
likely points to poor accuracy in measuring the fuel flow rates used in the calculation. The steep slope of the plotted data is consistent with the hypothesis that a higher fraction of ΔTad is attained a higher IAT because of more rapid evaporation of the fuel leading to less opportunity for heat transfer to engine surfaces [22,23].
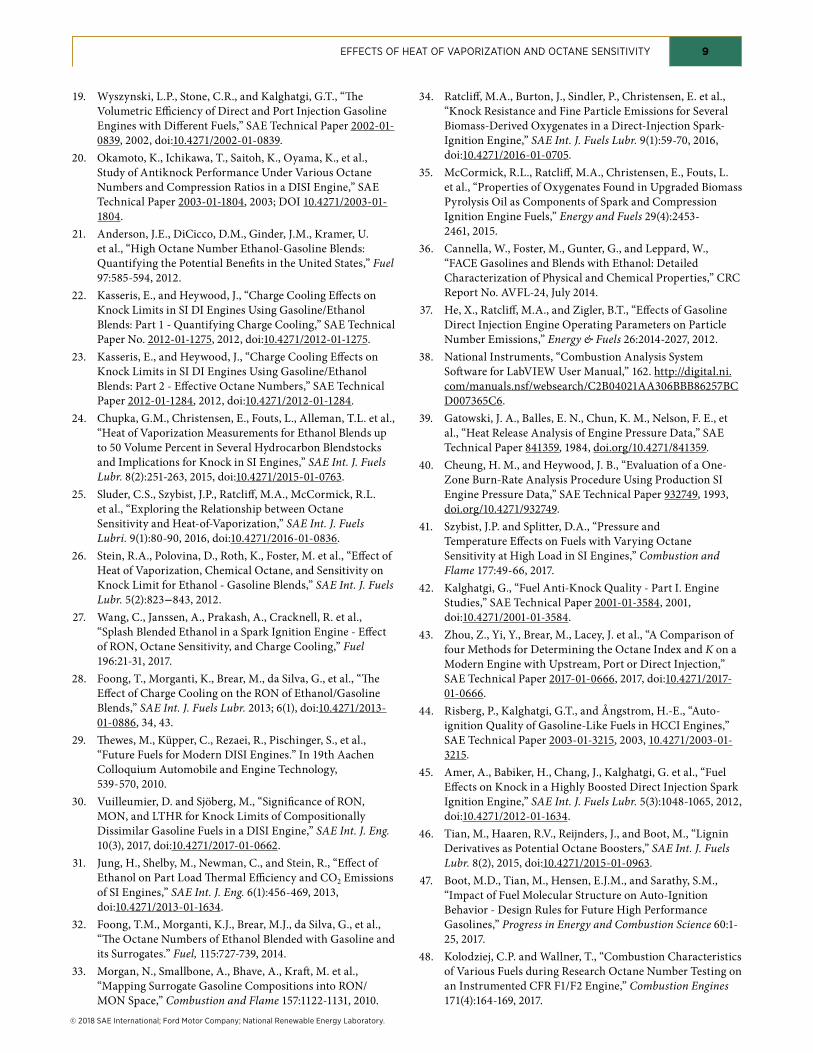
Estimation of K and OIFigure 8 shows the pressure-temperature (P-T) trajectories for the high-S fuels examined in this study at 90°C IAT, as well as the trajectory for the RON test. The RON trajectory was taken from [41] and is for 100 RON. These trajectories extend up to spark timing. As Figure 8 reveals, conditions for these experiments are at “beyond RON” conditions even for the highest IAT case, and therefore values of K in equation (1) are expected to be negative - consistent with the observable effect of higher S to increase fuel knock resistance.
The K factor in equation (1) depends on the pressure-temperature history of the unburned gas, it is not a fuel property [17]. K can be estimated from experimental data using a multiple linear regression approach that ideally requires a large set of fuels where RON and S are not correlated [42]. Three of the four fuels tested here have nominally the same RON and S, violating the assumption for regression that independent variables be uncorrelated. Additionally, as we show below, K is affected by evaporative cooling, leaving only the UI experiments as suitable for the multiple linear regres-sion analysis approach. With only three data points available at each IAT, the data are not adequate for attempting this analysis. Several other approaches were examined, including the PRF method via interpolation [43], but were also not workable using this dataset.
K can also be approximately predicted from the tempera-ture when the pressure reaches 15 bar (1500 kPa) during the
FIGURE 5 Simulated bulk gas temperature for compression at 90°C IAT. Spark at approximately −1° aTdC.
FIGURE 6 HOV as a function of temperature for the fuels tested in this study (a), and adiabatic evaporative cooling for stoichiometric fuel-air mixtures of these fuels (b).
compression stroke (Tcomp15) as suggested by Kalghatgi [44]. Two equations were proposed based on lean mixture homo-geneous charge compression ignition experiments - equations (4) and (5), valid for Tcomp15 below 825 K:
K = ( ) -0 0056 4 68. .Tcomp15 (4)
K = ( ) - -0 00497 0 135 3 67. . .Tcomp15 l (5)
Tcomp15 has been shown to be correlated with measured K values for knocking engines as well [45, 46, 47] although it is not applicable under all conditions [41]. However, a recent study using the same engine model as employed here found that equation (4) predicted physically reasonable values of K that led to OI values that were well correlated with knock-limited CA50 [41]. These results were obtained at 2000 rpm, but at similar values of IAT and at loads both above and below those of the current study.
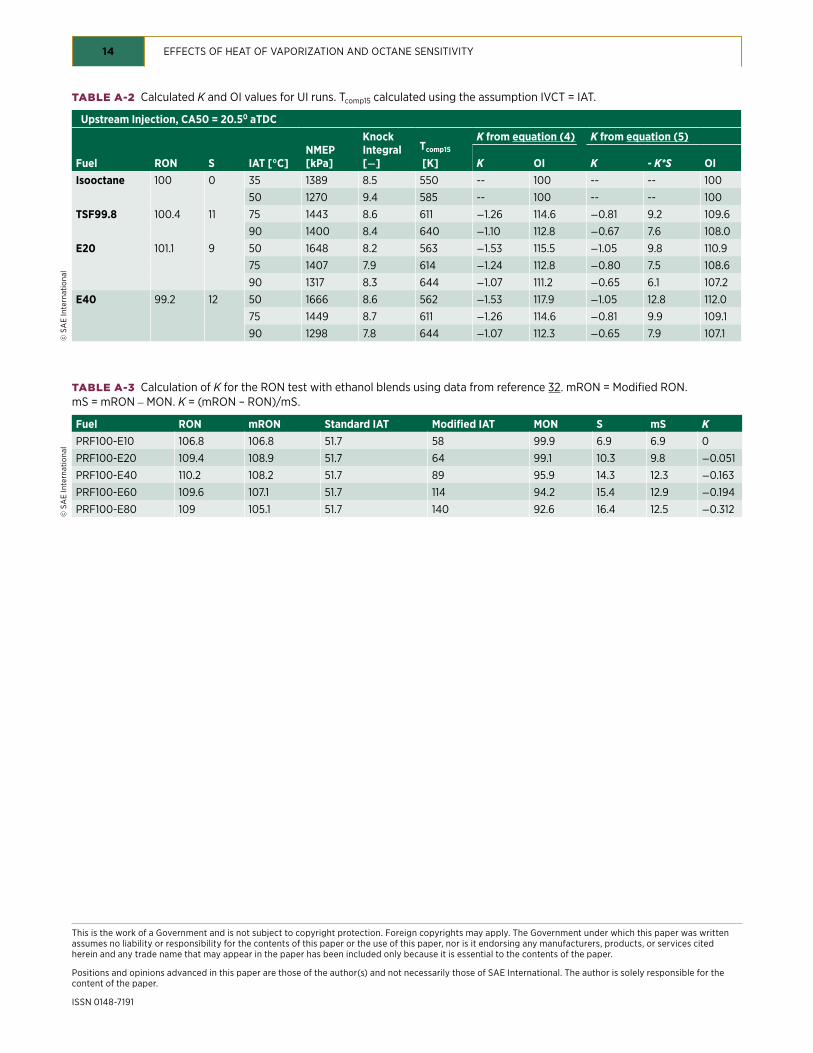
Tcomp15 was calculated using IVCT based on the ideal gas law for DI cases, while UI cases assumed IVCT = IAT. Values of K were calculated using both equation (4) and equation (5), and all calculated K and OI values are shown in Tables A-1 and A-2. Estimated K ranged from −0.7 to −1.7, in line with expectations. In a few cases the ideal gas calculation predicts IVCT lower than the adiabatic case. The worst case is 11 K more cooling than predicted from ΔTad, which translates to at most a 10% difference in K from equation 5, and given the magnitude of S relative to RON only a few percent difference in OI. K calculated from equation (5) were about 0.5 units more positive than K from equation (4), and produced better correlations between OI and knock-limited NMEP as shown in Figure 9.
While the analysis leading to Figure 9 is based on esti-mated rather than measured values of K, the fact that knock-limited NMEP is reasonably well correlated with OI (using equation 5) supports the theory that HOV is a thermal compo-nent of S and thus captured in the RON test for blends up to approximately E40 (or to an HOV equivalent to that of E40) [25,28]. The reason higher loads were achieved using E40 at 75°C and 90°C IAT is the slightly higher S of this fuel coupled with the slightly lower K produced by the larger degree of evaporative cooling. As shown in Table A-1, K values are 5-15% lower (more negative) and the -K*S term is 2-3.5 ON units higher for E40 at 75°C and 90°C, compared to TSF99.8 and E20.
Discussion and ConclusionsHigher HOV fuels in DI engines reduce the temperature at intake valve closing, at end of compression, and presumably in the end gas. The lower temperature achieved at a given pressure results in lower K, consistent with predictions from Tcomp15. As noted, K is a function of the P-T history of the end gas and is not primarily a fuel property [17]. However, end gas P-T history and thus K necessarily depend on fuel composition and properties. Mixture composition, including the lower stoichiometric air-fuel mass ratio for oxygenates, affects gamma and moles of charge at intake valve closing, which will affect end gas temperature and pressure. And additionally for DI engines, HOV reduces IVCT which can significantly reduce K, enhancing the positive impact of S on knock resistance for beyond RON conditions. Fuels with higher HOV such as ethanol blends will therefore have lower values of K, all other factors being equal.
The E40 fuel tested here exhibited 1 ON unit higher S than the other fuels. This was magnified by the lower values of K caused by this fuels higher HOV, yielding higher knock resistance at 75°C and 90°C IAT. It is an interesting question as to why the effect did not also increase knock resistance
FIGURE 8 Pressure-temperature trajectories for compression compared to the RON test at IAT = 90°C.
FIGURE 9 Regression analyses for dI and UI cases of NMEP vs. OI for experiments conducted at different IAT, with CA50 = 20.5° aTdC. OI based on equation 4 (K4) or equation 5 (K5).
relative to the other nominally S = 11 fuels at 50°C or 35°C IAT. We believe that this is caused by the lower degree of evaporative cooling that is realized at these lower IAT values, as shown in Figure 7.
Foong and coworkers [28] showed that intake mixture temperatures (downstream of the carburetor) on the RON test ranged from about 36°C for hydrocarbon gasoline to about 20°C for 40 vol% ethanol blended into a hydrocarbon gasoline. Under the standard RON test conditions the effect of HOV appears to be captured, leading to higher RON and thus higher S. However, Kolodziej and Wallner showed that for RON tests with E30 blends the P-T trajectories were beyond RON relative to the PRF of the same RON value (trajectory showed lowertemperatures at a given pressure) [48]. Thus, for RON testingof blends with significant ethanol content, K is actually lessthan zero rather than the assumed (or defined) value of K = 0for the RON test. Foong and coworkers proposed a modifiedRON test wherein the IAT was heated to a level that main-tained the intake mixture temperature at 36°C - the valueobserved for hydrocarbon gasoline. Taking the perspectivethat the modified RON test provides actual or true RON values (with K = 0), and that the standard RON test allowing evapo-rative cooling to lower the intake mixture temperatureprovides OI values, the values of K for the standard RONmeasurements can be calculated. Using Foong and coworkers’ data for PRF100-ethanol blends [32], K values of −0.05 and−0.16 are estimated for E20 and E40, respectively (Table A-3).The assumption that K = 0 for the standard RON test withhigh HOV fuels, which reduce IVCT relative to hydrocarbonfuels, is the source of how HOV is captured as a thermalcomponent of S, as previously proposed [25].
The results presented here are somewhat qualitative given the need to estimate K from Tcomp15 without experimental validation, and the precision of our measurement of the parameters that go into calculating IVCT. However they illus-trate the complexities that arise when varying fuel HOV in DI engines, and even on the RON test in a CFR engine. Future work should focus in approaches for accurate and precise measurement of IVCT and to validation of K predictions by direct measurement. It is also of interest to examine if fuels with higher HOV (higher ethanol content) than examined here produce results where HOV is not captured in S, or if different engine operational strategies intended to maximize the evaporative cooling effect can provide mixture cooling beyond that captured in RON or as a thermal component of S. The potential role of fuel HOV in lean SI combustion, strati-fied charge combustion, and mixed-mode spark-compression ignition combustion should also be explored.
References1. Leone, T.G., Anderson, J.E., Davis, R.S., Iqbal, A., et al., “The
Effect of Compression Ratio, Fuel Octane Rating, andEthanol Content on Spark-Ignition Engine Efficiency,”Environmental Science and Technology 49:10778-10789, 2015.
2. United States Energy Information Administration, https://www.eia.gov/tools/faqs/faq.php?id=32&t=6, accessed Oct.11, 2017.
3. United States Energy Information Administration, https://www.eia.gov/todayinenergy/detail.php?id=19211, accessedOct. 11, 2017.
4. Elgowainy, A., Han, J., Cai, H., Wang, M. et al., “EnergyEfficiency and Greenhouse Gas Emission Intensity ofPetroleum Products at U.S. Refineries,” EnvironmentalScience & Technology 48(13):7612-7624, 2014.
5. U.S. Environmental Protection Agency, Department ofTransportation, “2017 and Later Model Year Light-DutyVehicle Greenhouse Gas Emissions and Corporate AverageFuel Economy Standards; Final Rule.” Federal Register77(199): 62623-63200, 2012.
6. The International Council on Clean Transportation, GlobalPassenger Vehicle Standards. http://www.theicct.org/info-tools/global-passenger-vehicle-standards.
7. Caton, J.A., “A Comparison of Lean Operation and ExhaustGas Recirculation: Thermodynamic Reasons for theIncreases of Efficiency,” SAE Technical Paper 2013-01-0266,2013; doi:10.4271/2013-01-0266,
8. Alger, T., Mangold, B., Roberts, C., and Gingrich, J., “TheInteraction of Fuel Anti-Knock Index and Cooled EGR onEngine Performance and Efficiency” SAE Int. J. Engines5(3):2012, doi:10.4271/2012-01-1149.
10. Yi, J., Wooldridge, S., Coulson, G., Hilditch, J., et al.,“Development and Optimization of the Ford 3.5L V6EcoBoost Combustion System,” SAE Int. J. Eng.,2(1):20, 2009.
11. Leone, T. G., and Pozar, M., “Fuel Economy Benefit ofCylinder Deactivation - Sensitivity to Vehicle Applicationand Operating Constraints,” SAE Technical Paper 2001-01-3591, 2001, Doi:10.4271/2001-01-3591.
12. Ayala, F.A., Gerty, M. D., and Heywood, J. B., “Effects ofCombustion Phasing, Relative Air-fuel Ratio, CompressionRatio, and Load on SI Engine Efficiency,” SAE TechnicalPaper 2006-01-0229, 2006; doi: 10.4271/2006-01-0229.
13. Leone, T., Olin, E., Anderson, J., Jung, H., et al., “Effects ofFuel Octane Rating and Ethanol Content on Knock, FuelEconomy, and CO2 for a Turbocharged DI Engine,” SAE Int.J. Fuels Lubr. 7(1):2014, doi:10.4271/2014-01-1228.
14. Chow, E., Heywood, J., and Speth, R., “Benefits of a HigherOctane Standard Gasoline for the U.S. Light-Duty VehicleFleet,” SAE Technical Paper 2014-01-1961, 2014,doi:10.4271/2014-01-1961.
15. Kalghatgi G.T., “Fuel Anti-Knock Quality - Part II. VehicleStudies - How Relevant is Motor Octane Number in ModernEngines?” SAE Technical Paper 2001-01-3585, 2001,doi:10.4271/2001-01-3585.
16. Mittal V., and Heywood J., “The Shift in Relevance of FuelRON and MON to Knock Onset in Modern SI Engines Overthe Last 70 Years,” SAE Int. J. Engines., 2(2), 2009,doi:10.4271/2009-01-2622.
18. Mittal, V., and Heywood, J., “The Relevance of Fuel RONand MON to Knock Onset in Modern SI Engines,”SAE Technical Paper 2008-01-2414, 2008, doi:10.4271/2008-01-2414.
19. Wyszynski, L.P., Stone, C.R., and Kalghatgi, G.T., “TheVolumetric Efficiency of Direct and Port Injection GasolineEngines with Different Fuels,” SAE Technical Paper 2002-01-0839, 2002, doi:10.4271/2002-01-0839.
20. Okamoto, K., Ichikawa, T., Saitoh, K., Oyama, K., et al.,Study of Antiknock Performance Under Various OctaneNumbers and Compression Ratios in a DISI Engine,” SAETechnical Paper 2003-01-1804, 2003; DOI 10.4271/2003-01-1804.
21. Anderson, J.E., DiCicco, D.M., Ginder, J.M., Kramer, U.et al., “High Octane Number Ethanol-Gasoline Blends:Quantifying the Potential Benefits in the United States,” Fuel97:585-594, 2012.
22. Kasseris, E., and Heywood, J., “Charge Cooling Effects onKnock Limits in SI DI Engines Using Gasoline/EthanolBlends: Part 1 - Quantifying Charge Cooling,” SAE TechnicalPaper No. 2012-01-1275, 2012, doi:10.4271/2012-01-1275.
23. Kasseris, E., and Heywood, J., “Charge Cooling Effects onKnock Limits in SI DI Engines Using Gasoline/EthanolBlends: Part 2 - Effective Octane Numbers,” SAE TechnicalPaper 2012-01-1284, 2012, doi:10.4271/2012-01-1284.
24. Chupka, G.M., Christensen, E., Fouts, L., Alleman, T.L. et al.,“Heat of Vaporization Measurements for Ethanol Blends upto 50 Volume Percent in Several Hydrocarbon Blendstocksand Implications for Knock in SI Engines,” SAE Int. J. FuelsLubr. 8(2):251-263, 2015, doi:10.4271/2015-01-0763.
25. Sluder, C.S., Szybist, J.P., Ratcliff, M.A., McCormick, R.L.et al., “Exploring the Relationship between OctaneSensitivity and Heat-of-Vaporization,” SAE Int. J. FuelsLubri. 9(1):80-90, 2016, doi:10.4271/2016-01-0836.
26. Stein, R.A., Polovina, D., Roth, K., Foster, M. et al., “Effect ofHeat of Vaporization, Chemical Octane, and Sensitivity onKnock Limit for Ethanol - Gasoline Blends,” SAE Int. J. FuelsLubr. 5(2):823−843, 2012.
27. Wang, C., Janssen, A., Prakash, A., Cracknell, R. et al.,“Splash Blended Ethanol in a Spark Ignition Engine - Effectof RON, Octane Sensitivity, and Charge Cooling,” Fuel196:21-31, 2017.
28. Foong, T., Morganti, K., Brear, M., da Silva, G., et al., “TheEffect of Charge Cooling on the RON of Ethanol/GasolineBlends,” SAE Int. J. Fuels Lubr. 2013; 6(1), doi:10.4271/2013-01-0886, 34, 43.
29. Thewes, M., Küpper, C., Rezaei, R., Pischinger, S., et al.,“Future Fuels for Modern DISI Engines.” In 19th AachenColloquium Automobile and Engine Technology,539- 570, 2010.
30. Vuilleumier, D. and Sjöberg, M., “Significance of RON,MON, and LTHR for Knock Limits of CompositionallyDissimilar Gasoline Fuels in a DISI Engine,” SAE Int. J. Eng.10(3), 2017, doi:10.4271/2017-01-0662.
31. Jung, H., Shelby, M., Newman, C., and Stein, R., “Effect ofEthanol on Part Load Thermal Efficiency and CO2 Emissionsof SI Engines,” SAE Int. J. Eng. 6(1):456-469, 2013,doi:10.4271/2013-01-1634.
32. Foong, T.M., Morganti, K.J., Brear, M.J., da Silva, G., et al.,“The Octane Numbers of Ethanol Blended with Gasoline andits Surrogates.” Fuel, 115:727-739, 2014.
33. Morgan, N., Smallbone, A., Bhave, A., Kraft, M. et al.,“Mapping Surrogate Gasoline Compositions into RON/MON Space,” Combustion and Flame 157:1122-1131, 2010.
34. Ratcliff, M.A., Burton, J., Sindler, P., Christensen, E. et al.,“Knock Resistance and Fine Particle Emissions for SeveralBiomass-Derived Oxygenates in a Direct-Injection Spark-Ignition Engine,” SAE Int. J. Fuels Lubr. 9(1):59-70, 2016,doi:10.4271/2016-01-0705.
35. McCormick, R.L., Ratcliff, M.A., Christensen, E., Fouts, L.et al., “Properties of Oxygenates Found in Upgraded BiomassPyrolysis Oil as Components of Spark and CompressionIgnition Engine Fuels,” Energy and Fuels 29(4):2453-2461, 2015.
36. Cannella, W., Foster, M., Gunter, G., and Leppard, W.,“FACE Gasolines and Blends with Ethanol: DetailedCharacterization of Physical and Chemical Properties,” CRCReport No. AVFL-24, July 2014.
37. He, X., Ratcliff, M.A., and Zigler, B.T., “Effects of GasolineDirect Injection Engine Operating Parameters on ParticleNumber Emissions,” Energy & Fuels 26:2014-2027, 2012.
38. National Instruments, “Combustion Analysis SystemSoftware for LabVIEW User Manual,” 162. http://digital.ni.com/manuals.nsf/websearch/C2B04021AA306BBB86257BCD007365C6.
39. Gatowski, J. A., Balles, E. N., Chun, K. M., Nelson, F. E., etal., “Heat Release Analysis of Engine Pressure Data,” SAETechnical Paper 841359, 1984, doi.org/10.4271/841359.
40. Cheung, H. M., and Heywood, J. B., “Evaluation of a One-Zone Burn-Rate Analysis Procedure Using Production SIEngine Pressure Data,” SAE Technical Paper 932749, 1993,doi.org/10.4271/932749.
41. Szybist, J.P. and Splitter, D.A., “Pressure andTemperature Effects on Fuels with Varying OctaneSensitivity at High Load in SI Engines,” Combustion andFlame 177:49-66, 2017.
42. Kalghatgi, G., “Fuel Anti-Knock Quality - Part I. EngineStudies,” SAE Technical Paper 2001-01-3584, 2001,doi:10.4271/2001-01-3584.
43. Zhou, Z., Yi, Y., Brear, M., Lacey, J. et al., “A Comparison offour Methods for Determining the Octane Index and K on aModern Engine with Upstream, Port or Direct Injection,”SAE Technical Paper 2017-01-0666, 2017, doi:10.4271/2017-01-0666.
44. Risberg, P., Kalghatgi, G.T., and Ångstrom, H.-E., “Auto-ignition Quality of Gasoline-Like Fuels in HCCI Engines,”SAE Technical Paper 2003-01-3215, 2003, 10.4271/2003-01-3215.
45. Amer, A., Babiker, H., Chang, J., Kalghatgi, G. et al., “FuelEffects on Knock in a Highly Boosted Direct Injection SparkIgnition Engine,” SAE Int. J. Fuels Lubr. 5(3):1048-1065, 2012,doi:10.4271/2012-01-1634.
46. Tian, M., Haaren, R.V., Reijnders, J., and Boot, M., “LigninDerivatives as Potential Octane Boosters,” SAE Int. J. FuelsLubr. 8(2), 2015, doi:10.4271/2015-01-0963.
47. Boot, M.D., Tian, M., Hensen, E.J.M., and Sarathy, S.M.,“Impact of Fuel Molecular Structure on Auto-IgnitionBehavior - Design Rules for Future High PerformanceGasolines,” Progress in Energy and Combustion Science 60:1-25, 2017.
48. Kolodziej, C.P. and Wallner, T., “Combustion Characteristicsof Various Fuels during Research Octane Number Testing onan Instrumented CFR F1/F2 Engine,” Combustion Engines171(4):164-169, 2017.
AcknowledgmentsThis research was conducted as part of the Co-Optimization of Fuels & Engines (Co-Optima) project sponsored by the U.S. Department of Energy - Office of Energy Efficiency and Renewable Energy, Bioenergy Technologies and Vehicle Technologies Offices. Co-Optima is a collaborative project of several national laboratories initiated to simultaneously accelerate the introduction of affordable, scalable, and sustainable biofuels and high-efficiency, low-emission vehicle engines. The authors gratefully acknowledge the contribu-tions to the combustion analysis by Brandon King from Colorado State University. Work at the National Renewable Energy Laboratory was performed under Contract No. DE347AC36-99GO10337. The U.S. Government retains and the publisher, by accepting the article for publication, acknowledges that the U.S. Government retains a nonexclu-sive, paid-up, irrevocable, worldwide license to publish or reproduce the published form of this work, or allow others to do so, for U.S. Government purposes.
Definitions/AbbreviationsΔTad - adiabatic evaporative cooling temperatureaTDC - after top dead centerBOB - blendstock for oxygenate blendingCA50 - crank angle for 50% mass fraction burnedCFR - Cooperative Fuels Research
Cpmixture - heat capacity at constant pressure of the fuel-air mixtureCR - compression ratioDI - direct injectionFACE - Fuels for Advanced Combustion EnginesHOV - heat of vaporization, kJ/kgIAT - intake air temperatureIMEP - indicated mean effective pressureIVCT - intake valve closing temperatureK - empirical constant in octane index equationKI - integrated knock, or knock-integralmair - mass of airmfuel - mass of fuelMBT - minimum advance for best torqueMON - motor octane numberNMEP - net mean effective pressureOI - octane indexPFI - port fuel injectionP-T - pressure-temperatureRON - research octane numberS - octane sensitivity (RON - MON)SI - spark-ignitionTcomp15 - temperature when the pressure reaches 15 bar during the compression strokeTRF - toluene research fuelTSF - toluene standardization fuelUI - upstream fuel injectionvol% - percent by volume
TABLE A-1 Calculated K and OI values for dI runs. K estimated using Tcomp15 calculated using assumed evaporative cooling. Subscript “ideal” indicates IVCT calculated from ideal gas law. Subscript “ΔTad” indicates IVCT calculated as IAT less 70% of ΔTad.
TABLE A-3 Calculation of K for the RON test with ethanol blends using data from reference 32. mRON = Modified RON. mS = mRON – MON. K = (mRON – RON)/mS.
Fuel RON mRON Standard IAT Modified IAT MON S mS KPRF100-E10 106.8 106.8 51.7 58 99.9 6.9 6.9 0
This is the work of a Government and is not subject to copyright protection. Foreign copyrights may apply. The Government under which this paper was written assumes no liability or responsibility for the contents of this paper or the use of this paper, nor is it endorsing any manufacturers, products, or services cited herein and any trade name that may appear in the paper has been included only because it is essential to the contents of the paper.
Positions and opinions advanced in this paper are those of the author(s) and not necessarily those of SAE International. The author is solely responsible for the content of the paper.