Page 1
PROCEEDINGS, 42nd Workshop on Geothermal Reservoir Engineering
Stanford University, Stanford, California, February 13-15, 2017
SGP-TR-212
1
Effects of Hydrothermal Alteration on Petrophysics and Geochemical Mobility of Reservoir
Rocks In Olkaria Northeast Geothermal Field, Kenya
Michael Mwania
P.O Box 785- 20117, Naivasha
[email protected] or [email protected]
Keywords: petrophysical, chemical mobility, geometry, hydrothermal metamorphism, facies
ABSTRACT
Reservoir rock characterization for any geothermal field under both exploitation and exploration provide rationale for further utilization
programs. The Olkaria reservoir rocks within the Northeast production field (NEPF) are largely typified by trachytes and rhyolitic
intercalation. In attempt to characterise the reservoir geometry under the influence of hydrothermal alteration three wells; OW-706,
OW-717 and OW-725 located in the NEPF are studied. The key petrophysical parameters studied include; porosity, relative
permeability and lithological characteristics under influence of hydrothermal metamorphism. Effects of hydrothermal alteration on
geochemical mobility were also evaluated selected elements mainly on bulk chemistry (K2O, Al2O3, CaO, FeO SiO2 etc.) and trace
elements (Nb, Y, Rb, Zr, Ba, etc) dispersion through empirical comparisons between the protolith samples and subsurface samples. The
former are considered relatively fresh and perhaps least affected by hydrothermal alteration while the latter are assumed to have
undergone some changes due to the effects of hydrothermal alteration. The findings of this research reveal that, the reservoir rocks
(trachytes and rhyolites) lack primary porosity and permeability is mainly controlled by the secondary porosity. The broad mechanism
controlling porosity and permeability distribution include; dissolution, deposition and replacement. These mechanisms has direct
bearing on elemental transfers where K2O and Al2O3 show significant depletion trends from protolith samples while CaO and FeO show
enrichment of subsurface samples. On trace elements, there are no major shifts, however positive correlation of Nb, Y and Rb against Zr
suggest possible enrichment. Based on the findings, the research concludes that, variability of petrophysical properties have direct
bearing on mobility of chemical elements. In addition, the reservoir geometry from study wells is well enhanced along the NW-SE fault
and less propagated to the eastern periphery of the field. The effect is largely attributed to major structural controls which augments the
vertical permeability within the field sector. For optimal management of exploration programs, future production drilling should aim at
targeting the NW-SE fault inferred to be the possible upwelling zone and where the reservoir geometry appear well developed.
Correspondingly, re-injection wells should be sited to the eastern periphery of the field adjacent to the Gorge farm fault which
seemingly channels cooler fluids and equally considered to be a possible recharge zone at shallow depth.
1. INTRODUCTION
The Greater Olkaria Volcanic Complex is located approximately located approximately 120 km northwest of Nairobi City and south of
Lake Naivasha within the eastern branch of East African Rift System (EARS). The Kenya rift is the segment that extends from Lake
Turkana to northern Tanzania and is characterised by several geothermal prospects and some young Quaternary volcanoes along its axis
(Omenda, 2007). According to Omenda (2007), the estimated potential that can be generated from these geothermal systems in Kenya is
over 7,000 MWe which is considered sufficient enough to cater for the energy demands in the country. Out of the seventeen (17)
geothermal prospects occurring within the Kenya rift, only three have proven geothermal potential after successful drilling; Olkaria,
Eburru and Menengai fields. The Greater Olkaria Volcanic Complex (GOVC) is bordered to the North by Eburru massif and to the East
and South by Longonot and Suswa volcanoes respectively.
For ease of exploration and management of field, GOVC is divided into seven distinct field sectors; Olkaria Northwest, West, Central,
Northeast, East, Southeast and Olkaria Domes field (Figure 1). These field sectors are under intense exploration and utilisation for
geothermal sourced energy. However for the purpose of this research, focus is exerted on the Northeast field sector in attempt to unravel
the reservoir geometry.
1.1 Overview of exploration history
Exploration for geothermal resources within the Greater Olkaria Volcanic Complex (GOVC) dates back to late 1950’s when the first
two exploration wells (X1 and X2) were drilled. Well OW-X1 was drilled to 502 m and OW-X2 to 942 m below ground level (m bgl)
(Ofwona, 2002). Subsequent exploration activities continued which led to deep drilling in 1973 and feasibility studies that saw the
development of Olkaria 1 power plant in 1981. Further drilling and exploration continued within the GOVC and to date over 600 MWe
are currently generated from five power plants and well-head units (modular power plants). Four of these power plants (Olkaria I,
Olkaria IAU, Olkaria II and Olkaria IV) and well head units are operated by KenGen while Olkaria III is operated by independent
power company (OrPower4 Ltd). Other new power plants are still in pipeline, though construction for Olkaria V is due for commission
soon (early 2017). To present, over 285 geothermal wells have been drilled within the GOVC, however, for the purpose of this study,
three wells; OW-706, OW-717 and OW-725 located in Olkaria Northeast field will be considered in attempt to delineate the reservoir
geometry (Figure-1).
Page 2
Mwania
2
Figure 1: The Olkaria geothermal resource map showing geothermal sectors and the three study wells; OW-706, OW-717 and
OW-725 located in Northeast field
1.2 Background of research and objectives
Development of geothermal resource for electricity generation require estimate of resource and its uncertainty. Of the paramount
important parameters that have to be determined in order to ascertain the viability of any geothermal resource include; permeability,
heat, recharge and characteristic cap-rock, hydrothermal alteration and metamorphism, and clues on chemical mobility during fluid-flux
mechanisms.
In spite of Olkaria geothermal field being subject to extensive exploration and exploitation activities over time, previous studies have
been geared towards unfolding the geology and stratigraphy of the area, structural setting, reservoir rock types and hydrothermal
alteration characteristics. This has feasibly created paucity of information regarding reservoir rock characterisation in terms of
petrophysical properties and geochemical mobility relative to hydrothermal alteration patterns, yet is a requisite aspect when evaluating
changes in the reservoir morphology. To expend this proposition adequately, it is necessary to delineate the reservoir geometry from
wells with similar petrogenetic provenance and thereby establish a rationale for further exploration programs to the peripheral areas.
1.2.1 Objective of the study
The aim of this research is to evaluate the effects of hydrothermal alteration on petrophysics and geochemical mobility of reservoir
rocks mainly trachytes and rhyolitic intercalations, and develop reservoir facies model for Olkaria Northeast field. To achieve this,
three wells; OW-706, OW-717 and OW-725, with similar petrogenetic provenance were studied
Page 3
Mwania
3
2. GEOLOGY AND STRUCTURAL SETTING OF GOVC
The Olkaria geothermal field is located in a complex of Pliocene to Recent acidic of alkali volcanic centres to the southwest end of Lake
Naivasha. Except for Longonot volcano and Crater Lake, these centres are associated with a NNW – trending belt of volcanism and
substantial faulting, along the western rift valley (Leach and Muchemi, 1987). OVC is characterised by numerous volcanic centres of
Quaternary age and is one of the areas within the Kenya rift with occurrences of comendite on the surface (Lagat, 2004b; Leach and
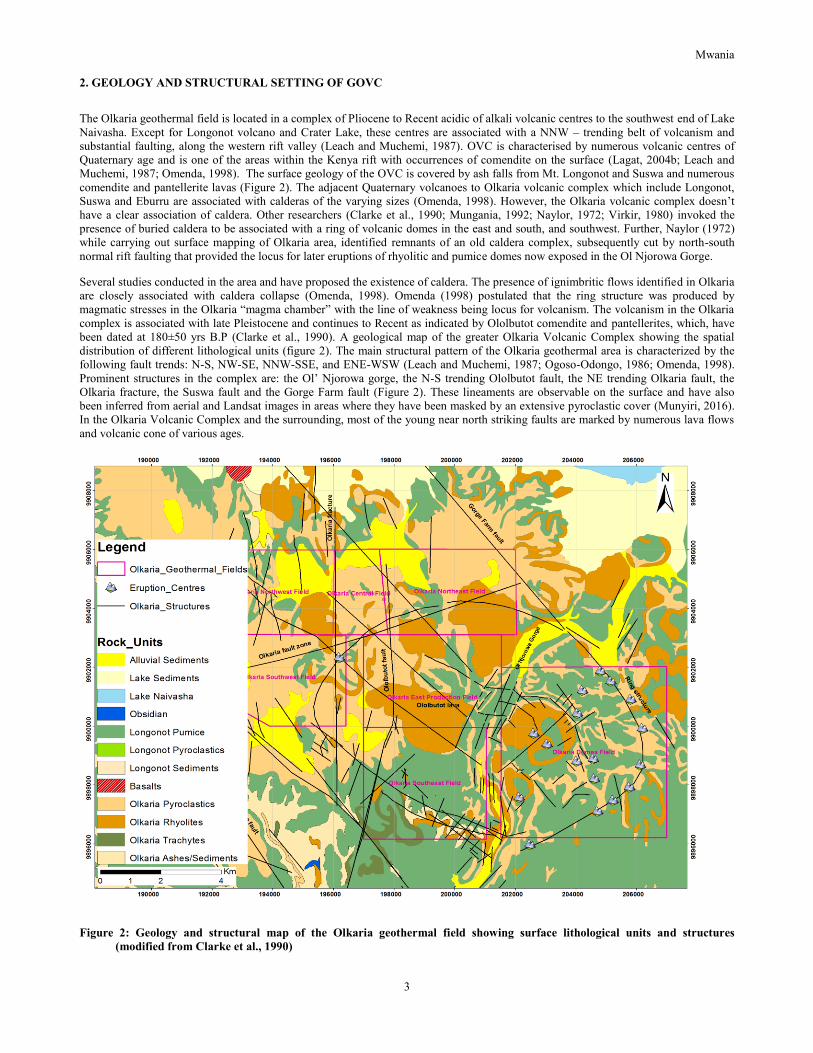
Muchemi, 1987; Omenda, 1998). The surface geology of the OVC is covered by ash falls from Mt. Longonot and Suswa and numerous
comendite and pantellerite lavas (Figure 2). The adjacent Quaternary volcanoes to Olkaria volcanic complex which include Longonot,
Suswa and Eburru are associated with calderas of the varying sizes (Omenda, 1998). However, the Olkaria volcanic complex doesn’t
have a clear association of caldera. Other researchers (Clarke et al., 1990; Mungania, 1992; Naylor, 1972; Virkir, 1980) invoked the
presence of buried caldera to be associated with a ring of volcanic domes in the east and south, and southwest. Further, Naylor (1972)
while carrying out surface mapping of Olkaria area, identified remnants of an old caldera complex, subsequently cut by north-south
normal rift faulting that provided the locus for later eruptions of rhyolitic and pumice domes now exposed in the Ol Njorowa Gorge.
Several studies conducted in the area and have proposed the existence of caldera. The presence of ignimbritic flows identified in Olkaria
are closely associated with caldera collapse (Omenda, 1998). Omenda (1998) postulated that the ring structure was produced by
magmatic stresses in the Olkaria “magma chamber” with the line of weakness being locus for volcanism. The volcanism in the Olkaria
complex is associated with late Pleistocene and continues to Recent as indicated by Ololbutot comendite and pantellerites, which, have
been dated at 180±50 yrs B.P (Clarke et al., 1990). A geological map of the greater Olkaria Volcanic Complex showing the spatial
distribution of different lithological units (figure 2). The main structural pattern of the Olkaria geothermal area is characterized by the
following fault trends: N-S, NW-SE, NNW-SSE, and ENE-WSW (Leach and Muchemi, 1987; Ogoso-Odongo, 1986; Omenda, 1998).
Prominent structures in the complex are: the Ol’ Njorowa gorge, the N-S trending Ololbutot fault, the NE trending Olkaria fault, the
Olkaria fracture, the Suswa fault and the Gorge Farm fault (Figure 2). These lineaments are observable on the surface and have also
been inferred from aerial and Landsat images in areas where they have been masked by an extensive pyroclastic cover (Munyiri, 2016).
In the Olkaria Volcanic Complex and the surrounding, most of the young near north striking faults are marked by numerous lava flows
and volcanic cone of various ages.
Figure 2: Geology and structural map of the Olkaria geothermal field showing surface lithological units and structures
(modified from Clarke et al., 1990)
Page 4
Mwania
4
2.1 Subsurface stratigraphy of Olkaria Northwest and Northeast fields
The subsurface lithology for both two fields present a spectacular geology and distinctive structural framework necessitating fluid
movement within the geothermal system. In these particular fields, the lithostratigraphy is well described by Omenda (1998) who gave a
detailed account of the stratigraphy and the reservoir rock characteristics. From the analysis of drill cuttings, Omenda (1998) pointed
that, the east and west sectors have distinct lithostratigraphy with a major structural divide cutting approximately through the Olkaria
Hill. This structure is thought to be a major high-angle normal rift fault downthrown to the east. Subsequent volcanism occurred on the
graben side of the fault (Omenda, 1998). The west sector is characterized by the abundance of Mau tufts while Plateau trachytes and the
Olkaria basalt are unique to the east sector (Omenda, 1998). The occurrence of Plateau trachytes in large volumes and occasional
rhyolites in Northeast sector below the cap rock confirm them to be the main reservoir rock.
3. METHODOLOGY OF STUDY
Several analytical techniques were used for determining petrophysical properties and evaluation of chemical mobility within the
reservoir rocks.
3.1. Petrophysical properties
For petrophysical properties key parameters evaluated during the study included; porosity, permeability and lithological variance. For
detailed evaluation of the lithological character, porosity and permeability in relation to variability of hydrothermal alteration patterns,
the optical method was employed. However, for porosity measurements, Gravimetric techniques were employed since they are more
reliable than optical methods. Using the gravimetric techniques, the porosity measurements were derived from the difference between
the saturated sample and dry sample gives the mass of water in pore spaces (Mwtr = Msat – Mdry) and the pore volume (Vp) was then
calculated from the density of water (Vp = Mwtr/ρwtr). The bulk volume of the sample is calculated from the sample when put in a
beaker and the displaced volume of water is weighed, and the volume calculated from the known density of water The fractional
porosity was then determined from the calculated ratio of pore and bulk volume measurements as shown in equation 1 below;-
Permeability on the hand was determined through visual observation under optical microscopy and also inferred from indirectly from
the temperature distribution within the reservoir. There were no direct measurements on permeability, however, the results were equally
compared with the known permeability values of the major structural controls within the field sector.
3.2. Geochemical mobility
Samples for geochemical analysis were subjected to X-Ray Fluorescence (XRF) techniques to evaluate the constituent elements (major
and trace elements) of the reservoir rocks (trachytes and rhyolites). X-ray fluorescence (XRF) analysis is one of the most common non-
destructive methods for qualitative as well as quantitative determination of elemental composition of materials and it is suitable for
solids, liquids as well as powders (Torres-Alvarado, Pandarinath, Verma, and Dulski, 2007; Verma, Torres-Alvarado, Satir, and
Dobson, 2005)
Rock samples from drill cuttings were analysed for bulk chemistry mainly for SiO2, K2O, Al2O3, CaO, Mn and FeO, and several trace
elements; Zr, Y, Rb, Sr, Nb, and Ba to allow direct empirical comparison between the protolith rocks and altered rocks which constitute
the bulk reservoir. The surface samples (trachytes and rhyolites) used for this study were adopted from Macdonald et al., (2008) and
Marshall et al., (2009) which are assumed to offer representation of fresh or less altered samples. Although, the surface are not purely
fresh, the assumption made is that, the surface samples are least affected by hydrothermal alteration and relatively remain stable.
Immobile elements (SiO2 and Zr) are considered as the independent variables for this study. An important indication of the immobile
elements is that their ratios will remain relatively constant during dilution and depletion of other chemical components (Barret and
MacLean, 1994).
4. RESULTS
4.1 Petrophysical properties
4.2.1 Porosity
Porosity distribution within the reservoir is determined by two-fold approach; (i) through the optical techniques by use of microscopes
and (ii) experimental through gravimetric measurements.
i) Optical Method
In determination of porosity through the optical method, consideration is taken on the account of alteration intensity and permeability
type. This technique is based on the visual point counting to characterise the surface morphology of the particular rock specimen. The
analysed data was then tabulated and plotted on a graph with depth and with respect to alteration intensity to decipher the spatial
distribution within the reservoir and also to predict the influence of progressive hydrothermal metamorphism (Figures 3, 4, 5).
Page 5
Mwania
5
Figure 3: Visual porosity (blue colour) and alteration intensity (orange colour) distribution with depth in well OW-725, Olkaria
Northeast field
Observations from well OW-725
Well OW-725 (Figure 3, above) display three major petrophysical facies. Firstly, the two distinct facies at 650 – 1060 m bgl and 1770-
1890 m bgl. These zones are characterised by moderate to high alteration intensity and high porosity. The average visual porosities for
these two zones are estimated at 2.48 % and 3.73 %, respectively, and therefore considered as major feed zones in this well. The second
facie is at the zone between 1080-1680 m bgl largely predominated by replacement and surface deposition which ultimately changes the
mineral fabric. The average visual porosity distribution within this zone is estimated at 0.83 % and constitute intermittent minor feed
zone. This zone is typified by moderate alteration intensity and poor porosity, an observation clearly evident from the photomicrographs
(Figure 4).
Figure 4: Photomicrographs of well OW-725 both under PPL (plane polar) (a) and XPL (crossed polar) (b) at depth of 1388-
1390 m bgl, showing incipient stages of primary mineral (sanidine) dissolution and etch-pitting
a b
Page 6
Mwania
6
Figure 5: Porosity (blue colour) and alteration intensity (orange colour) distribution with depth in well OW-717, Olkaria
Northeast field.
Observations from well OW-717
Well OW-717 display two distinct petrophysical facies; the first section from 1160 to 1250 m bgl characterised by dissolution and
sparse deposition on the surface. The second section falls between 1250 -2000 m bgl and appears fairly tight with very poor porosity.
The moderate alteration intensity is largely predominated by deposition on the surface. Average porosities within these sections are
estimated at 1.56 % and 0.15%, respectively. Photomicrographs (Figure 6) for selected depths attest to this phenomenon of poor
porosity within the reservoir rock.
Figure 6: Photomicrographs of well OW-717 both under PPL (plane polar) (a) and XPL (crossed polar) (b) at depth of 1438-
1440 m bgl, showing little alteration intensity as well as poor porosity within the rock matrix.
a b
Page 7
Mwania
7
Figure 7: Porosity (blue colour) and alteration intensity (orange colour) distribution with depth in well OW-706, Olkaria
Northeast field.
Observations from well OW-706
Dissolution of the primary minerals appear to be the predominant mechanism through which pores have developed and evolved.
Although porosities are uniformly distributed within the well-bore, they are averaged at 3% and 0.95% for both major and minor feed
zones, respectively
ii) Porosity results from Gravimetric (Archimedes) method
For the three wells; OW-706, OW-717 and OW-725, porosity distribution was analysed majorly on trachytes and rhyolitic rocks which
occurs in large volumes and form the greater part of the reservoir. The limitation for this method was that, few recovered core samples
which were available for analysis. Nevertheless, notable inferences have been drawn from analysed rock specimen (tables 1, 2, 3).
Table 1: Micro-porosity distribution and alteration index in well OW-706
Depth (m) Dry mass
(gm)
Wet mass
(gm)
Pore
volume(m3)
Bulk
volume(m3)
Fractional
porosity
%
porosity
Alteration
Index
Alteration
(%)
997-998 71.004 72.419 1.415 29.759 0.04754864 4.75 1.5 50
1602-1604 59.666 63.171 3.505 26.289 0.13332573 13.33 1 33
1821-1823 46.041 47.348 1.307 18.49 0.07068686 7.07 1 33
2093-2094 49.521 52.463 2.942 22.909 0.12842114 12.84 3 100
2094-2095 45.523 49.47 3.947 22.269 0.17724191 17.72 3 100
2095-2095.8 47.564 49.588 2.024 22.329 0.09064445 9.06 3 100
2095.8-2096 53.338 55.588 2.25 22.279 0.10099197 10.10 2 67
2096-2096.5 32.611 34.862 2.251 14.72 0.1529212 15.29 1.5 50
2096.5-2097 54.597 57.531 2.934 24.889 0.1178834 11.79 1 33
2097-2098 60.229 64.129 3.9 27.739 0.14059627 14.06 1.5 50
Depth (m) Dry mass
(gm)
Wet Mass
(gm)
Pore
volume(m3)
Bulk
volume(m3)
Fractional
porosity
%
porosity
Alteration
Index
Alteration
(%)
884-886 59.973 61.723 1.75 26.269 0.06661845 6.66 0.5 17
886-888 56.440 58.711 2.271 25.869 0.08778847 8.78 1 33
2096-2099 46.116 48.4685 2.3525 19.8958 0.11824104 11.82 1 33
Depth (m) Dry mass
(gm)
Wet Mass
(gm)
Pore
volume(m3)
Bulk
volume(m3)
Fractional
porosity
%
porosity
Alteration
Index
Alteration
(%)
808-809 44.181 45.728 1.547 19.329 0.08003518 8.00 1.5 50
809.5-810.5 49.407 51.940 2.533 22.419 0.11298452 11.30 2 67
811.5-813.5 59.289 62.332 3.043 26.879 0.11321106 11.32 2.5 83
2198-2199 66.543 68.779 2.236 28.569 0.07826665 7.83 2 67
2196-2197 53.329 55.809 2.48 22.489 0.11027613 11.03 1.5 50
2197-2198 56.474 58.642 2.168 23.809 0.091058 9.11 1 33
2199.5-2200.5 55.033 56.765 1.732 23.649 0.07323777 7.32 1.5 50
Density of water is 1 g/cm3, Average porosity 11.60 %
Density of water is 1 g/cm3, Average porosity 9.09%
Density of water is 1 g/cm3, Average porosity 9.42%
Well-OW-706
Well-OW-717
Well-OW-725
Page 8
Mwania
8
Table 2: Micro-porosity distribution and alteration index in well OW-717
Depth (m) Dry mass
(gm)
Wet mass
(gm)
Pore
volume(m3)
Bulk
volume(m3)
Fractional
porosity
%
porosity
Alteration
Index
Alteration
(%)
997-998 71.004 72.419 1.415 29.759 0.04754864 4.75 1.5 50
1602-1604 59.666 63.171 3.505 26.289 0.13332573 13.33 1 33
1821-1823 46.041 47.348 1.307 18.49 0.07068686 7.07 1 33
2093-2094 49.521 52.463 2.942 22.909 0.12842114 12.84 3 100
2094-2095 45.523 49.47 3.947 22.269 0.17724191 17.72 3 100
2095-2095.8 47.564 49.588 2.024 22.329 0.09064445 9.06 3 100
2095.8-2096 53.338 55.588 2.25 22.279 0.10099197 10.10 2 67
2096-2096.5 32.611 34.862 2.251 14.72 0.1529212 15.29 1.5 50
2096.5-2097 54.597 57.531 2.934 24.889 0.1178834 11.79 1 33
2097-2098 60.229 64.129 3.9 27.739 0.14059627 14.06 1.5 50
Depth (m) Dry mass
(gm)
Wet Mass
(gm)
Pore
volume(m3)
Bulk
volume(m3)
Fractional
porosity
%
porosity
Alteration
Index
Alteration
(%)
884-886 59.973 61.723 1.75 26.269 0.06661845 6.66 0.5 17
886-888 56.440 58.711 2.271 25.869 0.08778847 8.78 1 33
2096-2099 46.116 48.4685 2.3525 19.8958 0.11824104 11.82 1 33
Depth (m) Dry mass
(gm)
Wet Mass
(gm)
Pore
volume(m3)
Bulk
volume(m3)
Fractional
porosity
%
porosity
Alteration
Index
Alteration
(%)
808-809 44.181 45.728 1.547 19.329 0.08003518 8.00 1.5 50
809.5-810.5 49.407 51.940 2.533 22.419 0.11298452 11.30 2 67
811.5-813.5 59.289 62.332 3.043 26.879 0.11321106 11.32 2.5 83
2198-2199 66.543 68.779 2.236 28.569 0.07826665 7.83 2 67
2196-2197 53.329 55.809 2.48 22.489 0.11027613 11.03 1.5 50
2197-2198 56.474 58.642 2.168 23.809 0.091058 9.11 1 33
2199.5-2200.5 55.033 56.765 1.732 23.649 0.07323777 7.32 1.5 50
Density of water is 1 g/cm3, Average porosity 11.60 %
Density of water is 1 g/cm3, Average porosity 9.09%
Density of water is 1 g/cm3, Average porosity 9.42%
Well-OW-706
Well-OW-717
Well-OW-725
Table 3: Micro-porosity distribution and alteration index in well OW-725
Depth (m) Dry mass
(gm)
Wet mass
(gm)
Pore
volume(m3)
Bulk
volume(m3)
Fractional
porosity
%
porosity
Alteration
Index
Alteration
(%)
997-998 71.004 72.419 1.415 29.759 0.04754864 4.75 1.5 50
1602-1604 59.666 63.171 3.505 26.289 0.13332573 13.33 1 33
1821-1823 46.041 47.348 1.307 18.49 0.07068686 7.07 1 33
2093-2094 49.521 52.463 2.942 22.909 0.12842114 12.84 3 100
2094-2095 45.523 49.47 3.947 22.269 0.17724191 17.72 3 100
2095-2095.8 47.564 49.588 2.024 22.329 0.09064445 9.06 3 100
2095.8-2096 53.338 55.588 2.25 22.279 0.10099197 10.10 2 67
2096-2096.5 32.611 34.862 2.251 14.72 0.1529212 15.29 1.5 50
2096.5-2097 54.597 57.531 2.934 24.889 0.1178834 11.79 1 33
2097-2098 60.229 64.129 3.9 27.739 0.14059627 14.06 1.5 50
Depth (m) Dry mass
(gm)
Wet Mass
(gm)
Pore
volume(m3)
Bulk
volume(m3)
Fractional
porosity
%
porosity
Alteration
Index
Alteration
(%)
884-886 59.973 61.723 1.75 26.269 0.06661845 6.66 0.5 17
886-888 56.440 58.711 2.271 25.869 0.08778847 8.78 1 33
2096-2099 46.116 48.4685 2.3525 19.8958 0.11824104 11.82 1 33
Depth (m) Dry mass
(gm)
Wet Mass
(gm)
Pore
volume(m3)
Bulk
volume(m3)
Fractional
porosity
%
porosity
Alteration
Index
Alteration
(%)
808-809 44.181 45.728 1.547 19.329 0.08003518 8.00 1.5 50
809.5-810.5 49.407 51.940 2.533 22.419 0.11298452 11.30 2 67
811.5-813.5 59.289 62.332 3.043 26.879 0.11321106 11.32 2.5 83
2198-2199 66.543 68.779 2.236 28.569 0.07826665 7.83 2 67
2196-2197 53.329 55.809 2.48 22.489 0.11027613 11.03 1.5 50
2197-2198 56.474 58.642 2.168 23.809 0.091058 9.11 1 33
2199.5-2200.5 55.033 56.765 1.732 23.649 0.07323777 7.32 1.5 50
Density of water is 1 g/cm3, Average porosity 11.60 %
Density of water is 1 g/cm3, Average porosity 9.09%
Density of water is 1 g/cm3, Average porosity 9.42%
Well-OW-706
Well-OW-717
Well-OW-725
Remarkable porosity results via this method present relatively higher values compared to optical method. This is possibly attributed to
micro-porosity of the inter-crystal matrix (Tables 1, 2, 3). The calculated average porosity values for these wells depict slight variability
from 11.6% in well OW-706 to 9.9% in well OW-717, and in well OW-725 with median value of 9.42%.
4.2.2 Lithology, hydrothermal alteration and permeability distribution
i) Hydrothermal alteration facies
Figure 8: Fence model for hydrothermal alteration distribution in wells OW-706, OW-717 and OW-725 within the reservoir
rocks (trachytes and rhyolites) in Olkaria Northeast field.
Page 9
Mwania
9
From the fence model moderate to high alteration is eminent in well OW-706 and clearly defined by two distinct alteration facies. These
are zones characterised phyllic and prophyllic alteration mainly typified by chloritisation and epidotisation processes. Alteration facies
in wells; OW-717 and OW-725 are widely controlled by argillic-phyllic facies of low to moderately alteration intensity. Intercalated
zones of low alteration zones are also prevalent and quite often associated low alteration minerals precipitating within the permeable
zones and eventually comprising the reservoir permeability.
ii) Reservoir permeability model
Figure 9: Permeability controls defined by NW-SE and ENE-WSW structures and feed-zones in the study wells (OW-706, OW-
717 and OW-725), in Olkaria Northeast field.
Permeability within the reservoir was determined indirectly by invoking the temperature distribution and the character of the feed-zones
from the study wells. The model indicate enhanced temperature distribution at fairly shallow depth along NW-SE trending fault, while
on the other hand, high temperatures are observed to predominate at depth.
iii) Petrophysical model and predicted reservoir geometry
Figure 10: Petrophysical model for wells OW-706, OW-717 and OW-725 in Olkaria Northeast field.
The petrophysical facies model indicate high porosities in well OW-706 at the upper column of the well, while wells OW-717 and OW-
725 manifest moderate to low porosity distribution. In particular, well OW-717 is typified by two distinct zones of low porosities which
Page 10
Mwania
10
are possibly tied to effects of hydrothermal alteration while OW-725 has moderate porosity. Generally, the zones with high porosity are
also complimented by pervasive fluid-interaction leading to pore-evolution and subsequent permeability enhancement. The model is
facies dependent and majorly controlled the characteristic nature of the interacting fluid. The influence of NW-SE and ENE-WSW
(Olkaria fault) faults as preferential flow paths for hydrothermal fluids have also been factored in the model.
4.2 Effects of hydrothermal alteration on geochemical mobility
During hydrothermal alteration process, relative element transfers occur due to dissolution and precipitation mechanisms taking place
within the reservoir. Alteration may thus to greater extent influence the physical morphology of the rock matrix which widely affects the
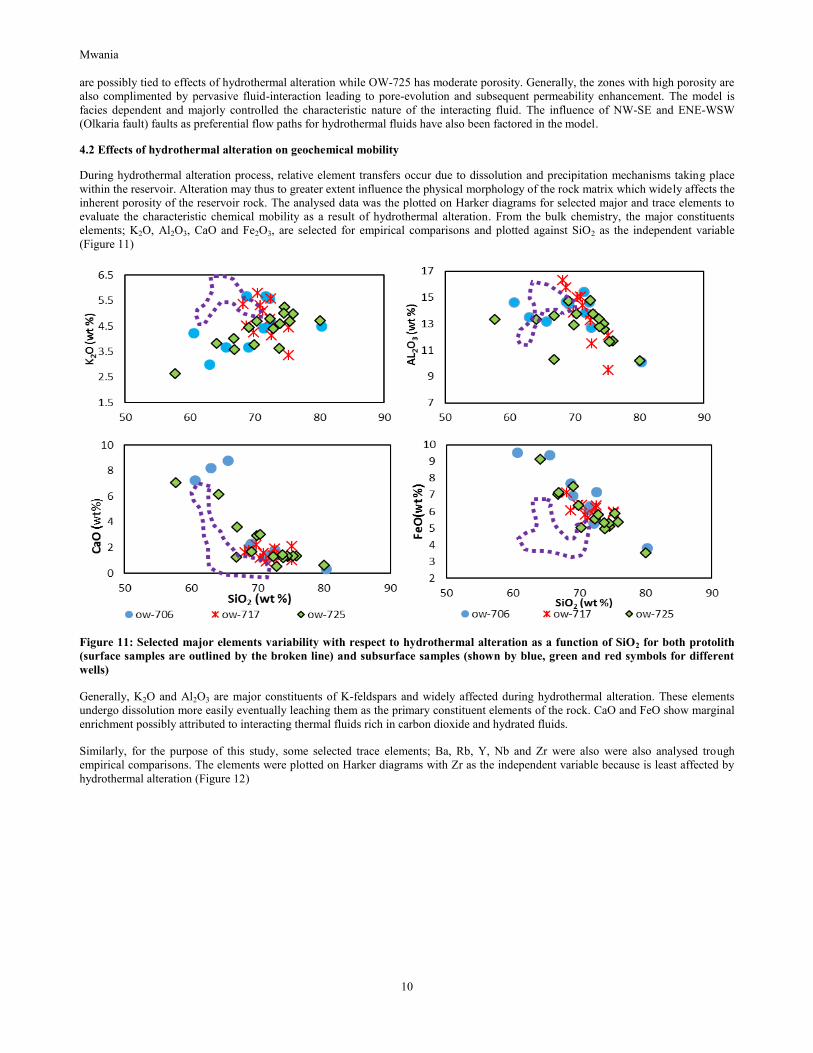
inherent porosity of the reservoir rock. The analysed data was the plotted on Harker diagrams for selected major and trace elements to
evaluate the characteristic chemical mobility as a result of hydrothermal alteration. From the bulk chemistry, the major constituents
elements; K2O, Al2O3, CaO and Fe2O3, are selected for empirical comparisons and plotted against SiO2 as the independent variable
(Figure 11)
Figure 11: Selected major elements variability with respect to hydrothermal alteration as a function of SiO2 for both protolith
(surface samples are outlined by the broken line) and subsurface samples (shown by blue, green and red symbols for different
wells)
Generally, K2O and Al2O3 are major constituents of K-feldspars and widely affected during hydrothermal alteration. These elements
undergo dissolution more easily eventually leaching them as the primary constituent elements of the rock. CaO and FeO show marginal
enrichment possibly attributed to interacting thermal fluids rich in carbon dioxide and hydrated fluids.
Similarly, for the purpose of this study, some selected trace elements; Ba, Rb, Y, Nb and Zr were also were also analysed trough
empirical comparisons. The elements were plotted on Harker diagrams with Zr as the independent variable because is least affected by
hydrothermal alteration (Figure 12)
Page 11
Mwania
11
Figure 12: Selected trace elements concentrations as a function of Zr for both protolith (surface samples outlined by purple
broken line) and sub-surface samples (shown by blue, green and red symbols for different wells)
The elements show marginal changes suggesting that they are slightly affected by hydrothermal alteration. The plots for Nb, Y and Rb
against Zr show positive correlation signifying possible enrichment. However, the plot for Ba vs Zr show scattering effect due to its
characteristic mobility nature in crustal rocks.
5.0 DISCUSSION, CONCLUSIONS AND RECOMMENDATIONS
5.1 Discussions and conclusions
The reservoir rocks studied for three wells; OW-706, OW-717 and OW-725 display variability of mechanical behavior, including
physical and chemical changes during hydrothermal alteration. This is attributable to water-rock interaction processes often with fluids
rich in some chemicals constituents, and as result, affecting the rock fabric, texture and pore shape as well as pore evolution. Porosity
development has close relation to permeability and their variability within the reservoir rock have to a greater extend influenced by
hydrothermal metamorphism. From both optical and gravimetric techniques employed to estimate porosity distribution, the results
present good correlation and provide powerful insights into the evolution history and principal mechanism for fluid type and flux within
the reservoir.
Macro porosity analysis indicate spectacular facies morphology of the rock specimens, where three broad alteration mechanism
controlling porosity distribution are recognised. These are alteration by dissolution, deposition and replacement as the major processes
controlling secondary porosity generation and etch-pitting of the mineral fabric. The integrated results for different facies zones
predicate variability of reservoir geometry with differential hydrothermal metamorphism. This is clearly discerned in well OW-706,
where three major lithological aquifer facies are recognised at variable depths; 790-1670m, 1820 -1900m and 1970-2086m bgl. On the
other hand, wells OW-717 and OW-725 display selective precipitation of minerals which produce concentrated deposits of elements
normally dispersed from crustal-rocks. The latter mechanisms of hydrothermal alteration restrict pervasive fluid flux wield negative
consequence on permeability advancement within the reservoir. The overall effects being constricted fluid flow as evidenced by minor
aquifer zones discerned at 1160-1250m bgl in well OW-717, and at 700-1050m and 1800-1900m bgl in well OW-725.
Remarkable porosity results via gravimetric method present relatively higher values compared to optical method. This is largely
attributed to micro-porosity of the intestinal-crystal matrix. Generally, the judicious combination of the petrophysical parameters
provide considerable information on the reservoir pore-geometry and also have a direct relationship on the pore-network evolution. This
is quite conformable with the major structural lineaments, where the vertical permeability is notably high along NW-SE trending fault
than ENE-WSW (Olkaria fault). Albeit small margin, the measured permeability agrees quite well with the results of petrophysical
properties.
Page 12
Mwania
12
The results indicate that K2O and Al2O3 from hydrothermally altered samples show significant depletion trends from protolith samples
(relatively less altered samples from Macdonald et al., 2008; Marshall et al., 2009) suggesting possible hot hydrothermal fluids
interacting with the host reservoir. Notably, K2O and Al2O3 are major constituents of alkali feldspars and appear to undergo depletion
resulting from dissolution effects during hydrothermal alteration. CaO and FeO show enrichment of mineral constituents apparently
attributed to the precipitation of secondary minerals from the hydrothermal fluids.The quantification of the hydrothermal effects on
reservoir rock is based on direct approaches which yield substantive inferences similarly adopted by other authors (Musonye, 2015;
Victor Omondi Otieno, 2016; Pandarinath et al., 2008; Verma et al., 2005).
For selected trace elements, plots for Nb, Y and Rb against Zr show positive correlation suggesting possible enrichment during
hydrothermal alteration. Ba vs Zr plots indicate scattering effects. This is chiefly due to characteristic mobility nature of the Ba
solubility within the crustal rocks. In general, the hydrothermal alteration largely influences the bulk chemistry of a rock and to some
extent on trace elements dispersion.
5.2 Recommendations
Reservoir geometry propagation is controlled by fracture-fault permeability of NW-SE striking fault (adjacent to well OW-
706). Therefore, future productive and Make-up wells should target this zone where the pore-network is well developed. Re-
injection wells should be planned close to the periphery of the field on the eastern side adjacent to Gorge farm fault.
The techniques employed in determination of petrophysical properties are not explicit and therefore further studies should
consider other modern techniques such as computerized X-Ray tomography and mercury porosimeter among others
Future drilling should aim at recovering core samples at reservoir depth for direct permeability measurements
Similarly, on quantification of effects of hydrothermal metamorphism on bulk chemistry, other methods should also be
considered as loss of ignition, mass balance calculations and statistical approaches (e.g. students T-tests)
Further works should be expended to entire geothermal field especially at peripherals of highly explored zones in order to
improve the confidence of well siting programs
6.0 REFERENCES
Barret, J. ., & MacLean, W., Chemostratigraphy and Hydrothermal Alteration in Exploration for VHMS Deposits in Greenstones and
Younger Volcanic Rocks. In Lentz D.R (Ed.) (Vol. 11, pp. 433–467). Geological Association of Canada (1994).
Clarke, M. C. G., Woodhall, D. G., Allen, D., & Darling, G. Geological, volcanological and hydrogeological controls on the occurrence
of geothermal activity in the area surrounding Lake Naivasha, Kenya (1990).
Kandie, R., Mwania, M., & Rono, I. J. An updated conceptual model of Olkaria geothermal field, Kenya. BoC proceedings (restricted).
KenGen Internal Report (unpublished) (2014).
Lagat, J. K. Geology, hydrothermal alteration and fluid inclusion studies of Olkaria Domes geothermal field, Kenya: MSc thesis,
Department of Geology and Geography, University of Iceland. UNU Geothermal Training Programme, Reykjavik, Iceland (2004).
Leach, T. M., & Muchemi, G. G. Geology and Hydrothermal Alteration of the North and West Exploration Wells In the Olkaria
Geothermal Field, Kenya. In 9th NZ Geothermal Workshop (1987).
Macdonald, R., Belkin, H. E., Fitton, J. G., Rogers, N. W., Nejbert, K., Tindle, A. G., and Marshall, A. S. The Roles of Fractional
Crystallization, Magma Mixing, Crystal Mush Remobilization and Volatile-Melt Interactions in the Genesis of a Young Basalt-
Peralkaline Rhyolite Suite, the Greater Olkaria Volcanic Complex, Kenya Rift Valley. Journal of Petrology, 49(8), 1515–1547.
https://doi.org/10.1093/petrology/egn036, (2008)
Marshall, A. S., Macdonald, R., Rogers, N. W., Fitton, J. G., Tindle, A. G., Nejbert, K., & Hinton, R. W. Fractionation of Peralkaline
Silicic Magmas: the Greater Olkaria Volcanic Complex, Kenya Rift Valley. Journal of Petrology, 50(2), 323–359.
https://doi.org/10.1093/petrology/egp001, (2009)
Mungania, J. Preliminary field report on geology of Olkaria volcanic complex with emphasis on Domes area field investigations. Kenya
Power Company internal report (unpublished), (1992).
Munyiri, S. K. Structural Mapping of Olkaria Domes Geothermal Field using Geochemical Soil Gas Surveys, Remote Sensing and GIS.
United Nations University, Reykjavic, Iceland. Msc Thesis, United Nations University, Reykjavic, Iceland. Retrieved from
http://skemman.is/en/item/view/1946/24795;jsessionid=894010FEB1B7B88BB638AFF99991BA25, (2016)
Page 13
Mwania
13
Musonye, X. S. Sub-surface petrochemistry, stratigraphy and hydrothermal alteration of the Domes area, Olkaria geothermal field,
Kenya. Reykjavic, Iceland: United Nations University, (2015).
Naylor, W. I. The Geology of the Eburru and Olkaria Geothermal Projects. United Nations Development Programme, (restricted)
Report No. 01, 52 p, (1972).
Ofwona, C. O. (2002). A reservoir study of the Olkaria East geothermal system, Kenya: M. Sc. thesis, Department of Civil and
Environmental Engineering, University of Iceland. United Nations University, Geothermal Training Programme, Reykjavik, Iceland,
(2002).
Ogoso-Odongo, M. E. Geology of the Olkaria geothermal field. Geothermics, 15(5), 741–748, (1986).
Omenda, P. The geology and structural controls of the Olkaria geothermal system, Kenya. Geothermics, 27(1), 55–74, (1998).
Omenda, P. A. The geothermal activity of the East African rift. Short Course II on Surface Exploration for Geothermal Resources,
Organized by UNU-GTP and KenGen, at Lake Naivasha, Kenya, 2–17, (2007).
Otieno, V. O. Borehole geology and sub-surface petrochemistry of the Domes area, Olkaria geothermal field, Kenya, in relation to well
OW-922. United Nations University, Reykjavic, Iceland. Msc Thesis, United Nations University, Reykjavic, Iceland. Retrieved from
http://skemman.is/item/view/1946/24796, (2016)
Otieno, V. O., Munyiri, S. K., Wanjohi, D. M., & Okoo, J. A. Structural mapping of Olkaria Southwest region with updated structural
map (restricted). KenGen Internal Report (Unpublished), (2014).
Pandarinath, K., Dulski, P., Torres-Alvarado, I. S., and Verma, S. P. Element mobility during the hydrothermal alteration of rhyolitic
rocks of the Los Azufres geothermal field, Mexico. Geothermics, 37(1), 53–72. https://doi.org/10.1016/j.geothermics.2007.10.002,
(2008).
Torres-Alvarado, I. S., Pandarinath, K., Verma, S. P., & Dulski, P. Mineralogical and geochemical effects due to hydrothermal
alteration in the Los Azufres geothermal field, Mexico. Revista Mexicana de Ciencias Geológicas, 24(1), 15–24, (2007).
Verma, S. P., Torres-Alvarado, I. S., Satir, M., & Dobson, P. F. Hydrothermal alteration effects in geochemistry and Sr, Nd, Pb, and O
isotopes of magmas from the Los Azufres geothermal field (Mexico): a statistical approach. Geochemical Journal, 39(2), 141–163,
(2005).
Virkir, S. Feasibility report for the Olkaria Geothermal Project. United Nations - Government of Kenya report. Unpublished (restricted),
(1980).