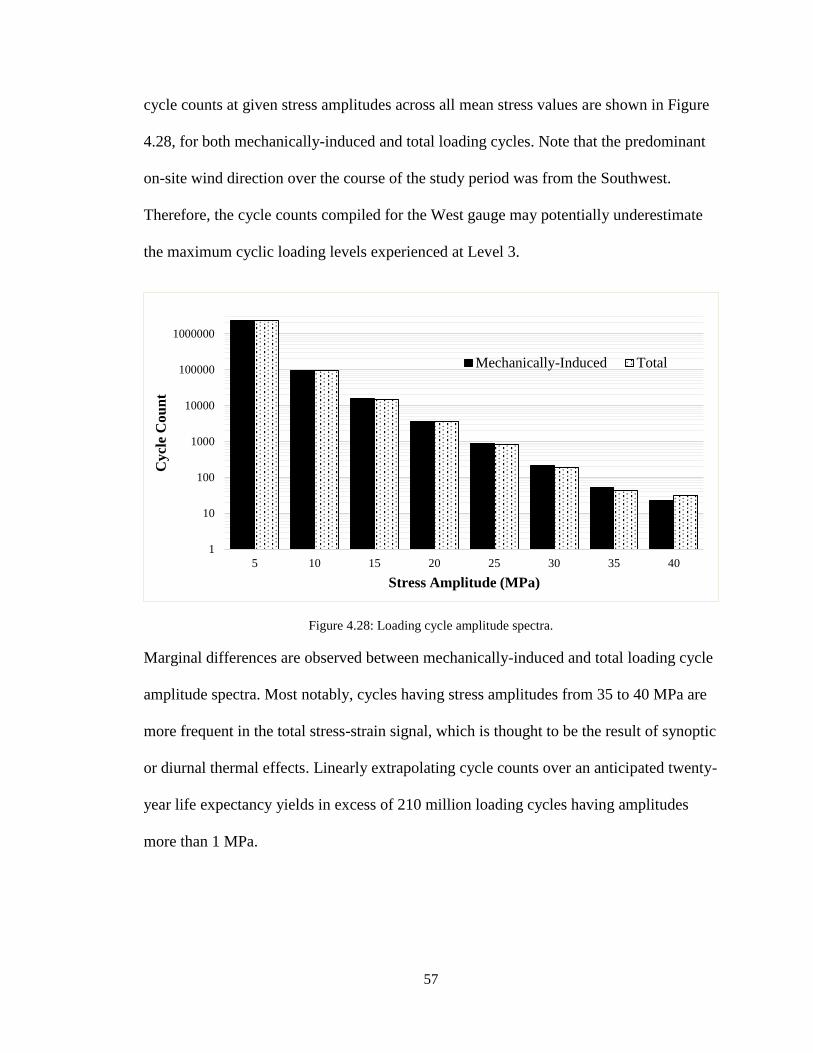
Page 1
University of Windsor University of Windsor
Scholarship at UWindsor Scholarship at UWindsor
Electronic Theses and Dissertations Theses, Dissertations, and Major Papers
2014
Effects of Inflow Parameters and Operating Conditions on the Effects of Inflow Parameters and Operating Conditions on the
Structural Response and Power Production of a Commercial Wind Structural Response and Power Production of a Commercial Wind
Turbine Turbine
Jamie C. Smith University of Windsor
Follow this and additional works at: https://scholar.uwindsor.ca/etd
Recommended Citation Recommended Citation Smith, Jamie C., "Effects of Inflow Parameters and Operating Conditions on the Structural Response and Power Production of a Commercial Wind Turbine" (2014). Electronic Theses and Dissertations. 5143. https://scholar.uwindsor.ca/etd/5143
This online database contains the full-text of PhD dissertations and Masters’ theses of University of Windsor students from 1954 forward. These documents are made available for personal study and research purposes only, in accordance with the Canadian Copyright Act and the Creative Commons license—CC BY-NC-ND (Attribution, Non-Commercial, No Derivative Works). Under this license, works must always be attributed to the copyright holder (original author), cannot be used for any commercial purposes, and may not be altered. Any other use would require the permission of the copyright holder. Students may inquire about withdrawing their dissertation and/or thesis from this database. For additional inquiries, please contact the repository administrator via email ([email protected] ) or by telephone at 519-253-3000ext. 3208.
Page 2
Effects of Inflow Parameters and Operating Conditions on the Structural Response
and Power Production of a Commercial Wind Turbine
By
Jamie C. Smith
A Thesis
Submitted to the Faculty of Graduate Studies
through the Department of Civil and Environmental Engineering
in Partial Fulfillment of the Requirements for
the Degree of Master of Applied Science
at the University of Windsor
Windsor, Ontario, Canada
2014
© 2014 Jamie C. Smith
Page 3
Effects of Inflow Parameters and Operating Conditions on the Structural Response
and Power Production of a Commercial Wind Turbine
by
Jamie C. Smith
APPROVED BY:
______________________________________________
C. Novak
Department of Mechanical, Automotive & Materials Engineering
______________________________________________
R. Seth
Department of Civil and Environmental Engineering
______________________________________________
D. S-K. Ting, Co-Advisor
Department of Mechanical, Automotive & Materials Engineering
______________________________________________
R. Carriveau, Advisor
Department of Civil and Environmental Engineering
May 1, 2014
Page 4
iii
DECLARATION OF CO-AUTHORSHIP/PREVIOUS PUBLICATIONS
I hereby declare that this thesis incorporates material that is the result of joint
research, as follows:
Thesis Chapter Details
Chapter 3
This thesis also incorporates the outcome of a joint research
undertaken in collaboration with Phil McKay under the supervision
of Dr. Rupp Carriveau, Dr. David S-K. Ting, and Dr. Tim Newson.
In all cases, the key ideas, primary contributions, data analysis and
interpretation, were performed by the author, and the contribution of
the co-author was primarily through the provision of data
processing.
I am aware of the University of Windsor Senate Policy on Authorship and I
certify that I have properly acknowledged the contribution of other researchers to my
thesis, and have obtained written permission from each of the co-author(s) to include the
above material(s) in my thesis.
I certify that, with the above qualification, this thesis, and the research to which it
refers, is the product of my own work.
This thesis includes an original paper that has been previously submitted for
publication in peer reviewed journals, as follows:
Thesis Chapter Publication title Publication status
Chapter 4
J. C. Smith, R. Carriveau, and D. S-K.
Ting, “Inflow parameter effects on wind
turbine tower cyclic loading,” Wind
Engineering
Submitted
I certify that I have obtained a written permission from the copyright owner(s) to
include the above submitted material(s) in my thesis. I certify that the above material
describes work completed during my registration as a graduate student at the University of
Windsor.
I certify that, to the best of my knowledge, my thesis does not infringe upon
anyone’s copyright nor violate any proprietary rights and that any ideas, techniques,
quotations, or any other material from the work of other people included in my thesis,
published or otherwise, are fully acknowledged in accordance with the standard
referencing practices. Furthermore, to the extent that I have included copyrighted material
Page 5
iv
that surpasses the bounds of fair dealing within the meaning of the Canada Copyright Act,
I certify that I have obtained a written permission from the copyright owner(s) to include
such material(s) in my thesis and have included copies of such copyright clearances to my
appendix.
I declare that this is a true copy of my thesis, including any final revisions, as
approved by my thesis committee and the Graduate Studies office, and that this thesis has
not been submitted for a higher degree to any other University or Institution.
Page 6
v
ABSTRACT
Onshore wind farms can experience a wide variety of wind conditions, even in
simple or flat terrain, as a result of diurnal and seasonal changes in stability in the
atmospheric boundary layer. At a farm in Southwestern Ontario, a commercial-sized
wind turbine operates in close proximity to a meteorological mast capable of quantifying
the inflow parameters of the approaching wind profile. The turbine’s steel supporting
tower has been instrumented with an optical strain gauge array measuring longitudinal
deformation at multiple elevations. Wind conditions have been classified into two major
profile types on the basis of two key inflow parameters: vertical wind shear and
horizontal turbulence intensity. The resulting effects of changing profile on turbine power
production and tower structural response have been characterized across changing
operating conditions and wind speeds.
Page 7
vi
DEDICATION
To Meghan and my family.
Page 8
vii
ACKNOWLEDGEMENTS
I’d like to extend a sincere thanks to my advisor, Dr. Rupp Carriveau, and co-advisor, Dr.
David S-K Ting, for the support they’ve provided these past few years. I have truly
enjoyed working with them in the Turbulence & Energy Laboratory, and I have found
them to be accommodating and knowledgeable whenever I’ve sought their insight. I also
wish to extend thanks to the remaining members of my committee, Dr. Colin Novak and
Dr. Rajesh Seth, for offering their comments on my research, and to Dr. El Ragaby for
assisting with my defence. Acknowledgement should also be made to two previous
graduate students, Jeff Bas and Phil McKay, for the technical assistance and mentoring
they’ve provided. This research would not be possible without the generous support from
our industrial partner, and I wish to thank Michael Cookson, JJ Davis, Paul Dawson, and
Jason Stoner for their efforts. This work has been supported by the Natural Sciences and
Engineering Research Council of Canada and the Ontario Ministry of Training, Colleges
and Universities.
Page 9
viii
TABLE OF CONTENTS
Declaration of Co-authorship/Previous Publications ......................................................... iii
Abstract ................................................................................................................................v
Dedication .......................................................................................................................... vi
Acknowledgements ........................................................................................................... vii
List of Tables .......................................................................................................................x
List of Figures .................................................................................................................... xi
Chapter 1: Introduction ........................................................................................................1
References ........................................................................................................................3
Chapter 2: Wind Turbine Power Production Under Changing Wind Profile ......................5
2.1 Introduction ................................................................................................................5
2.2 Experimental Setup ....................................................................................................8
2.3 Results ......................................................................................................................11
2.4 Concluding Remarks & Future Work ......................................................................19
References ......................................................................................................................20
Chapter 3: Effects of Wind Regime and Inflow Parameters on Wind Turbine Tower
Loading ..............................................................................................................................22
3.1 Introduction ..............................................................................................................22
3.2 Experimental Setup ..................................................................................................24
3.3 Results ......................................................................................................................31
3.4 Concluding Remarks & Future Work ......................................................................43
References ......................................................................................................................44
Chapter 4: Inflow Parameter Effects on Wind Turbine Tower Cyclic Loading ................47
4.1 Introduction ..............................................................................................................47
4.2 Experimental Setup ..................................................................................................49
4.4 Rainflow Counting ...................................................................................................52
4.3 Results ......................................................................................................................54
Page 10
ix
4.4 Concluding Remarks & Future Work ......................................................................63
References ......................................................................................................................64
Chapter 5: Conclusions ......................................................................................................68
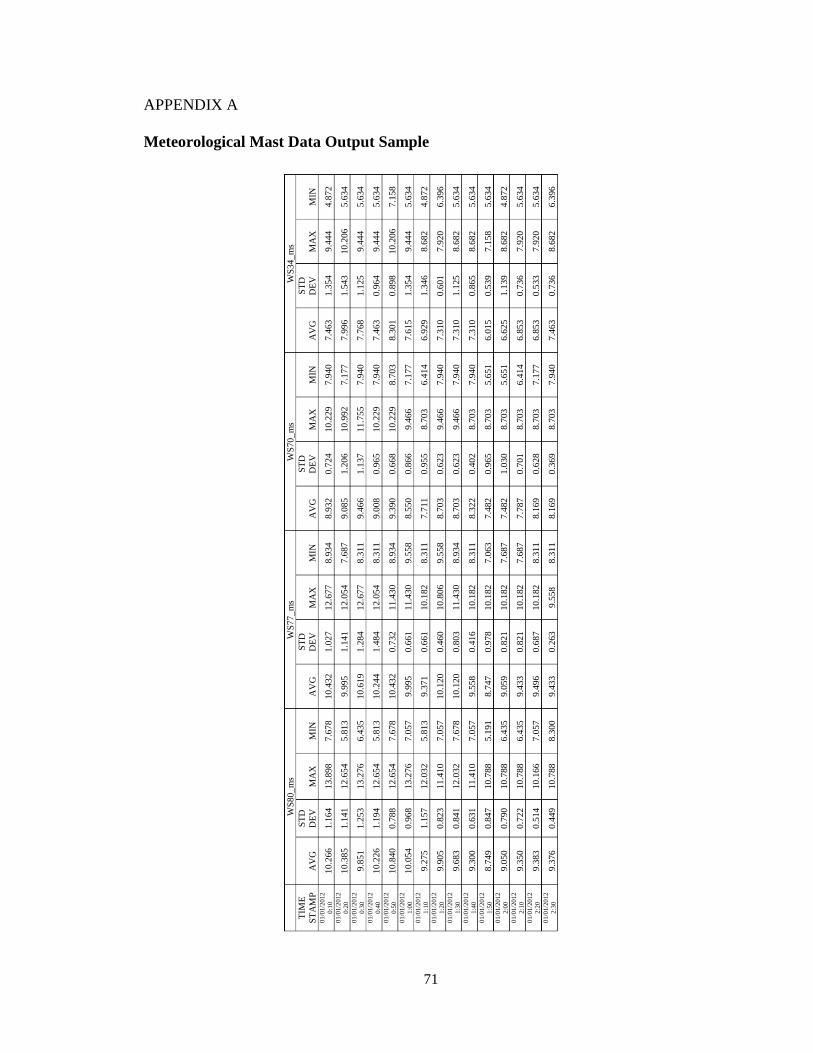
Appendix A: Meteorological Mast Data Output Sample ...................................................71
Vita Auctoris ......................................................................................................................72
Page 11
x
LIST OF TABLES
Table 2.1: Wind condition classification. ......................................................................... 11
Table 2.2: Characteristics of wind condition in Westerly sector over study period. ........ 14
Table 3.3: Strain gauge locations and corresponding tower properties. ........................... 25
Table 3.4: Wind condition classification .......................................................................... 26
Table 3.5: Characteristics of wind conditions in Westerly sector during study period. ... 37
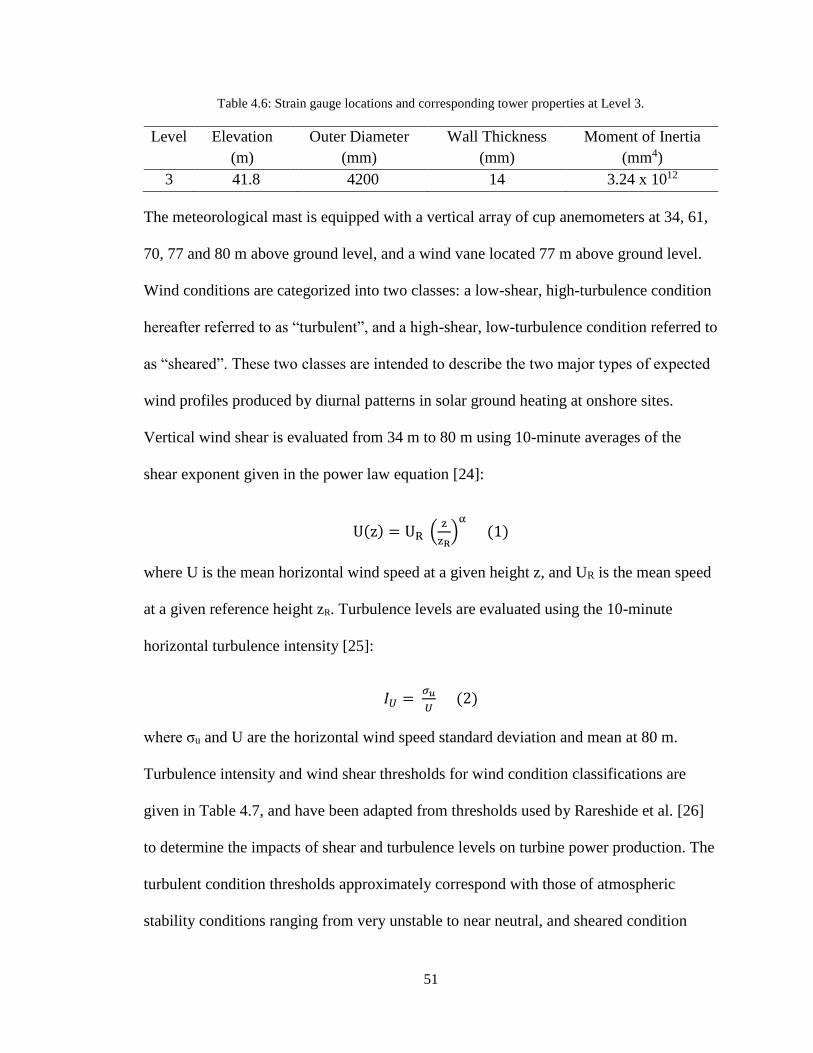
Table 4.6: Strain gauge locations and corresponding tower properties at Level 3. .......... 51
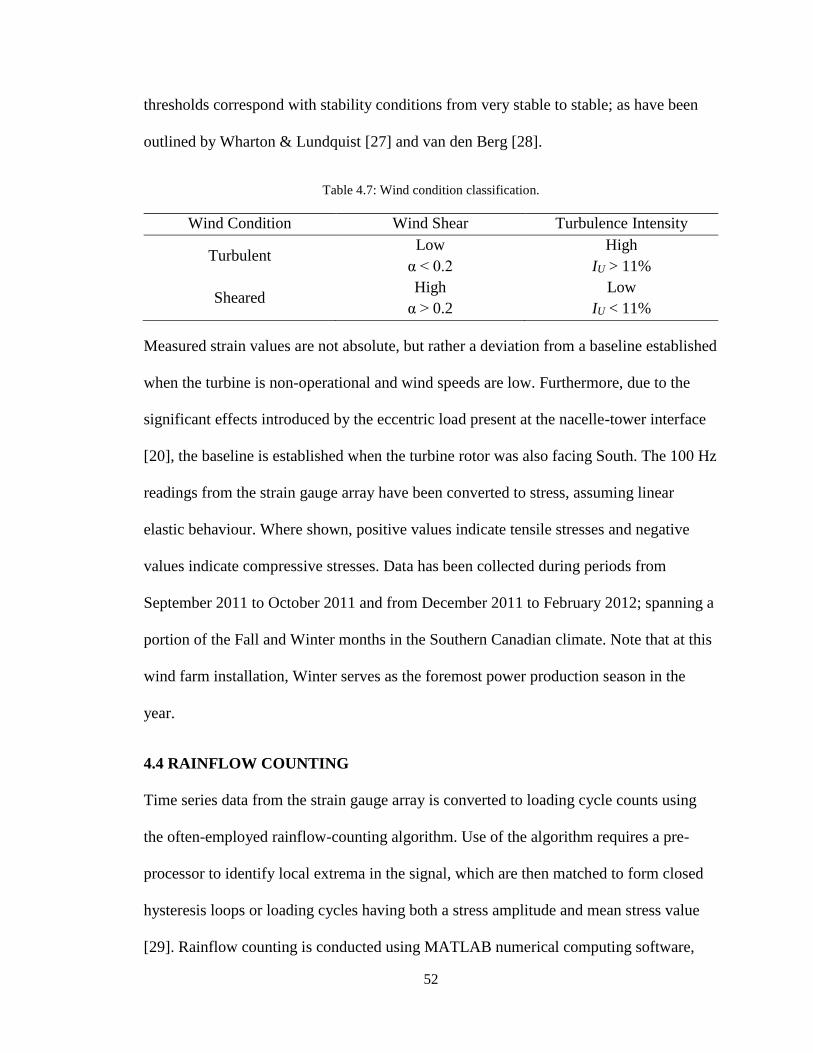
Table 4.7: Wind condition classification. ......................................................................... 52
Page 12
xi
LIST OF FIGURES
Figure 2.1: Aerial view of wind turbine under study and testing site layout. ..................... 8
Figure 2.2: Ground view of the testing site layout.............................................................. 9
Figure 2.3: Wind rose for direction probability over study period ................................... 10
Figure 2.4: Wind speed distribution for Westerly sector. ................................................. 12
Figure 2.5: Diurnal variation in wind speed and resulting power production .................. 13
Figure 2.6: Diurnal variation in wind shear and turbulence. ............................................ 14
Figure 2.7: Wind speed distribution for sheared and turbulent conditions. ...................... 15
Figure 2.8: Power production of turbine under differing wind condition. ........................ 16
Figure 2.9: Power production of turbine for selected wind speeds................................... 18
Figure 2.10: Power production of turbine for Southerly wind sector. .............................. 19
Figure 3.11: Strain signal under turbulent winds. ............................................................. 28
Figure 3.12: FFT plot under turbulent winds. ................................................................... 28
Figure 3.13: Strain signal under sheared winds. ............................................................... 29
Figure 3.14: FFT plot under sheared winds. ..................................................................... 29
Figure 3.15: Average bending moment and vertical strain in the tower. .......................... 32
Figure 3.16: Mean base bending moment versus wind speed for Westerly winds. .......... 33
Figure 3.17: Maximum base bending moment versus wind speed for Westerly winds. .. 35
Figure 3.18: Gust loading factor versus wind speed for Westerly winds. ........................ 35
Figure 3.19: Mean base bending moment versus wind speed, by wind condition. .......... 38
Figure 3.20: Maximum base bending moment versus wind speed, by wind condition. ... 38
Figure 3.21: Base bending moment standard deviation versus wind speed. .................... 39
Figure 3.22: Directional & nacelle position standard deviation versus wind speed. ........ 40
Figure 3.23: GLF versus wind speed and turbulence intensity for constant shear. .......... 41
Figure 3.24: GLF versus wind speed and wind shear for near constant turbulence. ........ 42
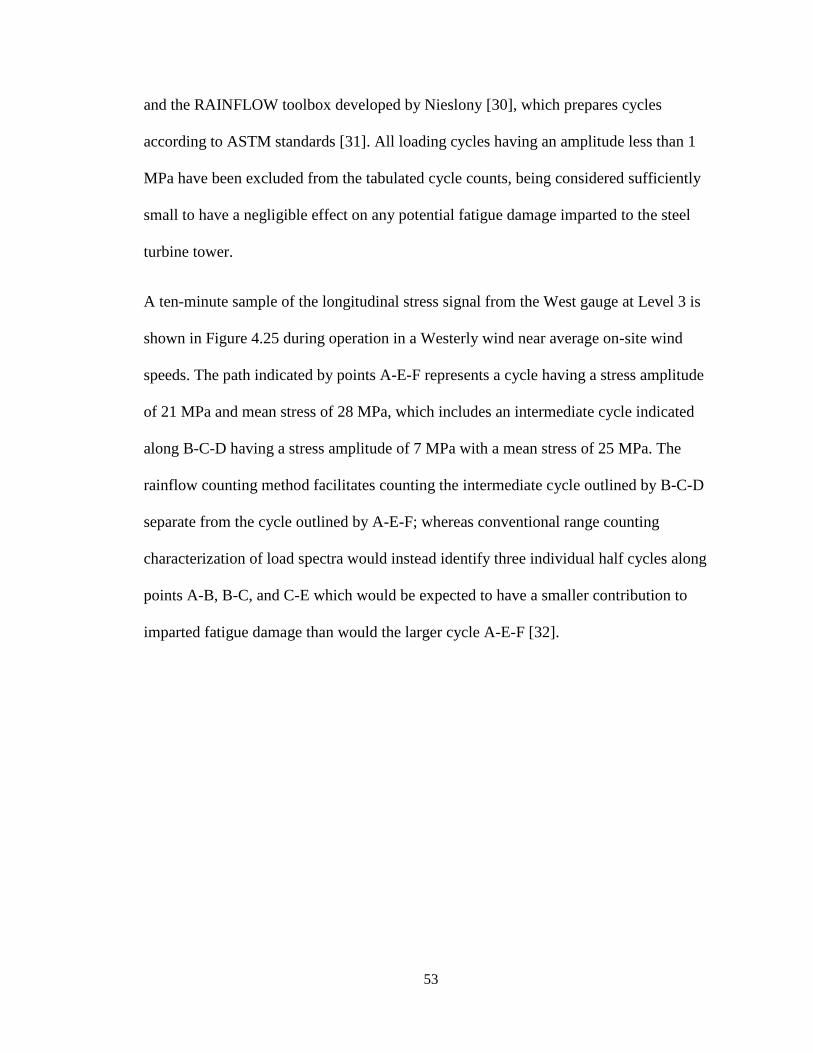
Figure 4.25: Ten-minute sample of longitudinal stress for West gauge at Level 3. ......... 54
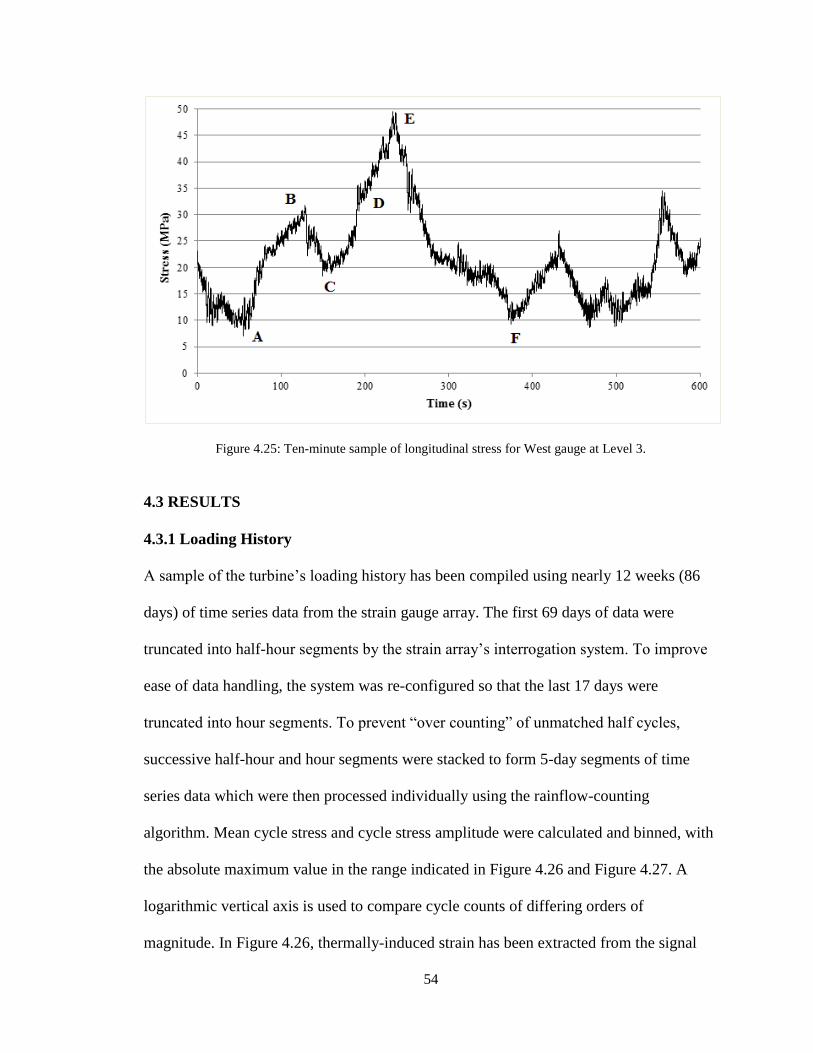
Figure 4.26: Mechanically-induced loading cycle spectra for study period. .................... 55
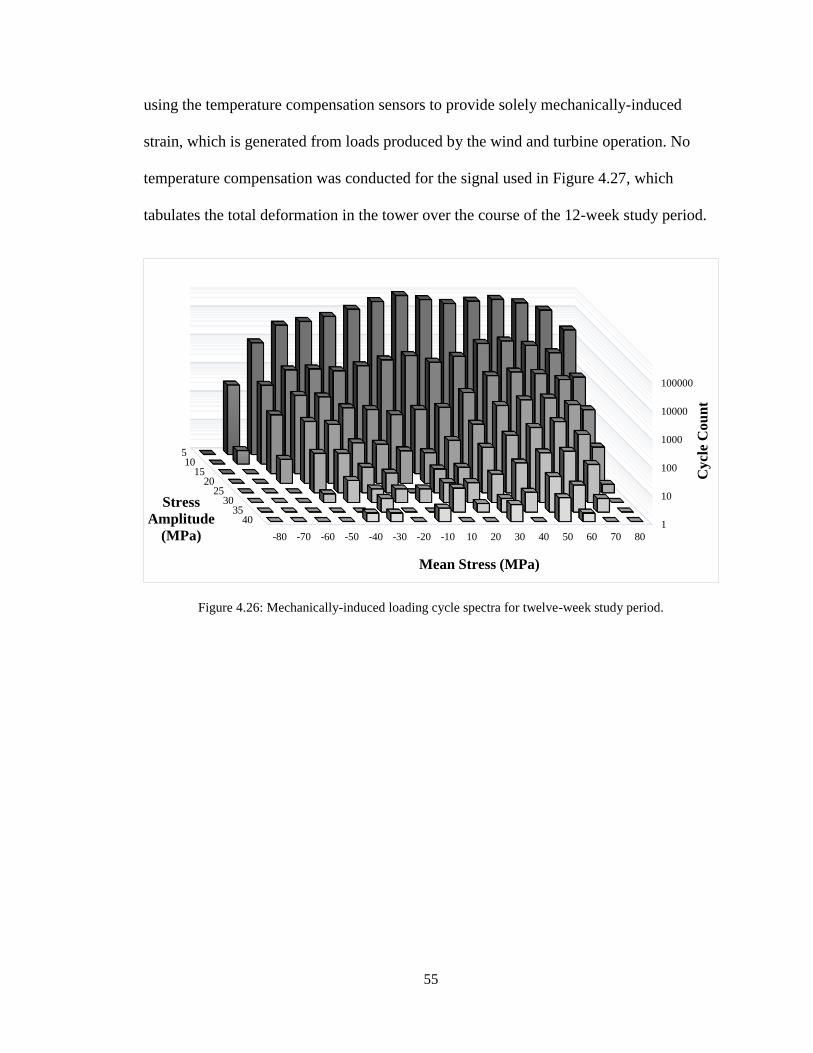
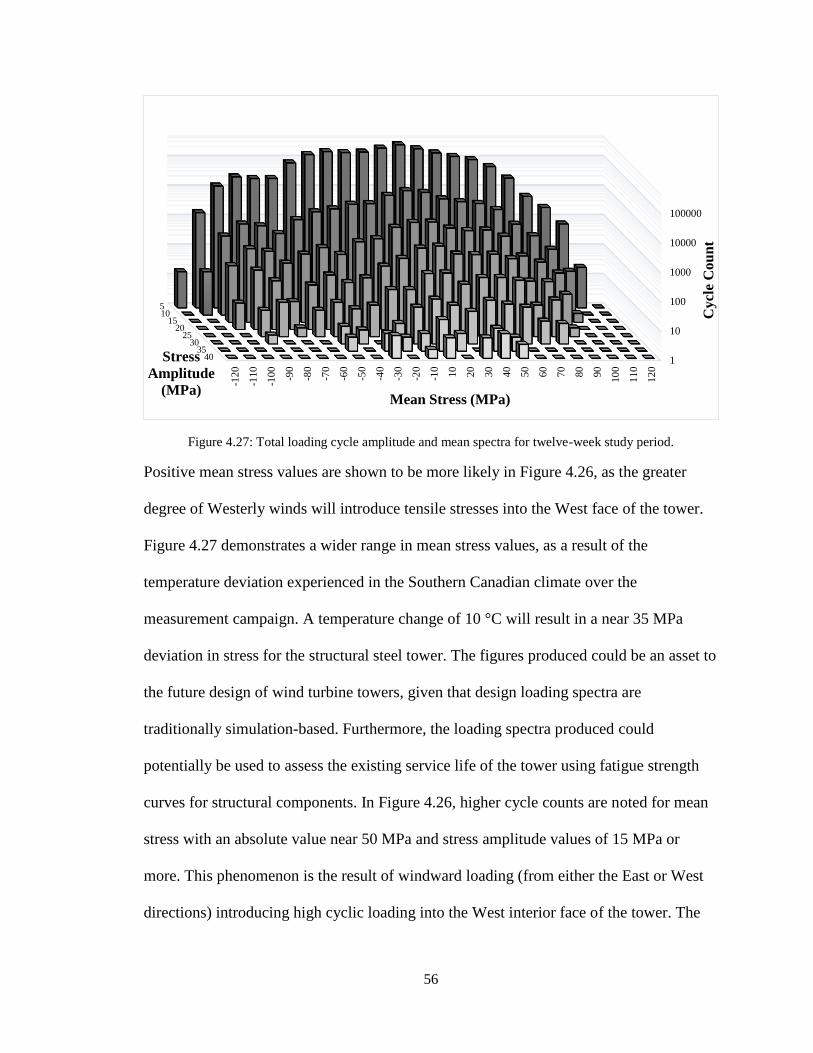
Figure 4.27: Total loading cycle amplitude and mean spectra for study period. .............. 56
Figure 4.28: Loading cycle amplitude spectra. ................................................................. 57
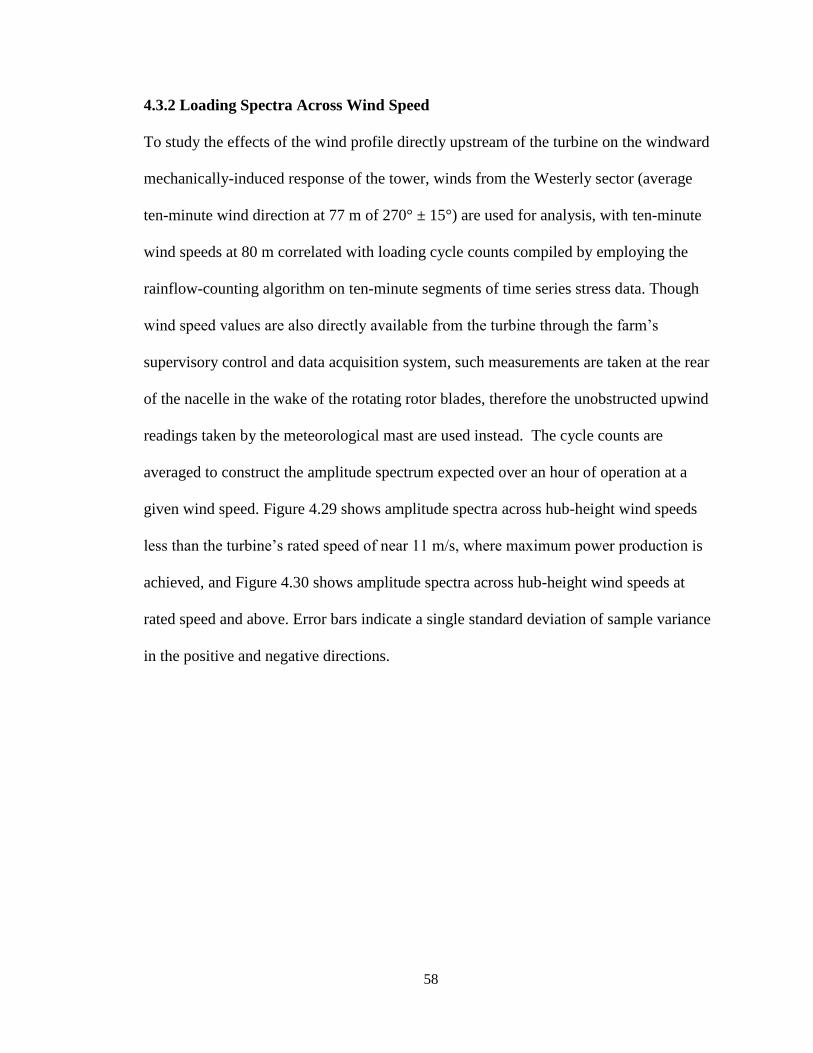
Figure 4.29: Loading amplitude spectra for hour of operation below rated speed. .......... 59
Figure 4.30: Loading amplitude spectra for hour of operation at and above rated speed. 59
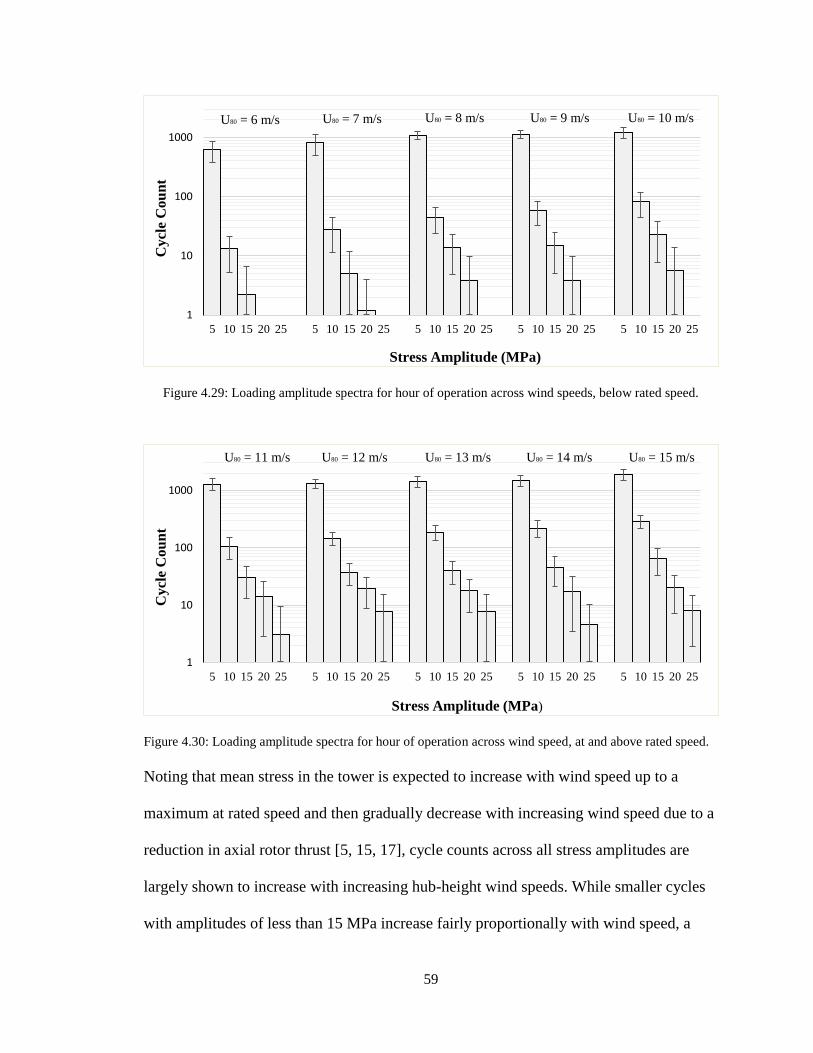
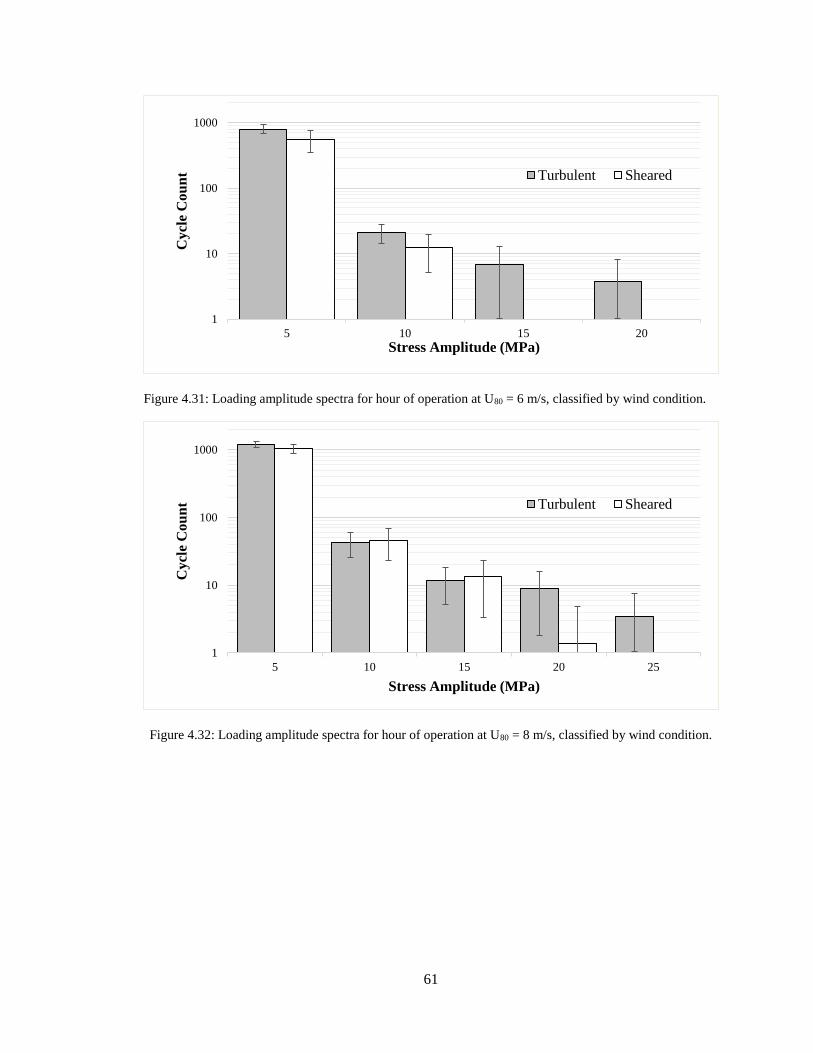
Figure 4.31: Loading amplitude spectra at U80 = 6 m/s, classified by wind condition. .... 61
Figure 4.32: Loading amplitude spectra at U80 = 8 m/s, classified by wind condition. .... 61
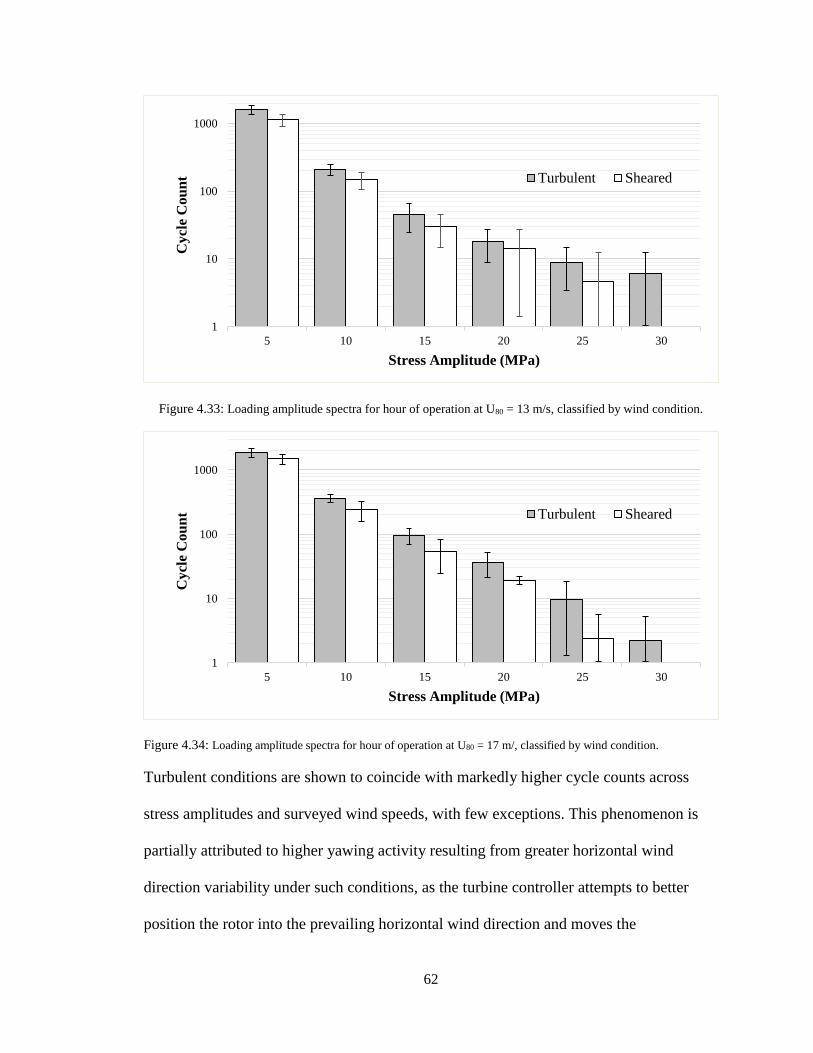
Figure 4.33: Loading amplitude spectra at U80 = 13 m/s, classified by wind condition. .. 62
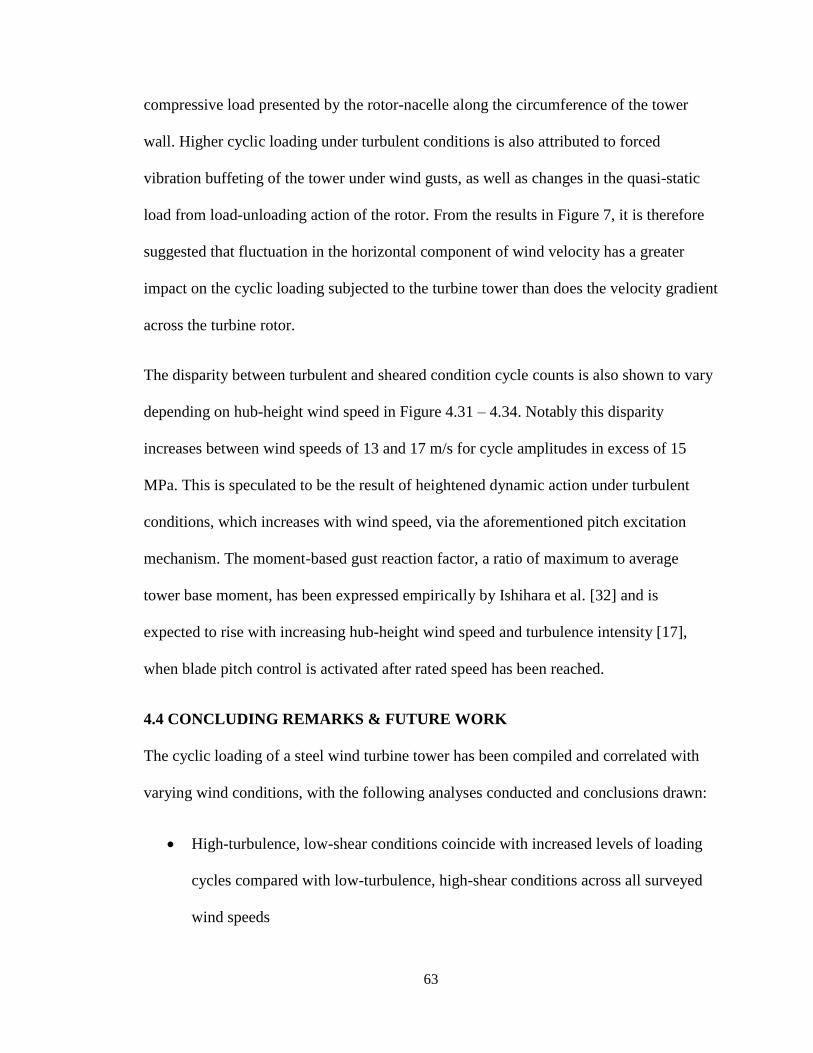
Figure 4.34: Loading amplitude spectra at U80 = 17 m/, classified by wind condition. ... 62
Page 13
1
CHAPTER 1
Introduction
Wind conditions can be subject to significant diurnal and seasonal variation with
potential implications for the power collection and structural loading of commercial-sized
horizontal-axis wind turbines operating in onshore environments. As modern
commercially-available turbine hub heights and rotor diameters continue to increase,
blades are projected into higher reaches of the atmospheric boundary layer, causing an
increase in the complexity of the approaching wind profile across the rotor. To optimize
turbine design and reduce associated uncertainties with prospective wind farm site
assessment, a more thorough understanding of the impacts of inflow parameters on all
aspects of turbine operation must be developed.
The content of this research is a continuation of the work that has previously been
conducted by the University of Windsor through the research partnership maintained with
a commercial wind farm operator in Southwestern Ontario, which has granted access to
an individual turbine for instrumentation of the tower and to operational data from across
the farm. Mourad (2010) [1] constructed a numerical modal model and physical model
for a commercial-scale horizontal-axis wind turbine tower, and proposed a potential
instrumentation system to monitor structural response. Preliminary modal analysis was
also conducted via forced excitation of the full-sized turbine tower by an impact
sledgehammer. Through the use of discrete wavelet transform signal processing, Bassett
et al. (2010, 2011) [2, 3] analyzed the frequency content of turbine tower vibration during
varying operational states in order to assemble the healthy baseline for a structural health
monitoring scheme. Bas et al. (2012) [4, 5] characterized the strain response of the tower
Page 14
2
to transient turbine operational events, such as rotor re-positioning and manual shutdown.
The fiber Bragg grating optical strain gauge array employed by Bas et al. will similarly
be used in this research study. McKay et al. (2011, 2013) [6, 7] proposed and investigated
potential impacts of the wakes of operating wind turbines and quantified the sensitivity of
wind turbine power production to varying operational parameters (2013) [8].
The purpose of this work is to utilize the wealth of data collected over a measurement
campaign spanning several months of Fall 2011 and early Winter 2012 at the
aforementioned wind farm to investigate impacts of inflow parameters and operating
conditions on the structural response and power production of a commercial-scale wind
turbine operating onshore. The three primary sources of data used to conduct this
research were as follows:
Longitudinal strain recorded by the fiber Bragg grating optical strain gauge array
affixed to the interior of the hollow cylindrical steel tower of a turbine onsite.
Wind inflow parameters recorded by a meteorological mast, in close proximity to
the instrumented turbine, outfitted with an array of wind sensors at multiple
elevations.
Turbine operational parameters recorded by the supervisory control and data
acquisition (SCADA) system in place at the farm.
The research in this study is composed of three individual papers. The first of which,
intended as a paper to be submitted at the 2014 Offshore Energy & Storage Symposium
and potentially expanded to be submitted to a peer-reviewed journal, provides a brief
description of the diurnal patterns observed in atmospheric conditions at the studied wind
Page 15
3
farm site over the course of the measurement campaign, and the resulting effects of
changing wind conditions on turbine power production.
The second paper, to be submitted to the Journal of Wind Engineering & Industrial
Aerodynamics, investigates the flexural loading of a full-sized turbine tower during
varying modes of operation and under changing inflow parameters.
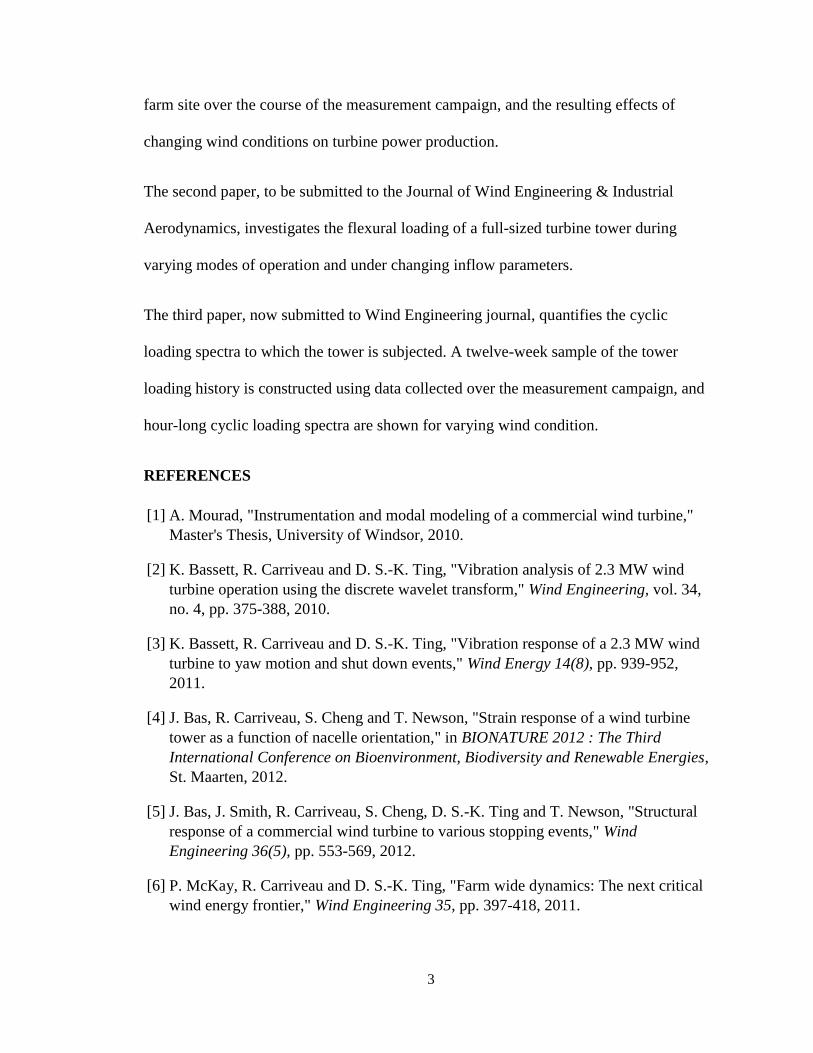
The third paper, now submitted to Wind Engineering journal, quantifies the cyclic
loading spectra to which the tower is subjected. A twelve-week sample of the tower
loading history is constructed using data collected over the measurement campaign, and
hour-long cyclic loading spectra are shown for varying wind condition.
REFERENCES
[1] A. Mourad, "Instrumentation and modal modeling of a commercial wind turbine,"
Master's Thesis, University of Windsor, 2010.
[2] K. Bassett, R. Carriveau and D. S.-K. Ting, "Vibration analysis of 2.3 MW wind
turbine operation using the discrete wavelet transform," Wind Engineering, vol. 34,
no. 4, pp. 375-388, 2010.
[3] K. Bassett, R. Carriveau and D. S.-K. Ting, "Vibration response of a 2.3 MW wind
turbine to yaw motion and shut down events," Wind Energy 14(8), pp. 939-952,
2011.
[4] J. Bas, R. Carriveau, S. Cheng and T. Newson, "Strain response of a wind turbine
tower as a function of nacelle orientation," in BIONATURE 2012 : The Third
International Conference on Bioenvironment, Biodiversity and Renewable Energies,
St. Maarten, 2012.
[5] J. Bas, J. Smith, R. Carriveau, S. Cheng, D. S.-K. Ting and T. Newson, "Structural
response of a commercial wind turbine to various stopping events," Wind
Engineering 36(5), pp. 553-569, 2012.
[6] P. McKay, R. Carriveau and D. S.-K. Ting, "Farm wide dynamics: The next critical
wind energy frontier," Wind Engineering 35, pp. 397-418, 2011.
Page 16
4
[7] P. McKay, R. Carriveau and D. S.-K. Ting, "Wake impacts on downstream wind
turbine performance and yaw alignment," Wind Energy, vol. 16, pp. 221-234, 2013.
[8] P. McKay, R. Carriveau, D. S.-K. Ting and J. L. Johrendt, "Global sensitivity
analysis of wind turbine power output," Wind Energy, 2013.
Page 17
5
CHAPTER 2
Wind Turbine Power Production Under Changing Wind Profile
Jamie C. Smith, Rupp Carriveau, David S-K Ting
Turbulence and Energy Laboratory, Ed Lumley Centre for Engineering Innovation,
University of Windsor, Ontario, Canada
2.1 INTRODUCTION
International standards for evaluating commercial wind turbine power performance
require only hub height wind speed and air density to be recorded as the primary inflow
parameters for the formulation of power curves [1, 2], which makes the inherent
assumption that wind speeds vary only linearly across the turbine rotor. This assumption
disregards the potential complexities in the approaching wind profile that can arise from
nonlinear vertical wind speed gradient and atmospheric turbulence, which can vary
seasonally and diurnally even in simple, flat terrain. Wagner et al. [3] observed a wide
range in expected energy flux for wind speed profiles with the same speed at hub height
and at the same location. They instead recommended that an equivalent wind speed be
used that takes the average speed at multiple heights weighted by their corresponding
portion of the swept rotor area. Through the use of LiDAR (light detection and ranging)
remote sensing technology to construct vertical wind speed profiles and resulting
equivalent wind speeds, Wagner et al. [4] demonstrated a reduction in turbine power
curve uncertainty when compared with single hub height measurements taken by a
conventional anemometer. Antoniou et al. [5] used met masts and LiDAR remote sensing
to measure wind profiles in both flat and complex terrain. They similarly noted
considerable changes in wind profiles during seasonal and diurnal variation, including
Page 18
6
negative shear gradients at some heights leading to otherwise unexpected local maxima.
Use of LiDAR remote sensing by Frehlich & Kelley [6] also noted the potential for rapid
change in vertical profiles of wind speed and turbulent eddy size. Sumner & Masson [2]
observed a near 5% reduction in the expected annual energy production of a given wind
farm through consideration of an equivalent wind speed averaged across a rotor disk
versus the energy production predicted by hub height wind speeds alone; suggesting the
potential for single point measurements to overestimate available resources.
Wind conditions in the atmospheric boundary layer at onshore sites are subject to
significant variation driven by atmospheric stability. Atmospheric stability, or the
suppression of the vertical motion of air, is typically categorized into unstable, neutral,
and stable classes [7]. Further categorization can also be made into very unstable, slightly
unstable, very stable, etc. During daytime solar heating of the ground, air rises to produce
large-scale turbulent eddies; creating unstable, convective stability conditions
characterized by higher turbulence and relatively uniform wind speeds with increasing
elevation [8]. Overall wind speeds are also expected to be lower under unstable,
convective conditions. At night, the ground acts as a heat sink [2], and turbulent mixing is
reduced to create stable conditions characterized by lower turbulence and a highly
sheared vertical speed profile [8]. At certain sites, such stable conditions can give rise to
a nocturnal low level jet that form at elevations near the upper reaches of modern wind
turbine rotors [9]. Stability conditions defined as neutral arise in the transition between
atmospheric classes, and are characterized by relatively higher wind speeds with
moderate levels of turbulence and shear. Such neutral atmospheric stability can arise
during overcast conditions [10]. In recent years, attention has been given to inflow
Page 19
7
parameter effects on the power production of full-sized wind turbines operating in
commercial wind farms. At a wind farm site in the US Great Plains/Midwest region,
Rareshide et al. [11] found that higher shear values coincided with greater power
production across nearly all surveyed wind speeds below rated. For a high plains wind
farm site East of the Rocky Mountains in North America, Vanderwende & Lundquist
[12] found that unstable, convective winds produced greater power production for low-to-
moderate hub height wind speeds up to 12 m/s; with stable, sheared conditions producing
modest power gains at higher speeds. Wharton & Lundquist [13], however, found that
such stable, sheared conditions consistently improved turbine power performance at a
near-coastal farm in Western North America. Sumner & Masson [2] observed higher
turbine power coefficients for more turbulent conditions at a UK farm in flat, pastoral
terrain. The overall lack of consensus on the specific impacts of differing wind profile on
expected turbine power extraction suggests that such impacts could be unique to a given
site [12]. This study will characterize these impacts at a commercial wind farm in the
Great Lakes region of Southwestern Ontario, which has become a major area of growth
for large-scale wind energy use. The province of Ontario currently has in excess of 1700
MW of installed capacity, with 3000 MW scheduled to come online by the end of 2014
[14]. A 2.3 MW turbine at the studied wind farm operates near a meteorological mast,
outfitted with a vertical array of wind speed anemometers to assess two key inflow
parameters: vertical wind shear and horizontal turbulence intensity. Such measurement
will provide a more complete description of the approaching wind profile than the single
point measurements taken by the small meteorological station positioned at the rear of the
turbine nacelle. Diurnal patterns in the onsite atmospheric boundary layer will be
Page 20
8
observed over the six-month measurement campaign, and the power production of the
turbine will be investigated for comparable speeds under two major wind condition
classifications characterized by the wind profile measured by the meteorological mast.
2.2 EXPERIMENTAL SETUP
The turbine under study is a Siemens 2.3 MW MKII variable speed model employing
pitch control, and is one of eighty-eight others onsite at an onshore commercial wind
farm. With a rotor diameter of 93 m and hub height of 80 m, the swept rotor area of the
blades reach a minimum elevation of 34 m and a maximum elevation of 127 m above
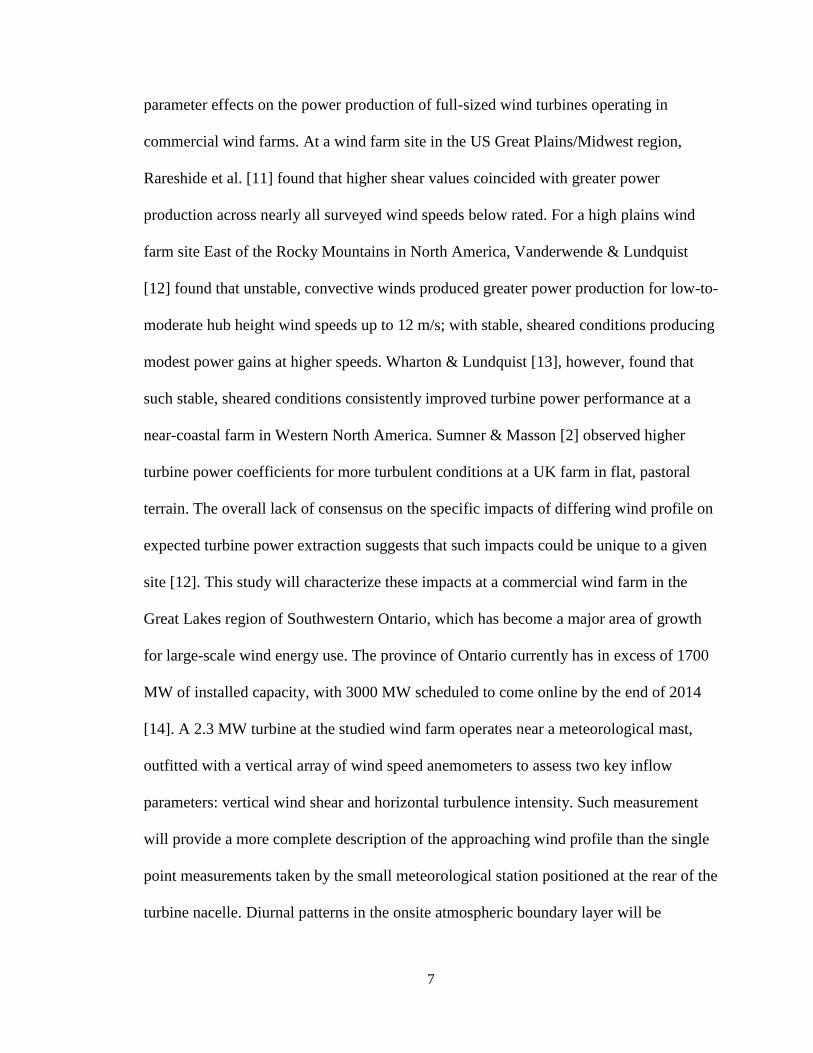
ground level. A meteorological mast is positioned 150 m West of the wind turbine, as
pictured in Figure 2.1 with the closest turbine also shown. The wind farm is sited in a
predominantly flat agricultural setting with some surrounding tree hedges. Lake Erie is
located 3100 m South of the turbine under study.
Figure 2.1: Aerial view of wind turbine under study and testing site layout [15].
Page 21
9
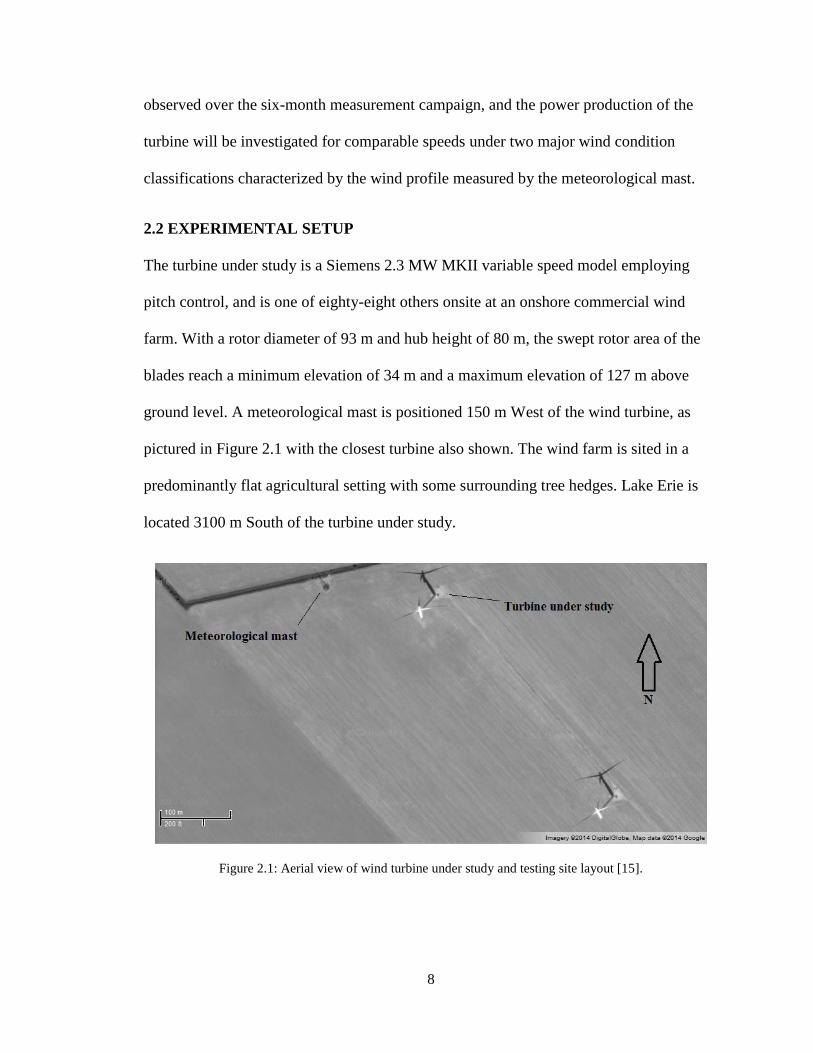
A North-facing view of the testing site is also shown in Figure 2.2, with the studied
turbine indicated in the background and the closest turbine in the foreground. The
meteorological mast is also depicted.
Figure 2.2: Ground view of the testing site layout.
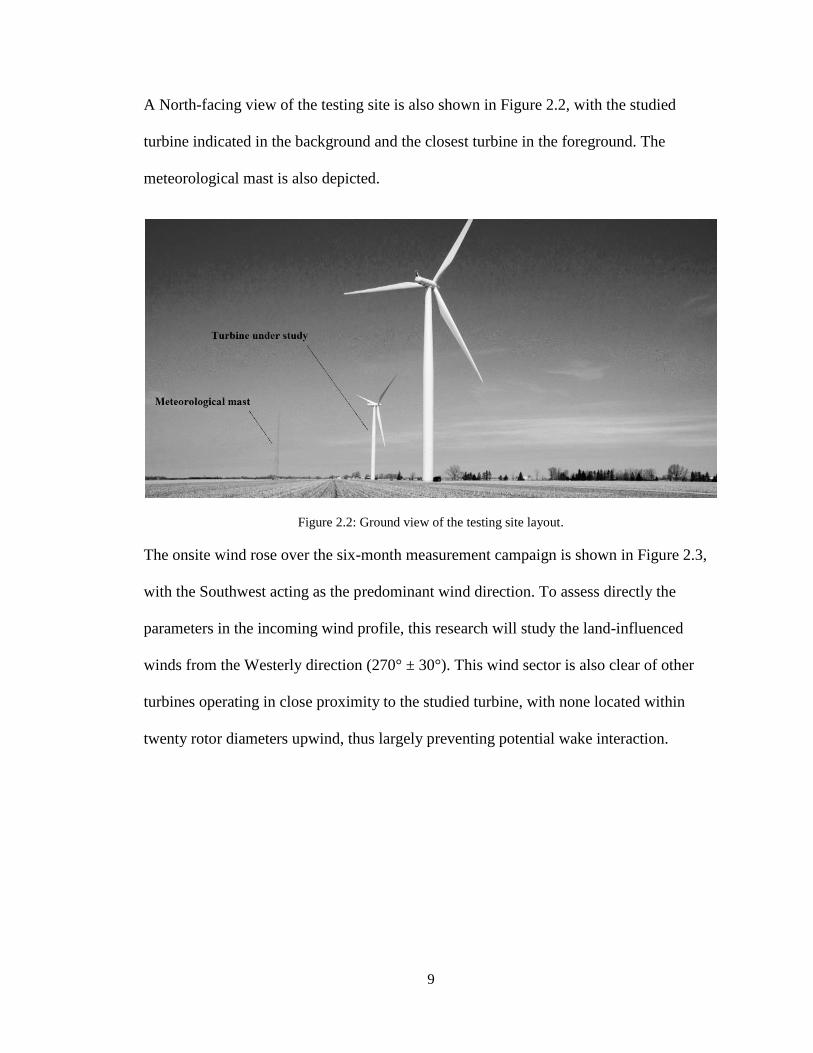
The onsite wind rose over the six-month measurement campaign is shown in Figure 2.3,
with the Southwest acting as the predominant wind direction. To assess directly the
parameters in the incoming wind profile, this research will study the land-influenced
winds from the Westerly direction (270° ± 30°). This wind sector is also clear of other
turbines operating in close proximity to the studied turbine, with none located within
twenty rotor diameters upwind, thus largely preventing potential wake interaction.
Page 22
10
Figure 2.3: Wind rose for direction probability over study period, as measured by meteorological mast.
The meteorological mast features five anemometers elevations spanning the bottom of
the swept rotor area to the hub height at elevations of 34, 61, 70, 77 and 80 m above
ground level. A short data sample has been included in Appendix A, showing the wind
speed data output from the mast. A wind vane is also located 77 m above ground level to
assess prevailing wind direction. Vertical wind shear is evaluated from using 10-minute
averages of the shear exponent given in the power law equation [16]:
U(z) = UR (z
zR)
α
(1)
where U is the mean horizontal wind speed at a given height z, and UR is the mean speed
at a given reference height zR. Turbulence levels are evaluated using the 10-minute hub
height horizontal turbulence intensity [17]:
𝐼𝑈 = 𝜎𝑢
𝑈 (2)
where σu and U are the horizontal wind speed standard deviation and mean at 80 m. Wind
conditions are categorized into two wind profile classes: turbulent and sheared.
0%
2%
4%
6%
8%
10%
12%
14%N
NNE
NE
ENE
E
ESE
SE
SSE
S
SSW
SW
WSW
W
WNW
NW
NNW
Page 23
11
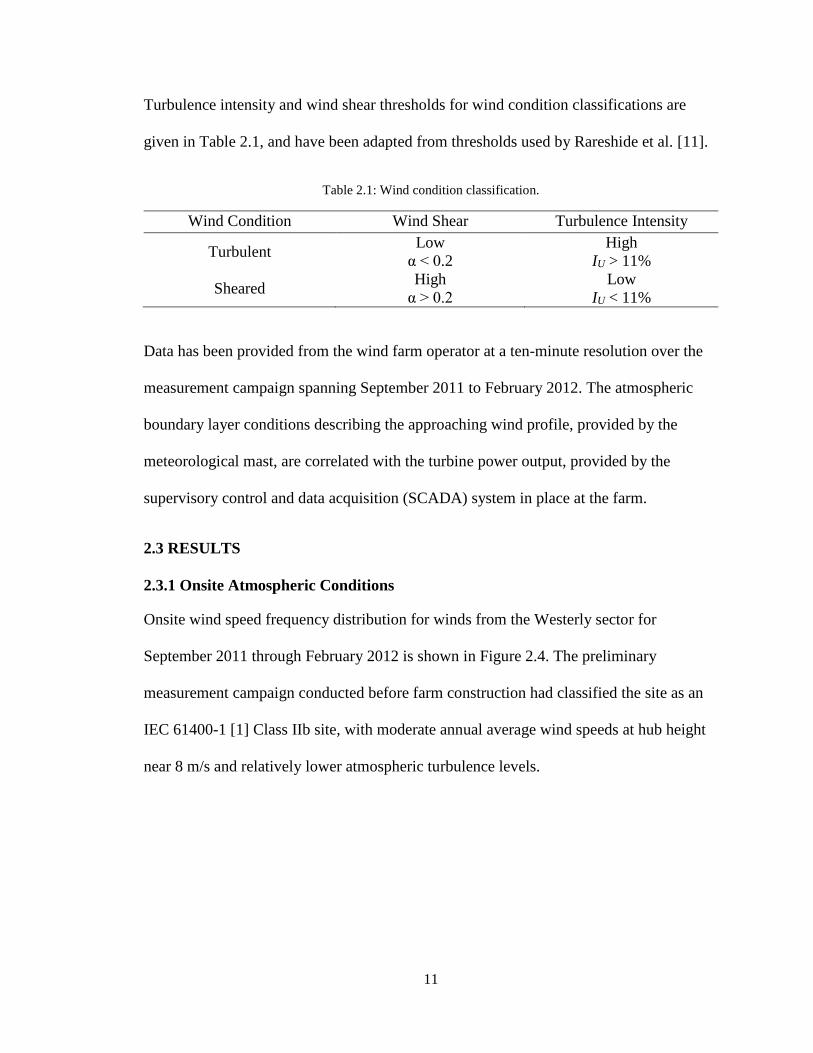
Turbulence intensity and wind shear thresholds for wind condition classifications are
given in Table 2.1, and have been adapted from thresholds used by Rareshide et al. [11].
Table 2.1: Wind condition classification.
Wind Condition Wind Shear Turbulence Intensity
Turbulent Low
α < 0.2
High
IU > 11%
Sheared High
α > 0.2
Low
IU < 11%
Data has been provided from the wind farm operator at a ten-minute resolution over the
measurement campaign spanning September 2011 to February 2012. The atmospheric
boundary layer conditions describing the approaching wind profile, provided by the
meteorological mast, are correlated with the turbine power output, provided by the
supervisory control and data acquisition (SCADA) system in place at the farm.
2.3 RESULTS
2.3.1 Onsite Atmospheric Conditions
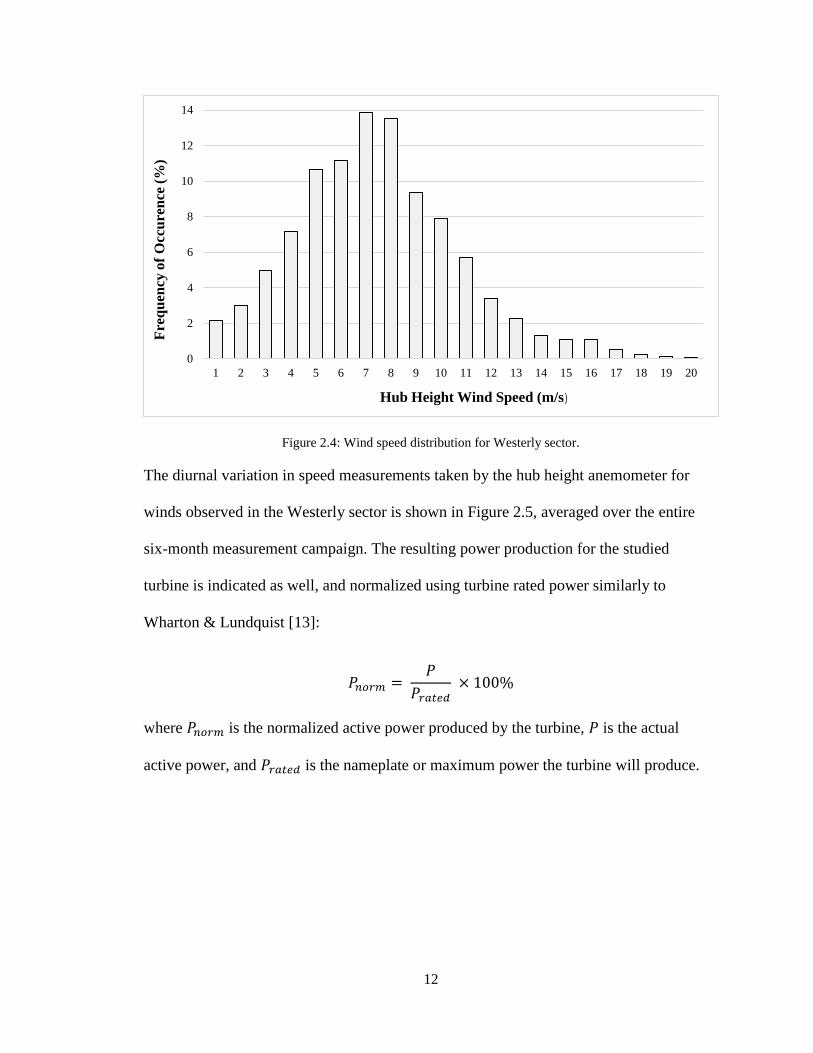
Onsite wind speed frequency distribution for winds from the Westerly sector for
September 2011 through February 2012 is shown in Figure 2.4. The preliminary
measurement campaign conducted before farm construction had classified the site as an
IEC 61400-1 [1] Class IIb site, with moderate annual average wind speeds at hub height
near 8 m/s and relatively lower atmospheric turbulence levels.
Page 24
12
Figure 2.4: Wind speed distribution for Westerly sector.
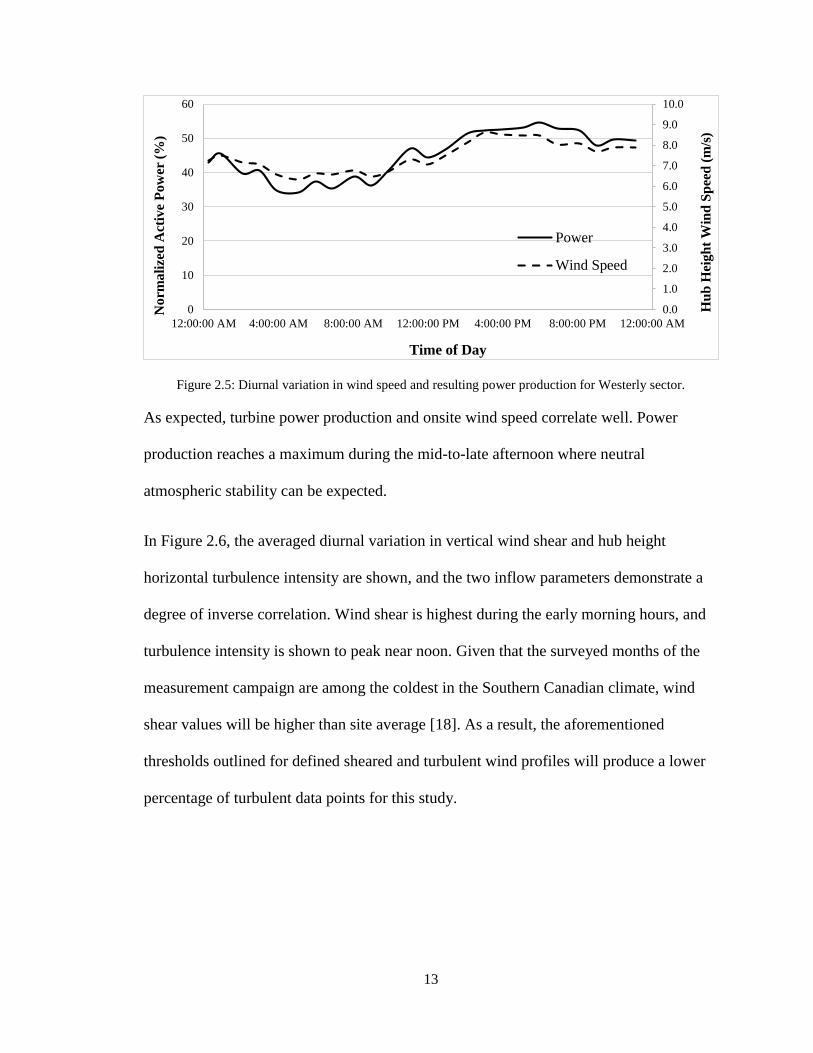
The diurnal variation in speed measurements taken by the hub height anemometer for
winds observed in the Westerly sector is shown in Figure 2.5, averaged over the entire
six-month measurement campaign. The resulting power production for the studied
turbine is indicated as well, and normalized using turbine rated power similarly to
Wharton & Lundquist [13]:
𝑃𝑛𝑜𝑟𝑚 = 𝑃
𝑃𝑟𝑎𝑡𝑒𝑑 × 100%
where 𝑃𝑛𝑜𝑟𝑚 is the normalized active power produced by the turbine, 𝑃 is the actual
active power, and 𝑃𝑟𝑎𝑡𝑒𝑑 is the nameplate or maximum power the turbine will produce.
0
2
4
6
8
10
12
14
1 2 3 4 5 6 7 8 9 10 11 12 13 14 15 16 17 18 19 20
Fre
qu
ency
of
Occ
ure
nce
(%
)
Hub Height Wind Speed (m/s)
Page 25
13
Figure 2.5: Diurnal variation in wind speed and resulting power production for Westerly sector.
As expected, turbine power production and onsite wind speed correlate well. Power
production reaches a maximum during the mid-to-late afternoon where neutral
atmospheric stability can be expected.
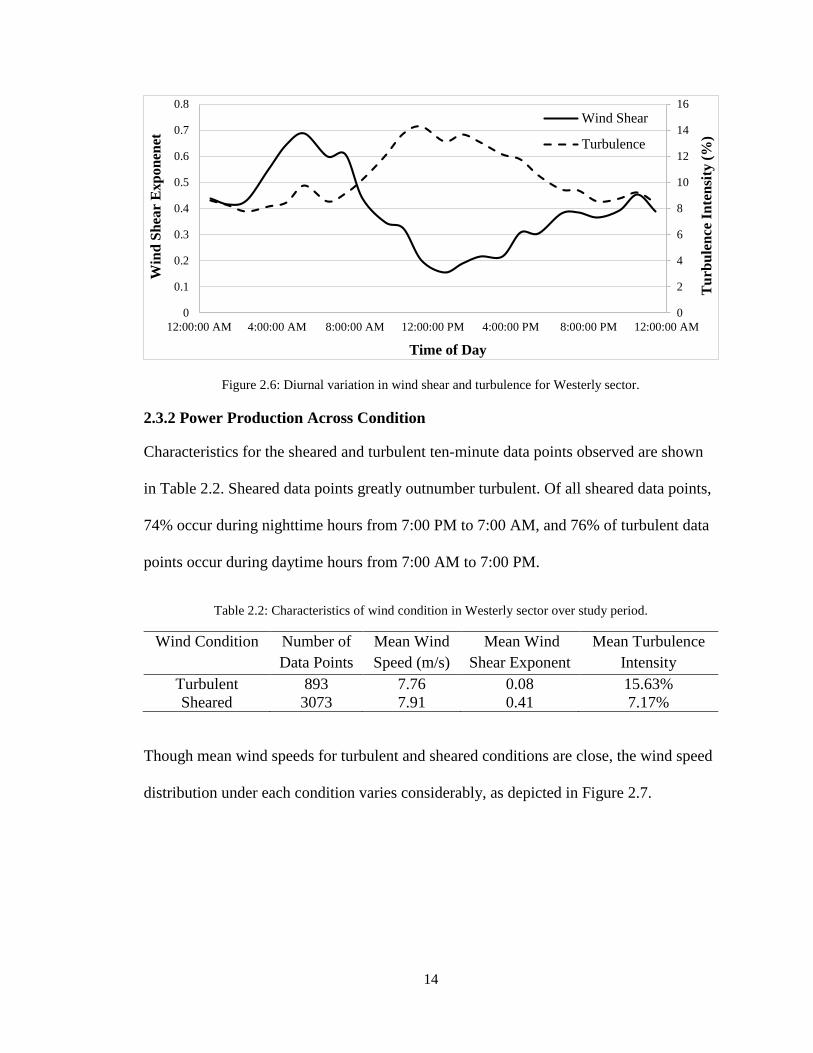
In Figure 2.6, the averaged diurnal variation in vertical wind shear and hub height
horizontal turbulence intensity are shown, and the two inflow parameters demonstrate a
degree of inverse correlation. Wind shear is highest during the early morning hours, and
turbulence intensity is shown to peak near noon. Given that the surveyed months of the
measurement campaign are among the coldest in the Southern Canadian climate, wind
shear values will be higher than site average [18]. As a result, the aforementioned
thresholds outlined for defined sheared and turbulent wind profiles will produce a lower
percentage of turbulent data points for this study.
0.0
1.0
2.0
3.0
4.0
5.0
6.0
7.0
8.0
9.0
10.0
0
10
20
30
40
50
60
12:00:00 AM 4:00:00 AM 8:00:00 AM 12:00:00 PM 4:00:00 PM 8:00:00 PM 12:00:00 AM
Hu
b H
eigh
t W
ind
Sp
eed
(m
/s)
No
rma
lize
d A
ctiv
e P
ow
er (
%)
Time of Day
Power
Wind Speed
Page 26
14
Figure 2.6: Diurnal variation in wind shear and turbulence for Westerly sector.
2.3.2 Power Production Across Condition
Characteristics for the sheared and turbulent ten-minute data points observed are shown
in Table 2.2. Sheared data points greatly outnumber turbulent. Of all sheared data points,
74% occur during nighttime hours from 7:00 PM to 7:00 AM, and 76% of turbulent data
points occur during daytime hours from 7:00 AM to 7:00 PM.
Table 2.2: Characteristics of wind condition in Westerly sector over study period.
Wind Condition Number of
Data Points
Mean Wind
Speed (m/s)
Mean Wind
Shear Exponent
Mean Turbulence
Intensity
Turbulent 893 7.76 0.08 15.63%
Sheared 3073 7.91 0.41 7.17%
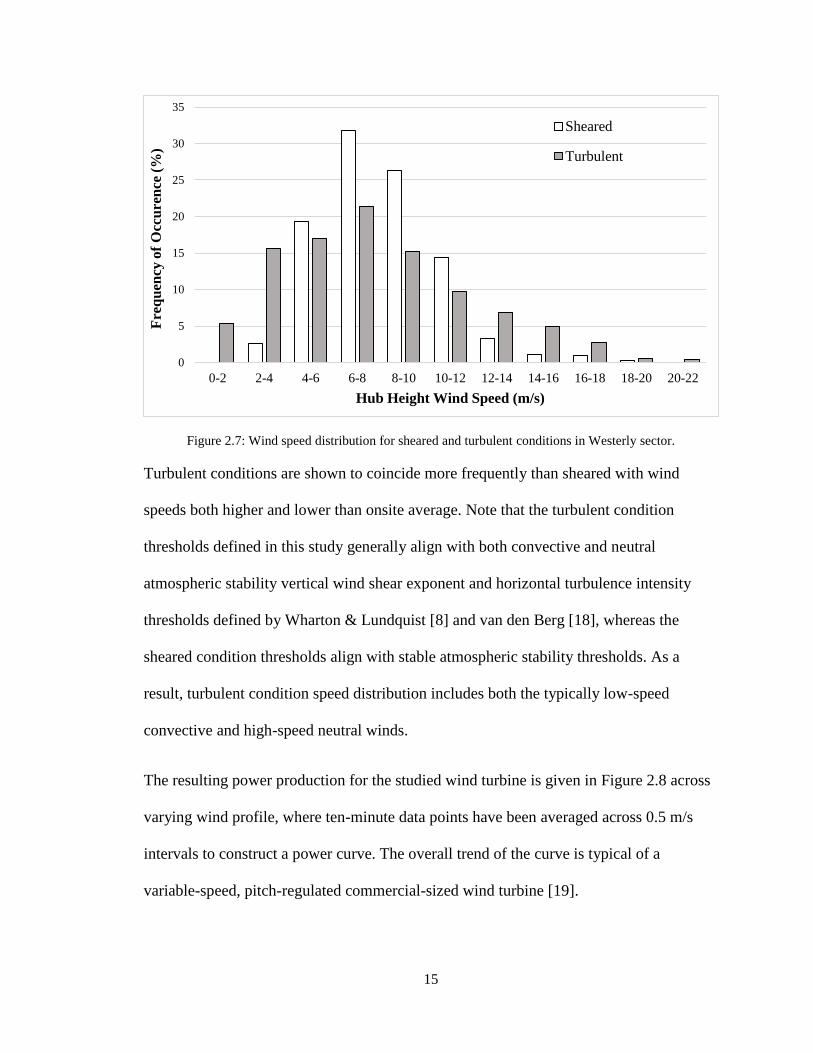
Though mean wind speeds for turbulent and sheared conditions are close, the wind speed
distribution under each condition varies considerably, as depicted in Figure 2.7.
0
2
4
6
8
10
12
14
16
0
0.1
0.2
0.3
0.4
0.5
0.6
0.7
0.8
12:00:00 AM 4:00:00 AM 8:00:00 AM 12:00:00 PM 4:00:00 PM 8:00:00 PM 12:00:00 AM
Tu
rbu
len
ce I
nte
nsi
ty (
%)
Win
d S
hea
r E
xp
on
enet
Time of Day
Wind Shear
Turbulence
Page 27
15
Figure 2.7: Wind speed distribution for sheared and turbulent conditions in Westerly sector.
Turbulent conditions are shown to coincide more frequently than sheared with wind
speeds both higher and lower than onsite average. Note that the turbulent condition
thresholds defined in this study generally align with both convective and neutral
atmospheric stability vertical wind shear exponent and horizontal turbulence intensity
thresholds defined by Wharton & Lundquist [8] and van den Berg [18], whereas the
sheared condition thresholds align with stable atmospheric stability thresholds. As a
result, turbulent condition speed distribution includes both the typically low-speed
convective and high-speed neutral winds.
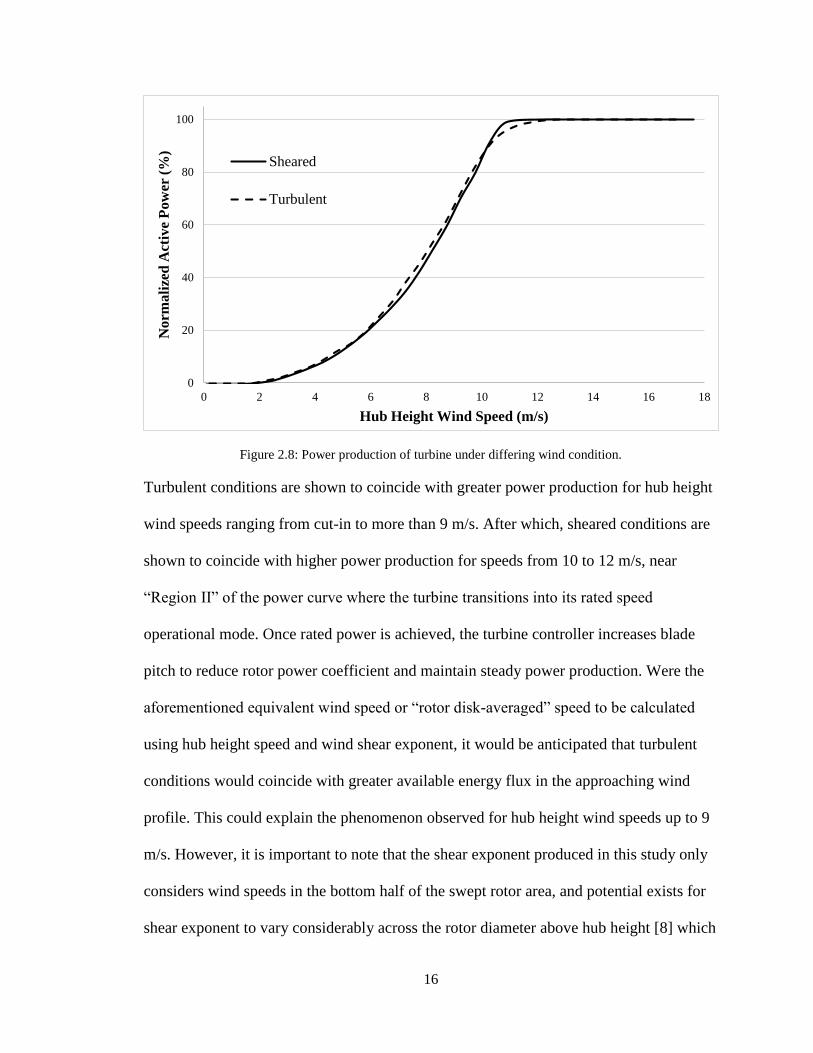
The resulting power production for the studied wind turbine is given in Figure 2.8 across
varying wind profile, where ten-minute data points have been averaged across 0.5 m/s
intervals to construct a power curve. The overall trend of the curve is typical of a
variable-speed, pitch-regulated commercial-sized wind turbine [19].
0
5
10
15
20
25
30
35
0-2 2-4 4-6 6-8 8-10 10-12 12-14 14-16 16-18 18-20 20-22
Fre
qu
ency
of
Occ
ure
nce
(%
)
Hub Height Wind Speed (m/s)
Sheared
Turbulent
Page 28
16
Figure 2.8: Power production of turbine under differing wind condition.
Turbulent conditions are shown to coincide with greater power production for hub height
wind speeds ranging from cut-in to more than 9 m/s. After which, sheared conditions are
shown to coincide with higher power production for speeds from 10 to 12 m/s, near
“Region II” of the power curve where the turbine transitions into its rated speed
operational mode. Once rated power is achieved, the turbine controller increases blade
pitch to reduce rotor power coefficient and maintain steady power production. Were the
aforementioned equivalent wind speed or “rotor disk-averaged” speed to be calculated
using hub height speed and wind shear exponent, it would be anticipated that turbulent
conditions would coincide with greater available energy flux in the approaching wind
profile. This could explain the phenomenon observed for hub height wind speeds up to 9
m/s. However, it is important to note that the shear exponent produced in this study only
considers wind speeds in the bottom half of the swept rotor area, and potential exists for
shear exponent to vary considerably across the rotor diameter above hub height [8] which
0
20
40
60
80
100
0 2 4 6 8 10 12 14 16 18
No
rma
lize
d A
ctiv
e P
ow
er (
%)
Hub Height Wind Speed (m/s)
Sheared
Turbulent
Page 29
17
would be undetectable given the currently available anemometry instrumentation at the
wind farm site. At winds speeds closer to rated, the more variable incoming wind speed
expected under turbulent conditions could adversely affect expected turbine performance
within the measured ten-minute periods. For example, for a ten-minute period having an
average wind speed near 11 m/s but with a high level of variance: higher winds within
this period will produce power no greater than rated, but lower winds within this period
will produce power less than rated. As a result, the average power the turbine will
produce over this ten-minute period will be less than if the wind speed were more
consistently near 11 m/s. A review of current literature does not produce an exact
consensus for the anticipated effects of atmospheric turbulence intensity on rotor power
coefficient, but the results suggest potential benefits to power production in the low-to-
moderate wind speed range and a detrimental effect in the higher wind speed range
before rated power is achieved, at least for this study site. The disparity in power
production across wind condition is shown in greater detail in Figure 2.9, where power
production is shown for wind speeds from 6 to 12 m/s, with a single standard deviation
indicated.
Page 30
18
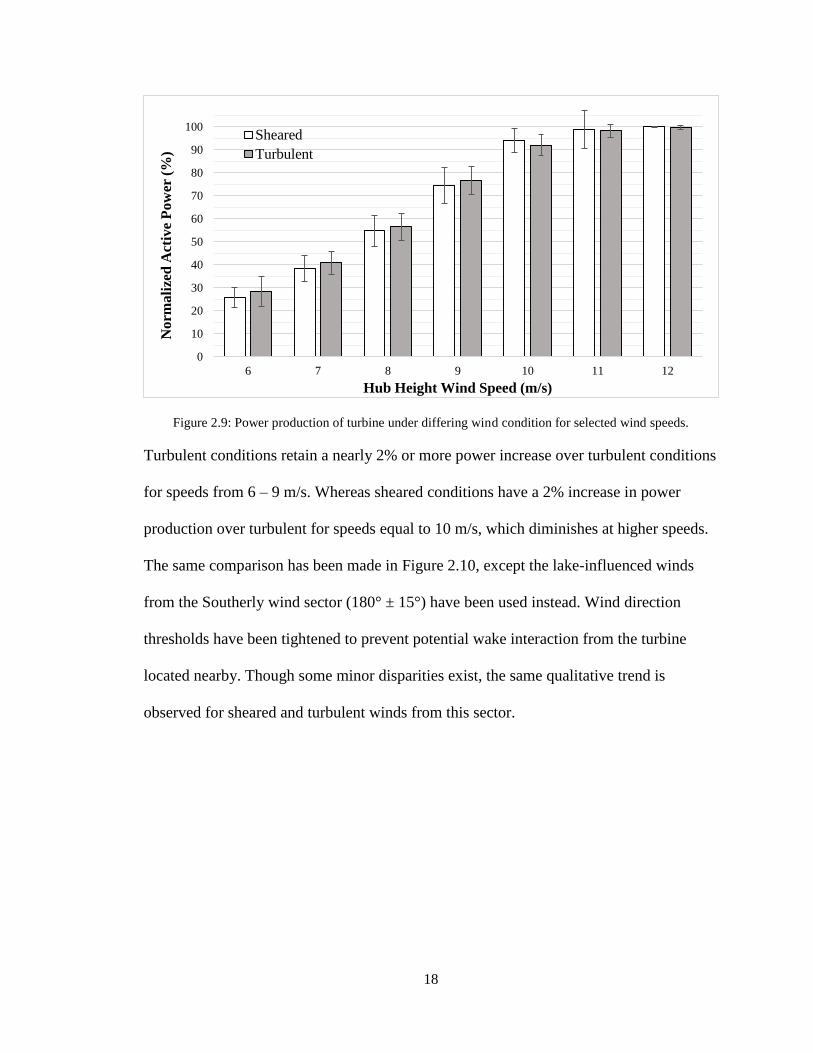
Figure 2.9: Power production of turbine under differing wind condition for selected wind speeds.
Turbulent conditions retain a nearly 2% or more power increase over turbulent conditions
for speeds from 6 – 9 m/s. Whereas sheared conditions have a 2% increase in power
production over turbulent for speeds equal to 10 m/s, which diminishes at higher speeds.
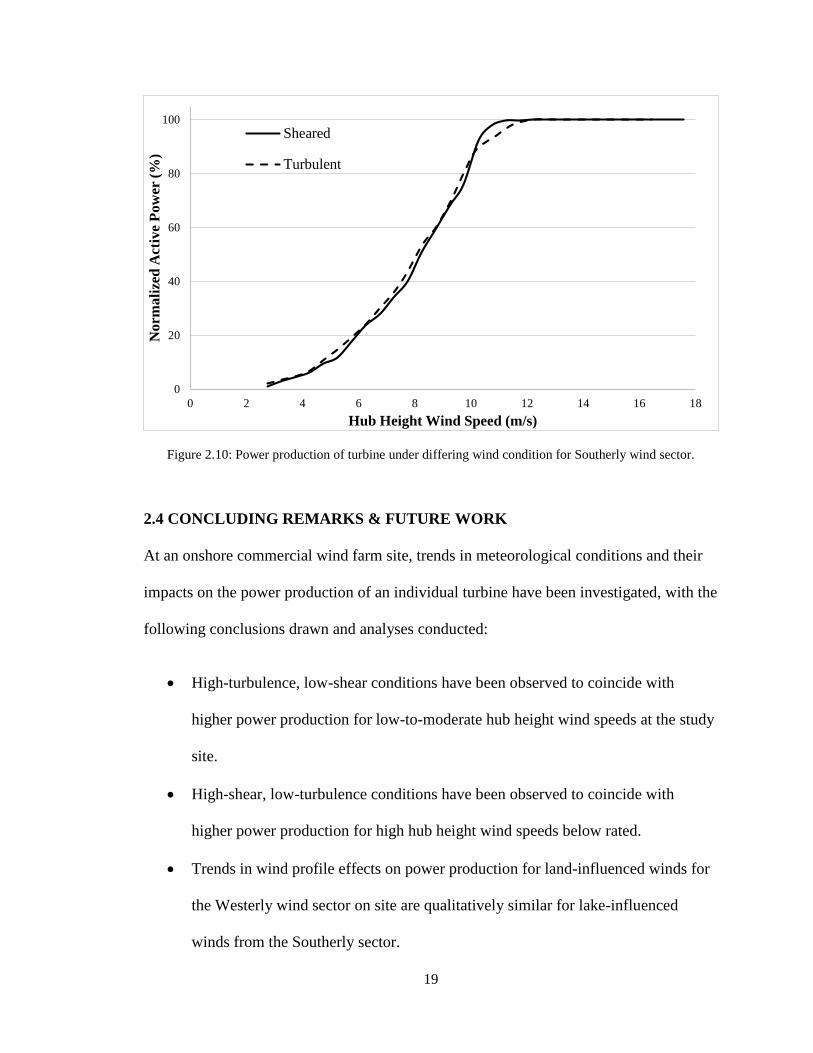
The same comparison has been made in Figure 2.10, except the lake-influenced winds
from the Southerly wind sector (180° ± 15°) have been used instead. Wind direction
thresholds have been tightened to prevent potential wake interaction from the turbine
located nearby. Though some minor disparities exist, the same qualitative trend is
observed for sheared and turbulent winds from this sector.
0
10
20
30
40
50
60
70
80
90
100
6 7 8 9 10 11 12
No
rma
lize
d A
ctiv
e P
ow
er (
%)
Hub Height Wind Speed (m/s)
Sheared
Turbulent
Page 31
19
Figure 2.10: Power production of turbine under differing wind condition for Southerly wind sector.
2.4 CONCLUDING REMARKS & FUTURE WORK
At an onshore commercial wind farm site, trends in meteorological conditions and their
impacts on the power production of an individual turbine have been investigated, with the
following conclusions drawn and analyses conducted:
High-turbulence, low-shear conditions have been observed to coincide with
higher power production for low-to-moderate hub height wind speeds at the study
site.
High-shear, low-turbulence conditions have been observed to coincide with
higher power production for high hub height wind speeds below rated.
Trends in wind profile effects on power production for land-influenced winds for
the Westerly wind sector on site are qualitatively similar for lake-influenced
winds from the Southerly sector.
0
20
40
60
80
100
0 2 4 6 8 10 12 14 16 18
No
rma
lize
d A
ctiv
e P
ow
er (
%)
Hub Height Wind Speed (m/s)
Sheared
Turbulent
Page 32
20
Diurnal variation in atmospheric conditions were observed over the measurement
campaign, with identifiable peaks in turbulence intensity and wind shear
observed.
Future analyses could look to include data collected from the warmer months at the
studied site. Furthermore, collecting wind speed measurements at elevations in excess of
hub height could help to better explain the observed disparity in power production for
changing wind conditions. Use of remote sensing technology such as LiDAR or SoDAR
(sonic detection and ranging) could facilitate such measurements, and could be operated
at ground level without the need to construct a meteorological mast.
REFERENCES
[1] International Electrotechnical Commission, "IEC 61400-1 ed.3 Wind turbines - Part
1: Design requirements," Geneva, 2005.
[2] J. Sumner and C. Masson, "Influence of atmospheric stability on wind turbine
power performance curves," Journal of Solar Energy Engineering, vol. 128, no. 4,
pp. 531-538, 2006.
[3] R. Wagner, I. Antoniou, S. M. Pedersen, M. S. Courtney and H. E. Jørgensen, "The
influence of the wind speed profile on wind turbine performance measurements,"
Wind Energy, vol. 12, no. 4, p. 348362, 2009.
[4] R. Wagner, H. E. Jørgensen, U. S. Paulsen, T. J. Larsen, I. Antoniou and L.
Thesbjerg, "Remote sensing used for power curves," in 14th Interntational
Symposium for the Advancement of Boundary Layer Remote Sensing, 2008.
[5] I. Antoniou, S. M. Pedersen and P. B. Enevoldsen, "Wind shear and uncertainties in
power curve measurement and wind resources," Wind Engineering, vol. 33, no. 5,
pp. 449-468, 2010.
[6] R. Frelich and N. Kelley, "Measurements of wind and turbulence profiles with
scanning Doppler lidar for wind energy applications," IEEE Journal of Selected
Topics in Applied Earth Observations and Remote Sensing, vol. 1, no. 1, pp. 42-47,
2008.
Page 33
21
[7] F. Pasquill, “The estimation of the dispersion of windborne material,” The
Meteorological Magazine, vol. 90, no. 1063, pp. 33-49, 1961.
[8] S. Wharton and J. K. Lundquist, "Assessing atmospheric stability and its impact on
rotor-disk wind characteristics at an offshore wind farm," Wind Energy, vol. 15, no.
4, pp. 525-546, 2012.
[9] R. M. Banta, Y. L. Pichugina, N. D. Kelley, B. Jonkman and W. A. Brewer,
"Doppler lidar measurements of the Great Plains low-level jet: Applications to wind
energy," in 14th International Symposium for the Advancement of Boundary Layer
Remote Sensing, 2008.
[10] R. L. Leonard, Air Quality Permitting, Florida: CRC Press, 1997.
[11] E. Rareshide, A. Tindal, C. Johnson, A. Graves, E. Simpson, J. Bleeg, T. Harris and
D. Schoborg, "Effects of complex wind regimes on turbine performance," in
Podium presentation at AWEA WINDPOWER 2009 Conference, Chicago, 2009.
[12] B. J. Vanderwende and J. K. Lundquist, "The modification of wind turbine
performance by statistically distinct atmospheric regimes," Environmental Research
Letters, vol. 7, 2012.
[13] S. Wharton and J. K. Lundquist, "Atmospheric stability affects wind turbine power
collection," Environmental Research Letters, vol. 7, 2012.
[14] Independent Electricity System Operator, "Wind Power Generation in Ontario,"
2013. [Online]. Available:
https://www.ieso.ca/imoweb/siteShared/windtracker.asp?sid=ic. [Accessed 10 04
2014].
[15] Google, "Google Maps," 2013. [Online]. Available: http://maps.google.ca/.
[Accessed 15 May 2013].
[16] O. G. Sutton, Atmospheric Turbulence, London: Methuen, 1949.
[17] T. Burton, D. Sharpe, N. Jenkins and E. Bossanyi, Wind Energy Handbook,
Chicester: John Wiley & Sons, 2001.
[18] G. P. van den Berg, "Wind turbine power and sound in relation to atmospheric
stability," Wind Energy 11(2), pp. 151-169, 2008.
[19] National Instruments, "Wind turbine control methods," Austin, 2008.
Page 34
22
CHAPTER 3
Effects of Wind Regime and Inflow Parameters on Wind Turbine
Tower Loading
Jamie C. Smith1, Phillip McKay2, Rupp Carriveau1, David S-K Ting1, Tim Newson3
1Turbulence and Energy Laboratory, Ed Lumley Centre for Engineering Innovation,
University of Windsor, Ontario, Canada
2Wind Energy Institute of Canada, North Cape, Prince Edward Island, Canada
3Department of Civil and Environmental Engineering, University of Western Ontario,
London, Ontario, Canada
3.1 INTRODUCTION
Having reached their practical size limit, the conventional rigid steel lattice towers of the
previous generation of utility-scale horizontal-axis wind turbines have given way to the
flexible steel tubular towers favoured in the modern wind energy industry [1]. The
slender nature of their construction [2], along with the heavy distribution of mass
presented by the rotor-nacelle positioned at a maximum elevation, create a turbine tower
structure characterized by low natural frequencies and low structural damping. Modern
towers are often of “soft” design having first bending modes situated between the first
and second multiples of the rotational frequency of the rotor [2] and damping ratios on
the order of 1% [3]. As the rotor size and tower height of commercial turbines continue to
increase in order to maximize power production, added importance is placed on assessing
the impacts of the aerodynamic instability presented by vertical wind shear and the gust-
induced buffeting effects of horizontal turbulence intensity. Wind profile inflow
parameters such as shear and turbulence can affect power production [4 - 6], fatigue
damage [7], and even turbine noise production [8].
Page 35
23
This study will use physical data collected from a full-size operating wind turbine at an
onshore commercial farm in Southwestern Ontario to assess the loading impacts of
varying onsite wind conditions and their respective inflow parameters. Previous studies
conducted on this turbine have characterized the frequency content of the vibration
response to form the baseline of a structural health monitoring scheme [9, 10] as well as
the strain response of the tower to transient events such as rotor re-positioning and
manual shutdown [11, 12]. Rebelo et al. [13, 3] correlated stress magnitudes in the shell
and pre-stressed bolts of a steel turbine tower across operational wind speeds, along with
the quantification of the resulting fatigue loading spectra and characterization of the
dynamic response and modal properties of the turbine tower structure. Muto et al. [14]
investigated the effects of wind speed and turbulence levels on the tower base bending
moment of an operating turbine. Numerical modelling has previously been conducted for
the design and optimization of turbine tower structures [15 -17] and the impacts of wind
gusts and atmospheric turbulence on tower loading [18 - 20]. The purpose of this work is
to investigate the impacts of varying wind profiles and inflow parameters on the flexural
loading imparted to a conventional steel tubular wind turbine tower; including
consideration of load quasi-static mean, maxima, and variance across changing inflow
wind speed, shear, and turbulence. Such insight into loading magnitudes can assist in the
ultimate limit states design of turbine towers, as well as providing the baseline of healthy
or expected response for structural health monitoring employed by the wind farm
operator.
Page 36
24
3.2 EXPERIMENTAL SETUP
3.2.1 Testing Site & Instrumented Turbine
The wind turbine under study is a Siemens 2.3 MW MKII variable-speed model with
blade pitch control. Rotor diameter and hub height measure 93 m and 80 m, respectively.
For ease of transportation and construction on-site, the hollow cylindrical steel tower
consists of three individual sections terminated by stiff flange sections that have been
bolted together. The tower measures 78.54 m in height, with an outer diameter that
measures 4220 mm at its base and 2452 mm at maximum elevation and a wall thickness
that measures 41 mm at its base and 22 mm at maximum elevation. The mass of the
tower accounts for half of the total mass of the turbine, excluding the foundation.
The studied turbine is one of eighty-eight machines at a commercial onshore wind farm
off the shores of Lake Erie, which is located more than 3000 m South of the studied
turbine. The farm is sited in an agricultural setting having predominantly flat terrain with
some surrounding tree hedges. The site has been classified as an IEC 61400-1 [21] Class
IIb site; having medium wind speeds (annual average close to 8 m/s) and relatively lower
turbulence levels. The 50-year return 3-second gust and 10-minute extreme wind speeds
at hub height have been quantified as 48 m/s and 34 m/s, respectively. Prevailing on-site
wind direction is from the Southwest, with roughly half of all wind direction
measurements falling between the Southerly and Westerly directions. No turbine is
located within twenty rotor diameters upwind of the turbine in this wind sector, which
suggests that wake interaction from other onsite turbines will be minimal in this sector.
A fiber Bragg grating (FBG) sensor array, as presented by Bas et al. [11, 12], measures
longitudinal deformation at 100 Hz on the North, South, East, and West interior faces of
Page 37
25
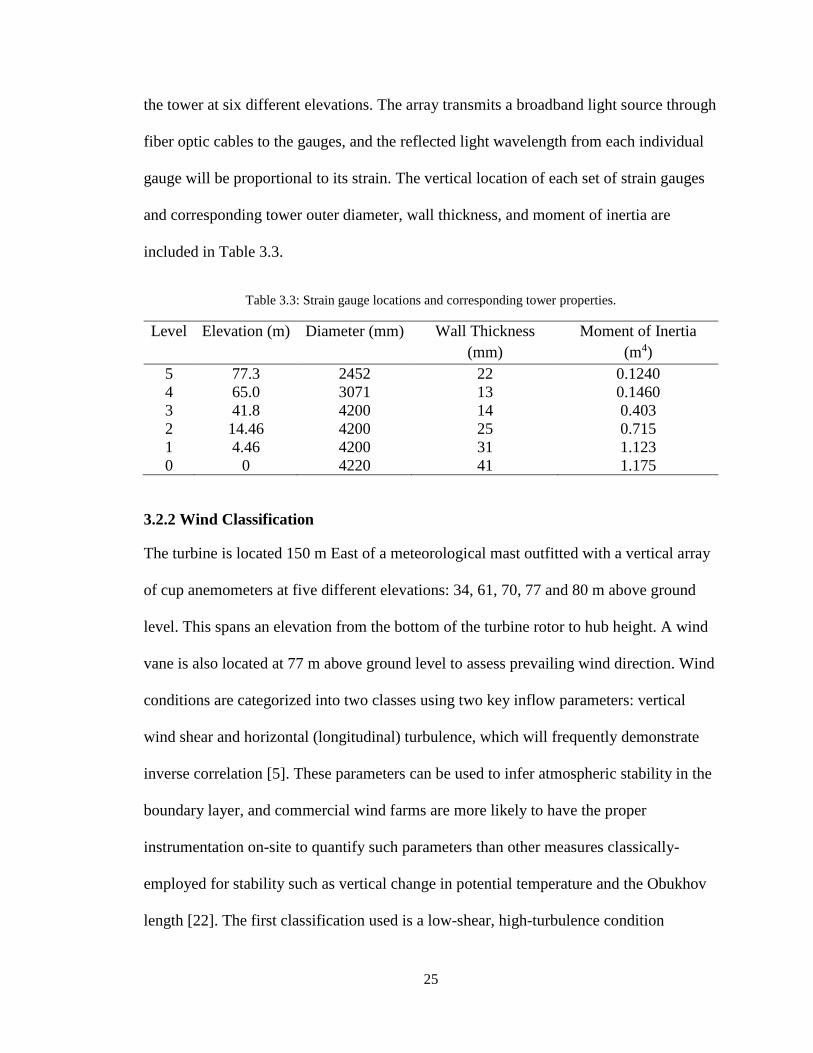
the tower at six different elevations. The array transmits a broadband light source through
fiber optic cables to the gauges, and the reflected light wavelength from each individual
gauge will be proportional to its strain. The vertical location of each set of strain gauges
and corresponding tower outer diameter, wall thickness, and moment of inertia are
included in Table 3.3.
Table 3.3: Strain gauge locations and corresponding tower properties.
Level Elevation (m) Diameter (mm) Wall Thickness
(mm)
Moment of Inertia
(m4)
5 77.3 2452 22 0.1240
4 65.0 3071 13 0.1460
3 41.8 4200 14 0.403
2 14.46 4200 25 0.715
1 4.46 4200 31 1.123
0 0 4220 41 1.175
3.2.2 Wind Classification
The turbine is located 150 m East of a meteorological mast outfitted with a vertical array
of cup anemometers at five different elevations: 34, 61, 70, 77 and 80 m above ground
level. This spans an elevation from the bottom of the turbine rotor to hub height. A wind
vane is also located at 77 m above ground level to assess prevailing wind direction. Wind
conditions are categorized into two classes using two key inflow parameters: vertical
wind shear and horizontal (longitudinal) turbulence, which will frequently demonstrate
inverse correlation [5]. These parameters can be used to infer atmospheric stability in the
boundary layer, and commercial wind farms are more likely to have the proper
instrumentation on-site to quantify such parameters than other measures classically-
employed for stability such as vertical change in potential temperature and the Obukhov
length [22]. The first classification used is a low-shear, high-turbulence condition
Page 38
26
referred to as “turbulent.” This condition describes the expected unstable, convective
wind profile produced by solar ground heating during the day which facilitates vertical
circulation of air masses in the atmospheric boundary layer. The second class is the
“sheared” condition characterized by high-shear and low-turbulence, which describes the
expected stable wind profile expected during stratification of airflow as the ground cools
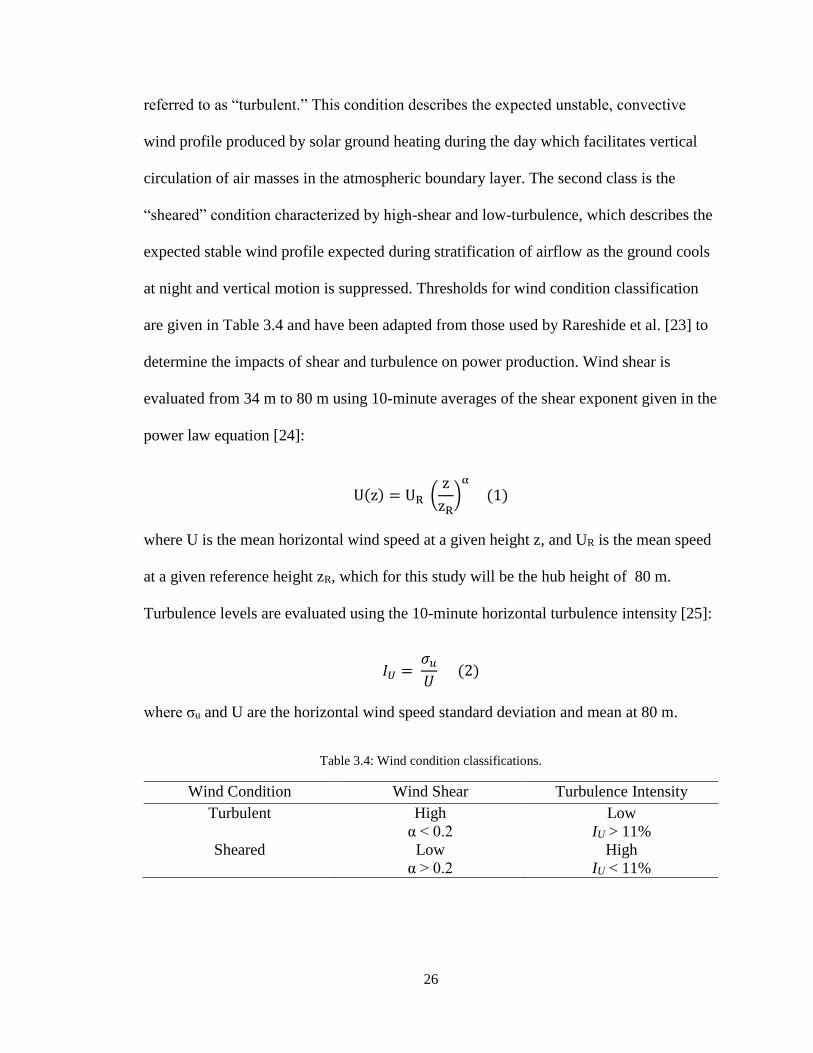
at night and vertical motion is suppressed. Thresholds for wind condition classification
are given in Table 3.4 and have been adapted from those used by Rareshide et al. [23] to
determine the impacts of shear and turbulence on power production. Wind shear is
evaluated from 34 m to 80 m using 10-minute averages of the shear exponent given in the
power law equation [24]:
U(z) = UR (z
zR)
α
(1)
where U is the mean horizontal wind speed at a given height z, and UR is the mean speed
at a given reference height zR, which for this study will be the hub height of 80 m.
Turbulence levels are evaluated using the 10-minute horizontal turbulence intensity [25]:
𝐼𝑈 = 𝜎𝑢
𝑈 (2)
where σu and U are the horizontal wind speed standard deviation and mean at 80 m.
Table 3.4: Wind condition classifications.
Wind Condition Wind Shear Turbulence Intensity
Turbulent High
α < 0.2
Low
IU > 11%
Sheared Low
α > 0.2
High
IU < 11%
Page 39
27
3.2.3 Signal Analysis
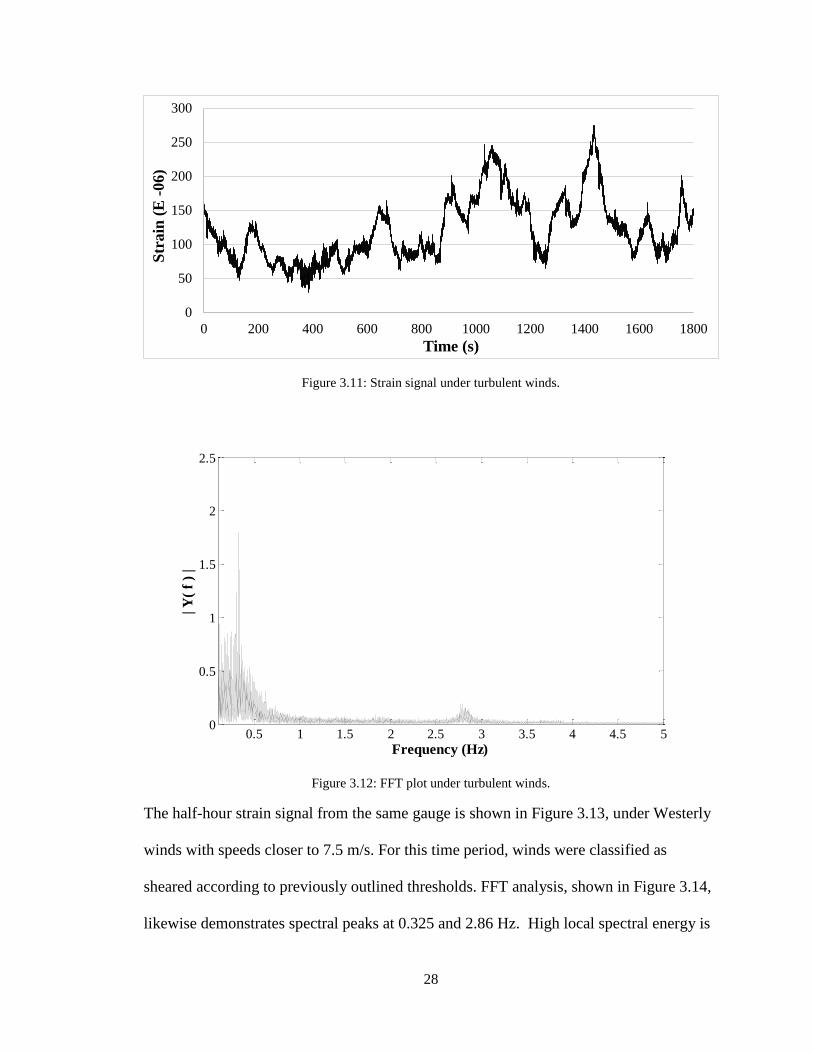
A half-hour sample of the strain signal produced by the FBG array at 100 Hz for the West
interior face near tower mid-height is shown in Figure 3.11. When the sample was
recorded, winds were coming from the Westerly sector at hub height speeds having an
average near 6.5 m/s and were classified as turbulent according to previously outlined
thresholds in Table 3.4. Though mean wind speed rises over the course of the sample
study period, the effects of prolonged gusts are also evident in the signal, as seen in the
short-term rise and fall of the tower strain. Such gusts acting on the turbine cause an
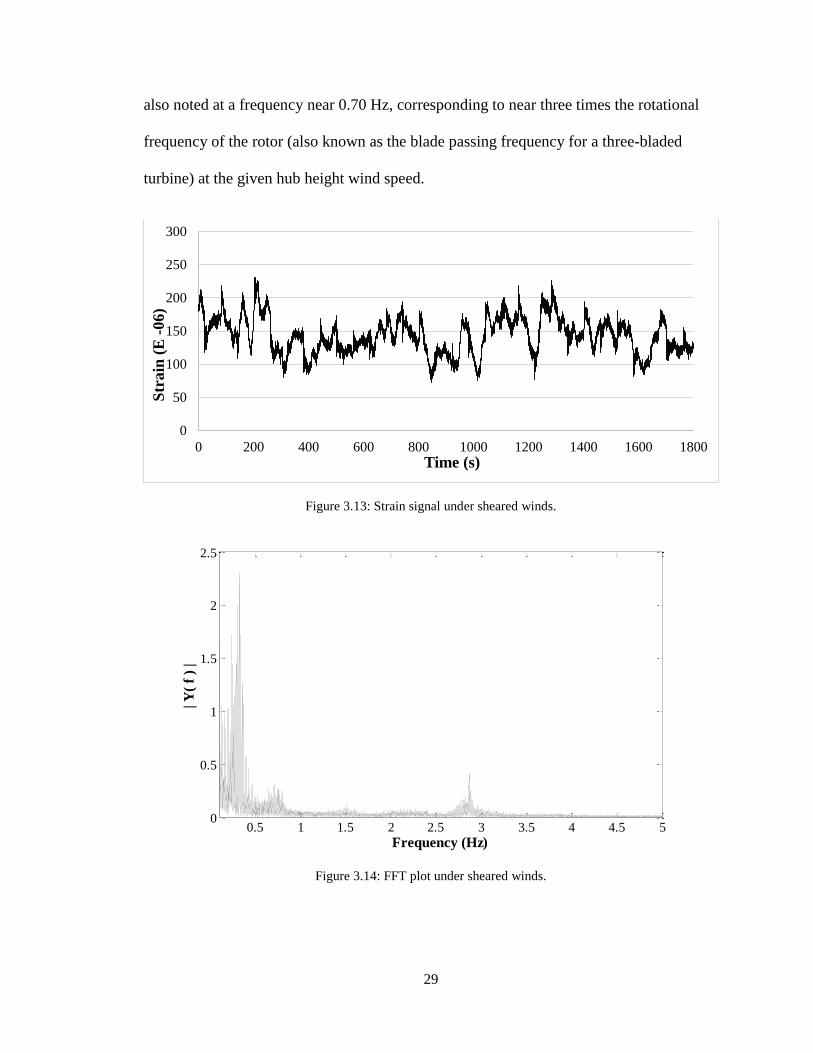
increase in tower quasi-static load, followed by periods of increased vibration. Applying
a fast Fourier transform (FFT) highlights a noticeable spectral peak at 0.325 Hz, as shown
in Figure 3.12. This frequency corresponds to the expected fundamental bending mode in
the fore-aft direction of a turbine structure of this size and capacity [3, 26]. A second,
lesser spectral peak is also observed near 2.80 Hz; speculated to be the second bending
mode frequency in the fore-aft direction of the turbine. Note that gust-induced vibration
is significant for structures with eigenfrequencies less than 2 Hz, given the high spectral
energy of boundary layer atmospheric turbulence in this range [27].
Page 40
28
Figure 3.11: Strain signal under turbulent winds.
Figure 3.12: FFT plot under turbulent winds.
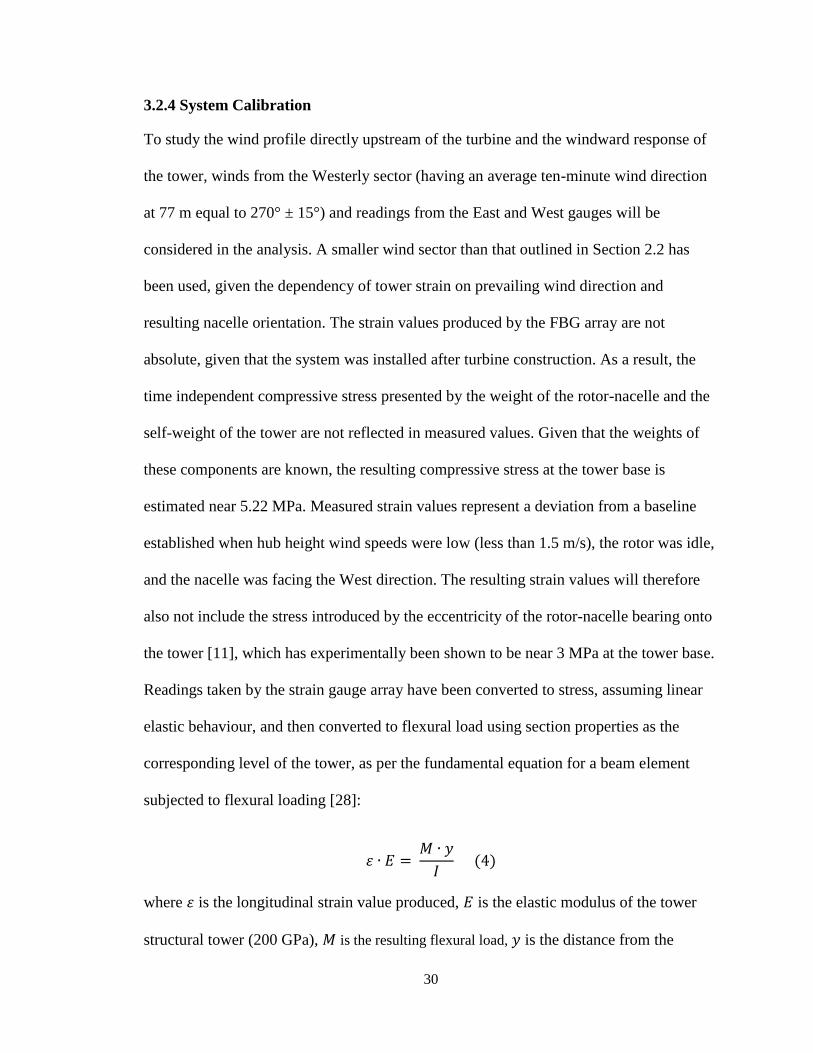
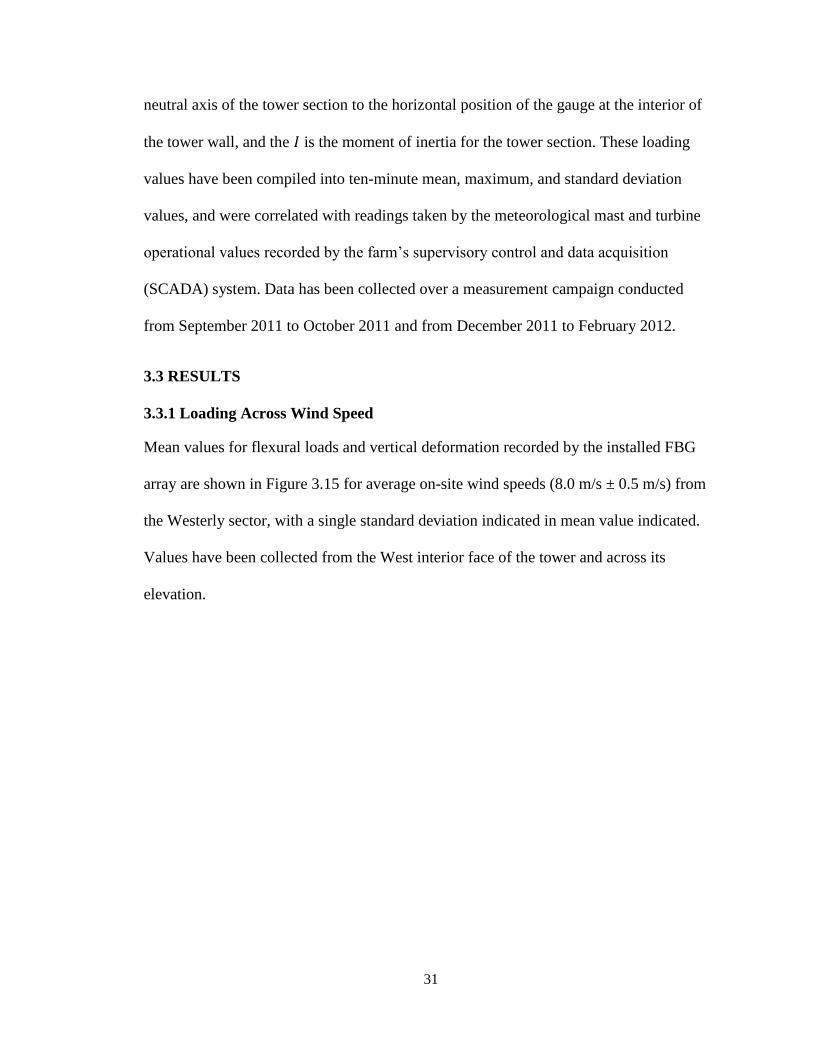
The half-hour strain signal from the same gauge is shown in Figure 3.13, under Westerly
winds with speeds closer to 7.5 m/s. For this time period, winds were classified as
sheared according to previously outlined thresholds. FFT analysis, shown in Figure 3.14,
likewise demonstrates spectral peaks at 0.325 and 2.86 Hz. High local spectral energy is
0
50
100
150
200
250
300
0 200 400 600 800 1000 1200 1400 1600 1800
Str
ain
(E
-06)
Time (s)
0.5 1 1.5 2 2.5 3 3.5 4 4.5 50
0.5
1
1.5
2
2.5
Frequency (Hz)(b)
| Y
( f
) |
Page 41
29
also noted at a frequency near 0.70 Hz, corresponding to near three times the rotational
frequency of the rotor (also known as the blade passing frequency for a three-bladed
turbine) at the given hub height wind speed.
Figure 3.13: Strain signal under sheared winds.
Figure 3.14: FFT plot under sheared winds.
0
50
100
150
200
250
300
0 200 400 600 800 1000 1200 1400 1600 1800
Str
ain
(E
-06)
Time (s)
0.5 1 1.5 2 2.5 3 3.5 4 4.5 50
0.5
1
1.5
2
2.5
Frequency (Hz)(b)
| Y
( f
) |
Page 42
30
3.2.4 System Calibration
To study the wind profile directly upstream of the turbine and the windward response of
the tower, winds from the Westerly sector (having an average ten-minute wind direction
at 77 m equal to 270° ± 15°) and readings from the East and West gauges will be
considered in the analysis. A smaller wind sector than that outlined in Section 2.2 has
been used, given the dependency of tower strain on prevailing wind direction and
resulting nacelle orientation. The strain values produced by the FBG array are not
absolute, given that the system was installed after turbine construction. As a result, the
time independent compressive stress presented by the weight of the rotor-nacelle and the
self-weight of the tower are not reflected in measured values. Given that the weights of
these components are known, the resulting compressive stress at the tower base is
estimated near 5.22 MPa. Measured strain values represent a deviation from a baseline
established when hub height wind speeds were low (less than 1.5 m/s), the rotor was idle,
and the nacelle was facing the West direction. The resulting strain values will therefore
also not include the stress introduced by the eccentricity of the rotor-nacelle bearing onto
the tower [11], which has experimentally been shown to be near 3 MPa at the tower base.
Readings taken by the strain gauge array have been converted to stress, assuming linear
elastic behaviour, and then converted to flexural load using section properties as the
corresponding level of the tower, as per the fundamental equation for a beam element
subjected to flexural loading [28]:
𝜀 ∙ 𝐸 = 𝑀 ∙ 𝑦
𝐼 (4)
where 𝜀 is the longitudinal strain value produced, 𝐸 is the elastic modulus of the tower
structural tower (200 GPa), 𝑀 is the resulting flexural load, 𝑦 is the distance from the
Page 43
31
neutral axis of the tower section to the horizontal position of the gauge at the interior of
the tower wall, and the 𝐼 is the moment of inertia for the tower section. These loading
values have been compiled into ten-minute mean, maximum, and standard deviation
values, and were correlated with readings taken by the meteorological mast and turbine
operational values recorded by the farm’s supervisory control and data acquisition
(SCADA) system. Data has been collected over a measurement campaign conducted
from September 2011 to October 2011 and from December 2011 to February 2012.
3.3 RESULTS
3.3.1 Loading Across Wind Speed
Mean values for flexural loads and vertical deformation recorded by the installed FBG
array are shown in Figure 3.15 for average on-site wind speeds (8.0 m/s ± 0.5 m/s) from
the Westerly sector, with a single standard deviation indicated in mean value indicated.
Values have been collected from the West interior face of the tower and across its
elevation.
Page 44
32
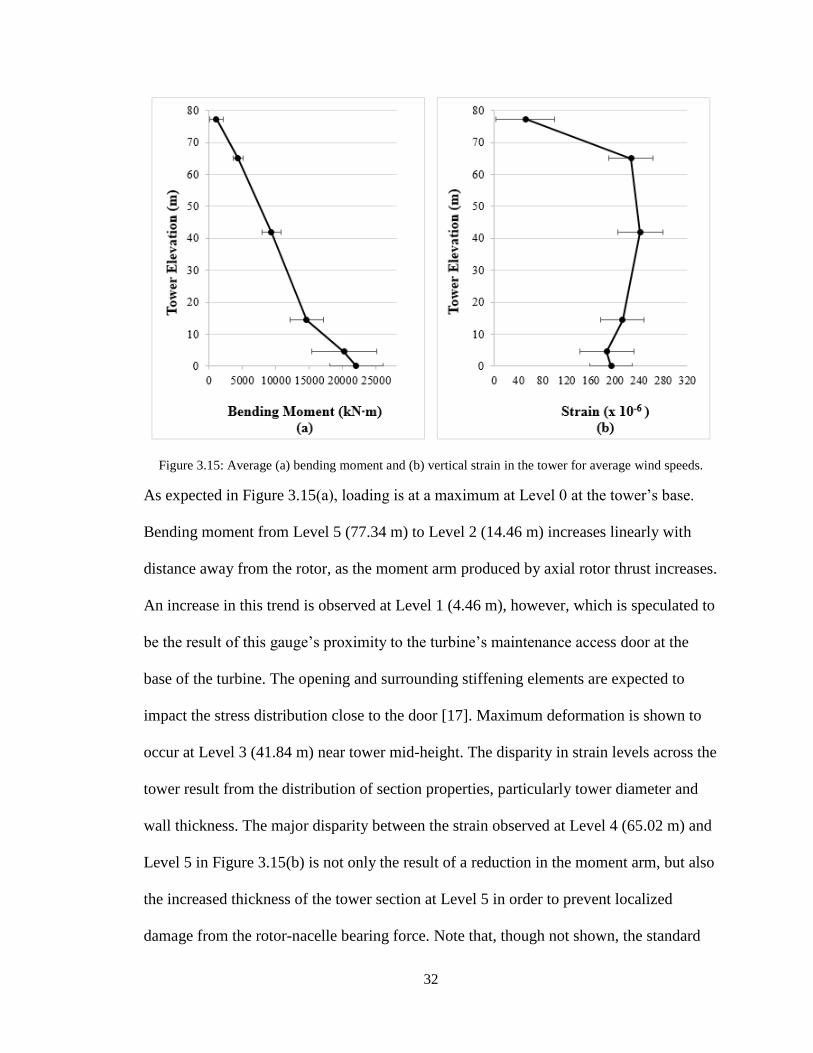
Figure 3.15: Average (a) bending moment and (b) vertical strain in the tower for average wind speeds.
As expected in Figure 3.15(a), loading is at a maximum at Level 0 at the tower’s base.
Bending moment from Level 5 (77.34 m) to Level 2 (14.46 m) increases linearly with
distance away from the rotor, as the moment arm produced by axial rotor thrust increases.
An increase in this trend is observed at Level 1 (4.46 m), however, which is speculated to
be the result of this gauge’s proximity to the turbine’s maintenance access door at the
base of the turbine. The opening and surrounding stiffening elements are expected to
impact the stress distribution close to the door [17]. Maximum deformation is shown to
occur at Level 3 (41.84 m) near tower mid-height. The disparity in strain levels across the
tower result from the distribution of section properties, particularly tower diameter and
wall thickness. The major disparity between the strain observed at Level 4 (65.02 m) and
Level 5 in Figure 3.15(b) is not only the result of a reduction in the moment arm, but also
the increased thickness of the tower section at Level 5 in order to prevent localized
damage from the rotor-nacelle bearing force. Note that, though not shown, the standard
Page 45
33
deviation values for strain measured within ten-minute averaging periods are observed to
be highest for Level 3.
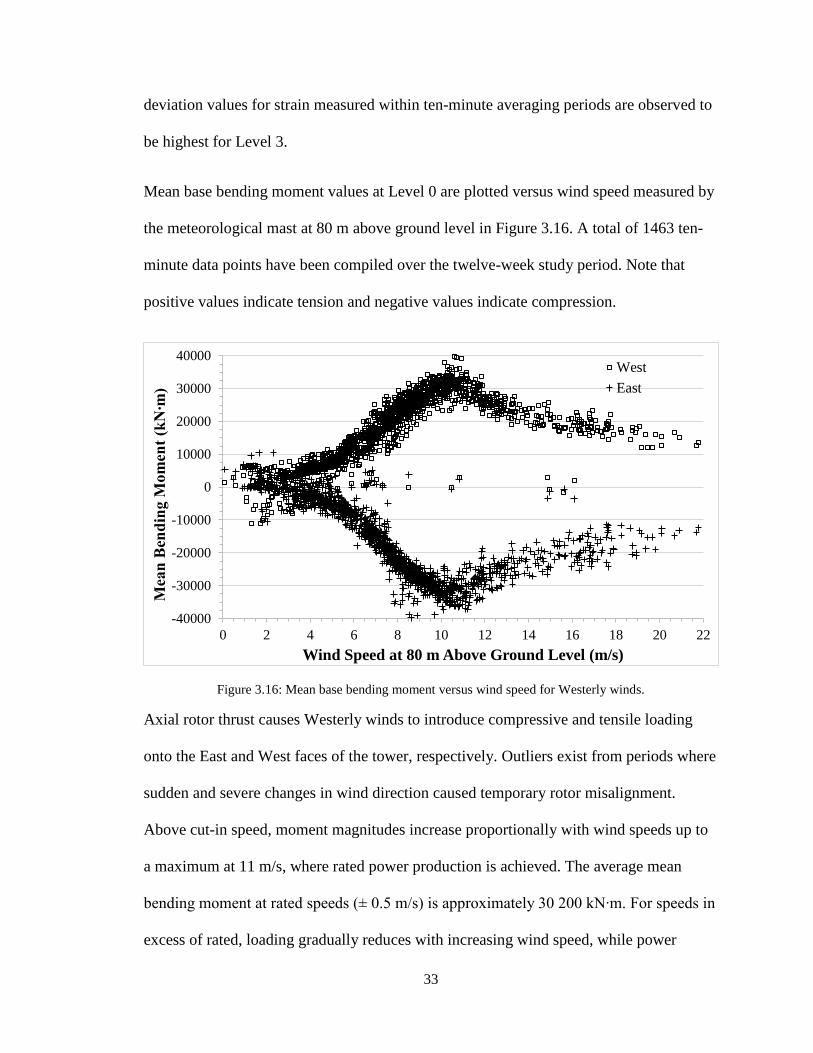
Mean base bending moment values at Level 0 are plotted versus wind speed measured by
the meteorological mast at 80 m above ground level in Figure 3.16. A total of 1463 ten-
minute data points have been compiled over the twelve-week study period. Note that
positive values indicate tension and negative values indicate compression.
Figure 3.16: Mean base bending moment versus wind speed for Westerly winds.
Axial rotor thrust causes Westerly winds to introduce compressive and tensile loading
onto the East and West faces of the tower, respectively. Outliers exist from periods where
sudden and severe changes in wind direction caused temporary rotor misalignment.
Above cut-in speed, moment magnitudes increase proportionally with wind speeds up to
a maximum at 11 m/s, where rated power production is achieved. The average mean
bending moment at rated speeds (± 0.5 m/s) is approximately 30 200 kN∙m. For speeds in
excess of rated, loading gradually reduces with increasing wind speed, while power
-40000
-30000
-20000
-10000
0
10000
20000
30000
40000
0 2 4 6 8 10 12 14 16 18 20 22
Mea
n B
end
ing M
om
ent
(kN
∙m)
Wind Speed at 80 m Above Ground Level (m/s)
West
East
Page 46
34
production remains essentially constant. Similar phenomenon was demonstrated by
Rebelo et al. [3] and Muto et al. [14]. This observed reduction in rotor thrust is typical of
pitch-regulated wind turbines [2], and is the result of rotor blades pitching towards a
feathered position from the approximately -1° pitch angle they maintain during typical
operation, as a means of preventing turbine overload. For a hub height wind speed equal
to 20 m/s, blade pitch angle approaches 19° with loading magnitude approximately equal
to those encountered at a speed of 6.5 m/s.
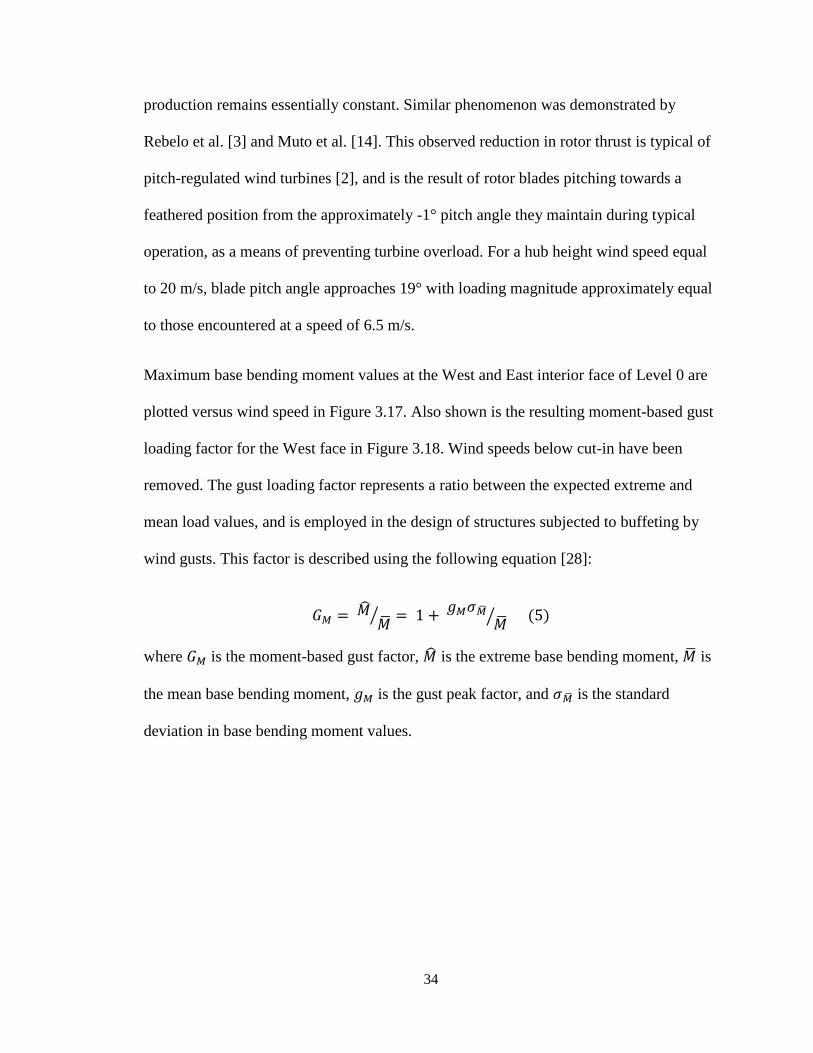
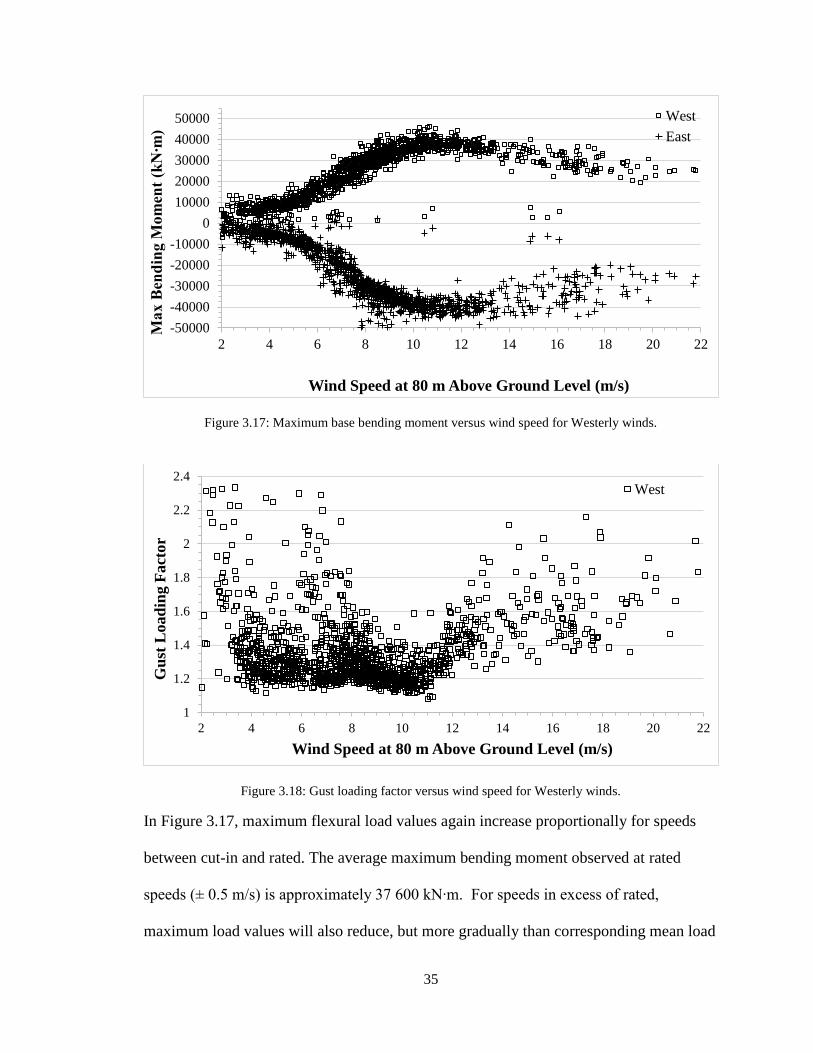
Maximum base bending moment values at the West and East interior face of Level 0 are
plotted versus wind speed in Figure 3.17. Also shown is the resulting moment-based gust
loading factor for the West face in Figure 3.18. Wind speeds below cut-in have been
removed. The gust loading factor represents a ratio between the expected extreme and
mean load values, and is employed in the design of structures subjected to buffeting by
wind gusts. This factor is described using the following equation [28]:
𝐺𝑀 = �̂��̅�
⁄ = 1 + 𝑔𝑀𝜎�̅�
�̅�⁄ (5)
where 𝐺𝑀 is the moment-based gust factor, �̂� is the extreme base bending moment, �̅� is
the mean base bending moment, 𝑔𝑀 is the gust peak factor, and 𝜎�̅� is the standard
deviation in base bending moment values.
Page 47
35
Figure 3.17: Maximum base bending moment versus wind speed for Westerly winds.
Figure 3.18: Gust loading factor versus wind speed for Westerly winds.
In Figure 3.17, maximum flexural load values again increase proportionally for speeds
between cut-in and rated. The average maximum bending moment observed at rated
speeds (± 0.5 m/s) is approximately 37 600 kN∙m. For speeds in excess of rated,
maximum load values will also reduce, but more gradually than corresponding mean load
-50000
-40000
-30000
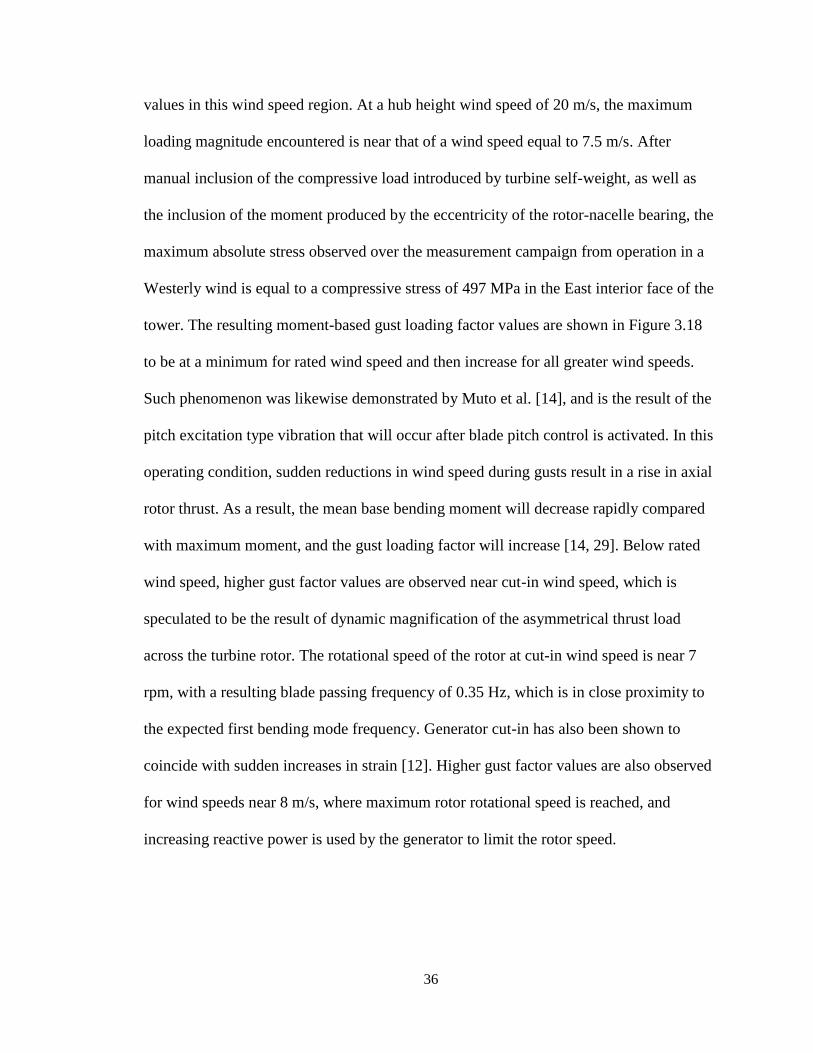
-20000
-10000
0
10000
20000
30000
40000
50000
2 4 6 8 10 12 14 16 18 20 22
Max B
end
ing M
om
ent
(kN
∙m)
Wind Speed at 80 m Above Ground Level (m/s)
West
East
1
1.2
1.4
1.6
1.8
2
2.2
2.4
2 4 6 8 10 12 14 16 18 20 22
Gu
st L
oad
ing F
act
or
Wind Speed at 80 m Above Ground Level (m/s)
West
Page 48
36
values in this wind speed region. At a hub height wind speed of 20 m/s, the maximum
loading magnitude encountered is near that of a wind speed equal to 7.5 m/s. After
manual inclusion of the compressive load introduced by turbine self-weight, as well as
the inclusion of the moment produced by the eccentricity of the rotor-nacelle bearing, the
maximum absolute stress observed over the measurement campaign from operation in a
Westerly wind is equal to a compressive stress of 497 MPa in the East interior face of the
tower. The resulting moment-based gust loading factor values are shown in Figure 3.18
to be at a minimum for rated wind speed and then increase for all greater wind speeds.
Such phenomenon was likewise demonstrated by Muto et al. [14], and is the result of the
pitch excitation type vibration that will occur after blade pitch control is activated. In this
operating condition, sudden reductions in wind speed during gusts result in a rise in axial
rotor thrust. As a result, the mean base bending moment will decrease rapidly compared
with maximum moment, and the gust loading factor will increase [14, 29]. Below rated
wind speed, higher gust factor values are observed near cut-in wind speed, which is
speculated to be the result of dynamic magnification of the asymmetrical thrust load
across the turbine rotor. The rotational speed of the rotor at cut-in wind speed is near 7
rpm, with a resulting blade passing frequency of 0.35 Hz, which is in close proximity to
the expected first bending mode frequency. Generator cut-in has also been shown to
coincide with sudden increases in strain [12]. Higher gust factor values are also observed
for wind speeds near 8 m/s, where maximum rotor rotational speed is reached, and
increasing reactive power is used by the generator to limit the rotor speed.
Page 49
37
3.3.2 Loading Across Wind Condition
Diurnal ground heating is attenuated during the colder months at the testing site during
the measurement campaign, resulting in limited turbulent and frequent sheared
conditions, having high shear exponents in the land-influenced Westerly sector. Wind
conditions demonstrate diurnal correlation; with 83% of turbulent data points occurring
from 7:00 AM - 7:00 PM, and 74% of sheared data points occurring from 7:00 PM – 7:00
AM. Mean values encountered for both wind conditions are shown in Table 3.5.
Table 3.5: Characteristics of wind conditions in Westerly sector during study period.
Wind Condition Number of
Data Points
Mean Wind
Speed (m/s)
Mean Wind
Shear Exponent
Mean Turbulence
Intensity
Turbulent 171 8.49 0.07 14.86%
Sheared 753 7.94 0.39 7.20%
Data points for the West interior face of the tower in Figure 3.16 and Figure 3.17 are
classified into their respective wind condition class in Figure 3.19 and Figure 3.20. Mean
and maximum bending moment values have been binned and averaged at intervals of 1
m/s. Note that a portion of the original 1463 data points included in Figure 3.16 did not
adhere to the inflow parameter thresholds for either wind condition class and were
therefore excluded. Aforementioned outliers have also been removed, as well as data
points below turbine cut-in speed.
Page 50
38
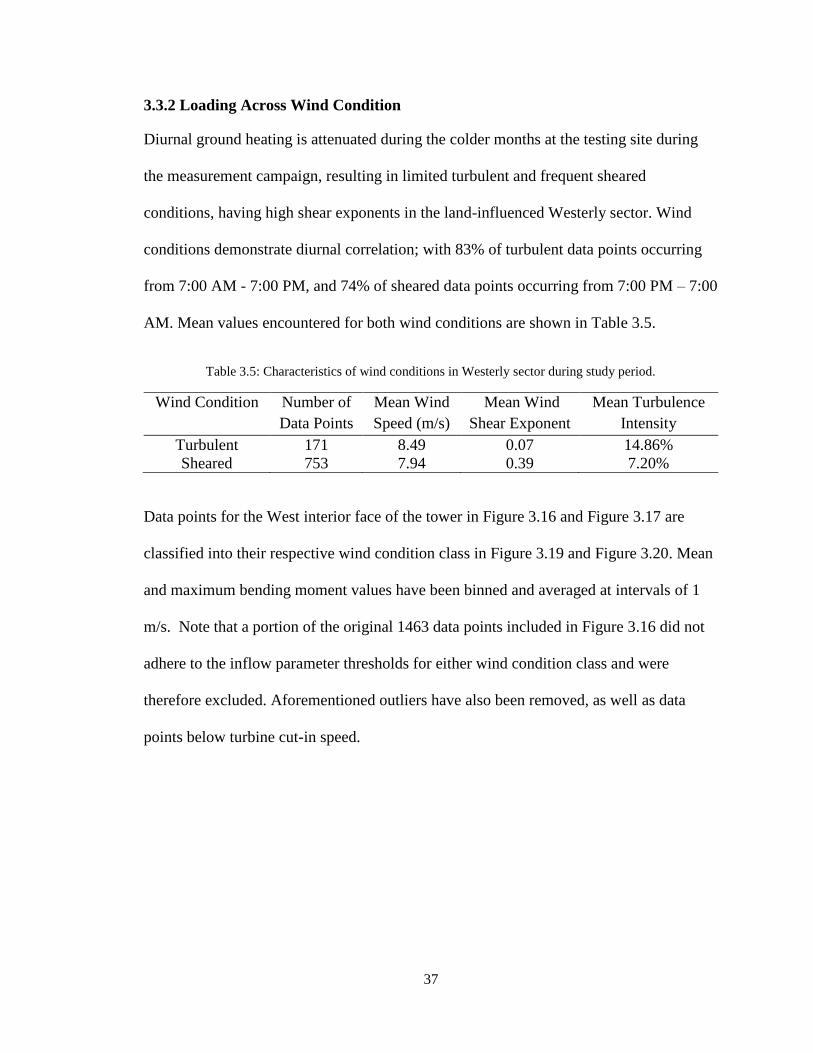
Figure 3.19: Mean base bending moment versus wind speed, classified by wind condition.
Figure 3.20: Maximum base bending moment versus wind speed, classified by wind condition.
Sheared conditions are shown to coincide with marginally higher mean base bending
moment than turbulent conditions across nearly all wind speeds. However, maximum
bending moment values for sheared and turbulent conditions remain relatively close. The
moment-based gust loading factor will therefore be increased under turbulent conditions.
0
5000
10000
15000
20000
25000
30000
35000
2 4 6 8 10 12 14 16 18
Mea
n B
end
ing M
om
ent
(kN
∙m)
Wind Speed at 80 m Above Ground Level (m/s)
Sheared
Turbulent
0
5000
10000
15000
20000
25000
30000
35000
40000
45000
2 4 6 8 10 12 14 16 18
Max B
end
ing M
om
ent
(kN
∙m)
Wind Speed at 80 m Above Ground Level (m/s)
Sheared
Turbulent
Page 51
39
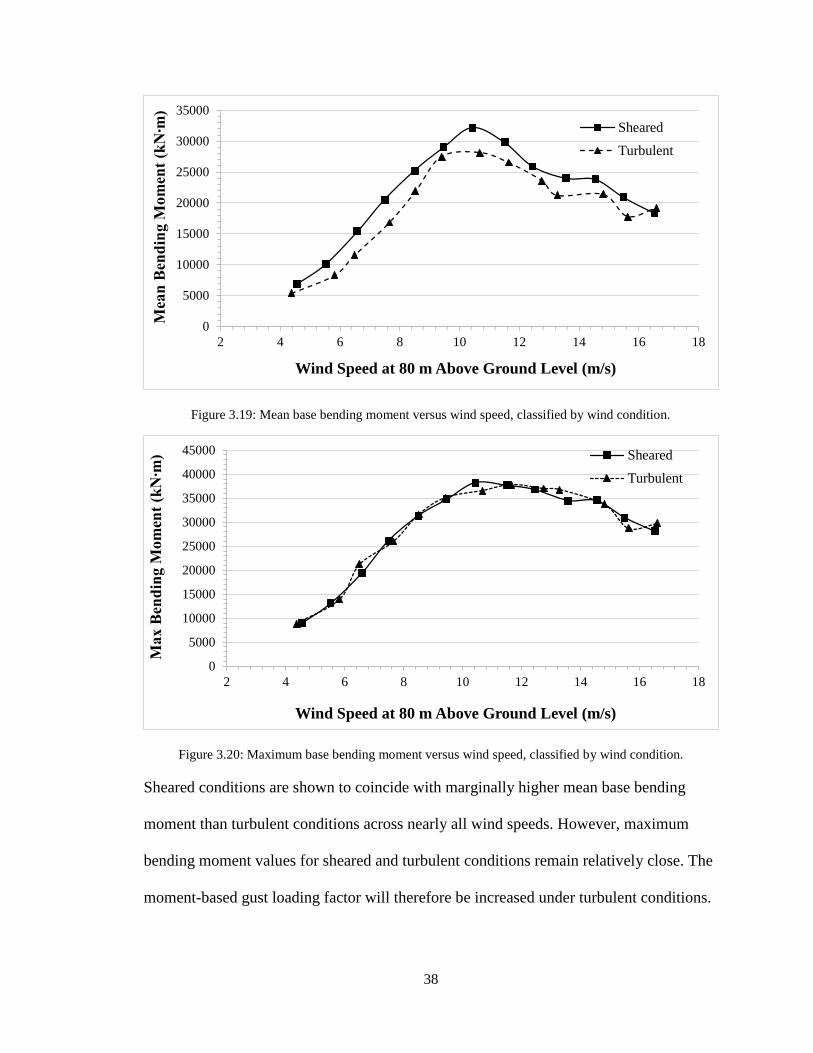
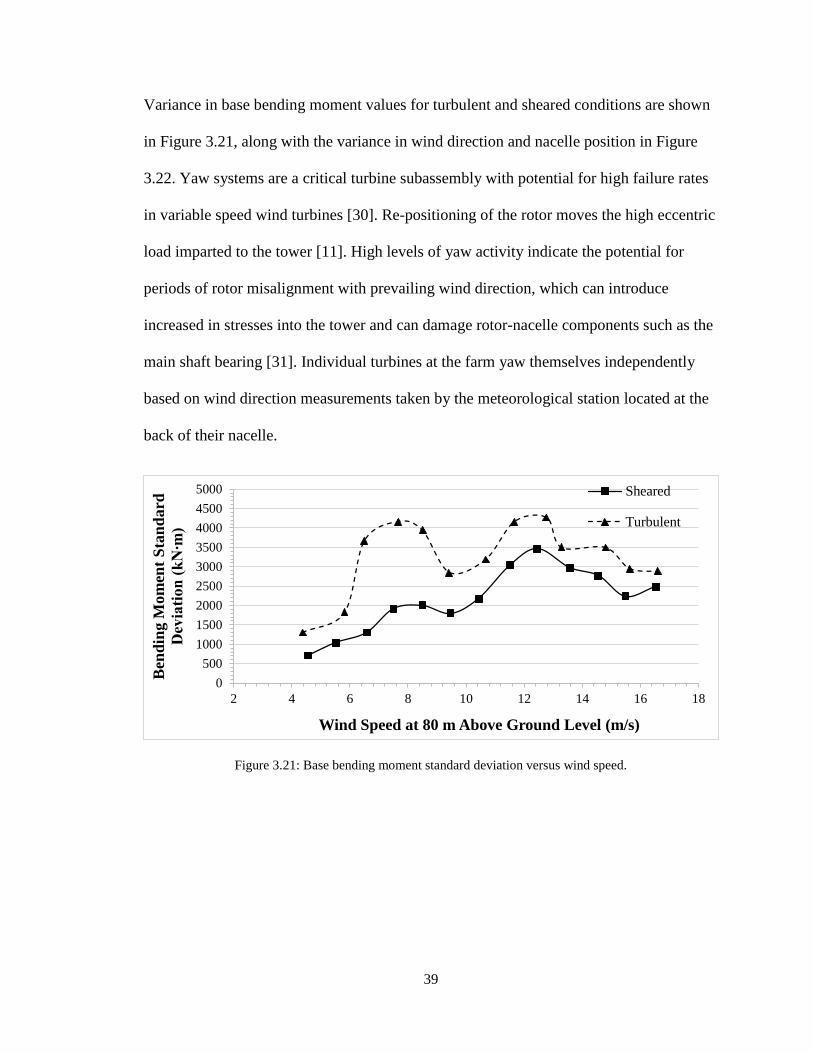
Variance in base bending moment values for turbulent and sheared conditions are shown
in Figure 3.21, along with the variance in wind direction and nacelle position in Figure
3.22. Yaw systems are a critical turbine subassembly with potential for high failure rates
in variable speed wind turbines [30]. Re-positioning of the rotor moves the high eccentric
load imparted to the tower [11]. High levels of yaw activity indicate the potential for
periods of rotor misalignment with prevailing wind direction, which can introduce
increased in stresses into the tower and can damage rotor-nacelle components such as the
main shaft bearing [31]. Individual turbines at the farm yaw themselves independently
based on wind direction measurements taken by the meteorological station located at the
back of their nacelle.
Figure 3.21: Base bending moment standard deviation versus wind speed.
0
500
1000
1500
2000
2500
3000
3500
4000
4500
5000
2 4 6 8 10 12 14 16 18
Ben
din
g M
om
ent
Sta
nd
ard
Dev
iati
on
(k
N∙m
)
Wind Speed at 80 m Above Ground Level (m/s)
Sheared
Turbulent
Page 52
40
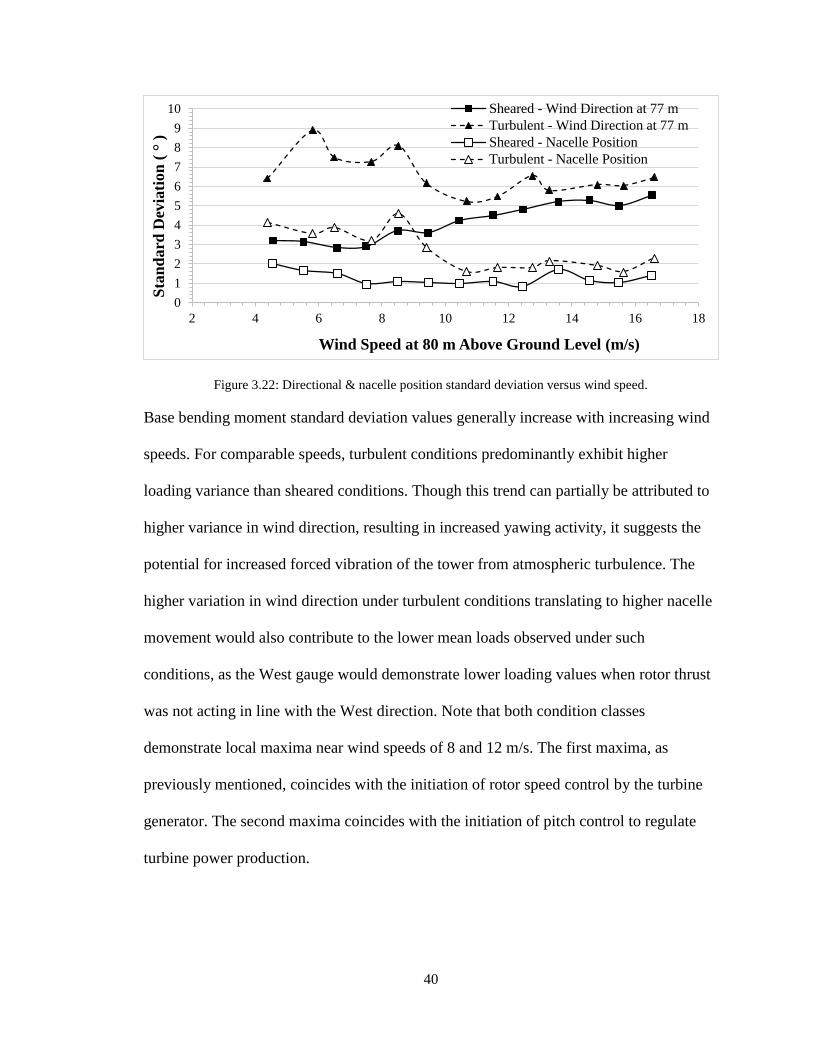
Figure 3.22: Directional & nacelle position standard deviation versus wind speed.
Base bending moment standard deviation values generally increase with increasing wind
speeds. For comparable speeds, turbulent conditions predominantly exhibit higher
loading variance than sheared conditions. Though this trend can partially be attributed to
higher variance in wind direction, resulting in increased yawing activity, it suggests the
potential for increased forced vibration of the tower from atmospheric turbulence. The
higher variation in wind direction under turbulent conditions translating to higher nacelle
movement would also contribute to the lower mean loads observed under such
conditions, as the West gauge would demonstrate lower loading values when rotor thrust
was not acting in line with the West direction. Note that both condition classes
demonstrate local maxima near wind speeds of 8 and 12 m/s. The first maxima, as
previously mentioned, coincides with the initiation of rotor speed control by the turbine
generator. The second maxima coincides with the initiation of pitch control to regulate
turbine power production.
0
1
2
3
4
5
6
7
8
9
10
2 4 6 8 10 12 14 16 18
Sta
nd
ard
Dev
iati
on
( °
)
Wind Speed at 80 m Above Ground Level (m/s)
Sheared - Wind Direction at 77 m
Turbulent - Wind Direction at 77 m
Sheared - Nacelle Position
Turbulent - Nacelle Position
Page 53
41
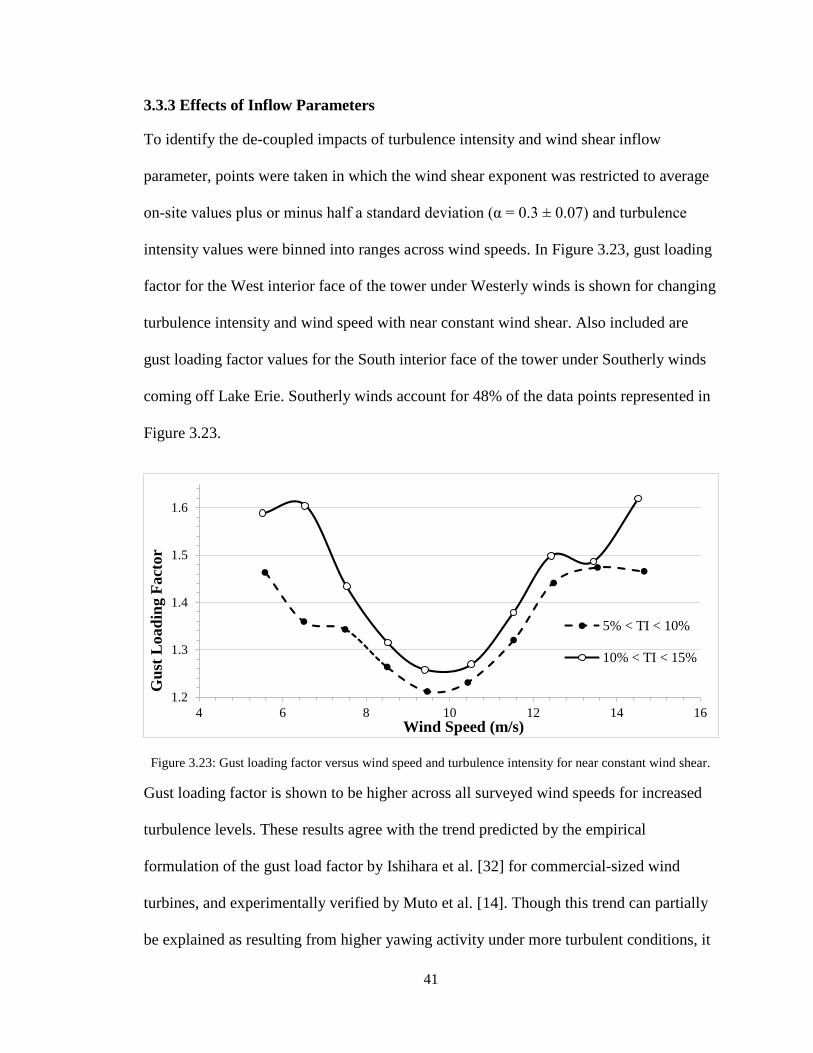
3.3.3 Effects of Inflow Parameters
To identify the de-coupled impacts of turbulence intensity and wind shear inflow
parameter, points were taken in which the wind shear exponent was restricted to average
on-site values plus or minus half a standard deviation (α = 0.3 ± 0.07) and turbulence
intensity values were binned into ranges across wind speeds. In Figure 3.23, gust loading
factor for the West interior face of the tower under Westerly winds is shown for changing
turbulence intensity and wind speed with near constant wind shear. Also included are
gust loading factor values for the South interior face of the tower under Southerly winds
coming off Lake Erie. Southerly winds account for 48% of the data points represented in
Figure 3.23.
Figure 3.23: Gust loading factor versus wind speed and turbulence intensity for near constant wind shear.
Gust loading factor is shown to be higher across all surveyed wind speeds for increased
turbulence levels. These results agree with the trend predicted by the empirical
formulation of the gust load factor by Ishihara et al. [32] for commercial-sized wind
turbines, and experimentally verified by Muto et al. [14]. Though this trend can partially
be explained as resulting from higher yawing activity under more turbulent conditions, it
1.2
1.3
1.4
1.5
1.6
4 6 8 10 12 14 16
Gu
st L
oad
ing F
act
or
Wind Speed (m/s)
5% < TI < 10%
10% < TI < 15%
Page 54
42
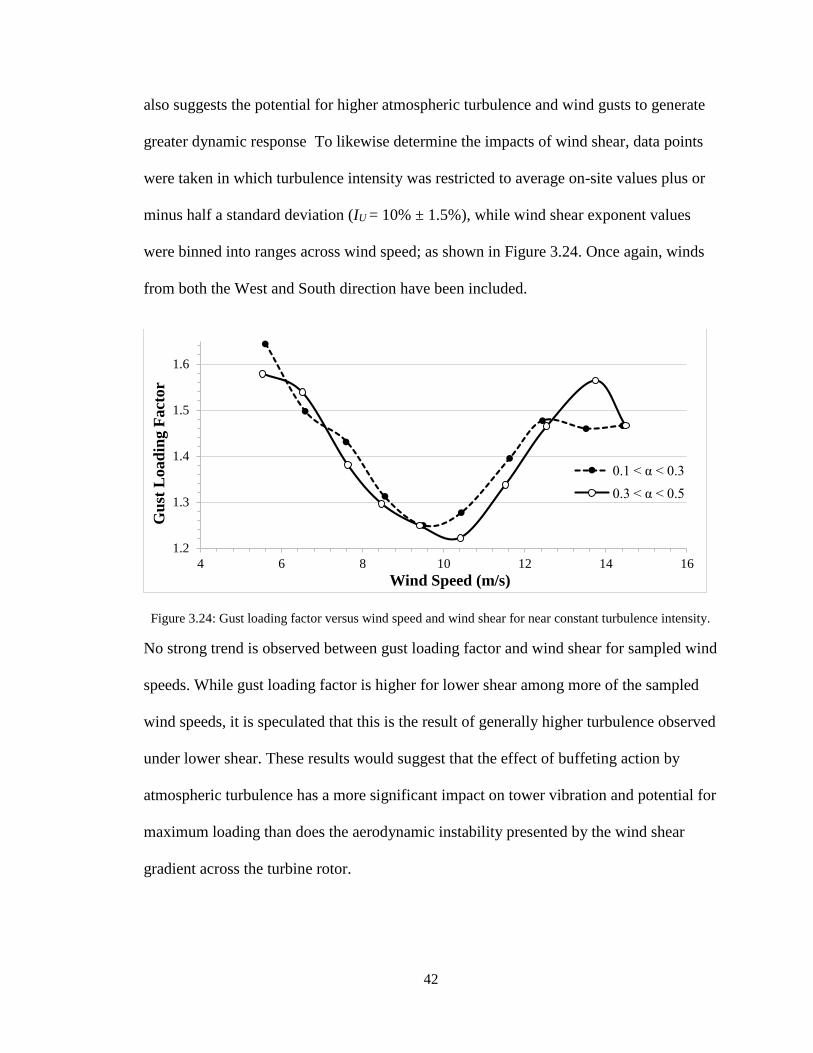
also suggests the potential for higher atmospheric turbulence and wind gusts to generate
greater dynamic response To likewise determine the impacts of wind shear, data points
were taken in which turbulence intensity was restricted to average on-site values plus or
minus half a standard deviation (IU = 10% ± 1.5%), while wind shear exponent values
were binned into ranges across wind speed; as shown in Figure 3.24. Once again, winds
from both the West and South direction have been included.
Figure 3.24: Gust loading factor versus wind speed and wind shear for near constant turbulence intensity.
No strong trend is observed between gust loading factor and wind shear for sampled wind
speeds. While gust loading factor is higher for lower shear among more of the sampled
wind speeds, it is speculated that this is the result of generally higher turbulence observed
under lower shear. These results would suggest that the effect of buffeting action by
atmospheric turbulence has a more significant impact on tower vibration and potential for
maximum loading than does the aerodynamic instability presented by the wind shear
gradient across the turbine rotor.
1.2
1.3
1.4
1.5
1.6
4 6 8 10 12 14 16
Gu
st L
oad
ing F
act
or
Wind Speed (m/s)
0.1 < α < 0.3
0.3 < α < 0.5
Page 55
43
3.4 CONCLUDING REMARKS & FUTURE WORK
The flexural loads recorded at the base of a steel wind turbine tower have been correlated
with varying wind conditions, with the following conclusions drawn:
While the turbine is operational, tower base bending moment are at maximum at
rated wind speed, decreasing gradually with increasing wind speed after
maximum power production has been reached. The same is true for maximum
base bending moment, though maximum loads decrease more gradually. The
resulting gust load factor is shown to be at a minimum near rated speed.
High-shear, low-turbulence conditions demonstrate marginally higher mean base
bending moment than low-shear, high-turbulence conditions across operational
wind speeds. Maximum loads encountered at the outlined wind conditions are
largely comparable.
Low-shear, high-turbulence conditions demonstrate higher levels of loading
variance and yaw activity than high-shear, low-turbulence conditions across
operational wind speeds.
Horizontal turbulence intensity is shown to have a more tangible effect on the
gust loading factor than vertical wind shear.
The analyses conducted at an onshore farm in an agricultural setting could also be
potentially conducted at offshore installations, in complex terrain, or using water-
influenced wind profiles.
Page 56
44
REFERENCES
[1] N. A. Agbayani and R. E. Vega, "The rapid evolution of wind turbine tower
structural systems: A historical and technical overview," in Structures Congress,
Chicago, 2012.
[2] H. Hau, Wind Turbines: Fundamentals, Technologies, Applications and Economics,
Munich: Springer, 2000.
[3] C. Rebelo, M. Veljkovic, R. Matos and L. Simões da Silva, "Structural monitoring
of a wind turbine steel tower - Part II: monitoring results," Wind and Structures,
vol. 15, no. 4, pp. 301-311, 2012.
[4] J. Sumner and C. Masson, "Influence of atmospheric stability on wind turbine
power performance curves," Journal of solar energy engineering, vol. 128, no. 4,
pp. 531-538, 2006.
[5] S. Wharton and J. K. Lundquist, "Atmospheric stability affects wind turbine power
collection," Environmental Research Letters, vol. 7, 2012.
[6] C.-R. Chu and P.-H. Chiang, "Turbulence ffects of the wake flow and power
production of a horizontal-axis wind turbine," Journal of Wind Engineering and
Industrial Aerodynamics, vol. 124, pp. 82-89, 2014.
[7] A. Sathe and W. Bierbooms, "Influence of different wind profiles due to varying
atmospheric stability on the fatigue life of wind turbines," Journal of Physics:
Conference Series, vol. 75, 2007.
[8] G. P. van den Berg, "Wind turbine power and sound in relation to atmospheric
stability," Wind Energy 11(2), pp. 151-169, 2008.
[9] K. Bassett, R. Carriveau and D. S.-K. Ting, "Vibration analysis of 2.3 MW wind
turbine operation using the discrete wavelet transform," Wind Engineering 34(4),
pp. 375-388, 2010.
[10] K. Bassett, R. Carriveau and D. S.-K. Ting, "Vibration response of a 2.3 MW wind
turbine to yaw motion and shut down events," Wind Energy 14(8), pp. 939-952,
2011.
[11] J. Bas, R. Carriveau, S. Cheng and T. Newson, "Strain response of a wind turbine
tower as a function of nacelle orientation," in BIONATURE 2012 : The Third
International Conference on Bioenvironment, Biodiversity and Renewable
Energies, St. Maarten, 2012.
Page 57
45
[12] J. Bas, J. Smith, R. Carriveau, S. Cheng, D. S.-K. Ting and T. Newson, "Structural
response of a commercial wind turbine to various stopping events," Wind
Engineering 36(5), pp. 553-569, 2012.
[13] C. Rebelo, M. Veljkovic, L. Da Silva, L. Simoes, R. Simoes and J. Henriques,
"Structural monitoring of a wind turbine steel tower - Part I: System description and
calibration," Wind and Structures, vol. 15, no. 4, pp. 285-299, 2012.
[14] A. Muto, J. Suzuki, N. Kubo and T. Karaushi, "Wind turbine load evaluation during
normal operation," Journal of Fluid Science and Technology, vol. 6, no. 3, pp. 292-
299, 2011.
[15] N. Bazeos, G. D. Hatzigeorgiou, I. D. Hondros, H. Karamaneas, D. L. Karabalis
and D. E. Beskos, "Static, seismic and stability analyses of a prototype wind turbine
steel tower," Engineering Structures, vol. 24, pp. 1015-1025, 2002.
[16] G. Horvath and L. Toth, "New methods in wind turbine tower design," Wind
Engineering 25(3), pp. 171-178, 2001.
[17] I. Lavassas, G. Nikolaidis, P. Zervas, E. Efthimiou, I. N. Doudoumis and C. C.
Baniotopoulos, "Analysis and design of the prototype of a steel 1-MW wind turbine
tower," Engineering Structures 25, pp. 1097-1106, 2003.
[18] H. Ishii and T. Ishihara, "Numerical study of maximum wind load on wind turbine
towers under operating conditions," in The Fifth International Symposium on
Computational Wind Engineering, Chapel Hill, 2010.
[19] D. K. Kwon, A. Kareem and K. Butler, "Gust-front loading effects on wind turbine
tower systems," Journal of Wind Engineering and Industrial Aerodynamics, Vols.
104-106, pp. 109-115, 2012.
[20] S. Korn and L. Manuel, "On the propagation of uncertainty in inflow turbulence to
wind turbine loads," Journal of Wind Engineering and Industrial Aerodynamics,
vol. 96, pp. 503-523, 2008.
[21] International Electrotechnical Commission, "IEC 61400-1 ed.3 Wind turbines - Part
1: Design requirements," Geneva, 2005.
[22] S. Wharton and J. K. Lundquist, "Assessing atmospheric stability and its impact on
rotor-disk wind characteristics at an offshore wind farm," Wind Energy 15(4), pp.
525-546, 2012.
[23] E. Rareshide, A. Tindal, C. Johnson, A. Graves, E. Simpson, J. Bleeg, T. Harris and
D. Schoborg, "Effects of complex wind regimes on turbine performance," in
Podium presentation at AWEA WINDPOWER 2009 Conference, Chicago, 2009.
Page 58
46
[24] O. G. Sutton, Atmospheric turbulence, London: Methuen, 1949.
[25] T. Burton, D. Sharpe, N. Jenkins and E. Bossanyi, Wind Energy Handbook,
Chicester: John Wiley & Sons, 2001.
[26] B. Branca and J. Ben-Hassine, "Dynamic analysis of a wind turbine and foundation
to assess liquefaction potential of bearing soils," in Proceedings og the 2009
Structures Congress - Don't Mess with Structural Engineerings: Expanding Our
Role, Virginia, 2009.
[27] R. Hoffer, "Damage-Oriented Actions and Environmental Impact on Materials and
Structures," in Lifetime-Oriented Structural Design Concepts, Berlin, Springer,
2009, pp. 9-121.
[28] A. Kareem and Y. Zhou, "Gust loading factor - past, present and future," Journal of
Wind Engineering and Industrial Aerodynamics, vol. 91, pp. 1301-1328, 2003.
[29] M. Iino, T. Chujo, M. Iida and C. Arakawa, "Effect of forced excitation on wind
turbine with dynamic analysis in deep offshore wind in addition to Japanese status
of offshore projects," Energy Proceedia, vol. 24, pp. 11-17, 2012.
Page 59
47
CHAPTER 4
Inflow Parameter Effects on Wind Turbine Tower Cyclic Loading
Jamie C. Smith, Rupp Carriveau, David S-K Ting
Turbulence and Energy Laboratory, Ed Lumley Centre for Engineering Innovation,
University of Windsor, Ontario, Canada
4.1 INTRODUCTION
Growth in the wind energy sector has coincided with substantial growth in the physical
size of utility-scale wind turbines, for the purposes of improving their power capture.
Increases in nacelle mass and tower height create a more flexible structure [1] and larger
turbines, with rated power in excess of 1 MW, have already demonstrated higher failure
rates than their smaller counterparts [2]. Increases in rotor size and tower height also
project turbine blades into higher elevations of the atmospheric boundary layer; exposing
the turbine to complex and potentially increased aerodynamic loading. Given their
widespread deployment at sites with differing wind conditions and the limited availability
of operational history data for multi-MW wind turbines, concerns exist over the ability of
modern turbines to meet their projected twenty-year life expectancy. Full-scale physical
data can help improve the reliability of turbine service life estimates and provide insight
on suitable decommissioning and re-powering options when individual turbine
components have expired. A more developed understanding of how changing wind
regimes influence turbine structural loading also has the potential to extend service life
through better-informed control decisions.
Page 60
48
Wind turbines are considered fatigue-critical structures with loading spectra characterized
by high cycle counts [3]. Fatigue damage imparted to turbines is heavily attributed to
atmospheric turbulence [4], which is influenced by surrounding topography and terrain at
onshore wind farms [5]. Onshore farms are also subject to substantial diurnal variation in
turbulence levels and wind shear driven by atmospheric stability. Solar heating of the
ground during the day can generate turbulent boundary layer mixing to produce
convective and unstable conditions having a near uniform wind speed profile. At night,
turbulent mixing will typically reduce, producing a wind speed profile that is stable and
highly sheared [6]. Simulation has demonstrated the ability of turbulence and wind shear
inflow parameters to impact the modal properties of a wind turbine’s operational
response, with more turbulent winds exciting a greater number of modes of vibration than
sheared winds [7]. Simulation has also demonstrated the potential for accumulated rotor
blade fatigue damage to be significantly influenced by the wind profiles expected under
changing atmospheric stability conditions [8] or at differing wind farm sites [9].
At a commercial wind farm in Southwestern Ontario, the hollow structural steel
supporting tower of a 2.3 MW horizontal-axis wind turbine has been instrumented with a
fiber Bragg grating strain gauge array. The tower serves as an integral part of the wind
turbine structure, and their failure is not unprecedented [10]. In addition to finite element
modelling of turbine towers [1, 11-14], tower monitoring systems have also recently been
employed to gather in-situ measurements of applied loading and tower response in
modern multi-megawatt turbines. Such monitoring systems can be employed for
applications beyond consideration of the tower, as the tower represents a barometer of
response for rotor and foundation systems as well. Bang et al. [13] utilized a sensor array
Page 61
49
to measure tower response during turbine start-up and shutdown. Rebelo et al. [14, 15]
correlated stress magnitudes in the shell and pre-stressed bolts of a steel turbine tower
with varying wind speed and characterized tower modal response from vibration
measurements. They additionally performed a quantification of accumulated fatigue
spectra in the tower over their measurement campaign. Ragan & Manuel [16] also
estimated fatigue loads at tower base and blade root using data collected from a utility-
scale turbine; employing both time-domain and spectral methods. Muto et al. [17]
investigated the impacts of wind speed and turbulence intensity on flexural loads at the
base of a turbine tower during typical power production. Previous work on the turbine
under study has investigated the vibration and strain response of the tower to transient
operational states such as start-up, rotor re-positioning, and manual shutdown [18-21].
The purpose of this work is to quantify the tower’s response to turbine operation across
varying wind conditions. Particular consideration will be given to upwind inflow
parameters such as vertical wind shear and longitudinal turbulence intensity; offering a
more complete representation of the incoming flow field than hub-height speeds alone
and for which limited data on structural impacts is available. Given that fatigue strength
frequently governs wind turbine tower design [22], the chosen measure of response will
be cyclic loading. A sample of the turbine tower’s loading history is to be constructed
from multiple months of data collected from the installed strain gauge array and cyclic
loading spectra will be assembled under specific wind regime classifications.
4.2 EXPERIMENTAL SETUP
The Siemens 2.3 MW MKII Turbine under study is a variable speed turbine with a rotor
diameter of 93 m and hub height of 80 m. The tower is of steel plate construction and a
Page 62
50
tapered tubular form, where diameter and wall thickness vary non-linearly along its
elevation. Outer diameter measures 4220 mm at the tower’s base and 2452 mm at
maximum elevation. Wall thickness measures 41 mm at the base and 22 mm at maximum
elevation. Composed of three sections bolted together, the tower measures 78.54 m in
height with a mass of approximately 148 tonnes, and is designed to withstand gusts of
59.5 m/s with an 18% turbulence intensity. A meteorological mast is positioned 150 m
West of the wind turbine. The wind farm is sited in an agricultural setting off the shores
of Lake Erie, which is located 3100 m South of the turbine under study.
The tower has been instrumented with a fiber Bragg grating (FBG) sensor array, as
presented by Bas et al. [20, 21], measuring longitudinal (vertical) deformation in the
tower at 100 Hz. Optical strain gauges are affixed to the North, South, East, and West
interior faces of the tower at six different elevations. Temperature compensation sensors
are also located at each elevation, allowing changes in temperature to be measured and
thermally-induced strain to be extracted from the total strain readings taken by the gauges
to produce mechanically-induced strain values. The West gauge positioned near tower
mid-height, termed Level 3, will be used for analysis given that the highest levels of
strain magnitude and variance are exhibited at this elevation for the instrumented turbine
tower model. The vertical location of the gauge under study and corresponding tower
properties at Level 3 are given in Table 4.6. Though prevailing on-site winds are from the
Southwest, the West direction demonstrates the highest probability of occurrence among
the cardinal directions. This indicates that the West and East sides of the tower will more
frequently be subjected to the direct windward action of the turbine’s axial rotor thrust,
which serves as a primary input of loading to the tower.
Page 63
51
Table 4.6: Strain gauge locations and corresponding tower properties at Level 3.
Level Elevation
(m)
Outer Diameter
(mm)
Wall Thickness
(mm)
Moment of Inertia
(mm4)
3 41.8 4200 14 3.24 x 10¹²
The meteorological mast is equipped with a vertical array of cup anemometers at 34, 61,
70, 77 and 80 m above ground level, and a wind vane located 77 m above ground level.
Wind conditions are categorized into two classes: a low-shear, high-turbulence condition
hereafter referred to as “turbulent”, and a high-shear, low-turbulence condition referred to
as “sheared”. These two classes are intended to describe the two major types of expected
wind profiles produced by diurnal patterns in solar ground heating at onshore sites.
Vertical wind shear is evaluated from 34 m to 80 m using 10-minute averages of the
shear exponent given in the power law equation [24]:
U(z) = UR (z
zR)
α
(1)
where U is the mean horizontal wind speed at a given height z, and UR is the mean speed
at a given reference height zR. Turbulence levels are evaluated using the 10-minute
horizontal turbulence intensity [25]:
𝐼𝑈 = 𝜎𝑢
𝑈 (2)
where σu and U are the horizontal wind speed standard deviation and mean at 80 m.
Turbulence intensity and wind shear thresholds for wind condition classifications are
given in Table 4.7, and have been adapted from thresholds used by Rareshide et al. [26]
to determine the impacts of shear and turbulence levels on turbine power production. The
turbulent condition thresholds approximately correspond with those of atmospheric
stability conditions ranging from very unstable to near neutral, and sheared condition
Page 64
52
thresholds correspond with stability conditions from very stable to stable; as have been
outlined by Wharton & Lundquist [27] and van den Berg [28].
Table 4.7: Wind condition classification.
Wind Condition Wind Shear Turbulence Intensity
Turbulent Low
α < 0.2
High
IU > 11%
Sheared High
α > 0.2
Low
IU < 11%
Measured strain values are not absolute, but rather a deviation from a baseline established
when the turbine is non-operational and wind speeds are low. Furthermore, due to the
significant effects introduced by the eccentric load present at the nacelle-tower interface
[20], the baseline is established when the turbine rotor was also facing South. The 100 Hz
readings from the strain gauge array have been converted to stress, assuming linear
elastic behaviour. Where shown, positive values indicate tensile stresses and negative
values indicate compressive stresses. Data has been collected during periods from
September 2011 to October 2011 and from December 2011 to February 2012; spanning a
portion of the Fall and Winter months in the Southern Canadian climate. Note that at this
wind farm installation, Winter serves as the foremost power production season in the
year.
4.4 RAINFLOW COUNTING
Time series data from the strain gauge array is converted to loading cycle counts using
the often-employed rainflow-counting algorithm. Use of the algorithm requires a pre-
processor to identify local extrema in the signal, which are then matched to form closed
hysteresis loops or loading cycles having both a stress amplitude and mean stress value
[29]. Rainflow counting is conducted using MATLAB numerical computing software,
Page 65
53
and the RAINFLOW toolbox developed by Nieslony [30], which prepares cycles
according to ASTM standards [31]. All loading cycles having an amplitude less than 1
MPa have been excluded from the tabulated cycle counts, being considered sufficiently
small to have a negligible effect on any potential fatigue damage imparted to the steel
turbine tower.
A ten-minute sample of the longitudinal stress signal from the West gauge at Level 3 is
shown in Figure 4.25 during operation in a Westerly wind near average on-site wind
speeds. The path indicated by points A-E-F represents a cycle having a stress amplitude
of 21 MPa and mean stress of 28 MPa, which includes an intermediate cycle indicated
along B-C-D having a stress amplitude of 7 MPa with a mean stress of 25 MPa. The
rainflow counting method facilitates counting the intermediate cycle outlined by B-C-D
separate from the cycle outlined by A-E-F; whereas conventional range counting
characterization of load spectra would instead identify three individual half cycles along
points A-B, B-C, and C-E which would be expected to have a smaller contribution to
imparted fatigue damage than would the larger cycle A-E-F [32].
Page 66
54
Figure 4.25: Ten-minute sample of longitudinal stress for West gauge at Level 3.
4.3 RESULTS
4.3.1 Loading History
A sample of the turbine’s loading history has been compiled using nearly 12 weeks (86
days) of time series data from the strain gauge array. The first 69 days of data were
truncated into half-hour segments by the strain array’s interrogation system. To improve
ease of data handling, the system was re-configured so that the last 17 days were
truncated into hour segments. To prevent “over counting” of unmatched half cycles,
successive half-hour and hour segments were stacked to form 5-day segments of time
series data which were then processed individually using the rainflow-counting
algorithm. Mean cycle stress and cycle stress amplitude were calculated and binned, with
the absolute maximum value in the range indicated in Figure 4.26 and Figure 4.27. A
logarithmic vertical axis is used to compare cycle counts of differing orders of
magnitude. In Figure 4.26, thermally-induced strain has been extracted from the signal
Page 67
55
using the temperature compensation sensors to provide solely mechanically-induced
strain, which is generated from loads produced by the wind and turbine operation. No
temperature compensation was conducted for the signal used in Figure 4.27, which
tabulates the total deformation in the tower over the course of the 12-week study period.
Figure 4.26: Mechanically-induced loading cycle spectra for twelve-week study period.
4035
3025
2015
105
1
10
100
1000
10000
100000
-80 -70 -60 -50 -40 -30 -20 -10 10 20 30 40 50 60 70 80
Stress
Amplitude
(MPa)
Cycl
e C
ou
nt
Mean Stress (MPa)
Page 68
56
Figure 4.27: Total loading cycle amplitude and mean spectra for twelve-week study period.
Positive mean stress values are shown to be more likely in Figure 4.26, as the greater
degree of Westerly winds will introduce tensile stresses into the West face of the tower.
Figure 4.27 demonstrates a wider range in mean stress values, as a result of the
temperature deviation experienced in the Southern Canadian climate over the
measurement campaign. A temperature change of 10 °C will result in a near 35 MPa
deviation in stress for the structural steel tower. The figures produced could be an asset to
the future design of wind turbine towers, given that design loading spectra are
traditionally simulation-based. Furthermore, the loading spectra produced could
potentially be used to assess the existing service life of the tower using fatigue strength
curves for structural components. In Figure 4.26, higher cycle counts are noted for mean
stress with an absolute value near 50 MPa and stress amplitude values of 15 MPa or
more. This phenomenon is the result of windward loading (from either the East or West
directions) introducing high cyclic loading into the West interior face of the tower. The
4035
3025
2015
105
1
10
100
1000
10000
100000
-120
-110
-100
-90
-80
-70
-60
-50
-40
-30
-20
-10
10
20
30
40
50
60
70
80
90
10
0
11
0
12
0
Stress
Amplitude
(MPa)
Cy
cle
Co
un
t
Mean Stress (MPa)
Page 69
57
cycle counts at given stress amplitudes across all mean stress values are shown in Figure
4.28, for both mechanically-induced and total loading cycles. Note that the predominant
on-site wind direction over the course of the study period was from the Southwest.
Therefore, the cycle counts compiled for the West gauge may potentially underestimate
the maximum cyclic loading levels experienced at Level 3.
Figure 4.28: Loading cycle amplitude spectra.
Marginal differences are observed between mechanically-induced and total loading cycle
amplitude spectra. Most notably, cycles having stress amplitudes from 35 to 40 MPa are
more frequent in the total stress-strain signal, which is thought to be the result of synoptic
or diurnal thermal effects. Linearly extrapolating cycle counts over an anticipated twenty-
year life expectancy yields in excess of 210 million loading cycles having amplitudes
more than 1 MPa.
1
10
100
1000
10000
100000
1000000
5 10 15 20 25 30 35 40
Cycl
e C
ou
nt
Stress Amplitude (MPa)
Mechanically-Induced Total
Page 70
58
4.3.2 Loading Spectra Across Wind Speed
To study the effects of the wind profile directly upstream of the turbine on the windward
mechanically-induced response of the tower, winds from the Westerly sector (average
ten-minute wind direction at 77 m of 270° ± 15°) are used for analysis, with ten-minute
wind speeds at 80 m correlated with loading cycle counts compiled by employing the
rainflow-counting algorithm on ten-minute segments of time series stress data. Though
wind speed values are also directly available from the turbine through the farm’s
supervisory control and data acquisition system, such measurements are taken at the rear
of the nacelle in the wake of the rotating rotor blades, therefore the unobstructed upwind
readings taken by the meteorological mast are used instead. The cycle counts are
averaged to construct the amplitude spectrum expected over an hour of operation at a
given wind speed. Figure 4.29 shows amplitude spectra across hub-height wind speeds
less than the turbine’s rated speed of near 11 m/s, where maximum power production is
achieved, and Figure 4.30 shows amplitude spectra across hub-height wind speeds at
rated speed and above. Error bars indicate a single standard deviation of sample variance
in the positive and negative directions.
Page 71
59
Figure 4.29: Loading amplitude spectra for hour of operation across wind speeds, below rated speed.
Figure 4.30: Loading amplitude spectra for hour of operation across wind speed, at and above rated speed.
Noting that mean stress in the tower is expected to increase with wind speed up to a
maximum at rated speed and then gradually decrease with increasing wind speed due to a
reduction in axial rotor thrust [5, 15, 17], cycle counts across all stress amplitudes are
largely shown to increase with increasing hub-height wind speeds. While smaller cycles
with amplitudes of less than 15 MPa increase fairly proportionally with wind speed, a
1
10
100
1000
5 10 15 20 25 5 10 15 20 25 5 10 15 20 25 5 10 15 20 25 5 10 15 20 25
Cy
cle
Co
un
t
Stress Amplitude (MPa)
U80 = 7 m/sU80 = 6 m/s U80 = 8 m/s U80 = 9 m/s U80 = 10 m/s
1
10
100
1000
5 10 15 20 25 5 10 15 20 25 5 10 15 20 25 5 10 15 20 25 5 10 15 20 25
Cycl
e C
ou
nt
Stress Amplitude (MPa)
U80 = 12 m/sU80 = 11 m/s U80 = 13 m/s U80 = 14 m/s U80 = 15 m/s
Page 72
60
significant increase in cycles having amplitudes in excess of 15 MPa is observed as wind
speeds transition from below-rated to above-rated speeds. This is speculated to be the
result of pitch excitation type vibration [17], where decreases in wind speed cause the
turbine to compensate by decreasing blade pitch angle, thereby increasing the axial rotor
thrust and resulting tower bending moment. This phenomenon will occur at above-rated
wind speeds where the turbine controller actively pitches the rotor blades to prevent
turbine overload and maintain steady power production, as opposed to below-rated
speeds where blade pitch is held relatively constant after the cut-in speed of
approximately 3 m/s has been reached.
4.3.3 Loading Spectra Across Wind Conditions
Likewise, to study the effects of differing wind profiles on the mechanically-induced
windward response of the tower, winds from the Westerly sector at four different hub-
height wind speeds, two above rated speed and two below, were categorized into
turbulent or sheared conditions. Wind speeds were selected on the basis of availability of
data. Ten-minute cycle counts are then compiled into an hour, as shown in Figure 4.31 –
4.34, with error bars of a single standard deviation indicated.
Page 73
61
Figure 4.31: Loading amplitude spectra for hour of operation at U80 = 6 m/s, classified by wind condition.
Figure 4.32: Loading amplitude spectra for hour of operation at U80 = 8 m/s, classified by wind condition.
1
10
100
1000
5 10 15 20
Cy
cle
Co
un
t
Stress Amplitude (MPa)
Turbulent Sheared
1
10
100
1000
5 10 15 20 25
Cycl
e C
ou
nt
Stress Amplitude (MPa)
Turbulent Sheared
Page 74
62
Figure 4.33: Loading amplitude spectra for hour of operation at U80 = 13 m/s, classified by wind condition.
Figure 4.34: Loading amplitude spectra for hour of operation at U80 = 17 m/, classified by wind condition.
Turbulent conditions are shown to coincide with markedly higher cycle counts across
stress amplitudes and surveyed wind speeds, with few exceptions. This phenomenon is
partially attributed to higher yawing activity resulting from greater horizontal wind
direction variability under such conditions, as the turbine controller attempts to better
position the rotor into the prevailing horizontal wind direction and moves the
1
10
100
1000
5 10 15 20 25 30
Cy
cle
Co
un
t
Stress Amplitude (MPa)
Turbulent Sheared
1
10
100
1000
5 10 15 20 25 30
Cycl
e C
ou
nt
Stress Amplitude (MPa)
Turbulent Sheared
Page 75
63
compressive load presented by the rotor-nacelle along the circumference of the tower
wall. Higher cyclic loading under turbulent conditions is also attributed to forced
vibration buffeting of the tower under wind gusts, as well as changes in the quasi-static
load from load-unloading action of the rotor. From the results in Figure 7, it is therefore
suggested that fluctuation in the horizontal component of wind velocity has a greater
impact on the cyclic loading subjected to the turbine tower than does the velocity gradient
across the turbine rotor.
The disparity between turbulent and sheared condition cycle counts is also shown to vary
depending on hub-height wind speed in Figure 4.31 – 4.34. Notably this disparity
increases between wind speeds of 13 and 17 m/s for cycle amplitudes in excess of 15
MPa. This is speculated to be the result of heightened dynamic action under turbulent
conditions, which increases with wind speed, via the aforementioned pitch excitation
mechanism. The moment-based gust reaction factor, a ratio of maximum to average
tower base moment, has been expressed empirically by Ishihara et al. [32] and is
expected to rise with increasing hub-height wind speed and turbulence intensity [17],
when blade pitch control is activated after rated speed has been reached.
4.4 CONCLUDING REMARKS & FUTURE WORK
The cyclic loading of a steel wind turbine tower has been compiled and correlated with
varying wind conditions, with the following analyses conducted and conclusions drawn:
High-turbulence, low-shear conditions coincide with increased levels of loading
cycles compared with low-turbulence, high-shear conditions across all surveyed
wind speeds
Page 76
64
Loading cycle counts are seen to generally increase with increasing hub-height
wind speed.
A sample of the turbine tower’s loading history has been assembled from a
twelve-week measurement campaign, with mean and amplitude stress spectra
tabulated with and without consideration of thermally-induced deformation
effects. Given the highly stochastic nature of the aerodynamic loading under
which the turbine structure is subjected, the loading history sample collected from
an operational full-sized commercial wind turbine can aid in the further
optimization of tower design.
Linear extrapolation of the loading history sample yields more than 210 million
loading cycles in excess of 1 MPa over an anticipated twenty-year turbine service
life.
Future work should look to incorporate the material properties of the structural steel
turbine tower to find levels of fatigue damage equivalent loads for the measured load
spectra. Measured load spectra from the tower wall can be employed to draw inferences
on the loading to which other critical points of the tower, such as welds or flanged
sections, are subjected. Given the potential impacts of loading sequence on the expected
fatigue strength of structural steel [33], future analysis should also look to characterize
the cyclic load sequences unique to wind turbine towers in varying operational state
REFERENCES
[1] G. Horvath and L. Toth, "New methods in wind turbine tower design," Wind
Engineering 25(3), pp. 171-178, 2001.
Page 77
65
[2] B. Hahn, M. Durstewitz and K. Rohrig, "Reliability of wind turbines: Experiences
of 15 years and 1,500 WTs," in Wind Energy: Proceedings of the Euromech
Colloquium, Berlin, 2007.
[3] H. J. Sutherland, "A summary of the fatigue properties of wind turbine materials,"
Wind Energy, vol. 3, pp. 1-34, 2000.
[4] G. C. Larsen, "Offshore fatigue design turbulence," Wind Energy, vol. 4, pp. 107-
120, 2001.
[5] H. Hau, Wind Turbines: Fundamentals, Technologies, Applications and Economics,
Munich: Springer, 2000.
[6] J. Sumner and C. Masson, "Influence of atmospheric stability on wind turbine
power performance curves," Journal of Solar Energy Engineering, vol. 128, no. 4,
pp. 531-538, 2006.
[7] D. Adams, J. White, M. Rumsey and C. Farrar, "Structural health monitoring of
wind turbines: Method and application to a HAWT," Wind Energy 14(4), pp. 603-
623, 2011.
[8] A. Sathe and W. Bierbooms, "Influence of different wind profiles due to varying
atmospheric stability on the fatigue life of wind turbines," Journal of Physics:
Conference Series, vol. 75, 2007.
[9] P. Fugslang, C. Bak, J. G. Schepers, B. Bulder, T. T. Cockerill, P. Claiden, A.
Olesen and R. van Rossen, "Site-specific design optimization of wind turbines,"
Wind Energy, vol. 5, pp. 261-279, 2002.
[10] J.-S. Chou and W.-T. Tu, "Failure analysis and risk management of a collapsed
large wind turbine tower," Engineering Failure Analysis, vol. 18, no. 1, pp. 295-
313, 2011.
[11] N. Bazeos, G. D. Hatzigeorgiou, I. D. Hondros, H. Karamaneas, D. L. Karabalis
and D. E. Beskos, "Static, seismic and stability analyses of a prototype wind turbine
steel tower," Engineering Structures, vol. 24, no. 8, pp. 1015-1025, 2002.
[12] I. Lavassas, G. Nikolaidis, P. Zervas, E. Efthimiou, I. N. Doudoumis and C. C.
Baniotopoulos, "Analysis and design of the prototype of a steel 1-MW wind turbine
tower," Engineering Structures, vol. 25, no. 8, pp. 1097-1106, 2003.
[13] H.-J. Bang, H.-I. Kim, M. Jang and J.-H. Han, "Tower deflection monitoring of a
wind turbine using an array of fiber bragg grating sensors," in Proceedings of the
ASME 2011 Conference on Smart Materials, Adaptive Structures and Intelligent
Systems, Scottsdale, 2011.
Page 78
66
[14] C. Rebelo, M. Veljkovic, L. Simões da Silva, R. Simões and J. Henriques,
"Structural monitoring of a wind turbine steel tower - Part I: System description and
calibration," Wind and Structures, vol. 15, no. 4, pp. 285-299, 2012.
[15] C. Rebelo, M. Veljkovic, R. Matos and L. Simões da Silva, "Structural monitoring
of a wind turbine steel tower - Part II: monitoring results," Wind and Structures,
vol. 15, no. 4, pp. 301-311, 2012.
[16] P. Ragan and L. Manuel, "Comparing estimates of wind turbine fatigue loads using
time-domain and spectral methods," Wind Engineering, vol. 31, no. 2, pp. 83-99,
2007.
[17] A. Muto, J. Suzuki, N. Kubo and T. Karaushi, "Wind turbine load evaluation during
normal operation," Journal of Fluid Science and Technology, vol. 6, no. 3, pp. 292-
299, 2011.
[18] K. Bassett, R. Carriveau and D. S.-K. Ting, "Vibration analysis of 2.3 MW wind
turbine operation using the discrete wavelet transform," Wind Engineering, vol. 34,
no. 4, pp. 375-388, 2010.
[19] K. Bassett, R. Carriveau and D. S.-K. Ting, "Vibration response of a 2.3 MW wind
turbine to yaw motion and shut down events," Wind Energy 14(8), pp. 939-952,
2011.
[20] J. Bas, R. Carriveau, S. Cheng and T. Newson, "Strain response of a wind turbine
tower as a function of nacelle orientation," in BIONATURE 2012 : The Third
International Conference on Bioenvironment, Biodiversity and Renewable
Energies, St. Maarten, 2012.
[21] J. Bas, J. Smith, R. Carriveau, S. Cheng, D. S.-K. Ting and T. Newson, "Structural
response of a commercial wind turbine to various stopping events," Wind
Engineering 36(5), pp. 553-569, 2012.
[22] N. Agbayani and V. Kyatham, "Fatigue-driven wind farm towers: A practical
introduction to fatigue calculations," in Structures 2009: Don't Mess with Structural
Engineers - Expanding Our Role, Austin, 2009.
[23] Google, "Google Maps," 2013. [Online]. Available: http://maps.google.ca/.
[Accessed 15 May 2013].
[24] O. G. Sutton, Atmospheric turbulence, London: Methuen, 1949.
[25] T. Burton, D. Sharpe, N. Jenkins and E. Bossanyi, Wind Energy Handbook,
Chicester: John Wiley & Sons, 2001.
Page 79
67
[26] E. Rareshide, A. Tindal, C. Johnson, A. Graves, E. Simpson, J. Bleeg, T. Harris and
D. Schoborg, "Effects of complex wind regimes on turbine performance," in
Podium presentation at AWEA WINDPOWER 2009 Conference, Chicago, 2009.
[27] S. Wharton and J. K. Lundquist, "Assessing atmospheric stability and its impact on
rotor-disk wind characteristics at an offshore wind farm," Wind Energy 15(4), pp.
525-546, 2012.
[28] G. P. van den Berg, "Wind turbine power and sound in relation to atmospheric
stability," Wind Energy 11(2), pp. 151-169, 2008.
[29] H. J. Sutherland, On the fatigue analysis of wind turbines, Albuquerque: Sandia
National Laboratories, 1999.
[30] A. Nieslony, "Determination of fragments of multiaxial service loading strongly
influencing the service life of machine components," Mechanical Systems and
Signal Processing, vol. 23, pp. 2712-2721, 2009.
[31] ASTM E1049, "Standard practices for cycle counting in fatigue analysis," in
Annual Book of ASTM Standards 3.01, Philadelphia, American Society for Testing
and Materials, 1999, pp. 710-718.
[32] A. Schijve, Fatigue of Structures and Materials 2nd ed, Berlin: Springer, 2010.
[33] T. Ishihara, H. Ishii and M. Nishio, "Maximum wind loads on a wind turbine under
operating conditions," in European Wind Energy Association: Europe's Premier
Wind Energy Event, Brussels, 2011.
[34] B. Bhattacharya and B. Ellingwood, "Continuum damage mechanics analysis of
fatigue crack initiation," International Journal of Fatigue, vol. 20, no. 9, pp. 631-
639, 1998.
Page 80
68
CHAPTER 5
Conclusions
Atmospheric conditions have been correlated with wind turbine tower structural loading
and power production at an onshore wind farm in Southwestern Ontario over a six-month
measurement campaign spanning September 2011 to February 2012. Sensitivity of power
extraction to changes in approaching wind profile have been observed; with high-
turbulence, low-shear conditions (referred to in this study as turbulent) raising normalized
power by upwards of 2% over high-shear, low-turbulence conditions (referred to as
sheared) at low-to-moderate wind speeds. Sheared conditions have produced an increase
in normalized power of as much as 2% over turbulent for higher wind speeds close to the
rated speed of the turbine. The outlined condition classes demonstrated strong diurnal
correlation, with sheared conditions more frequently expected at night and turbulent
conditions more frequent during the day. The mean and maximum flexural loading in the
base of the tower has shown to be at a maximum at rated wind speed of the turbine, and
will gradually reduce with increasing speeds. Though turbulent conditions coincide with
lower mean flexural loading measured by a single static strain gauge in the tower,
expected in large part to be the result of higher directionally variability under such
conditions leading to higher yawing activity, these conditions have also been shown to
coincide with much higher loading variance resulting in higher cyclic load. A tower
loading history sample has been constructed from twelve weeks of turbine operation, and
characteristic hourly cyclic loading spectra have been shown for the tower as it operates
in varying wind conditions and operational states.
Page 81
69
A trade-off is demonstrated between the higher power production turbulent conditions are
capable of producing under average onsite wind speeds versus the higher cyclic loading
such conditions impart to the structural supporting tower and presumably to the rotor as
well. The results of this work could help improve wind farm operators’ assessments of
the useful remaining service for wind turbine components. It could also help improve
daily forecasting of individual turbine or wind farm performance based on given climate
conditions, which would be valuable to both grid operators working to integrate wind
power onto the utility grid and to wind farm operators looking to predict revenue. An
improved understanding how site-specific and diurnally or seasonally varying wind
conditions affect overall turbine performance, including power production and structural
degradation, will reduce the uncertainty associated with wind energy projects and help
solidify the future of the industry.
Future work should look to incorporate the other half of the year at the studied wind farm
site to demonstrate whether observed trends hold during warmer months. Increasing the
number of measurement points for the approaching wind field, potentially through the
use of remote sensing technology to characterize wind speeds and turbulence at even
higher levels of the atmospheric boundary layer, would allow for an improvement in the
characterization of wind condition patterns onsite. Also increasing the measurement time
resolution of all studied parameters could help to clarify the physical phenomenon
affecting turbine rotor dynamics under changing inflow parameters. The results presented
in this study have observed the structural and power production data for a single turbine,
but future work should consider the inclusion of multiple turbines within a single farm or
even multiple farms within a localized region. As the density of commercial wind farms
Page 82
70
continues to rise in the Great Lakes region of Southwestern Ontario, the propagation and
interaction of single turbine wakes or group farm wakes under changing atmospheric
stability could have major implications for wind farm siting and wind energy forecasting.
Page 83
71
APPENDIX A
Meteorological Mast Data Output Sample
W
S80_
ms
WS
77
_m
s W
S7
0_
ms
WS
34_
ms
TIM
E
ST
AM
P
AV
G
ST
D
DE
V
MA
X
MIN
A
VG
ST
D
DE
V
MA
X
MIN
A
VG
ST
D
DE
V
MA
X
MIN
A
VG
ST
D
DE
V
MA
X
MIN
01/0
1/2
012
0:1
0
10.2
66
1.1
64
13.8
98
7.6
78
10
.43
2
1.0
27
1
2.6
77
8
.93
4
8.9
32
0
.72
4
10
.22
9
7.9
40
7.4
63
1.3
54
9.4
44
4.8
72
01/0
1/2
012
0:2
0
10.3
85
1.1
41
12.6
54
5.8
13
9
.99
5
1.1
41
1
2.0
54
7
.68
7
9.0
85
1
.20
6
10
.99
2
7.1
77
7.9
96
1.5
43
10.2
06
5.6
34
01/0
1/2
012
0:3
0
9.8
51
1.2
53
13.2
76
6.4
35
1
0.6
19
1
.28
4
12
.67
7
8.3
11
9
.46
6
1.1
37
1
1.7
55
7
.94
0
7.7
68
1.1
25
9.4
44
5.6
34
01/0
1/2
012
0:4
0
10.2
26
1.1
94
12.6
54
5.8
13
1
0.2
44
1
.48
4
12
.05
4
8.3
11
9
.00
8
0.9
65
1
0.2
29
7
.94
0
7.4
63
0.9
64
9.4
44
5.6
34
01/0
1/2
012
0:5
0
10.8
40
0.7
88
12.6
54
7.6
78
1
0.4
32
0
.73
2
11
.43
0
8.9
34
9
.39
0
0.6
68
1
0.2
29
8
.70
3
8.3
01
0.8
98
10.2
06
7.1
58
01/0
1/2
012
1:0
0
10.0
54
0.9
68
13.2
76
7.0
57
9
.99
5
0.6
61
1
1.4
30
9
.55
8
8.5
50
0
.86
6
9.4
66
7
.17
7
7.6
15
1.3
54
9.4
44
5.6
34
01/0
1/2
012
1:1
0
9.2
75
1.1
57
12.0
32
5.8
13
9
.37
1
0.6
61
1
0.1
82
8
.31
1
7.7
11
0
.95
5
8.7
03
6
.41
4
6.9
29
1.3
46
8.6
82
4.8
72
01/0
1/2
012
1:2
0
9.9
05
0.8
23
11.4
10
7.0
57
1
0.1
20
0
.46
0
10
.80
6
9.5
58
8
.70
3
0.6
23
9
.46
6
7.9
40
7.3
10
0.6
01
7.9
20
6.3
96
01/0
1/2
012
1:3
0
9.6
83
0.8
41
12.0
32
7.6
78
1
0.1
20
0
.80
3
11
.43
0
8.9
34
8
.70
3
0.6
23
9
.46
6
7.9
40
7.3
10
1.1
25
8.6
82
5.6
34
01/0
1/2
012
1:4
0
9.3
00
0.6
31
11.4
10
7.0
57
9
.55
8
0.4
16
1
0.1
82
8
.31
1
8.3
22
0
.40
2
8.7
03
7
.94
0
7.3
10
0.8
65
8.6
82
5.6
34
01/0
1/2
012
1:5
0
8.7
49
0.8
47
10.7
88
5.1
91
8
.74
7
0.9
78
1
0.1
82
7
.06
3
7.4
82
0
.96
5
8.7
03
5
.65
1
6.0
15
0.5
39
7.1
58
5.6
34
01/0
1/2
012
2:0
0
9.0
50
0.7
90
10.7
88
6.4
35
9.0
59
0
.82
1
10
.18
2
7.6
87
7
.48
2
1.0
30
8
.70
3
5.6
51
6.6
25
1.1
39
8.6
82
4.8
72
01/0
1/2
012
2:1
0
9.3
50
0.7
22
10.7
88
6.4
35
9
.43
3
0.8
21
1
0.1
82
7
.68
7
7.7
87
0
.70
1
8.7
03
6
.41
4
6.8
53
0.7
36
7.9
20
5.6
34
01/0
1/2
012
2:2
0
9.3
83
0.5
14
10.1
66
7.0
57
9
.49
6
0.6
87
1
0.1
82
8
.31
1
8.1
69
0
.62
8
8.7
03
7
.17
7
6.8
53
0.5
33
7.9
20
5.6
34
01/0
1/2
012
2:3
0
9.3
76
0.4
49
10.7
88
8.3
00
9
.43
3
0.2
63
9
.55
8
8.3
11
8
.16
9
0.3
69
8
.70
3
7.9
40
7.4
63
0.7
36
8.6
82
6.3
96
Page 84
72
VITA AUCTORIS
NAME: Jamie Cameron Smith
PLACE OF BIRTH:
Windsor, ON
YEAR OF BIRTH:
1989
EDUCATION:
Sandwich Secondary School, LaSalle, ON, 2007
University of Windsor, B.A.Sc., Windsor, ON, 2011
University of Windsor, M.A.Sc., Windsor, ON, 2014