Effects of irrigated agroecosystems: 2. Quality of soil water and groundwater in the southern High Plains, Texas B. R. Scanlon, 1 J. B. Gates, 2 R. C. Reedy, 1 W. A. Jackson, 3 and J. P. Bordovsky 4 Received 23 July 2009; revised 1 March 2010; accepted 4 May 2010; published 30 September 2010. [1] Trade‐offs between water‐resource depletion and salinization need to be understood when promoting water‐conservative irrigation practices. This companion paper assesses impacts of groundwater‐fed irrigation on soil water and groundwater quality using data from the southern High Plains (SHP). Unsaturated zone soil samples from 13 boreholes beneath irrigated agroecosystems were analyzed for water‐extractable anions. Salt accumulation in soils varies with irrigation water quality, which ranges from low salinity in the north (median Cl: 21 mg/L) to higher salinity in the south (median Cl: 180 mg/L). Large Cl bulges under irrigated agroecosystems in the south are similar to those under natural ecosystems, but they accumulated over decades rather than millennia typical of natural ecosystems. Profile peak Cl concentrations (1200–6400 mg/L) correspond to irrigation efficiencies of 92–98% with respect to drainage and are attributed to deficit irrigation with minimal flushing. Perchlorate (ClO 4 ) also accumulates under irrigated agroecosystems, primarily from irrigation water, and behaves similarly to Cl. Most NO 3 ‐N accumulation is below the root zone. Groundwater total dissolved solids (TDS) have increased by ≤960 mg/L and NO 3 ‐N by ≤9.4 mg/L since the early 1960s. Mobilization of salts that have accumulated under irrigated agroecosystems is projected to degrade groundwater much more in the future because of the essentially closed‐basin status of the aquifer, with discharge occurring primarily through irrigation pumpage. TDS are projected to increase by an additional 2200 mg/L (median), ClO 4 by 21 mg/L, and NO 3 ‐N by 52 mg/L. Water and salt balances should be considered in irrigation management in order to minimize salinization issues. Citation: Scanlon, B. R., J. B. Gates, R. C. Reedy, W. A. Jackson, and J. P. Bordovsky (2010), Effects of irrigated agroecosystems: 2. Quality of soil water and groundwater in the southern High Plains, Texas, Water Resour. Res., 46, W09538, doi:10.1029/2009WR008428. 1. Introduction [2] As with the quantity of available water resources, water quality can also be a limiting factor in agricultural productivity and sustainability of land and water resources. Soil salinization impacts ∼20–25% of irrigated land in the United States. [Ghassemi et al., 1995]. Many irrigation studies over the last several decades have emphasized the importance of salt management and leaching requirements for crop production [Rose et al., 1979; Smith and Hancock, 1986]; however, recent emphasis on decreasing irrigation applications to reduce water resource depletion may not provide sufficient irrigation water to leach salts through the system. In addition, there has been considerable debate in recent years about whether proposed water conservative irrigation practices based on improved irrigation technolo- gies actually conserve water at the basin scale [Huffaker and Whittlesey, 2003; Scheierling et al., 2006]. Although runoff and recharge may be considered losses to the system at the field plot scale, these flows would not be considered true losses at the basin scale [Perry, 2007]. More efficient irri- gation technologies often increase crop‐water consumption because water is applied more uniformly to crop root zones, and crop yield also increases. For example, Ward and Pulido‐Velazquez [2008] showed that for the Rio Grande basin, increasing application of drip irrigation technology would result in increased water depletion at a basin level because of increased crop evapotranspiration (ET) and reduced runoff and recharge. It is essential that leaching requirements for crop production not be overlooked in proposed water conservative irrigation practices. It has also been suggested that salt rights need to be considered, along with water rights, for irrigation [Oster and Wichelns, 2003]. 1.1. How Does Irrigation Salinize Soils and Groundwater? [3] Irrigation adds a considerable amount of salts to soils relative to precipitation in nonirrigated cropland. Crop ET is 1 Bureau of Economic Geology, Jackson School of Geosciences, University of Texas at Austin, Austin, Texas, USA. 2 Department of Geosciences, University of Nebraska‐ Lincoln, Lincoln, Nebraska, USA. 3 Department of Civil and Environmental Engineering, Texas Tech University, Lubbock, Texas, USA. 4 Texas Agricultural Experiment Station, Texas A&M University, College Station, Texas, USA. Copyright 2010 by the American Geophysical Union. 0043‐1397/10/2009WR008428 WATER RESOURCES RESEARCH, VOL. 46, W09538, doi:10.1029/2009WR008428, 2010 W09538 1 of 14
Transcript
Effects of irrigated agroecosystems:2. Quality of soil water and groundwater in the southernHigh Plains, Texas
B. R. Scanlon,1 J. B. Gates,2 R. C. Reedy,1 W. A. Jackson,3 and J. P. Bordovsky4
Received 23 July 2009; revised 1 March 2010; accepted 4 May 2010; published 30 September 2010.
[1] Trade‐offs between water‐resource depletion and salinization need to be understoodwhen promoting water‐conservative irrigation practices. This companion paper assessesimpacts of groundwater‐fed irrigation on soil water and groundwater quality using datafrom the southern High Plains (SHP). Unsaturated zone soil samples from 13 boreholesbeneath irrigated agroecosystems were analyzed for water‐extractable anions. Saltaccumulation in soils varies with irrigation water quality, which ranges from low salinity inthe north (median Cl: 21 mg/L) to higher salinity in the south (median Cl: 180 mg/L). LargeCl bulges under irrigated agroecosystems in the south are similar to those under naturalecosystems, but they accumulated over decades rather than millennia typical of naturalecosystems. Profile peak Cl concentrations (1200–6400 mg/L) correspond to irrigationefficiencies of 92–98% with respect to drainage and are attributed to deficit irrigation withminimal flushing. Perchlorate (ClO4) also accumulates under irrigated agroecosystems,primarily from irrigation water, and behaves similarly to Cl. Most NO3‐N accumulation isbelow the root zone. Groundwater total dissolved solids (TDS) have increased by ≤960mg/Land NO3‐N by ≤9.4 mg/L since the early 1960s. Mobilization of salts that have accumulatedunder irrigated agroecosystems is projected to degrade groundwater much more in thefuture because of the essentially closed‐basin status of the aquifer, with discharge occurringprimarily through irrigation pumpage. TDS are projected to increase by an additional2200 mg/L (median), ClO4 by 21 mg/L, and NO3‐N by 52 mg/L. Water and salt balancesshould be considered in irrigation management in order to minimize salinization issues.
Citation: Scanlon, B. R., J. B. Gates, R. C. Reedy, W. A. Jackson, and J. P. Bordovsky (2010), Effects of irrigatedagroecosystems: 2. Quality of soil water and groundwater in the southern High Plains, Texas, Water Resour. Res., 46, W09538,doi:10.1029/2009WR008428.
1. Introduction
[2] As with the quantity of available water resources,water quality can also be a limiting factor in agriculturalproductivity and sustainability of land and water resources.Soil salinization impacts ∼20–25% of irrigated land in theUnited States. [Ghassemi et al., 1995]. Many irrigationstudies over the last several decades have emphasized theimportance of salt management and leaching requirementsfor crop production [Rose et al., 1979; Smith and Hancock,1986]; however, recent emphasis on decreasing irrigationapplications to reduce water resource depletion may notprovide sufficient irrigation water to leach salts through thesystem. In addition, there has been considerable debate in
recent years about whether proposed water conservativeirrigation practices based on improved irrigation technolo-gies actually conserve water at the basin scale [Huffaker andWhittlesey, 2003; Scheierling et al., 2006]. Although runoffand recharge may be considered losses to the system at thefield plot scale, these flows would not be considered truelosses at the basin scale [Perry, 2007]. More efficient irri-gation technologies often increase crop‐water consumptionbecause water is applied more uniformly to crop root zones,and crop yield also increases. For example, Ward andPulido‐Velazquez [2008] showed that for the Rio Grandebasin, increasing application of drip irrigation technologywould result in increased water depletion at a basin levelbecause of increased crop evapotranspiration (ET) andreduced runoff and recharge. It is essential that leachingrequirements for crop production not be overlooked inproposed water conservative irrigation practices. It has alsobeen suggested that salt rights need to be considered, alongwith water rights, for irrigation [Oster and Wichelns, 2003].
1.1. How Does Irrigation Salinize Soilsand Groundwater?
[3] Irrigation adds a considerable amount of salts to soilsrelative to precipitation in nonirrigated cropland. Crop ET is
1Bureau of Economic Geology, Jackson School of Geosciences,University of Texas at Austin, Austin, Texas, USA.
2Department of Geosciences, University of Nebraska‐Lincoln,Lincoln, Nebraska, USA.
3Department of Civil and Environmental Engineering, Texas TechUniversity, Lubbock, Texas, USA.
4Texas Agricultural Experiment Station, Texas A&M University,College Station, Texas, USA.
Copyright 2010 by the American Geophysical Union.0043‐1397/10/2009WR008428
WATER RESOURCES RESEARCH, VOL. 46, W09538, doi:10.1029/2009WR008428, 2010
similar to desalinization in that root‐water uptake excludesmost salts, and soil water salinity levels, which are harmfulto crops, may build up when water drainage or percolationthrough the root zone is insufficient to flush accumulatedsalts [Richards, 1954]. Concentrations of salts in soilsdepend on the water balance of the system. Assuming steadystate with no change in water storage:
Pe ¼ R ¼ I þ P � ET � Ro ð1Þ
where Pe is percolation below the root zone, R is rechargeat the water table, I is irrigation, P is precipitation, ET isevapotranspiration, and Ro is runoff, with all units expressedin mm/a. Considering a salt balance using Cl as an exampleand assuming no runoff:
PeClsw ¼ RClsw ¼ IClI þ PClP � ETClET ð2Þ
where subscripts associated with Cl refer to Cl concentra-tions in those media and sw is soil water. In irrigation sys-tems that are 50% efficient with respect to drainage, i.e., ET =50% of I + P, Clsw will double relative to Cl in irrigation andprecipitation, assuming crops do not take up any Cl. In con-trast, for an irrigation system that is 95% efficient, which isapproximately the upper limit of sprinkler systems, ET =95% of I + P and Clsw will increase by a factor of 20 relativeto Cl in irrigation and precipitation. Although it is generallyassumed that recharge is greater beneath irrigated versusnonirrigated cropland because of additional water input tothe system through irrigation, crop yields and associated ETrates are generally much higher in irrigated cropland andcan greatly reduce percolation in the system and increasesalinity of percolation water. In addition to soil salinization,groundwater salinity can increase under irrigated agroeco-systems by mobilizing salts that accumulated under naturalecosystems [Stonestrom et al., 2003; McMahon et al., 2006]through increased recharge caused by conversion of deep‐rooted perennial native vegetation to shallow‐rooted annualcrops [Scanlon et al., 2007]. Assessing nutrient buildupbeneath irrigated cropland is much more complicated thanthat of salts with inputs, in addition to irrigation water, fromfertilizers and mineralization and nitrification of soil organicnitrogen (SON) and additional sinks in crop uptake andvolatilization.
1.2. What Controls Salinity Buildup Under IrrigatedCropland?
[4] Controls on salinity buildup include irrigation waterquality, ET, root‐zone depth, soils, and climate. As dis-cussed previously, irrigation water quality can vary fromfresh water to brackish water, depending on the source[Stonestrom et al., 2003; Oren et al., 2004; Schoups et al.,2005]. Irrigation application rates relative to crop ETdetermine the concentration factor in the crop root zone.Annual crops have limited time to develop deep roots thatwould remove more water and increase salinity buildup.Soil types can also impact salinity buildup. Finer grainedsoils retain irrigation water within the root zone for longerperiods, allowing more time for ET and salinity buildup.Seasonal distribution of precipitation can also play animportant role in controlling salinization. Precipitationcoincident with crop demand should result in greater soilsalinization versus precipitation that is not. In the saturated
zone, the volume of water impacts the capacity to dilute orassimilate salts introduced from the unsaturated zone, withsalinity in mg/L increasing linearly as aquifer saturatedthickness decreases.
1.3. How Can Irrigation Be Managed SustainablyWith Respect to Soil Water and Groundwater Quality?
[5] Approaches to achieve sustainability with respect towater quality may differ from those required for waterquantity. Minimizing soil salinization requires irrigationwith sufficient water to flush salts through the profile;however, this approach runs counter to water‐conservativeirrigation approaches promoted in recent decades to reducegroundwater depletion. Rotating between irrigated and rain‐fed agriculture would reduce salinization because ofextremely low salt concentrations in precipitation in rain‐fedagriculture. Ideally salts could be flushed through the soiland groundwater to discharge from the system through sur-face water bodies. However, in many groundwater‐fed irri-gation systems, the primary discharge mechanism is throughirrigation pumpage, and salts are continually recycledthrough the system. Once salt bulges accumulate in soilprofiles, they need to be managed to minimize negative im-pacts on crop productivity and groundwater quality. Oneapproach would be to irrigate with water sufficient to main-tain the salt bulge below the root zone but not to mobilize thebulge into the aquifer. Salinity issues may pose a muchgreater problem for irrigated agriculture than water‐quantityissues because salinization may be irreversible.[6] The High Plains aquifer is one of the largest fresh‐
water aquifers in the United States. and in the world. Underpredevelopment conditions, i.e., prior to large‐scale irriga-tion pumpage, groundwater discharge balanced groundwaterrecharge [Sophocleous, 2000]. Salts in the High Plainsaquifer were originally derived primarily from underlyinghigh‐salinity aquifers, as shown by the earliest groundwatersampling in the 1930s and by stable isotope data [Nativ,1988]. With intensive groundwater development for irriga-tion, water for pumpage was initially derived from ground-water storage, as evidenced by declining water tables,and also from reduced discharge, and increased recharge[Blandford et al., 2003]. Discharge to springs alongstreams and along the margins of the SHP has been greatlyreduced with groundwater development for irrigation[Blandford et al., 2003]. The aquifer under current conditionscan essentially be considered a closed system, with the pri-mary discharge mechanism being irrigation pumpage.[7] Recharge beneath natural ecosystems is focused beneath
ephemeral lakes or playas and averages ∼6 to 11 mm/year,on the basis of groundwater Cl data in the SHP‐N region[Wood and Sanford, 1995; Scanlon et al., 2008a]. Saltloading from playas is negligible. There has been norecharge in interplaya areas since Pleistocene times∼10,000–15,000 years ago, and salts have accumulated insoil profiles during that time [Scanlon et al., 2003]. Con-version of natural ecosystems to rain‐fed agroecosystemsdid not change recharge in areas of low‐permeability fine‐grained soils, such as the SHP‐N region [Scanlon et al.,2008a], but increased recharge in sandier soils in theSHP‐S region (median 24 mm/year) [Scanlon et al., 2007].This increase in recharge mobilizes salts that accumulatedunder natural ecosystems and results in a transient input of
SCANLON ET AL.: EFFECTS OF IRRIGATION ON WATER QUALITY W09538W09538
2 of 14
salts to the High Plains aquifer. Previous studies indicatethat mobilization of salt inventories that accumulated undernatural ecosystems, approximated by profile 18 (Figure 1),into the underlying aquifer would increase median values ofCl by ≤150 mg/L, SO4 by ≤480 mg/L, and ClO4 by ≤14 mg/L[Scanlon et al., 2008c, 2009b]. Mobilizing NO3‐N that wascreated during initial cultivation would increase NO3‐N ingroundwater by up to 17 mg/L [Scanlon et al., 2008b].Because the groundwater system is essentially a closed basin,transient inputs of salts from external sources, such as thebulges that accumulated under natural ecosystems, that aremobilized by increased recharge under cropland, increase saltconcentrations in the aquifer.[8] Irrigation essentially redistributes salts from ground-
water to soils but may also result in the addition of salts tothe aquifer from external sources, such as through mobili-zation of salt bulges that accumulated under natural eco-systems or through application of treated wastewater and/orrecycled water [Beltrán, 1999; Kalavrouziotis et al., 2006].
If salts that were originally derived solely from the aquiferare mobilized back into the aquifer, the concentration on amass basis (mg salt/kg of sediment) should not change in theaquifer if there are no external inputs; however, salt con-centration on a volume basis (mg salt/L of water) in theaquifer would increase linearly as the amount of water inthe aquifer is depleted and the assimilative capacity of theaquifer is reduced. Nutrients, such as NO3‐N, are continu-ally added to the system from fertilizers and NO3‐N con-centrations should increase continually in the aquifer. Anartificial drainage system cannot be used to remove saltsbelow the root zone in groundwater fed irrigation systemsbecause the soil zone is generally unsaturated.[9] McMahon et al. [2007] noted that availability and
sustainability of water resources in the High Plains aquiferare affected by water quality and that processes that promoterecharge in this semiarid region, such as irrigation, increaseaquifer vulnerability to contamination by increasing chem-ical fluxes through the unsaturated zone and reducing transittimes to the water table. This study also notes that the SHPhad the poorest groundwater quality within the entire HighPlains aquifer, with maximum contaminant level (MCL)exceedances of TDS, NO3, As, and F. Chemical inventorieswere quantified in three natural ecosystem sites and twoadjacent irrigated sites, in the northern (NHP), central(CHP), and southern (SHP) High Plains [McMahon et al.,2006]. Salts that accumulated under natural ecosystemsaccount for 60–80% of Cl and NO3 inventories under irri-gated agroecosystems, whereas KCl fertilizer contributed tosome Cl at one site. Higher recharge rates under irrigatedagroecosystems versus natural ecosystems sites by factors of∼1.5 in the NHP, 8–11 in the CHP, and 85–160 in the SHPare mobilizing salt reservoirs that accumulated under naturalecosystems. Groundwater quality is projected to degradewhen these salt inventories reach the water table. Similarresults were found beneath irrigated sites in the AmargosaDesert, where increased percolation under irrigated sitesmobilized Cl and NO3 bulges that accumulated under nat-ural ecosystems [Stonestrom et al., 2003; Scanlon et al.,2005]. Increased percolation/recharge under cropland isnot considered important for groundwater pesticide con-tamination according to studies in the High Plains because80–100% of pesticide inventories were found in the upper2 m of the soil profile, indicating significant retention anddegradation of pesticides [McMahon et al., 2006]. AlthoughAs has been applied to defoliate cotton in the past and F canbe derived from precipitation, previous studies show that Asand F are readily sorbed onto soils in the SHP and are gen-erally not mobilized by increased percolation/recharge[Reedy et al., 2007; Scanlon et al., 2009b].[10] Perchlorate (ClO4) is another salt that can degrade
groundwater and has been found at concentrations of up to200 mg/L in groundwater in the SHP [Rajagopalan et al.,2006]. Although there is no established MCL for ClO4 ingroundwater, a National Research Council panel in 2005suggested that a reference dose of 0.7 mg/kg body weight(bw) per day would be appropriate, which translates into adrinking‐water equivalent level of 24.5 mg/L [NationalResearch Council, 2005]. Perchlorate adversely affectshuman health by competitively inhibiting iodide uptake intothe thyroid, resulting in reduced thyroid hormone produc-tion, which is required for normal development of the cen-tral nervous system of fetuses and infants, normal skeletal
Figure 1. Borehole locations and groundwater chlorideconcentrations in the study area. Map reference numbersare shown for irrigated and natural setting boreholes(Table 1). Groundwater chloride data are from the TexasWater Development Board groundwater database (www.twdb.state.tx.us) and represent the latest samples (1996–2008) for 1100 wells completed in the Ogallala Formation.Black line represents the 500 mg/L groundwater total dis-solved solids (TDS) contour that defines the northern lowTDS (SHP‐N) and southern high TDS (SHP‐S) regions inTexas. Shaded areas in the SHP‐N region indicate the extentof Pullman clay loam soils. Irrigated boreholes 14 and 15and natural borehole 20 represent McMahon et al. [2006]irrigated boreholes MPL and JRW and natural boreholeMWR, respectively.
SCANLON ET AL.: EFFECTS OF IRRIGATION ON WATER QUALITY W09538W09538
3 of 14
development and growth, and metabolic activity of infantsand adults [Gullick et al., 2001]. Although ClO4 was orig-inally thought to be derived from NO3 fertilizers from Chile,studies in the SHP indicate that ClO4 is derived from bulkprecipitation [Rajagopalan et al., 2006; Rao et al., 2007].Previous studies show that ClO4 is mobilized by increasedrecharge under rain‐fed agriculture in the SHP [Scanlonet al., 2008c] and under irrigated agriculture in theAmargosa Desert, Nevada [Rao et al., 2007]. In addition,buildup of ClO4 in the soil zone and its uptake in crops canresult in large concentrations in feed for animals and in milk,providing another exposure pathway for humans [Jacksonet al., 2005].[11] The objective of this study was to assess long‐term
impacts of groundwater‐fed irrigation on the quality of soilwater and groundwater, to evaluate controls on theseimpacts, and to examine approaches toward sustainableirrigation with respect to water quality. This study focuses onsalts and nutrients, including Cl, ClO4, SO4, and NO3‐N inirrigated areas in the SHP (Figure 1). This paper is the secondof a two‐part series, the first part focusing on irrigationimpacts on the quantity of soil water and groundwater. Lackof monitoring information on the quantity (pumpage) andquality of irrigation water and large uncertainties in fertil-izer application rates make it difficult to assess impacts ofirrigation on soil water and groundwater quality on the basisof chemical loading to the system. Therefore, we evaluatethe outputs from irrigation processes using hydrostrati-graphic records of salts and nutrients preserved in thickunsaturated zones in a semiarid region and in time series ofgroundwater quality changes. We also evaluate these out-puts as they relate to estimates of inputs from chemicalloading and transport processes. Predominantly piston‐typeflow in the SHP provides an invaluable archive of pastimpacts of land use on subsurface flow and transport in theform of stratified chemical inventories, as shown in previousstudies related to natural ecosystems and rain‐fed agroeco-systems [Scanlon et al., 2003, 2007]. Measured concentra-tions of unsaturated zone solutes link surface applicationrates of irrigation water and fertilizers to soil water andgroundwater quality. The study area allows different poten-tial controls on water quality to be examined, includingvarying soil texture and irrigation water quality. Becauseimpacts of irrigation on water quality may be irreversible, itis important to consider different approaches toward sus-tainable irrigation practices with respect to water quality andto consider trade‐offs in terms of water quantity and waterquality.
2. Materials and Methods
2.1. Site Characteristics
[12] Physical characteristics of the SHP have been describedin the companion to this study [Scanlon et al., 2010]. Irri-gation water is abstracted primarily from the High Plains(Ogallala) aquifer. Previous studies have characterizedgroundwater quality in the SHP region according to varia-tions in TDS, with a 500 mg/L TDS contour line trendingfrom northwest to southeast that divides the aquifer into a lowTDS northern region (SHP‐N, median 390 mg/L) and a highTDS southern region (SHP‐S, median 890 mg/L) (Figure 1)[Scanlon et al., 2009b]. Differences in TDS are associatedwith variations in concentrations of other ions, including
median values of Cl (north median 21 mg/L, south median80 mg/L), ClO4 (north < 0.5 mg/L, south 3.2 mg/L) andSO4 (north 334 mg/L, south 220 mg/L). These variationsin groundwater quality also correspond to physical char-acteristics of the aquifer: the north generally corresponds toa paleovalley where the aquifer‐saturated thickness wasoriginally high (median predevelopment 45 m) and thewater table is currently deeper (median 63 m), whereas thesouth corresponds to a paleoupland where the saturatedthickness of the aquifer was much less (median 16 m) andthe water table is currently shallower (median 25 m). Theregional TDS boundary also generally corresponds to thenorthern subcrop limit of Cretaceous sediments [Scanlonet al., 2007]. The High Plains aquifer is directly underlainby the Triassic Dockum aquifer in the north, whereas the SHPand Dockum aquifers are separated by the Edwards TrinityHigh Plains and other Cretaceous aquifers in the south‐central region of the SHP. High‐TDS water in the south wasfound in the earliest groundwater sampling in the 1930s(Texas Water Development Board (TWDB), www.twdb.state.tx.us) and has been attributed to upward movement ofgroundwater from the underlying, more salineDockum aquifer[Nativ, 1988; Scanlon et al., 2009a].
2.2. Physical and Chemical Measurements
[13] Most of the methods used in this study are describedin the companion paper and in previous studies [Scanlonet al., 2007, 2010]. Irrigation water and borehole soil sam-ples were collected from 13 locations in the SHP. Soilsamples were leached using 40 mL of double deionized waterand 25 g of soil, placing soil samples in a reciprocal shakerfor 4 h, centrifuging at 7000 rpm for 20 min, and filtering theresultant supernatant (0.2 mm filter). Irrigation and superna-tant water sample concentrations of Cl, SO4, and NO3 weremeasured by ion chromatography (Dionex ICS2000; EPAMethod 300.0). Water samples for ClO4 analyses were fil-tered through 0.1 mm Supor (PES) membrane IC certifiedAcrodisc syringe filters. Analysis of ClO4 was conductedusing a sequential ion chromatography‐mass spectroscopy(IC‐MS/MS) technique, with a detection limit of 0.05 mg/Lin the supernatant and an analytical uncertainty of ∼20%[Rajagopalan et al., 2006]. Concentrations of ClO4 were alsomeasured in cotton leaves from three sites by grinding theleaves and extracting ClO4.[14] Water‐extractable ion concentrations are expressed
on a mass basis as mg ion per kg of dry soil and werecalculated by multiplying ion concentrations in the super-natant by the extraction ratio (g water/g soil). Ion con-centrations expressed as mg ion per L of soil pore waterwere calculated by dividing concentrations in mg/kg bygravimetric water content and multiplying by water density.Subsurface solute inventories (SI, kg/ha or g/ha) were cal-culated as follows:
SI ¼Xz
i¼0
Ss;i�b;i104dzi ð3Þ
where Ss is depth‐weighted solute mass concentration in soil(mg ion/kg dry sediment or mg/g), rb is soil dry‐bulk density(kg/m3), dz is interval thickness (m), z is depth of interest,and 104 (m2/ha) is for units conversion [McMahon et al.,2006]. Total inventory values (kg/ha) are normalized by
SCANLON ET AL.: EFFECTS OF IRRIGATION ON WATER QUALITY W09538W09538
4 of 14
profile depths (kg/ha/m) for comparison among boreholesand ecosystem settings. Values for inventories, depth‐weighted concentrations, and relationships between differention species represent those for sampled intervals below theroot zone (≥1 m depth), unless otherwise noted. The max-imum impact of flushing salts on groundwater quality (e.g.,Sgw, salt concentration in groundwater, mg/L) can be eval-uated by mixing the entire inventory of salt (SI) from theunsaturated zone with a specified saturated thickness ofaquifer (the mixing zone, zmix) with porosity n:
SIn
1
zmix¼ Sgw ð4Þ
For example, if a Cl inventory of 1000 kg/ha is transferredinto a 10 m thick aquifer mixing zone with a porosity of0.3 m3/m3, the increase in groundwater Cl concentrationwould be 33 mg/L. This approach provides an upper boundon the increase in groundwater salt concentration becauseonly the salt, and not the associated water, is moved into theaquifer (equation (4)). Temporal changes in regional ground-water quality were evaluated using solute hydrographs fromthe TWDB database (www.twdb.state.tx.us). Median con-centrations within selected regions of TDS, Cl, NO3‐N, andSO4 were calculated for sequential multiyear intervals thatspan the SHP irrigation period.
3. Results and Discussion
[15] Profiles under irrigated agroecosystems have higherNO3‐N inventories (median 140 kg/ha/m) than those undernatural ecosystems (median 9.4 kg/ha/m) and higher Clinventories (median 1400 kg/ha/m) than those under rain‐fed agroecosystems (16 kg/ha/m) (Figure 2 and Table 1)[Scanlon et al., 2008b]. Irrigation water quality is one of theprimary controls on variations in salt inventories beneathirrigated agroecosystems, as shown by the high correlation
(r = 0.94) between Cl inventories and Cl in irrigation water(auxiliary material Table S1).1
3.1. Impacts of Irrigation on Soil Water Qualityin Area of High‐Quality Irrigation Water
[16] The northernmost profiles (1 and 2) are located in thearea of higher quality irrigation water (Cl: 8.6 and 83 mg/L)(Figure 1 and Table 2). Increased percolation related toirrigation mobilized Cl bulges that accumulated under nat-ural ecosystems (Figures 3b, 3g, and 3l). These Cl bulgesare associated with low NO3‐N concentrations, and peak Clconcentrations were displaced from 1.6 m (estimated fromprofile 16, which is a nearby profile drilled under a naturalecosystem) to 5.6 m (profile 1) and 15.6 m (profile 2). Thesenatural Cl bulges required 9200–12,500 years to accumu-late. Inventories of Cl, ClO4, and SO4 in the deeper bulgesof profiles 1 and 2 are similar to those in profile 16,which represents the natural ecosystem (Figure 3 andTable 1). Pore water in the shallow parts of profiles 1 and 2(3.7 and 6.1 m zones) is attributed to irrigation return flow asshown by associated high NO3‐N concentrations (Figures 3iand 3n). Chloride inventories in this zone are low (310 and740 kg/ha/m; Table 1). Because ET is similar to desaliniza-tion with pure water evapotranspired, all the salts are con-centrated in the small amount of water draining below the rootzone. Chloride concentrations are used to estimate ET con-centration factors (CF) because Cl is highly conservativeand plant uptake is negligible. Maximum ET concentrationfactors, based on peak profile Cl concentration divided bymean Cl concentration in irrigation plus precipitation input,are similar in these two profiles (40 and 41) (CFCl, Table 3).The similarity in Cl concentration factors indicates thatdifferences between Cl inventories in the two profiles reflectthe order of magnitude difference in Cl input in irrigationwater (Table 2). Concentration factors can also be estimatedfrom the ratio of water input (I + P) to the averagepercolation rate and results in slightly lower values forthese two profiles (26 and 39, CFPe, Table 3). The rangein ET concentration factors suggests irrigation efficiencies(1–1/concentration factor) ranging from 96 to 98% withrespect to percolation. Tracer data provide information oncumulative impacts of irrigation on subsurface water move-ment. However, the Cl bulge associated with irrigation inprofile 2 suggests transient conditions that may reflectdecreasing irrigation water quality with the large water tabledecline (26–81 m) that occurred at this site and/or changingpercolation related to conversion from gravity fed irrigationwith a mean application rate of 540 mm/year to a sprinklersystem with a mean application rate of 280 mm/year[Scanlon et al., 2010].[17] Concentrations of ClO4 and Cl are highly correlated
in profiles 1 and 2 in the irrigation‐impacted zones and inthe deeper zones that reflect salt accumulation under naturalecosystems (auxiliary material Table S1). These data indi-cate that ClO4 is behaving conservatively, similar to Cl.Mean NO3‐N concentrations are high in the irrigation‐impacted zone (48 and 120 mg/L, Table 1) and low corre-lations with Cl may reflect additional NO3‐N inputs fromfertilizers and possible mineralization and nitrification ofsoil organic nitrogen in the system. Bulges of SO4 related to
Figure 2. Relationship between inventories of chloride andnitrate‐N normalized by profile depth for boreholes locatedin irrigated (triangles, 13 profiles), natural (squares, 4 pro-files), and rain‐fed (circles, 19 profiles) settings. Black sym-bols represent median values (Irrigated: Cl = 1400 kg/ha/m,NO3‐N = 140 kg/ha/m; Natural: Cl = 1600 kg/ha/m,NO3‐N = 9.4 kg/ha/m; Rain‐fed: Cl = 16 kg/ha/m, NO3‐N =53 kg/ha/m) (Table 1). Natural and rain‐fed data are fromprevious studies [Scanlon et al., 2008a, 2008b].
1Auxiliary materials are available in the HTML. doi:10.1029/2009WR003428.
SCANLON ET AL.: EFFECTS OF IRRIGATION ON WATER QUALITY W09538W09538
5 of 14
Tab
le1.
Profile
MeanandPeakCon
centratio
nsandInventoriesforCl,ClO
4,NO3‐N
,andSO4Below
theRoo
tZon
ea(≥1m
depth)
Settin
gRegion
Profile
Interval
(m)
MeanCon
centratio
nPeakCon
centratio
nPeakDepth
Inventory
Cl
(mg/L)
ClO
4
(mg/L)
NO3‐N
(mg/L)
SO4
(mg/L)
Cl
(mg/L)
ClO
4
(mg/L)
NO3‐N
(mg/L)
SO4
(mg/L)
Cl
(m)
ClO
4
(m)
NO3‐N
(m)
SO4
(m)
Cl
(kg/ha/m
)ClO
4
(g/ha/m)
NO3‐N
(kg/ha/m
)SO4
(kg/ha/m
)
Irriga
ted
SHP‐N
1(Pot07
‐03)
1.0‐3.7
110
1148
1600
170
1780
2500
2.8
2.8
1.6
3.7
310
3013
042
002(H
al08
–01)
1.0–
6.1
290
2112
058
015
0012
044
014
001.1
1.2
1.2
1.1
740
5234
013
00SHP‐S
3(Ter05
–03)
1.0–
6.5
380
2512
010
0016
0012
022
057
001.6
1.6
1.3
1.3
910
6527
029
004(Ter08
–03)
1.0–
4.3
720
2881
1200
1800
7521
035
002.7
3.0
2.7
1.8
2100
8223
029
005(D
aw08
–01)
1.0–
6.1
970
3255
1500
2100
7093
3700
4.3
4.3
4.9
1.5
2400
8113
032
006(Lub
08–01)
1.0–
14.6
540
1371
370
1500
2425
018
001.8
1.1
1.5
1.3
1300
3016
084
07(M
ar08
–01)
1.0–4.9
1500
298
1600
2500
4514
6700
2.7
2.7
3.0
1.2
3500
6720
3200
8(M
ar08
–02)
1.0–7.4
1700
3042
1900
6400
130
180
12,000
1.4
1.4
1.8
1.2
3800
6686
4100
9(Ter05
–04)
1.0–
9.5
720
1852
1100
2400
5012
041
002.8
2.8
2.8
1.6
1600
3911
024
0010
(Mar08
–03)
1.0–4.3
1900
4915
021
0029
0078
240
5800
1.2
1.2
2.4
1.2
4400
110
400
4100
11(G
ai08–0
1)1.0–
7.9
650
5467
1900
1200
9414
086
003.7
3.7
3.7
1.2
1300
110
140
3700
12(Ter08
–01)
1.0–
12.2
940
3776
1600
1600
6315
036
008.5
8.5
7.3
4.0
1200
4998
2700
13(Ter08
–02)
1.0–
6.5
670
3377
680
1700
8317
026
005.5
5.5
5.5
4.9
1400
7016
015
00Median(S)b
720
3071
1500
1800
7517
041
002.7
2.8
2.8
1.3
1600
6714
029
00SHP
Median(N
+S)c
720
2971
1500
1700
7517
037
002.7
2.8
2.7
1.3
1400
6614
029
00
Natural
SHP‐N
1(Pot07
–03)
3.7–18
.040
011
9.1
320
1100
2614
1600
5.6
5.6
4.6
4.6
740
2016
600
2(H
al08
–01)
6.1–
26.8
600
161.0
520
1100
277.3
2400
15.8
15.8
7.3
9.8
860
236.0
1500
16d(Pot07–0
4)1.0–14
.667
017
1213
0030
0041
1719
,000
1.6
1.3
4.6
1.3
1000
2820
2000
SHP‐S
17e(D
aw06–0
1)1.0–8.4
2500
637.2
5400
4800
110
3429
,000
7.7
8.3
2.2
7.7
3400
838.8
6400
18e(Lyn
06–0
1)1.0–
29.0
890
211.6
1700
2300
478.3
6900
4.3
5.5
4.3
8.0
2200
364.2
5600
19e(A
nd05
–02)
1.0–
8.5
480
348.9
970
1300
6225
2100
8.3
8.3
2.2
8.3
710
469.9
1300
Median(S)f
890
347.2
1700
2300
6225
6900
7.7
8.3
2.2
822
0046
8.8
5600
SHP
Median(N
+S)g
780
288.1
1500
2700
5521
13,000
6.0
6.9
3.3
7.9
1600
419.4
3800
a Region,region
allocatio
ndefinedby
grou
ndwater50
0mg/LTDScontou
r(Figure1);P
rofile,profilenu
mberandbo
reho
ledesign
ationin
parentheses(Figure1);Interval,bo
reho
ledepthinterval(profiles1and2have
shallow
zone
impacted
byirrigatio
nanddeeper
zonesreflectin
gnaturalcond
ition
s);Meanconcentration,
depth‐weigh
tedmeansoluteconcentrationbelow
theroot
zone
(≥1m
depth);Peakconcentration,
peak
solute
concentration;
Peakdepth,
depthof
peak
concentration;
Inventory,
totalsolute
massbelow
theroot
zone
(≥1m
depth)
norm
alized
bybo
reho
ledepthinterval.
bProfiles3–
13.
c Profiles1–13
.dScan
lonet
al.[200
8a].
e Scanlon
etal.[200
8b].
f Profiles17–1
9.gProfiles16
–19.
SCANLON ET AL.: EFFECTS OF IRRIGATION ON WATER QUALITY W09538W09538
6 of 14
the natural ecosystem in these profiles have not been dis-placed as deeply as Cl following increased irrigation perco-lation rates; therefore, mean concentrations and inventories inthe irrigation impacted zones include some SO4 related to thenatural bulges, particularly in profile 1 (Figures 3j and 3o).
3.2. Impacts of Irrigation on Soil Water Qualityin the Area of Poor Quality Irrigation Water
[18] Profiles in the SHP‐S region have been irrigated withmoderate to high salinity water (e.g., Cl: 99–790 mg/L) andNO3‐N (2.8–19 mg/L) (Table 2). Concentrations of ClO4
and SO4 in applied irrigation water at the sampled sitesgenerally follow patterns similar to those of the other ions(Table 2 and auxiliary material Figure S1) and are highlycorrelated with Cl (ClO4, r = 0.86; SO4, r = 0.96). Profilesunder irrigated agroecosystems in this region are charac-terized by large Cl bulges caused by evapotranspirativeenrichment in the root zone (Figure 4 and auxiliary materialFigures S2–S4). The range in Cl inventories in irrigationbulges (910–4400 kg/ha/m) is similar to that beneath naturalecosystems (710–3400 kg/ha/m) (Table 1). Total profileCl inventories under irrigated agroecosystems (5000–24,000 kg/ha, auxiliary material Table S2) accumulated over18–53 years; however, such bulges would require 3700–18,000 years (median 9400 years) to accumulate if Cl inbulk precipitation had been the only input, as in naturalecosystems (Table 3). These Cl inventories are highly cor-related with Cl input from irrigation (r = 0.94), excludingprofiles 7 and 8, which appear to be outliers. The Cl bulgesfrom irrigation have peak concentrations near the root zone(1.2–1.8 m depth) in 4 of the 11 profiles (Table 1, Figure 4q,auxiliary material Figures S2–S4). Although KCl fertilizerscan provide an additional source of Cl, as shown byMcMahon
et al. [2006], landowners in this area did not report useof such fertilizers. Chloride concentration factors estimatedfrom peak Cl concentrations relative to total (I + P) Cl inputrange from 12 to 42, excluding one outlier (110, profile 8)(Table 3). Similar concentration factors were calculatedusing percolation rates (7.6–38, Table 3). The total range inconcentration factors corresponds to irrigation efficienciesof 87–98% (median 95%).[19] Profiles under irrigated agroecosystems have large
ClO4 bulges, similar to Cl bulges. Peak ClO4 concentrationsare high (median 75 mg/L). Concentrations of ClO4 and Clare highly correlated within each profile (median r = 0.98)(auxiliary material Table S1), indicating that ClO4 behavesconservatively. Concentrations of ClO4 are generally highlycorrelated with NO3‐N (r = 0.72 − 0.93), with the exceptionof profiles 7, 11, and 12. Because NO3 is more readily takenup by plants and reduced by microorganisms, high NO3
concentrations in most profiles should inhibit ClO4 losses tothese processes.[20] Profiles under irrigated agroecosystems are charac-
terized by large NO3‐N inventories (median 140 kg/ha/m)(Figure 2 and Table 1). Sources of NO3‐N loading in irrigatedcropland include fertilizers (median 34 kg/ha/a), irrigationwater (median 30 kg/ha/a), and precipitation (∼3 kg/ha/a)(Table 3). The median concentration of NO3‐N in irriga-tion water is 10 mg/L (Table 2). Mineralization and nitri-fication of soil organic nitrogen can also contribute toNO3‐N in the soil profile, as estimated in a previous studyin this region (11–52 kg/ha), with higher values in finergrained soils [Chua et al., 2003]; however, it is difficult toquantify this input.[21] Average annual input of NO3‐N from irrigation water
represents 45% (median) of total NO3‐N input to the system,including precipitation, irrigation, and fertilizers. Inventoriesof NO3‐N below the root zone (1 m) represent a large per-centage of total profile NO3‐N (median 96%, Table 3). TheseNO3‐N inventories indicate large‐scale leaching below theroot zone (median 34%) of annual applied NO3‐N over theirrigation period (Table 3). Leaching rates are under-estimated for some profiles that did not extend deep enoughto sample the entire section impacted by irrigation returnflow. However, leaching rates would be overestimated ifsubsurface mineralization and nitrification of SON contrib-utes to the NO3‐N inventory. In contrast, McMahon et al.[2006] reported much lower leaching rates for profiles 14and 15 (12–14% of applied NO3‐N). Peak NO3‐N con-centrations below the root zone range from 14 to 250 mg/L(Table 1). Correlations between NO3‐N and Cl concentra-tions in different profiles are mostly high (median r = 0.88)(auxiliary material Table S1). High NO3‐N levels below theroot zone may be related partly to fertilizer applicationtiming such as 50% 3 weeks prior to and 50% 6 weeksafter planting reported in studies by Bronson et al. [2006].Recommendations for NO3‐N application rates from localagricultural experimental stations often do not account forNO3‐N input from irrigation water (median 30 kg/ha/ain this study), which is similar in magnitude to that fromfertilizers (median 34 kg/ha/a).[22] The SO4 distributions in unsaturated zone profiles
generally mimic those of Cl (Figure 4 and auxiliary materialFigures S2–S4). Variations in SO4 inventories are attributedto the range in SO4 concentrations in irrigation water(Table 2). Landowners indicated that they did not apply
Table 2. Measured Solute Concentrations and Pearson’sCorrelation (r) Between Chloride and Other Constituents inIrrigation Water Applied at the Profile Locationsa
aSHP‐N and SHP‐S, regions defined by groundwater 500 mg/L TDScontour (Figure 1). Profile, profile number (Figure 1).
bProfiles 3–13.cProfiles 1–13.
SCANLON ET AL.: EFFECTS OF IRRIGATION ON WATER QUALITY W09538W09538
7 of 14
SO4. Peak SO4 concentrations are high (median 4100 mg/L),and peak depths coincide with or lag behind Cl peak depthsby up to 2.7 m, with the exception of profile 12 (4.5 m lag).Although SO4 cycles can be much more complex than Clcycles, with additional sources from fertilizers and gypsumand sinks from plant uptake, the general similarity betweenSO4 and Cl profiles in irrigated sites indicates that SO4 isbehaving like Cl, with some sorption.
3.3. Potential Impact of Irrigation on Crop Production
[23] Increasing soil water salinity can negatively impactroot water uptake in crops by reducing osmotic potential[Ayers et al. 1943; Homaee et al., 2002]. Salinity tolerancevaries among crops according to physiological factors[Flowers, 2004]. The general lack of salinity problemscurrently in the SHP is attributed to high salt tolerance of thedominant crop (cotton, electrical conductivity [EC] toler-ance: 7.7 dS/m) [Ayers and Westcot, 1976; Ashraf, 2002].The relationship between EC and Cl in groundwater in theSHP suggests that an EC of 7.7 dS/m corresponds to a Clconcentration of 1300 mg/L. Values of Cl in root‐zone pore
water are generally < 1300 mg/L; however, peak Cl con-centrations are near the root in 4 of the 11 profiles in thesandier, southern part of the SHP. The salinity problem maybe exacerbated in the future if less salt‐tolerant crops aregrown, e.g., wheat, EC 6.0 dS/m; sorghum, EC 4.0 dS/m;groundnut, EC 3.2 dS/m; and corn, EC 1.7 dS/m [Ayers andWestcot, 1976]. Expansion of subsurface drip irrigation couldalso increase soil salinity problems if percolation rates arereduced, resulting in increased salt‐concentration factors.Maintenance of drip irrigation systems also increases saltloading because of acids introduced to keep the lines clear.[24] Increasing ClO4 concentrations in soil water can
result in higher ClO4 concentrations in crops, which canbioaccumulate in the food chain and increase the ClO4
exposure pathway to humans. Although cotton was the onlycrop grown in the sampled sites in the SHP and does notenter the food chain, measured ClO4 concentrations in cot-ton leaves (1.1, 2.6, and 0.8 mg/kg of dry plant near profiles2, 5, and 6) indicate that ClO4 is taken up by crops. Thecorresponding bioconcentration factors (ratios of plantweight concentration to measured concentration in irrigationwater (mg/kg)/ mg/L) are 500, 240, and 170 L/kg, respec-
Figure 3. Profiles of water content (WC, blue triangles), matric potential (gray circles), and chloride(Cl), perchlorate (ClO4), nitrate‐N (NO3‐N), and sulfate (SO4) concentrations for natural (16) and irri-gated (1, 2) setting boreholes located in Pullman clay loam soils in the SHP‐N region (Figure 1). Vol-umetric basis (mg/L or mg/L, blue triangles) and mass basis (mg/kg or mg/kg, gray circles) concentrationsare shown. Horizontal dashed lines shown in profiles 1 and 2 indicate the depth intervals impacted byirrigation.
SCANLON ET AL.: EFFECTS OF IRRIGATION ON WATER QUALITY W09538W09538
8 of 14
Tab
le3.
Estim
ated
SoluteLoading
Rates
forIrrigatedAgroecosystem
Profilesa
Region
Profile
P(m
m/a)
I(m
m/a)
t I (a)
Age
P
(a)
Irrigatio
n
Fertilizer
NO3‐N
(kg/ha/a)
Total
NO3‐N
b
(kg/ha/a)
NO3‐N
Inventory
Peak
Clc
(mg/L)
Ann
ual
Cl
(mg/L)
Ped
(mm/a)
t if (a)
CFCl
CFPe
Cl
(kg/ha/a)
ClO
4
(g/ha/a)
N(kg/ha/a)
SO4
(kg/ha/a)
≥1m
(kg/ha)
Profile
(%)
Ann
ual
(%)
SHP‐N
1(Pot07
–03)
485
440
1967
038
1.8
0.4
230
8791
370
6622
170
4.2
3652
040
262(H
al08
–01)
480
380
6829
0032
08.4
1820
093
110
1700
8822
1500
3722
1000
4139
SHP‐S
3(Ter05
–03)
480
300
4637
0030
019
3966
017
5915
0096
5516
0038
2528
042
314(Ter08
–03)
480
200
4748
0042
018
2272
067
9274
097
1718
0062
1823
029
385(D
aw08
–01)
485
320
1885
0011
0035
3096
013
017
067
089
2221
0014
057
110
1514
6(Lub
08–01)
475
380
5313
,000
530
1730
460
9012
022
0090
3415
0062
5519
024
167(M
ar08
–01)
440
350
2394
0070
015
1770
017
3777
529.0
2500
8939
140
2820
8(M
ar08
–02)
440
300
3318
,000
420
9.3
1339
017
3354
095
5064
0057
4815
011
015
9(Ter05
–04)
455
300
4512
,000
810
7.5
8.4
930
4556
960
9638
2400
110
4118
022
1810
(Mar08
–03)
450
200
5210
,000
1600
4630
1900
2760
1300
9741
2900
250
7368
128.9
11(G
ai08–01)
435
300
3076
0063
013
4872
034
8593
010
037
1200
8297
6815
7.6
12(Ter08–0
1)48
025
053
9500
830
4348
930
3484
1100
9724
1600
110
8633
158.5
13(Ter08–0
2)43
530
053
6200
450
3030
480
3567
890
9925
1700
6133
170
2822
Median(S)e
455
300
4694
0063
018
3072
034
6793
096
3418
0082
4815
023
f16
SHP
Median(N
+S)g
475
300
4685
0053
017
3070
035
8493
096
2517
0062
4117
026
f18
a Region,
region
allocatio
ndefinedby
grou
ndwater
500mg/LTDScontou
r(Figure1);Profile,p
rofilenu
mberandbo
reho
ledesign
ationin
parentheses(Figure1);P,m
eanannu
alprecipitatio
n(Prism
Clim
ateGroup
,www.prism
.orego
nstate.edu
),I,meanannu
alirrigatio
n(from
land
ownerandagricultu
ralresearch
stationrecords,auxiliary
material);t I,
numberof
yearsirrigated[Scanlon
etal.,20
10];Age
P,app
arentC
lmassbalance
ageassumingprecipitatio
nas
theon
lyClinpu
t,Irrigatio
n,meanannu
alsolutemassloadingratesfrom
irrigatio
nwater
basedon
measuredsoluteconcentrations
inirrigatio
nwater
(Table2)
andirrigatio
nam
ounts(I);
FertilizerNO3‐N
,meanannu
almassloadingratesfrom
fertilizersbasedon
land
ownerestim
ates;T
otalNO3‐N
,meantotalann
ualN
O3‐N
massloadingrate,including
precipitatio
n,fertilizer,andirrigatio
ninpu
ts;N
O3‐N
Inventory≥1m,inv
entorybelowtherootzone
(≥1mdepth);N
O3‐N
InventoryProfile%,N
O3‐N
inventorybelowtherootzone
asapercentage
oftheNO3‐N
inventoryintheentireprofile;N
O3‐N
InventoryAnn
.%,N
O3‐N
inventorybelowtheroot
zone
asapercentage
oftotalNO3‐N
appliedto
theprofile
over
theirrigatio
nperiod
;PeakCl,peak
Clconcentrationin
theirrigatedprofile
section;
Ann
.Cl,vo
lume‐weigh
tedmeanannu
alCl
concentrationcalculated
as[(PxC
l P+IxCl I)
/(P+I)];Pe,percolationrate;t if:tim
elagforirrigatio
nreturn
flow
toreachcurrentw
ater
tabledepthfollo
winginitialcultivatio
n[Scanlon
etal.,20
10,equ
ation(5)];CFCl,
concentrationfactor
basedon
profile
peak
Clcon
centratio
nrelativ
eto
annu
alClinp
utin
precipitatio
nandirrigatio
n[PeakCl/Ann
ualC
l];C
FPe,concentrationfactor
basedon
percolationraterelativ
eto
precipitatio
nand
irrigatio
n[(P+I)/P
e].
bInclud
es3.0kg
/ha/aNO3‐N
from
precipitatio
nbasedon
data
from
NADP(∼19
80–200
7).
c Includes∼0
.30mg/LClfrom
precipitatio
nbasedon
data
from
NADP(∼19
80–200
7).
dScan
lonet
al.[201
0],percolationratesbasedon
velocity
forprofiles1–
9andClmassbalanceforprofiles10
–13.
e Profiles3–
13.
f Excludesprofile
8.gProfiles1–
13.
SCANLON ET AL.: EFFECTS OF IRRIGATION ON WATER QUALITY W09538W09538
9 of 14
tively. These values are similar to those found in a previousstudy for wheat stems and heads (215–230 L/kg) and alfalfa(380 L/kg) [Jackson et al., 2005]. Although high correla-tions between ClO4 and Cl indicate that ClO4 is behavingconservatively, these levels of ClO4 uptake in plants, whileimportant for exposure pathways, should have a negligibleimpact on subsurface ClO4 distribution [Tan et al., 2004].[25] One of the primary issues for crop production is
maintaining low salt concentrations in the root zone.Approximately 77% of mean annual precipitation occursduring the growing season in the SHP (May through
October), when ET rates are highest and potential forflushing of accumulated salts is much lower. However,extreme events can flush salts from the root zone, asoccurred following September–November 2004 precipita-tion (380 mm, 320% of 1971–2000 average; Prism ClimateGroup, www.prism.oregonstate.edu), when peak Cl andNO3 concentrations were displaced from depths of 1–2 m inprofile 15 [Gurdak et al., 2007]. Some of the measuredprofiles show low Cl concentrations, with a chloride massbalance (CMB) age of ∼4 years generally coincident withthe 2004 event, e.g., profile 5 (350 mg/L, 3.1 m depth,
Figure 4. Profiles of water content (WC, blue triangles), matric potential (gray circles), and chloride(Cl), perchlorate (ClO4), nitrate‐N (NO3‐N), and sulfate (SO4) concentrations for natural (18) and irri-gated (4, 5, and 6) setting boreholes located in the SHP‐S region (Figure 1). Volumetric basis (mg/Lor mg/L, blue triangles) and mass basis (mg/kg or mg/kg, gray circles) concentrations are shown. Hori-zontal dashed lines shown in profiles 4 and 5 indicate the depth intervals impacted by different land uses.
SCANLON ET AL.: EFFECTS OF IRRIGATION ON WATER QUALITY W09538W09538
10 of 14
3.9 years) and profile 12 (140 mg/L, 3.0 m depth, 2.9 years)(Figure 4l and auxiliary material Figure S4). The increasedfrequency of such intense precipitation events, as predictedwith climate change [Intergovernmental Panel on ClimateChange, 2007], could further alleviate salinization in theroot zone in the future but not necessarily salinization indeeper soil zones or in groundwater.
3.4. Impact of Irrigation on Groundwater Quality
[26] The large inventories of Cl, ClO4, NO3, and SO4
currently accumulating under irrigated agroecosystems couldfurther degrade groundwater if mobilized into the underly-ing aquifer. Groundwater in the SHP‐N region is not con-sidered vulnerable because groundwater quality is high andbecause of the long time (520–1000 years) for irrigationreturn flow to reach current water table depths (76–79 m)in this region, given the percolation rates (Table 3) [Scanlonet al., 2010]. With continually declining water tables, it isunclear whether irrigation return flow will reach the watertable until irrigation significantly decreases. The lack ofrecharge away from playas is supported by the absence oflarge‐scale change in median groundwater quality in theSHP‐N region (Figures 5b and 5d and auxiliary materialTable S3).[27] In the SHP‐S region, groundwater solute hydro-
graphs show large increases in salt concentrations, begin-ning in the 1960s and increasing through the 1980s and1990s (Figures 5a and 5c and auxiliary material Table S3).Some areas show continued increases in salt concentrationsthrough the 2000s, whereas others show a leveling off afterthe 1990s. Median concentrations calculated for county re-gions increased by ≤960 mg/L in TDS, ≤240 mg/L in Cl,
≤230 mg/L in SO4, and ≤9.4 mg/L in NO3‐N (auxiliarymaterial Table S3).[28] Although degradation of groundwater quality is
evident, the process responsible for mobilizing salts andnutrients into the aquifer is not. The most rapid pathway fromland surface to the aquifer is through playas; however,unsaturated pore water beneath playas generally contains lowsalt concentrations [Wood and Sanford, 1995; Scanlon andGoldsmith, 1997]. Enwright and Hudak [2009] showed thatgroundwater NO3‐N concentrations are lower near playas.Fryar et al. [2000] also showed that denitrification occursbeneath playas in the SHP. Gurdak et al. [2008] suggestedseasonal ponding near leaky irrigation wells as a mechanismfor depression‐focused preferential flow and enhanced solutemigration through the unsaturated zone of the High Plainsaquifer. Although this process could contribute chemicals tothe underlying aquifer, whether the mass transported by thisprocess would be sufficient to explain the regional distribu-tion of salts and nutrients in the aquifer is unclear.[29] Inventories of Cl and SO4 are high enough under
natural ecosystems to account for the measured increases inthese ions in groundwater since the 1960s. The salts origi-nally in groundwater measured in the 1930s were attributedto upward movement of salts from the underlying Dockumaquifer. A previous study of rain‐fed agroecosystems in theSHP‐S region indicates that mobilizing the salt accumulationin profile 18 (natural ecosystem) would increase mediangroundwater concentrations of Cl by an additional 150 mg/L,SO4 by 480 mg/L, and TDS by 900 mg/L, peaking approxi-mately 100 years after initial cultivation [Scanlon et al.,2009b]. Transport of these salts that accumulated under nat-ural ecosystems by increased percolation under rain‐fedagroecosystems should continue under irrigated agroeco-
Figure 5. Temporal changes in groundwater: (a) total dissolved solids (TDS) in the SHP‐S region,(b) TDS in the SHP‐N region, (c) NO3‐N in the SHP‐S region, and (d) NO3‐N in the SHP‐N region.Points represent median values of TDS or NO3‐N for median sample dates by county areas duringthe periods ≤1960, 1961–1975, 1976–1990, and 1991–2008 demarked by vertical gray lines. Areasof Lubbock County lie in each region.
SCANLON ET AL.: EFFECTS OF IRRIGATION ON WATER QUALITY W09538W09538
11 of 14
systems because of the similarity in percolation rates beneathrain‐fed and irrigated agroecosystems. The time lag betweenmobilization at the root zone and peak concentration ingroundwater under rain‐fed agroecosystems (∼100 years)and similarity with irrigated agroecosystems suggests thatthese natural salts may account for the measured increases insalt concentrations in groundwater since the 1960s. Thebehavior of ClO4 is similar to that of Cl, and mobilizationand mixing of the inventory for profile 18 using equation (4)results in an increase in groundwater ClO4 concentrationof 14 mg/L [Scanlon et al., 2008c]. Although NO3‐Nconcentrations are low under natural ecosystems (median7.2 mg/L) relative to irrigated agroecosystems (median71 mg/L, Table 1), concentrations under natural ecosys-tems are much higher than background levels in the aquifer(∼ 0.5 mg/L NO3‐N); therefore, flushing of this pore watercould account for some of the early NO3‐N increase ingroundwater. In addition, flushing of NO3‐N reservoirscreated by mineralization and nitrification of SON related toinitial cultivation under rain‐fed agroecosystems and asso-ciated with the shallower portion of the natural salt bulgecould increase groundwater NO3‐N concentrations by up to22 mg/L [Scanlon et al., 2008b]. Most profiles under irri-gated agroecosystems in this study indicate the unlikelihoodthat irrigation return flow has reached the aquifer becauseof long lag times (33–280 years, median 150 years,Table 3) for salts to transport from the root zone to thecurrent water table depths. These time lags may be con-sidered upper bounds because they are based on an initialwater content of 0.13 m3/m3 measured in the natural profile(18) and do not take into account any increases in watercontent that might have occurred under rain‐fed manage-ment. Groundwater quality is projected to decline muchmore in the future as the large measured salt and nutrientinventories under irrigated agroecosystems are mobilizedinto the aquifer, which is consistent with the findings ofMcMahon et al. [2006]. The timing of such increasesin groundwater salinity is uncertain because soil watercontents below these profiles have not been measured.Percolation/recharge rates estimated in this study are timeintegrated estimates; however, salt bulges in irrigationprofiles suggest that either these rates may have decreasedwith improved irrigation technologies and/or salt bulgesmay reflect increases in salinity of irrigation water withdeclining water tables.[30] The irrigated profile locations are considered rep-
resentative of the regional system because the medianaquifer saturated thickness (16 m) and TDS concentration(980 mg/L) of irrigation water applied at the profile locationsare similar to regional values (16 m, 890 mg/L). If saturatedthickness does not change from current values, mobilizing themeasured irrigation profile salt inventories would increasegroundwater concentrations of Cl by an additional 280 mg/L,ClO4 by 8.5 mg/L, NO3‐N by 13 mg/L, and SO4 by 360 mg/L(auxiliary material Table S4). If irrigation continues untilaquifer saturated thickness is reduced to an estimated mini-mum value that can support irrigation (∼6 m), mobilizingmeasured irrigation profile salt inventories would increasegroundwater concentrations of Cl by 720 mg/L, ClO4 by21 mg/L, NO3‐N by 52 mg/L and SO4 by 880 mg/L. Usingthe regional relationship between TDS and the sum of Cland SO4 in groundwater, the median TDS under themeasured profiles would increase by 2200 mg/L.
3.5. Sustainable Irrigation Management With Respectto Water Quality
[31] A variety of approaches can be adopted to move fromcurrent unintended consequences on water quality to moresustainable practices. Basic information, such as irrigationapplication rates, irrigation water quality, and fertilizerapplication rates and any other salts applied to the system,needs to be monitored. From a water‐quality perspective, itwould be advisable to irrigate with more water to reduce saltbuildup in the soil profile; however, this approach runscounter to the current water conservative irrigation practicesthat favor highly efficient irrigation technologies. Results ofthis study indicate that current irrigation practices are almosttoo efficient from a water‐quality perspective, suggestingthat investments in more efficient irrigation systems, such assubsurface drip systems, may be inappropriate. Additionalirrigation applications during crop growth may not be aseffective as applying irrigation during the nongrowing sea-son to flush salts below the root zone. Intense precipitationevents, such as those recorded in 2004, may also serve thispurpose. Rotating between irrigated and rain‐fed agricultureshould improve water quality because salt loading to thesystem would be greatly reduced. However, the large eco-nomic investment associated with irrigation systems gener-ally requires continuous use of such systems to ensure areturn on their investment.[32] Information on water quality, such as that provided
by unsaturated zone profiles in this study, would be valuableto irrigators in developing best management practicesrelated to irrigation. Monitoring salt loads to the system andquantifying existing unsaturated zone salt inventories todepths of 10–20 m would increase awareness of producersand agronomists to potential salinity problems. In addition,data on aquifer thickness and projected declines with furtherirrigation are essential for quantifying the assimilativecapacity of the aquifer and potential impacts of salt mobi-lization into the aquifer.[33] Nutrient management is much more complicated than
salt management because NO3 is continually added to thesystem and there are a variety of sources and sinks of NO3.Groundwater NO3 should be considered a fertilizer resourceand included in estimates of fertilizer application rates. Inthis study, NO3‐N loads from irrigation water constituted15–66% (median 45%) of total NO3‐N applications in theSHP‐S region (Table 3). In addition, estimates of miner-alization and nitrification of SON should be includedwhen determining appropriate fertilizer application rates,according to studies such as those conducted by Bronsonet al. [2006]. Timing of fertilizer applications is critical forminimizing potential leakage. Split fertilizer applicationsdesigned to coincide with crop nutrient requirements shouldreduce NO3 leaching in the system. Traditional soil testing forfertilizers is restricted to the upper 0.15‐ to 0.3‐m zone;therefore, many agronomists and producers are unaware ofthe large levels of NO3 leaching that is occurring below theroot zone. Rotating crops with varying rooting depths andgrowing winter cover crops could also reduce NO3 leachingin profiles.
4. Conclusions
[34] Stratified chemical inventories in thick unsaturatedzones record impacts of past land‐use changes on water and
SCANLON ET AL.: EFFECTS OF IRRIGATION ON WATER QUALITY W09538W09538
12 of 14
salt balances as a result of predominantly piston‐type flow.Quality of irrigation water is one of the dominant controlson variations in salt inventories under irrigated agroeco-systems. Salt inventories in the unsaturated zone are low inthe SHP‐N region, where groundwater salinity is low(median Cl: 21 mg/L), the aquifer is thick (median prede-velopment saturated thickness 45 m), and the water table iscurrently deep (median 63 m). In contrast, salt inventories inthe unsaturated zone are much higher in the south, wheregroundwater salinity is high (median Cl 180 mg/L), theaquifer is thin (median 16 m), and the water table iscurrently shallow (median 25 m). Inventories of Cl underirrigated agroecosystems are highly correlated with Cl inirrigation water in this region.[35] Large salt bulges in the SHP‐S region with median
inventories of Cl (1600 kg/ha/m), ClO4 (67 g/ha/m), NO3‐N(140 kg/ha/m), and SO4 (2900 kg/ha/m) beneath irrigatedagroecosystems are attributed to evapoconcentration ofinput water (irrigation and precipitation) by factors of 12 to42 for Cl and minimal flushing by percolation rates of 18 to97 mm/a (median 48 mm/a). Crop ET is similar to desali-nization, removing pure water and concentrating all salts inthe limited percolation water below the root zone. Chlorideinventories in salt bulges under irrigated cropland are sim-ilar in range to those beneath natural ecosystems. Totalprofile Cl inventories under irrigated agroecosystems (5000–24,000 kg/ha) accumulated over 18–53 years but wouldrequire 3700–18,000 years to accumulate under naturalecosystems where precipitation is the only Cl input. Cl andClO4 are highly correlated in individual profiles (median r =0.98), indicating essentially conservative behavior of ClO4.High correlations between ClO4 and NO3‐N in most profiles(r = 0.72 − 0.93) indicate that ClO4 may be shielded frommicrobial processes by NO3‐N in the system. Large NO3‐Ninventories below the root zone (median 930 kg/ha) in irri-gated agroecosystems represent 96% (median) of total pro-file NO3‐N, indicating leaching of much of the NO3‐N.NO3‐N input from irrigation water (median 30 kg/ha/a) issimilar to that from fertilizers (median 34 kg/ha/a) andshould be considered in proposed NO3‐N application rates.[36] Groundwater solute hydrographs show increases
since the 1960s in median concentrations for county areasby ≤960 mg/L for TDS, ≤240 mg/L for Cl, ≤230 mg/L forSO4, and 9.4 mg/L for NO3‐N. The most likely process formobilizing these salts and nutrients is percolation/rechargebeneath rain‐fed and irrigated agroecosystems. These in-creases in salts and nutrients are attributed to flushing ofsalts and some nutrients that had accumulated under naturalecosystems and additional nutrients related to mineralizationand nitrification of SON during initial cultivation. Mostprofiles under irrigated agroecosystems in this study indicatethat it is unlikely that irrigation return flow has reached theaquifer. Transporting measured unsaturated zone inventoriesthat accumulated under irrigated agroecosystems into anestimated minimum saturated aquifer thickness that couldsupport irrigation (6 m) would increase TDS by an additional2200 mg/L (median), Cl by 720 mg/L, ClO4 by 21 mg/L,SO4 by 880 mg/L, and NO3‐N by 52 mg/L. Concentrationsof NO3‐N under all but one irrigated profile site wouldexceed the MCL of 10 mg/L. Because the SHP aquifer isessentially a closed basin, with the primary dischargemechanism being irrigation pumpage, salts external fromgroundwater, such as those that accumulated beneath natural
ecosystems, provide a transient pulse into the aquifer. Nitrateis continuously added to the system, and NO3‐N con-centrations in groundwater should continuously increase.Salts derived solely from groundwater and recycled throughthe system by irrigation water would increase groundwaterconcentrations linearly in proportion to the reduction insaturated thickness and assimilative capacity of the aquifer.Groundwater quality is projected to degrade much more inthe future as the measured salt and nutrient inventories underirrigated agroecosystems are mobilized into the aquifer.Irrigation management should consider both water and saltbalances for sustainable irrigation practices.
[37] Acknowledgments. Financial support for this study was pro-vided by the Bureau of Reclamation and the Jackson School of Geosciences.We are very grateful to the managers of the Groundwater Conserva-tion Districts for obtaining access to drilling sites (Jason Coleman, TerryCounty; Kent Carver, Martin County; Mike McGregor and Lori Barnes,Gaines County; Harvey Everheardt, Dawson County), and to LouisBaumhardt (USDA, Agricultural Research Station, Bushland).
ReferencesAshraf, M. (2002), Salt tolerance of cotton: Some new advances, Crit. Rev.
Plant Sci., 21(1), 1–30, doi:10.1016/S0735-2689(02)80036-3.Ayers, A. D., C. H. Wadleigh, and O. C. Magistad (1943), The interrela-
tionships of salt concentration and soil moisture content with the growthof beans, J. Am. Soc. Agron., 35, 796–810.
Ayers, R. S., and D. W. Westcot (1976), Water quality for agriculture,Irrig. Drain. Pap., 29, Food and Agric. Organ. of the U. N., Rome.
Beltrán, J. M. (1999), Irrigation with saline water: Benefits and environ-mental impact, Agric. Water Manage., 40(2–3), 183–194, doi:10.1016/S0378-3774(98)00120-6.
Blandford, N. T., D. J. Blazer, K. C. Calhoun, A. R. Dutton, T. Naing,R. C. Reedy, and B. R. Scanlon (2003), Groundwater availability of theSouthern Ogallala Aquifer in Texas and New Mexico: Numerical simu-lations through 2050, report, Tex. Water Dev. Board, Austin.
Bronson, K. F., J. D. Booker, J. P. Bordovsky, J. W. Keeling, T. A.Wheeler, R. K. Boman, M. N. Parajulee, E. Segarra, and R. L. Nichols(2006), Site‐specific irrigation and nitrogen management for cotton pro-duction in the southern High Plains, Agron. J., 98(1), 212–219,doi:10.2134/agronj2005.0149.
Chua, T. T., K. F. Bronson, J. D. Booker, J. W. Keeling, A. R. Mosier,J. P. Bordovsky, R. J. Lascano, C. J. Green, and E. Segarra (2003),In‐season nitrogen status sensing in irrigated cotton: I. Yields andnitrogen‐15 recovery, Soil Sci. Soc. Am. J., 67, 1428–1438.
Enwright, N., and P. F. Hudak (2009), Spatial distribution of nitrate andrelated factors in the High Plains Aquifer, Texas, Environ. Geol., 58,1541–1548, doi:10.1007/s00254-008-1655-8.
Flowers, T. J. (2004), Improving crop salt tolerance, J. Exp. Bot., 55(396),307–319, doi:10.1093/jxb/erh003.
Fryar, A. E., S. A.Macko,W. F.Mullican, K. D. Romanak, and P. C. Bennett(2000), Nitrate reduction during ground‐water recharge, southern HighPlains, Texas, J. Contam. Hydrol., 40(4), 335–363, doi:10.1016/S0169-7722(99)00059-5.
Ghassemi, F., A. J. Jakeman, and H. A. Nix (1995), Salinisation of Landand Water Resources: Human Causes, Extent, Management and CaseStudies, 520 pp., CAB Int., Washingford, U. K.
Gullick, R. Q., M. W. Lechvallier, and T. A. S. Barhorst (2001), Occurrenceof perchlorate in drinking water sources, J. Am. Water Works Assoc.,93(1), 66–77.
Gurdak, J. J., R. T. Hanson, P. B. McMahon, B. W. Bruce, J. E. McCray,G. D. Thyne, and R. C. Reedy (2007), Climate variability controls onunsaturated water and chemical movement, High Plains Aquifer, USA,Vadose Zone J., 6(3), 533–547, doi:10.2136/vzj2006.0087.
Gurdak, J. J., M. A. Walvoord, and P. B. McMahon (2008), Susceptibilityto enhanced chemical migration from depression‐focused preferentialflow, High Plains Aquifer, Vadose Zone J., 7(4), 1218–1230.
Homaee, M., R. A. Feddes, and C. Dirksen (2002), A macroscopic waterextraction model for nonuniform transient salinity and water stress, SoilSci. Soc. Am. J., 66, 1764–1772.
SCANLON ET AL.: EFFECTS OF IRRIGATION ON WATER QUALITY W09538W09538
13 of 14
Huffaker, R., and N. Whittlesey (2003), A theoretical analysis of economicincentive policies encouraging agricultural water conservation, Int. J.Water Resour. Dev., 19(1), 37–53, doi:10.1080/713672724.
Intergovernmental Panel on Climate Change (2007), Summary for policy-makers, in Climate Change 2007: The Physical Science Basis: Contri-bution of Working Group I to the Fourth Assessment Report of theIntergovernmental Panel on Climate Change, edited by S. Solomonet al., 18 pp., Cambridge Univ. Press, New York.
Jackson, W. A., P. Joseph, P. Laxman, K. Tan, P. N. Smith, L. Yu, andT. A. Anderson (2005), Perchlorate accumulation in forage and ediblevegetation, J. Agric. Food Chem., 53(2), 369–373, doi:10.1021/jf0493021.
Kalavrouziotis, I. K., V. N. Pantazis, V. A. Vissikirsky, and V. S. Stepashko(2006), Irrigation of forest species with wastewater and sludge: Experi-ments, modeling, and qualitative assessment, Instrum. Sci. Technol.,34(6), 727–742, doi:10.1080/10739140600964168.
McMahon, P. B., K. F. Dennehy, B. W. Bruce, J. K. Bohlke, R. L. Michel,J. J. Gurdak, and D. B. Hurlbut (2006), Storage and transit time of che-micals in thick unsaturated zones under rangeland and irrigated cropland,High Plains, United States, Water Resour. Res., 42, W03413,doi:10.1029/2005WR004417.
McMahon, P. B., K. F. Dennehy, B. W. Bruce, J. J. Gurdak, and S. L. Qi(2007), Water‐quality assessment of the High Plains Aquifer, 1999–2004,U.S. Geol. Surv. Prof. Pap., 1749, 124 p.
National Research Council (2005), Health Implications of PerchlorateIngestion, 260 pp., Washington, D. C.
Nativ, R. (1988), Hydrogeology and hydrochemistry of the Ogallala Aquifer,southern High Plains, Texas panhandle and eastern New Mexico, Rep.Inv., 177, Bur. Econ. Geol., Univ. of Texas, 64 pp.
Oren, O., Y. Yechieli, J. K. Bohlke, and A. Dody (2004), Contamination ofgroundwater under cultivated fields in an arid environment, central AravaValley, Israel, J. Hydrol. Amsterdam, 290(3–4), 312–328, doi:10.1016/j.jhydrol.2003.12.016.
Oster, J. D., and D. Wichelns (2003), Economic and agronomic strategiesto achieve sustainable irrigation, Irrig. Sci., 22(3–4), 107–120,doi:10.1007/s00271-003-0076-4.
Rajagopalan, S., T. A. Anderson, L. Fahlquist, K. A. Rainwater, M. Ridley,and W. A. Jackson (2006), Widespread presence of naturally occurringperchlorate in High Plains of Texas and New Mexico, Environ. Sci.Technol., 40(10), 3156–3162, doi:10.1021/es052155i.
Rao, B., T. A. Anderson, G. J. Orris, K. A. Rainwater, S. Rajagopalan,R. M. Sandvig, B. R. Scanlon, D. A. Stonestrom, M. A. Walvoord, andW. A. Jackson (2007), Widespread natural perchlorate in unsaturatedzones of the southwest United States, Environ. Sci. Technol., 41(13),4522–4528, doi:10.1021/es062853i.
Reedy, R. C., B. R. Scanlon, J. P. Nicot, and J. A. Tachovsky (2007),Unsaturated zone arsenic distribution and implications for groundwatercontamination, Environ. Sci . Technol. , 41(20), 6914–6919,doi:10.1021/es070281b.
Richards, L. A. (1954), Diagnosis and Improvement of Saline and AlkaliSoils, 160 pp., U.S. Dep. of Agric., Washington, D. C.
Rose, C. W., P. W. A. Dayananda, D. R. Nielsen, and J. M. Biggar (1979),Long‐term solute dynamics and hydrology in irrigated slowly permeablesoils, Irrig. Sci., 1(2), 77–87.
Scanlon, B. R., and R. S. Goldsmith (1997), Field study of spatial variabil-ity in unsaturated flow beneath and adjacent to playas, Water Resour.Res., 33, 2239–2252, doi:10.1029/97WR01332.
Scanlon, B. R., K. Keese, R. C. Reedy, J. Simunek, and B. J. Andraski(2003), Variations in flow and transport in thick desert vadose zonesin response to paleoclimatic forcing (0–90 kyr): Field measurements,modeling, and uncertainties, Water Resour. Res., 39(7), 1179,doi:10.1029/2002WR001604.
Scanlon, B. R., R. C. Reedy, D. A. Stonestrom, D. E. Prudic, andK. F. Dennehy (2005), Impact of land use and land cover change on ground-water recharge and quality in the southwestern USA, Global Change Biol.,11(10), 1577–1593, doi:10.1111/j.1365-2486.2005.01026.x.
Scanlon, B. R., R. C. Reedy, and J. A. Tachovsky (2007), Semiarid unsat-urated zone chloride profiles: Archives of past land use change impactson water resources in the southern High Plains, United States, WaterResour. Res., 43, W06423, doi:10.1029/2006WR005769.
Scanlon, B. R., R. C. Reedy, R. L. Baumhardt, and G. Strassberg (2008a),Impact of deep plowing on groundwater recharge in a semiarid region:Case study, High Plains, Texas, Water Resour. Res., 44, W00A10,doi:10.1029/2008WR006991, [printed 45(7), 2009].
Scanlon, B. R., R. C. Reedy, and K. F. Bronson (2008b), Impacts of landuse change on nitrogen cycling archived in semiarid unsaturated zonenitrate profiles, southern High Plains, Texas, Environ. Sci. Technol.,42(20), 7566–7572, doi:10.1021/es800792w.
Scanlon, B. R., R. C. Reedy, W. A. Jackson, and B. Rao (2008c), Mobili-zation of naturally occurring perchlorate related to land‐use change in thesouthern High Plains, Texas, Environ. Sci. Technol., 42(23), 8648–8653,doi:10.1021/es800361h.
Scanlon, B. R., J. P. Nicot, R. C. Reedy, D. Kurtzman, A. Mukherjee, andG. Strassberg (2009a), Naturally occurring arsenic contamination in asemiarid oxidizing system, southern High Plains Aquifer, USA, Appl.Geochem., 24(11), 2061–2071, doi:10.1016/j.apgeochem.2009.08.004.
Scanlon, B. R., D. A. Stonestrom, R. C. Reedy, F. W. Leaney, J. Gates, andR. G. Cresswell (2009b), Inventories and mobilization of unsaturatedzone sulfate, fluoride, and chloride related to land use change in semiaridregions, southwestern United States and Australia, Water Resour. Res.,45, W00A18, doi:10.1029/2008WR006963.
Scanlon, B. R., R. C. Reedy, and J. B. Gates (2010), Effects of irrigatedagroecosystems: 1. Soil water and groundwater quantity in the southernHigh Plains, Texas, Water Resour. Res., 46, W09537, doi:10.1029/2009WR008427.
Scheierling, S. M., R. A. Young, and G. E. Cardon (2006), Public subsidiesfor water‐conserving irrigation investments: Hydrologic, agronomic, andeconomic assessment, Water Resour. Res., 42, W03428, doi:10.1029/2004WR003809.
Schoups, G., J. W. Hopmans, C. A. Young, J. A. Vrugt, W. W. Wallender,K. K. Tanji, and S. Panday (2005), Sustainability of irrigated agriculturein the San Joaquin Valley, California, Proc. Natl. Acad. Sci. U. S. A.,102(43), 15,352–15,356, doi:10.1073/pnas.0507723102.
Smith, R. J., and N. H. Hancock (1986), Leaching requirement of irrigatedsoils, Agric. Water Manage., 11, 13–22, doi:10.1016/0378-3774(86)90032-6.
Sophocleous, M. A. (2000), From safe yield to sustainable developmentof water resources—The Kansas experience, J. Hydrol. Amsterdam,235(1–2), 27–43, doi:10.1016/S0022-1694(00)00263-8.
Stonestrom, D., D. E. Prudic, R. J. Laczniak, K. C. Akstin, R. A. Boyd, andK. K. Henkelman (2003), Estimates of deep percolation beneath nativevegetation, irrigated fields, and the Amargosa‐River channel, AmargosaDesert, Nye County, Nevada, U.S. Geol. Surv. Open File Rep. 03–104.
Tan, K., T. A. Anderson, M. W. Jones, P. N. Smith, and W. A. Jackson(2004), Accumulation of perchlorate in aquatic and terrestrial plants ata field scale, J. Environ. Qual., 33(5), 1638–1646, doi:10.2134/jeq2004.1638.
Ward, F. A., and M. Pulido‐Velazquez (2008), Water conservation in irri-gation can increase water use, Proc. Natl. Acad. Sci. U. S. A., 105(47),18,215–18,220, doi:10.1073/pnas.0805554105.
Wood, W. W., and W. E. Sanford (1995), Chemical and isotopic methodsfor quantifying ground‐water recharge in a regional, semiarid environ-ment, Ground Water, 33, 458–468, doi:10.1111/j.1745-6584.1995.tb00302.x.
J. P. Bordovsky, Texas Agricultural Experiment Station, Texas A&MUniversity, College Station, TX 77843, USA.J. B. Gates, Department of Geosciences, University of Nebraska‐Lincoln,
Lincoln, NE 68502, USA.W. A. Jackson, Department of Civil and Environmental Engineering,
Texas Tech University, Lubbock, TX 79409, USA.R. C. Reedy and B. R. Scanlon, Bureau of Economic Geology, Jackson
School of Geosciences, University of Texas at Austin, Austin, TX 78712,USA.
SCANLON ET AL.: EFFECTS OF IRRIGATION ON WATER QUALITY W09538W09538


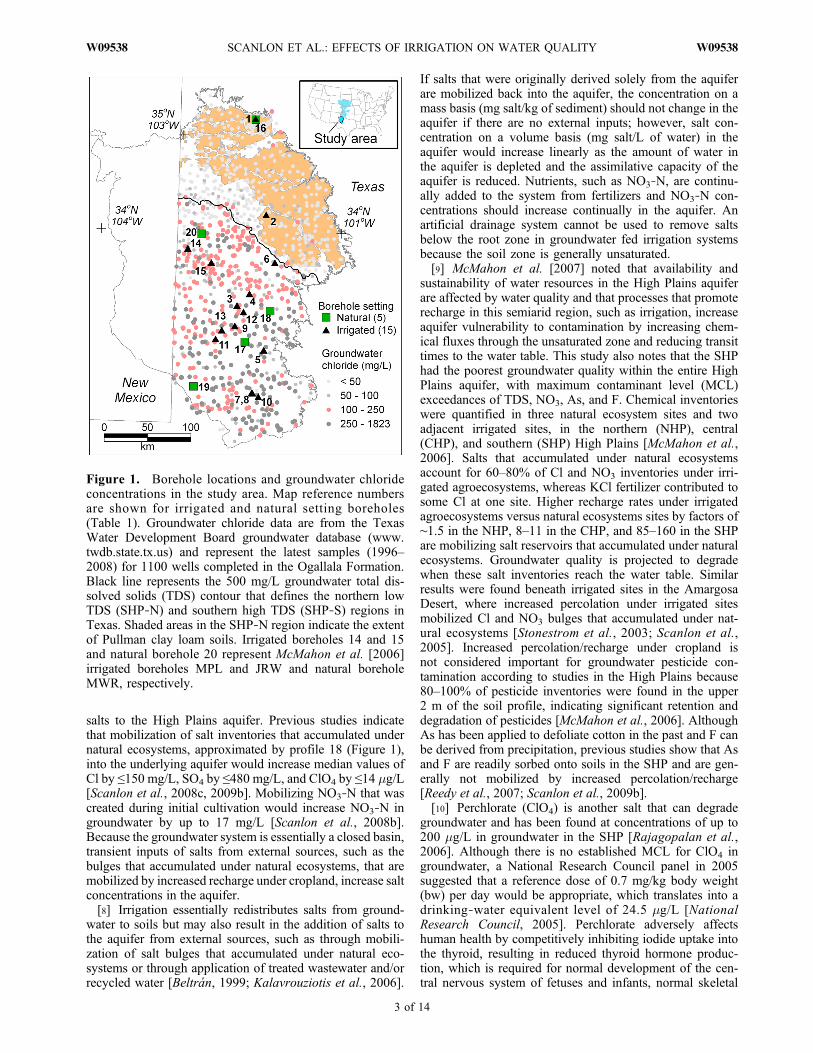
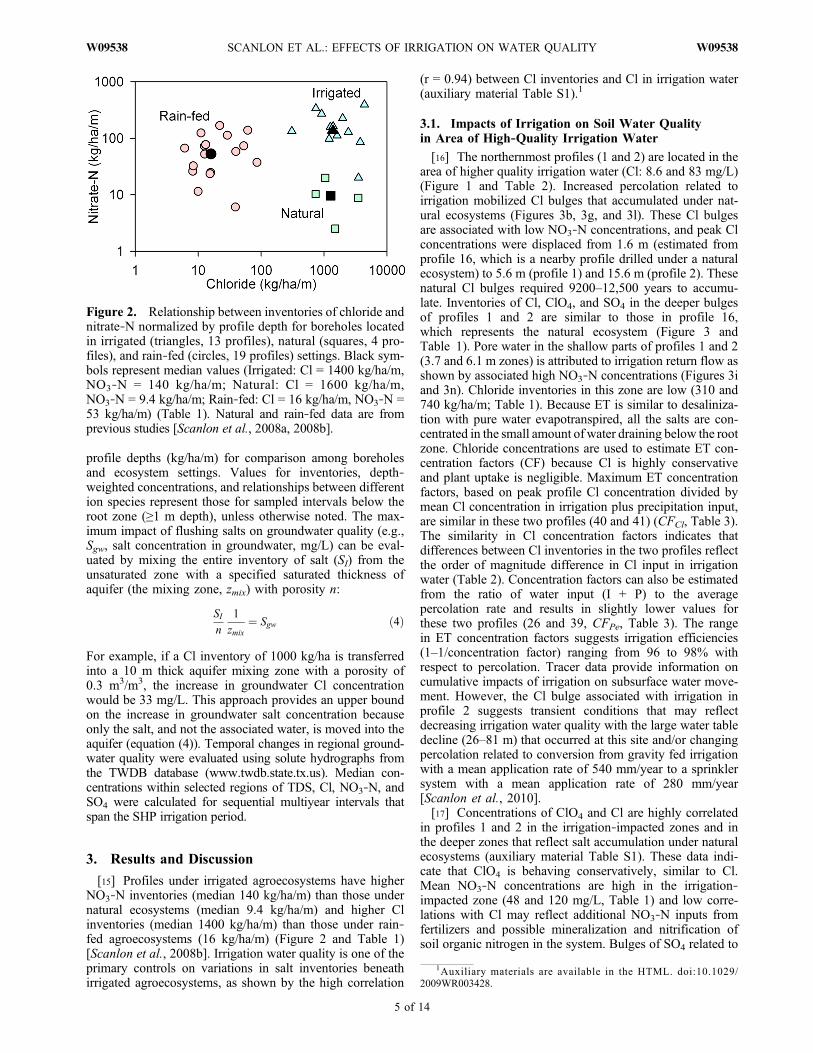
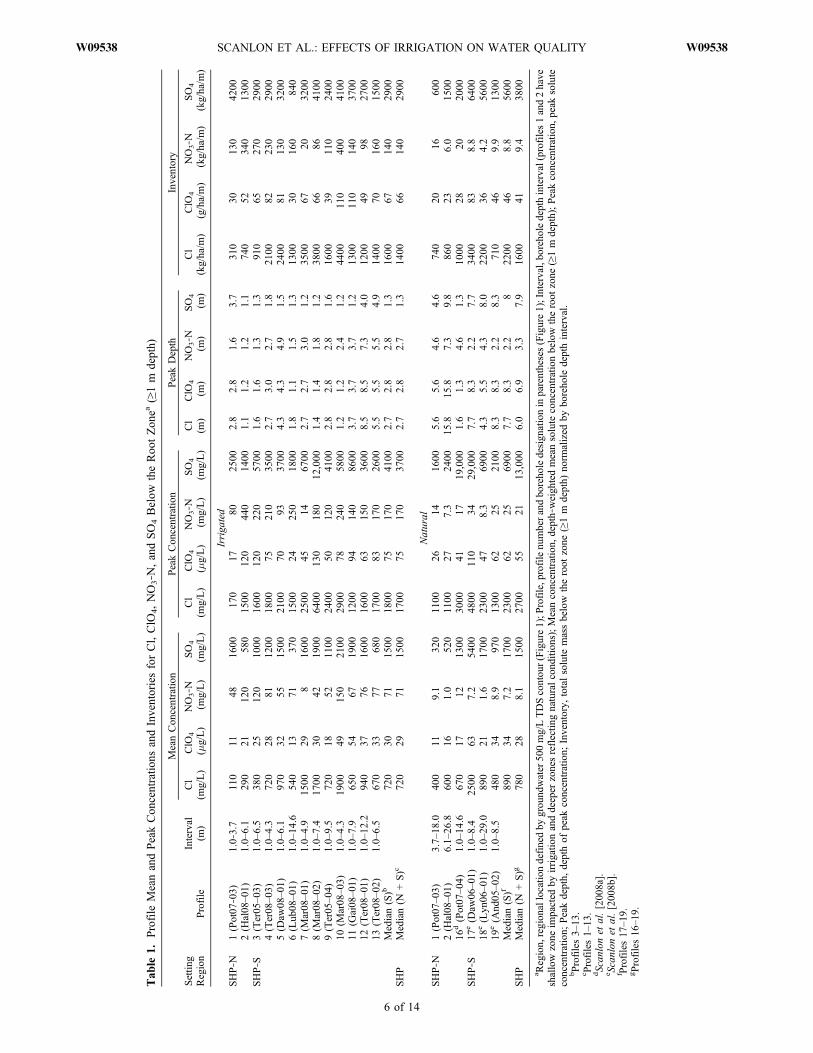
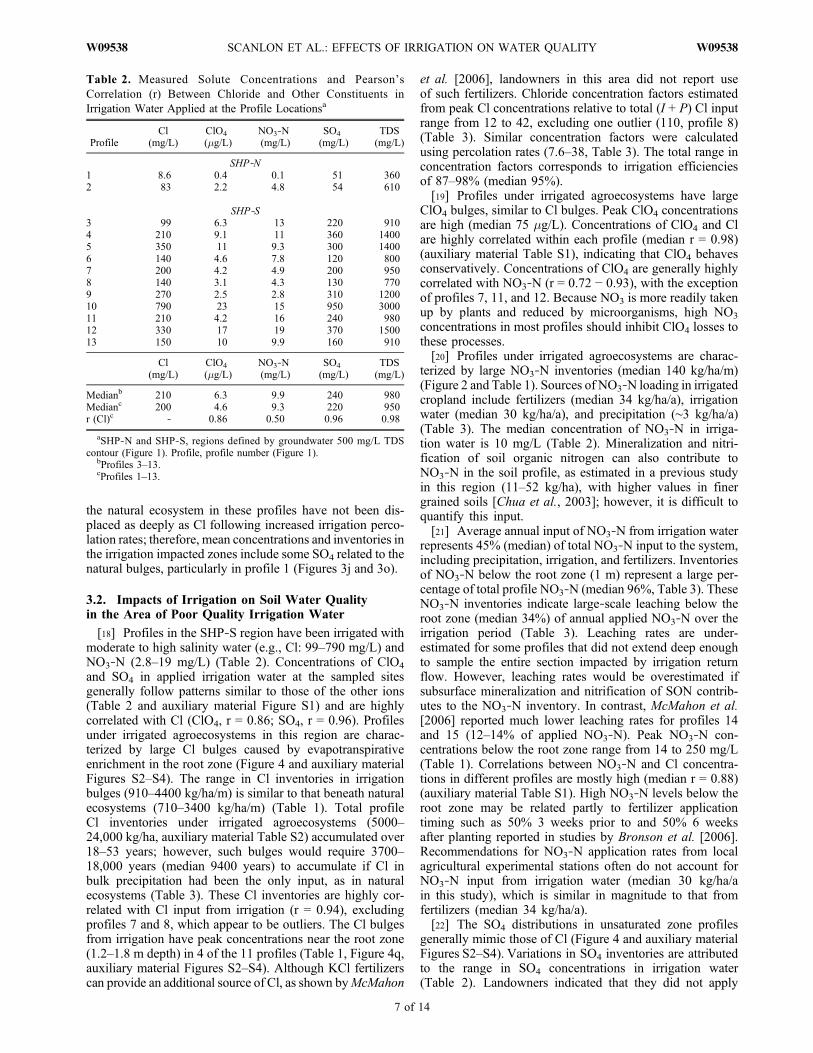
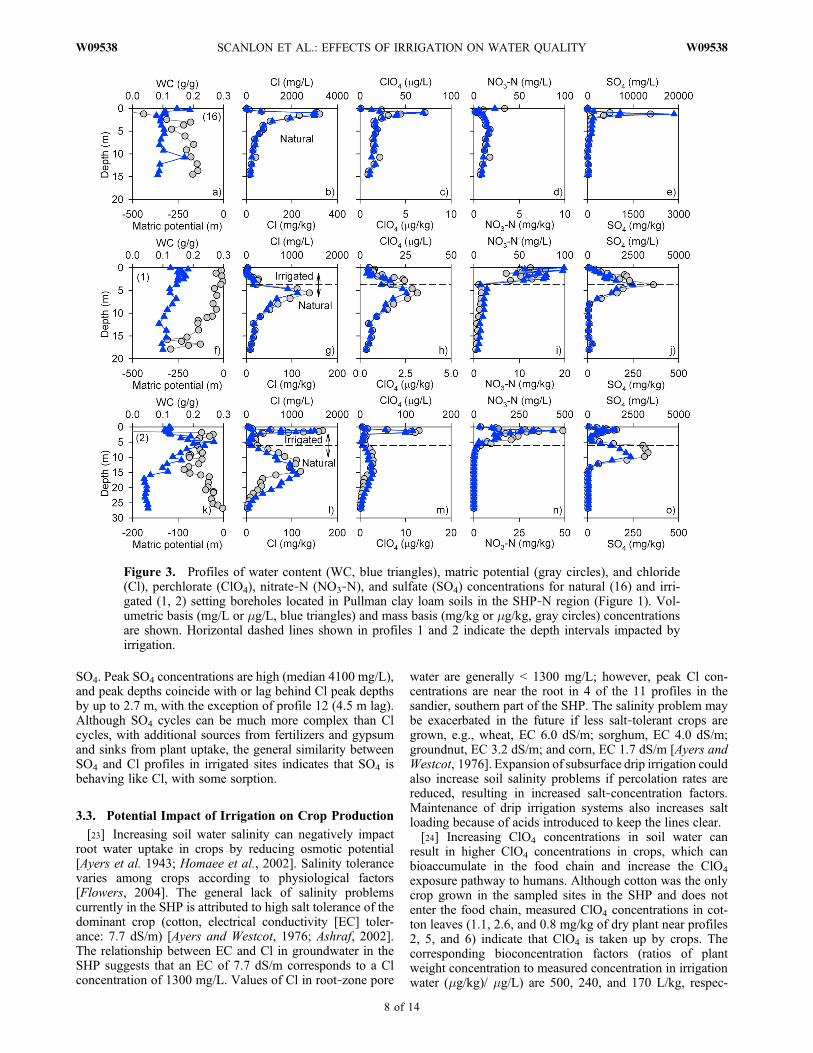

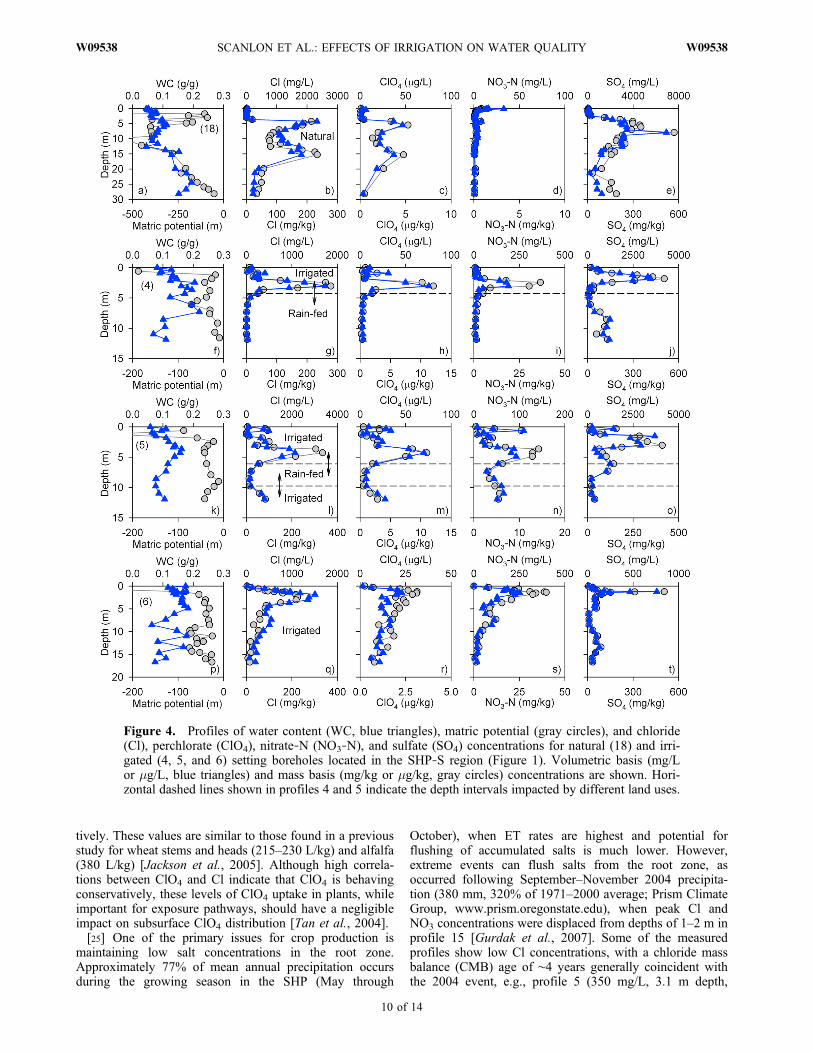
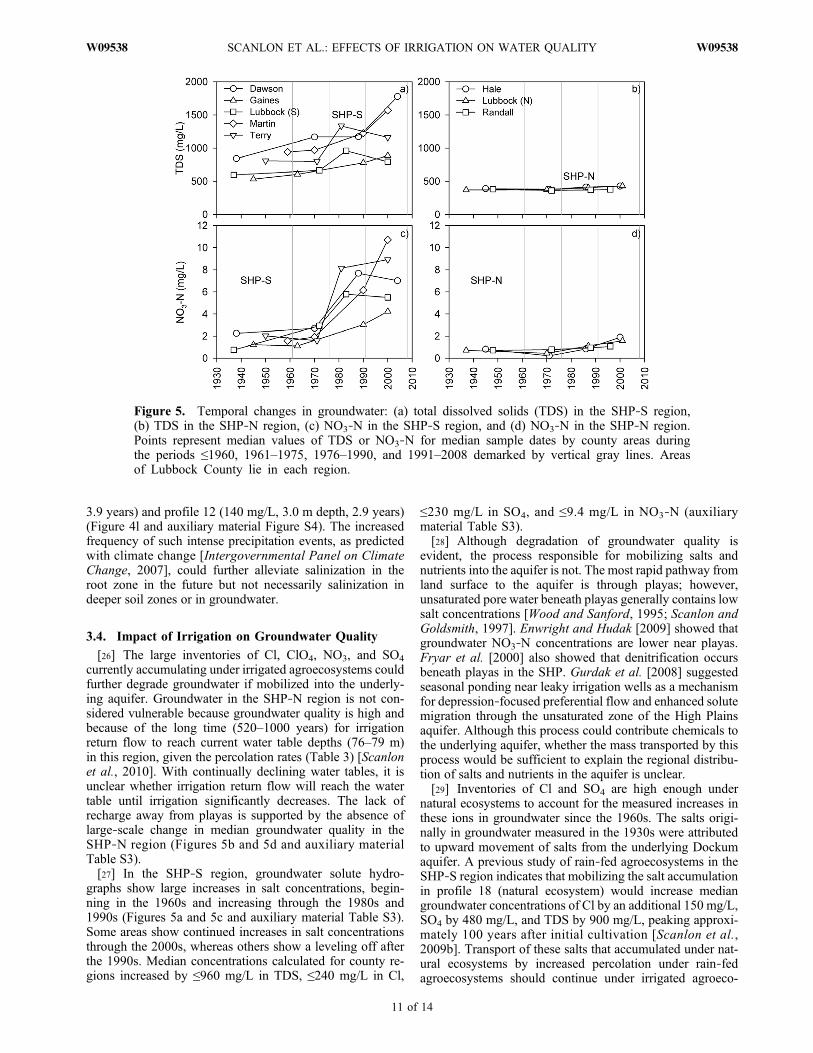
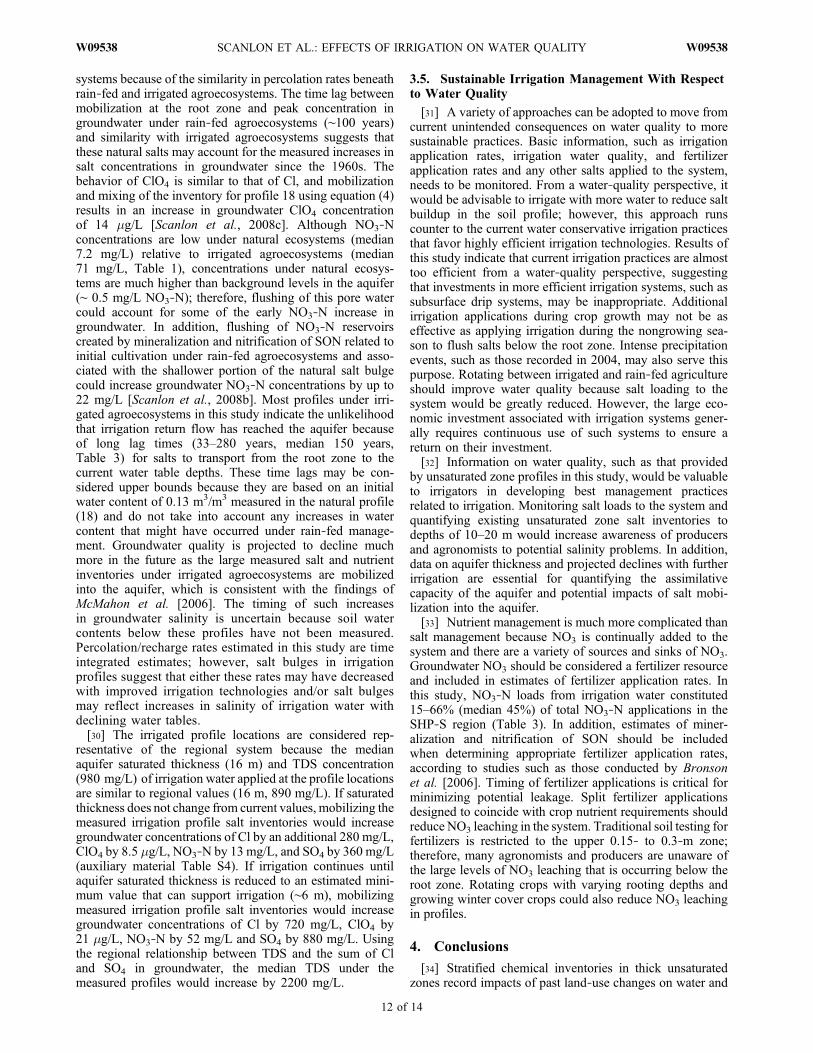


![[PPT]Soil Colloids and Soil Chemistry - University of Arizonacals-bigmac.arizona.edu/sites/cals-bigmac/files/section... · Web viewFertigation Foliar Applying fertilizers in irrigated](https://static.documents.pub/doc/80x56/5acb72697f8b9a73128ba355/pptsoil-colloids-and-soil-chemistry-university-of-arizonacals-viewfertigation.jpg)


