Page 1
The Pennsylvania State University
The Graduate School
EFFECTS OF JET IMPINGEMENT ON CONVECTIVE HEAT TRANSFER
AND DISCHARGE COEFFICIENTS IN EFFUSION HOLES
A Thesis in
Mechanical Engineering
by
Nathan C. Huelsmann
2020 Nathan C. Huelsmann
Submitted in Partial Fulfillment
of the Requirements
for the Degree of
Master of Science
May 2020
Page 2
The thesis of Nathan C. Huelsmann was reviewed and approved by the following:
Karen A. Thole
Department Head of Mechanical Engineering
Distinguished Professor
Thesis Advisor
Stephen P. Lynch
Professor of Mechanical Engineering
Daniel C. Haworth
Associate Department Head for Graduate Programs of Mechanical Engineering
Professor of Mechanical Engineering
Page 3
iii
Abstract
As inlet temperatures for gas turbines increase to improve power it becomes increasingly
necessary to better understand cooling techniques within combustor liners to improve durability.
Current combustor liner designs utilize a double-wall with impingement jets and effusion cooling
holes. Convective cooling through the effusion holes plays a large role in cooling the liner walls.
Discharge coefficients through the effusion holes are measured control flow and resize the
cooling holes if necessary. The majority of the current research on impingement and effusion
holes focuses on cooling effectiveness, or discharge coefficients without specific impingement
placements. The focus of this study was to measure the local internal convection and discharge
coefficients within the effusion hole based on varying impingement geometries to aid in the
understanding of combustor liner design. A large-scale, additively manufactured effusion hole
with a constant heat flux boundary was built, and both local convective heat transfer coefficients
along with discharge coefficients were measured under a multitude of impingement geometries.
Results indicated that there was a strong influence of the impingement hole relative to the
effusion hole on convective heat transfer within effusion hole. However, discharge coefficients
were only sensitive to impingement placement in only a few key locations.
Page 4
iv
Table of Contents
List of Figures .......................................................................................................................... v
List of Tables ........................................................................................................................... viii
Nomenclature ........................................................................................................................... ix
Acknowledgements .................................................................................................................. xi
Chapter 1 Introduction ............................................................................................................ 1
1.1 Combustor Liner Cooling .......................................................................................... 1
1.2 Objectives and Document Outline ............................................................................. 3
Chapter 2 Effects of Jet Impingement on Convective Heat Transfer In Effusion Holes ........ 4
2.1 Introduction ................................................................................................................ 4
2.2 Literature Review ....................................................................................................... 5
2.3 Impingement and Effusion Geometries ..................................................................... 6
2.4 Experimental Setup and Methods .............................................................................. 8
2.5 Effect of Angular Impingement Location .................................................................. 11
2.6 Effect of Impingement Radial Spacing ...................................................................... 18
2.7 Effect of Jet-to-Target Spacing .................................................................................. 23
2.8 Summary .................................................................................................................... 25
2.9 Conclusions ................................................................................................................ 27
Chapter 3 Effects Of Jet Impingement On Flow Discharge Coefficients For Combustor
Effusion Holes ..................................................................................................................... 29
3.1 Introduction ................................................................................................................ 29
3.2 Literature Review ....................................................................................................... 30
3.3 Impingement and Effusion Geometries ..................................................................... 31
3.4 Experimental Setup and Methods .............................................................................. 33
3.5 Effect of Angular Impingement Location .................................................................. 37
3.6 Effect of Impingement Radial Spacing ...................................................................... 41
3.7 Effect of Jet-to-Target Spacing .................................................................................. 44
3.8 Summary .................................................................................................................... 47
3.9 Conclusions ................................................................................................................ 49
Chapter 4 Conclusions ............................................................................................................ 51
4.1 Recommendations for Future Work ........................................................................... 52
References ................................................................................................................................ 53
Page 5
v
List of Figures
Figure 1-1: Double-wall combustor liner cross-section. (Effusion jets can be seen on the
top plate while impingement jets are on the bottom plate) [1]. ........................................ 2
Figure 2-1: Effusion hole and impingement hole geometries. Flow is exiting the page for
the bottom models. ........................................................................................................... 7
Figure 2-2: Impingement and effusion geometries studied..................................................... 8
Figure 2-3: Test facility showing impingement and effusion test plates. ............................... 9
Figure 2-4: Effusion hole instrumentation showing the heated surface with
thermocouples placed radially around the effusion hole. Flow is exiting the page. ....... 10
Figure 2-5: Area-averaged Nusselt number for the short effusion hole, L/D = 3, with
constant radial spacing, r/D = 1, and constant jet-to-target spacing, H/D = 3. ................ 12
Figure 2-6: Area-averaged Nusselt number for the long effusion hole, L/D = 6, with
constant radial spacing, r/D = 1, and constant jet-to-target spacing, H/D = 3. ................ 13
Figure 2-7: Nusselt number augmentation relative to the no impingement case for L/D =
3. ....................................................................................................................................... 14
Figure 2-8: Nusselt number augmentation relative to the no impingement case for L/D =
6. ....................................................................................................................................... 15
Figure 2-9: Local Nusselt numbers around the effusion hole entrance at the l/D = 0.3
position for the L/D = 3 effusion hole. ............................................................................. 17
Figure 2-10: Local Nusselt numbers around the effusion hole entrance at the l/D = 0.6
position for the L/D = 6 effusion hole. ............................................................................. 17
Figure 2-11: Local Nusselt numbers along the upstream and downstream lengths of the
effusion holes contrasting two different impingement locations for L/D = 3, r/D = 1,
and H/D = 3. ..................................................................................................................... 18
Figure 2-12: Area-averaged Nusselt number with changing r/D and θ for the L/D = 3
effusion hole. .................................................................................................................... 20
Figure 2-13: Area-averaged Nusselt number with changing r/D and θ for the L/D = 6
effusion hole. .................................................................................................................... 21
Figure 2-14: Local Nusselt number along the upstream and downstream walls
contrasting two r/D values at θ = 180°. ............................................................................ 21
Page 6
vi
Figure 2-15: Local Nusselt numbers around the effusion hole at the midpoint, l/D = 1.5,
position for the L/D = 3 effusion hole. ............................................................................. 22
Figure 2-16: Average Nusselt number augmentation of the close radial spacing compared
to the far radial spacing for the L/D = 3 and H/D = 3 geometry. ..................................... 22
Figure 2-17: Total area-averaged Nusselt number with varying jet-to-target spacing for
r/D = 1 and L/D = 3. ......................................................................................................... 24
Figure 2-18: Total area-averaged Nusselt number with varying jet-to-target spacing for
r/D = 1 and L/D = 6. ......................................................................................................... 24
Figure 2-19: Average Nusselt number augmentation of the close impingement jet-to-
effusion hole spacing compared to the large spacing for a radial spacing for the r/D =
1 and L/D = 3 geometry. .................................................................................................. 25
Figure 2-20: Total area-averaged Nusselt number summary for L/D = 3. .............................. 26
Figure 2-21: Total area-averaged Nusselt number summary for L/D = 6. .............................. 27
Figure 3-1: Impingement and effusion hole geometries. In the bottom models flow is
exiting the page. ............................................................................................................... 32
Figure 3-2: Effusion and impingement geometries studied. ................................................... 33
Figure 3-3: Experimental rig with impingement plates and the additively manufactured
effusion hole. .................................................................................................................... 34
Figure 3-4: Effusion hole instrumentation showing the heated surface with
thermocouples placed radially around the effusion hole. Flow is exiting the page. ....... 35
Figure 3-5: Discharge coefficients for the short effusion hole, L/D = 3, with radial
spacing r/D = 1 and jet-to-target spacing H/D = 3 for the angular impingement
positions. .......................................................................................................................... 38
Figure 3-6: Discharge coefficients for the long effusion hole, L/D = 6, with radial
spacing r/D = 1 and jet-to-target spacing H/D = 3 for the angular impingement
positions. .......................................................................................................................... 39
Figure 3-7: Discharge coefficients vs. Pressure Ratio for the short effusion hole, L/D = 3,
with radial spacing r/D = 1 and jet-to-target spacing H/D = 3 for the angular
impingement positions. .................................................................................................... 39
Figure 3-8: Discharge coefficients vs. Pressure Ratio for the long effusion hole, L/D = 6,
with radial spacing r/D = 1 and jet-to-target spacing H/D = 3 for the angular
impingement positions. .................................................................................................... 40
Page 7
vii
Figure 3-9: Area-averaged Nusselt number for the short effusion hole, L/D = 3, with
constant radial spacing, r/D = 1, and constant jet-to-target spacing, H/D = 3. ................ 40
Figure 3-10: Area-averaged Nusselt number for the long effusion hole, L/D = 6, with
constant radial and jet-to-target spacing........................................................................... 41
Figure 3-11: Discharge coefficients for the short effusion hole, L/D = 3, with varying
radial spacing and constant jet-to-target spacing, H/D = 3, for each angular
impingement position. ...................................................................................................... 42
Figure 3-12: Discharge coefficients for the long effusion hole, L/D = 6, with varying
radial spacing and constant jet-to-target spacing, H/D = 3, for each angular
impingement position. ...................................................................................................... 43
Figure 3-13: Area-averaged Nusselt number for the short effusion hole, L/D = 3, with
varying radial spacing and constant jet-to-target spacing, H/D = 3. ................................ 43
Figure 3-14: Area-averaged Nusselt number for the long effusion hole, L/D = 6, with
varying radial spacing and constant jet-to-target spacing, H/D = 3. ................................ 44
Figure 3-15: Discharge coefficients for the short effusion hole, L/D = 3, with constant
radial spacing, r/D = 1, and varying jet-to-target spacing for each angular
impingement position. ...................................................................................................... 45
Figure 3-16: Discharge coefficients for the long effusion hole, L/D = 6, with constant
radial spacing, r/D = 1, and varying jet-to-target spacing for each angular
impingement position. ...................................................................................................... 46
Figure 3-17: Area-averaged Nusselt number for the short effusion hole, L/D = 3, with
constant radial spacing, r/D = 1, and varying jet-to-target spacing. ................................. 46
Figure 3-18: Area-averaged Nusselt number for the long effusion hole, L/D = 6, with
constant radial spacing, r/D = 1, and varying jet-to-target spacing. ................................. 47
Figure 3-19: Discharge Coefficient summary for L/D = 3. .................................................... 48
Figure 3-20: Discharge Coefficient summary for L/D = 6. .................................................... 48
Page 8
viii
List of Tables
Table 2-1: Effusion and Impingement Variables. ................................................................... 7
Table 3-1: Impingement and Effusion Geometry. .................................................................. 32
Page 9
ix
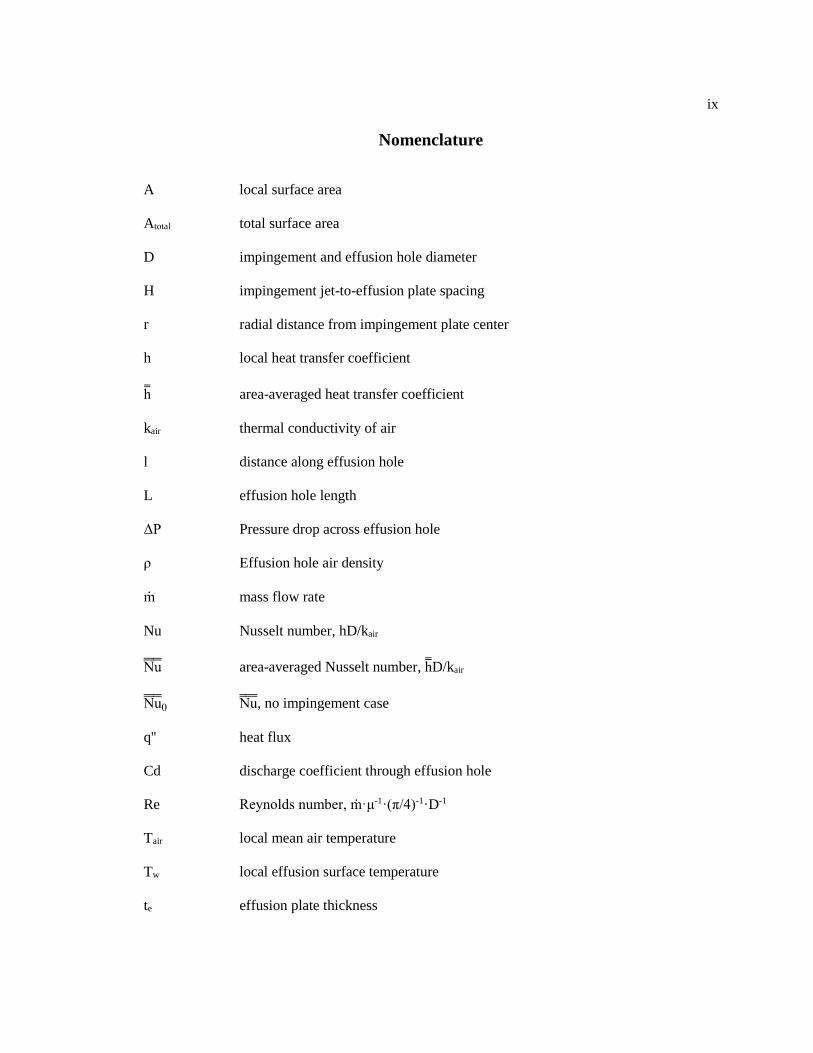
Nomenclature
A local surface area
Atotal total surface area
D impingement and effusion hole diameter
H impingement jet-to-effusion plate spacing
r radial distance from impingement plate center
h local heat transfer coefficient
h area-averaged heat transfer coefficient
kair thermal conductivity of air
l distance along effusion hole
L effusion hole length
ΔP Pressure drop across effusion hole
ρ Effusion hole air density
m mass flow rate
Nu Nusselt number, hD/kair
Nu area-averaged Nusselt number, hD/kair
Nu 0 Nu , no impingement case
q'' heat flux
Cd discharge coefficient through effusion hole
Re Reynolds number, ṁ·μ-1·(π/4)-1·D-1
Tair local mean air temperature
Tw local effusion surface temperature
te effusion plate thickness
Page 10
x
ti impingement plate thickness
Greek
α effusion inclination angle
θ Impingement circumferential location angle
μ dynamic viscosity
Φ effusion circumferential location angle
Page 11
xi
Acknowledgements
First, I want to thank my advisor, Dr. Karen Thole, for giving me the chance to work
within her lab. Her guidance and general support allowed me to succeed at Penn State. My
research would not be possible without Pratt and Whitney, who financed the work. I would like to
thank Fumi Ichihashi specifically for his technical support. To all my lab mates, thank you for
making my time here entertaining. I would like to thank Jacob Snyder for showing me the ropes
when I first arrived. Lastly, thank you to my friends and family back home. Their enthusiasm
towards my return gave me the energy to push forward no matter what. Specifically, I want to
thank my parents for supporting me throughout college and life.
Page 12
1
Chapter 1
Introduction
Gas turbines are widely used to power aircraft or produce power in industrial
applications. In modern gas turbines, the temperatures of the combustion gases are higher than
the melting temperature of the turbine components. Due to these elevated temperatures, it is
necessary to use cooling air to protect turbine components. The cooling air is bled off from the
compressor and used to cool the turbine components by feeding air through passages built into
the components and exhausting the coolant to create a protective layer of air over the part
surfaces. As the air moves through the internal passages it picks up heat through convection, and
as it exits the passage the cooling layer of air also protects the components against the hot gases.
However, the bleed off from the compressor leads to drops in thermal efficiency since the cooling
air does not create work. Therefore, it is imperative to effectively protect components while
keeping the amount of necessary cooling air to a minimum. The studies presented in this research
will focus on analyzing cooling with regards to the combustor liner of a gas turbine.
1.1 Combustor Liner Cooling
Combustor liner cooling is performed using a variety of impingement jets and effusion
jets. Mainly, this is done in a double-wall combination where the impingement jets are feeding air
through the effusion holes. The effusion holes are angled to aid in creating a cooling film over the
surface. A schematic of this double-wall design can be seen in Figure 1-1.
Page 13
2
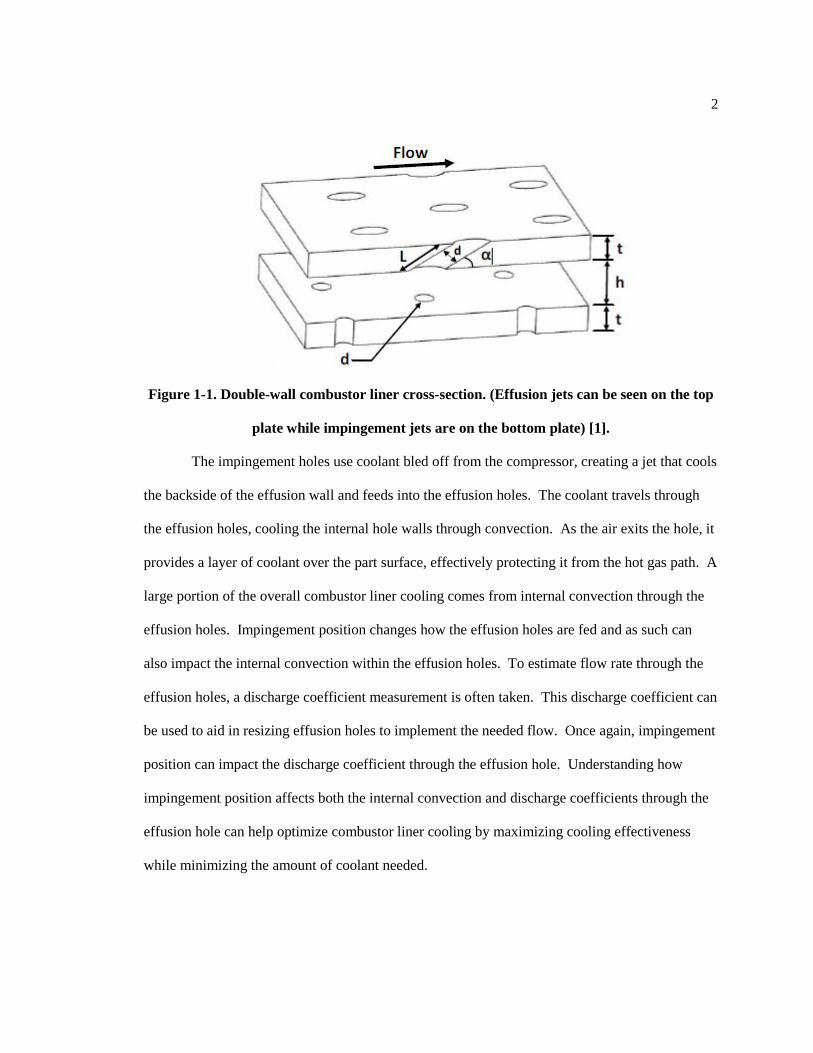
Figure 1-1. Double-wall combustor liner cross-section. (Effusion jets can be seen on the top
plate while impingement jets are on the bottom plate) [1].
The impingement holes use coolant bled off from the compressor, creating a jet that cools
the backside of the effusion wall and feeds into the effusion holes. The coolant travels through
the effusion holes, cooling the internal hole walls through convection. As the air exits the hole, it
provides a layer of coolant over the part surface, effectively protecting it from the hot gas path. A
large portion of the overall combustor liner cooling comes from internal convection through the
effusion holes. Impingement position changes how the effusion holes are fed and as such can
also impact the internal convection within the effusion holes. To estimate flow rate through the
effusion holes, a discharge coefficient measurement is often taken. This discharge coefficient can
be used to aid in resizing effusion holes to implement the needed flow. Once again, impingement
position can impact the discharge coefficient through the effusion hole. Understanding how
impingement position affects both the internal convection and discharge coefficients through the
effusion hole can help optimize combustor liner cooling by maximizing cooling effectiveness
while minimizing the amount of coolant needed.
Page 14
3
1.2 Objectives and Document Outline
This thesis reports the effects that the jet impingement position has on internal convective
heat transfer and discharge coefficients within effusion holes. Internal convective heat transfer
measurements will be broken up into local measurements along the effusion hole and overall heat
transfer coefficients. The overall objective is to better understand how impingement location can
change the previously mentioned variables to aid in the design of combustor liners. Chapter 2
will focus on the internal heat transfer coefficients through the effusion hole and is composed of a
paper that is recommended for publication in the Journal of Turbomachinery and has been
accepted into Turbo Expo 2020. Chapter 3 analyzes the discharge coefficients measured from the
same experiments seen in the paper mentioned above and has been written for publication in the
future. Chapter 4 will summarize the main findings and provide recommendations for future
work.
Page 15
4
Chapter 2
Effects of Jet Impingement on Convective Heat Transfer in Effusion Holes
2.1 Introduction
Resulting from increased temperatures seen in modern combustors, effective cooling is
necessary to ensure combustor liner durability. Current combustor liners are highly engineered
with a double-wall design containing impingement and effusion cooling. Impingement jets cool
the backside wall, while effusion jets create a protective film over the external wall. Internal
convection from the effusion holes has also been shown to play a large role in the overall cooling
of the combustor liner walls. What is not known is how the coolant feed from the impingement
hole that supplies the effusion hole affects the internal convective cooling from the effusion hole,
especially at the entrance region of the effusion hole. In many designs, the impingement hole
location relative to the effusion hole entrance can vary, whether it be from manufacturing
tolerances or design constraints. This variation can, in fact, affect the internal convection from
the effusion holes leading to either better cooling or detrimental temperatures.
In the existing literature, numerous studies have reported adiabatic effectiveness and
overall effectiveness for double-wall combustor liners [1-4]. However, few studies have reported
the details of internal convection within effusion holes that are supplied by impingement jets.
The uniqueness of this paper is that numerous experiments were conducted in which the local and
averaged internal convection coefficients of an effusion hole were measured for a wide variety of
impingement jet locations. Given that the entrance conditions for the effusion jets can vary
widely and the entrance flow is highly influential on the convective heat transfer, the focus of this
study was on the entrance region of the effusion hole.
Page 16
5
2.2 Literature Review
Only a few studies have been published on the internal heat transfer within film cooling
holes. Boelter et al. [5] studied the heat transfer in the entrance region of long circular tubes with
varying entrance conditions such as angled bends or flared openings. His paper showed high heat
transfer at the entrance to the pipe in which he developed correlations to predict average heat
transfer coefficients for the long pipes that were significantly longer than most film-cooling holes.
In a study modeling a combustor wall using the naphthalene sublimation method, Cho et al. [6]
found local and average mass transfer coefficients through a circular, short hole (L/D < 1.5).
They showed that a separation region was present at the hole entrance that decreased with
increasing Reynolds numbers until Re > 5000. It was also found that around 60% of the total
mass transfer of the combustor liner was due to the convective heat transfer from the cooling
holes. Kohli and Thole [7] performed a CFD analysis on angled film cooling holes that showed a
similar separation region at the inlet to the film-cooling holes that was very sensitive to the
coolant supply direction.
An analytical model of film cooling holes in a combustor wall by Martiny et al. [8]
presented a method for optimization of cooling hole distributions. Similar to Cho et al. [6], they
found that 60% of the heat transfer was due to the internal heat transfer in the effusion holes.
This assertion was further verified by Terrell et al. [9] through a combination of experimental and
CFD results from film cooling holes in a leading edge of a model turbine blade. They found that
the coolant hole internal heat transfer accounted for 50 – 80% of the convective heat transfer.
Recently, Bryant et al. [10] devised CFD models to isolate the cooling mechanisms
present in the overall effectiveness of a single wall external film cooling design by varying
boundary conditions. To evaluate the effect of internal hole cooling on the overall effectiveness,
surfaces of the film cooling hole were set to be adiabatic to remove the effect of internal cooling
Page 17
6
and results were then compared to the baseline case. In Bryant et al.’s results, internal hole
cooling was most effective at cooling the upstream surface of the effusion hole and near the exit
of the hole.
None of the previously discussed studies have evaluated internal convective cooling of
effusion holes in relation to impingement positions, especially with respect to local
measurements. To begin to close this knowledge gap, the current study adds data on the local
heat transfer within the effusion hole as affected by varying impingement patterns.
2.3 Impingement and Effusion Geometries
A scaled-up, double-wall combustor liner with a single effusion hole and single
impingement hole was constructed with the details given in Table 2-1 and shown in Figure 2-1.
Note that the entrance effects were the primary interest for this study and, as such, the exit cross-
flow was not simulated for the effusion hole since it does not have significant affects to the
internal heat transfer as shown by Cho and Goldstein [11].
Both the effusion and impingement holes had the same diameter, D (D = 2.54 cm) as
shown in Figure 2-1. The effusion hole was constructed as a single pipe that was 3D printed from
a low thermal conductivity plastic. The printed effusion hole (pipe) allowed for specific
thermocouple placement along the length of the pipe as well as around the circumference. Three
different impingement plates containing a single hole were constructed, which allowed for testing
at a multitude of positions, both radially as well as circumferentially, relative to the effusion hole.
The impingement plate thickness, ti, and impingement and effusion hole diameters, D, remained
the same for each of the plates.
Page 18
7
Table 2-1. Effusion and Impingement Variables
Impingement Effusion
(deg) 90 30
ti / D 1 N/A
te/D N/A 1.5, 3
H/D 3, 6 N/A
L/D N/A 3, 6
r/D 0, 1, 3 N/A
(°) 0, 90, 180, 270 N/A
Φ(°) N/A
-180, -135, -90, -45, 0, 45,
90, 135, 180
Figure 2-1. Effusion hole and impingement hole geometries. Flow is exiting the page for the
bottom models.
Page 19
8
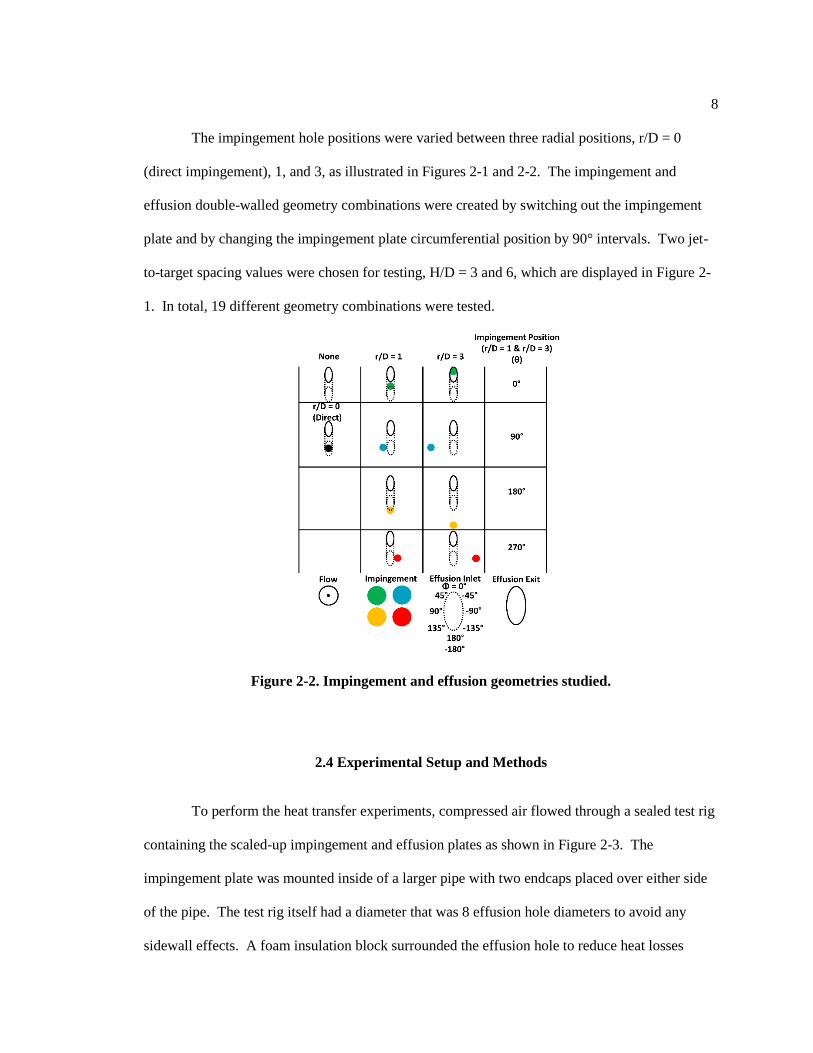
The impingement hole positions were varied between three radial positions, r/D = 0
(direct impingement), 1, and 3, as illustrated in Figures 2-1 and 2-2. The impingement and
effusion double-walled geometry combinations were created by switching out the impingement
plate and by changing the impingement plate circumferential position by 90° intervals. Two jet-
to-target spacing values were chosen for testing, H/D = 3 and 6, which are displayed in Figure 2-
1. In total, 19 different geometry combinations were tested.
Figure 2-2. Impingement and effusion geometries studied.
2.4 Experimental Setup and Methods
To perform the heat transfer experiments, compressed air flowed through a sealed test rig
containing the scaled-up impingement and effusion plates as shown in Figure 2-3. The
impingement plate was mounted inside of a larger pipe with two endcaps placed over either side
of the pipe. The test rig itself had a diameter that was 8 effusion hole diameters to avoid any
sidewall effects. A foam insulation block surrounded the effusion hole to reduce heat losses
Page 20
9
during testing. The endcap upstream of the impingement plate included a nozzle and splash plate
to diffuse the air flow entering the rig. Air flow was controlled using a mass flow controller.
Figure 2-3. Test facility showing impingement and effusion test plates.
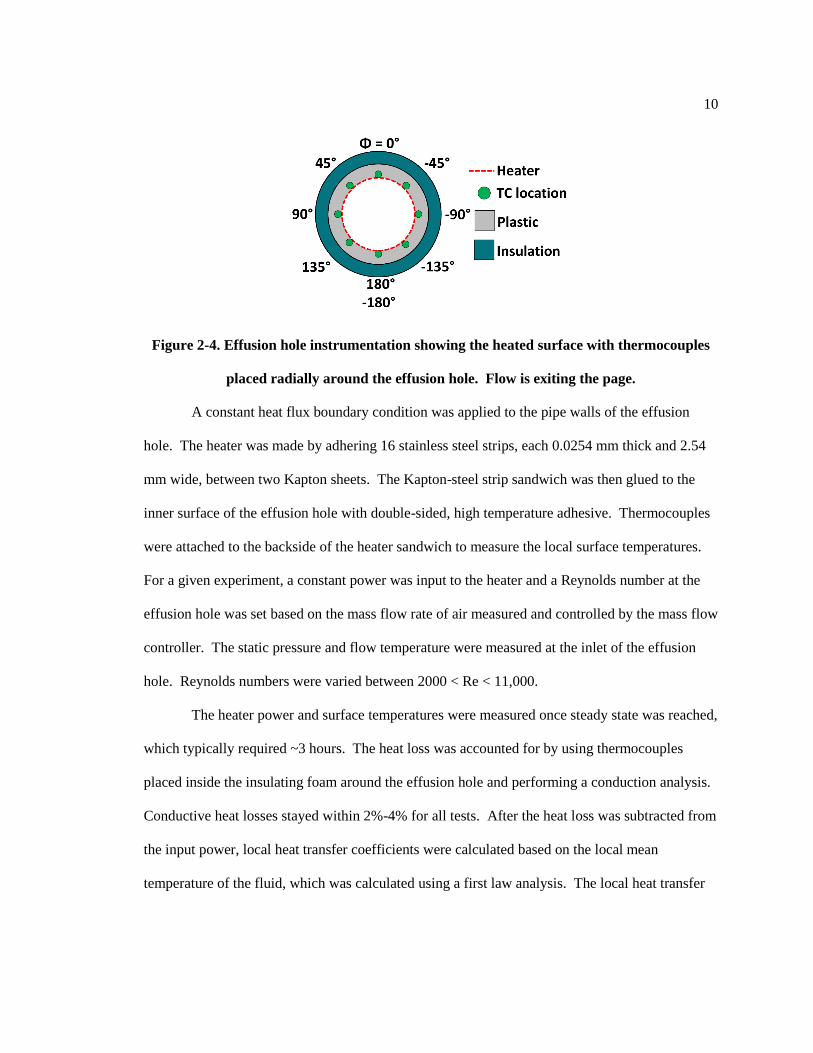
Thermocouples were inserted into 38 slots located along the length and around the
circumference of the effusion hole so that the thermocouple beads were flush with the inner
surface of the effusion hole as shown in Figure 2-4. Each slot was then filled with a thermally
conductive epoxy to ensure that the bead was in contact with the inner heat flux surface.
Thermocouple placement started at the entrance to the pipe (effusion hole) and continued at every
10% interval along L/D up to l//D = 2.7.
Page 21
10
Figure 2-4. Effusion hole instrumentation showing the heated surface with thermocouples
placed radially around the effusion hole. Flow is exiting the page.
A constant heat flux boundary condition was applied to the pipe walls of the effusion
hole. The heater was made by adhering 16 stainless steel strips, each 0.0254 mm thick and 2.54
mm wide, between two Kapton sheets. The Kapton-steel strip sandwich was then glued to the
inner surface of the effusion hole with double-sided, high temperature adhesive. Thermocouples
were attached to the backside of the heater sandwich to measure the local surface temperatures.
For a given experiment, a constant power was input to the heater and a Reynolds number at the
effusion hole was set based on the mass flow rate of air measured and controlled by the mass flow
controller. The static pressure and flow temperature were measured at the inlet of the effusion
hole. Reynolds numbers were varied between 2000 < Re < 11,000.
The heater power and surface temperatures were measured once steady state was reached,
which typically required ~3 hours. The heat loss was accounted for by using thermocouples
placed inside the insulating foam around the effusion hole and performing a conduction analysis.
Conductive heat losses stayed within 2%-4% for all tests. After the heat loss was subtracted from
the input power, local heat transfer coefficients were calculated based on the local mean
temperature of the fluid, which was calculated using a first law analysis. The local heat transfer
Page 22
11
coefficient, h, for each position was calculated using Equation 2-1, where the air temperature, Tair,
was the local mean temperature and Tw was the wall surface temperature.
h = q"
Tw-Tair (2- 1)
An area-averaged heat transfer coefficient, h, was found through an area-weighted formula shown
in Equation 2-2.
h = ∑h∙A
Atotal (2- 2)
Experimental Uncertainty
Uncertainty in the experiments was calculated using the methods from Kline and
McClintock [12]. The uncertainty of the local Nusselt numbers was found to be between 3%-7%
with uncertainty decreasing as the hole length increased, and increasing as the Reynold’s number
increased. This increase in uncertainty is attributed to the smaller temperature difference between
the cooling flow and the effusion wall temperature. Uncertainty for the averaged Nusselt
numbers was found to be under 1% for all cases. Finally, uncertainty in the Reynolds number
was found to be less than 1% for all cases.
2.5 Effect of Angular Impingement Location
As was stated in the literature review, Kohli and Thole’s [7] computational studies
showed the influence that the coolant supply direction had on the film-cooling performance as
well as the flow-field within the cooling hole. Figures 2-5 and 2-6 show the area-averaged
Nusselt numbers for the short and long effusion holes (L/D = 3 and 6) over the range of Reynolds
numbers for differing jet impingement locations for the closest radial position, r/D = 1, and
closest impingement distance, H/D = 3. Also shown in Figures 2-5 and 2-6 is what would be
Page 23
12
expected from a fully-developed pipe flow, as indicated by the Gnielinski correlation [13], as well
as the measured convective heat transfer coefficients for direct jet impingement and no
impingement cases.
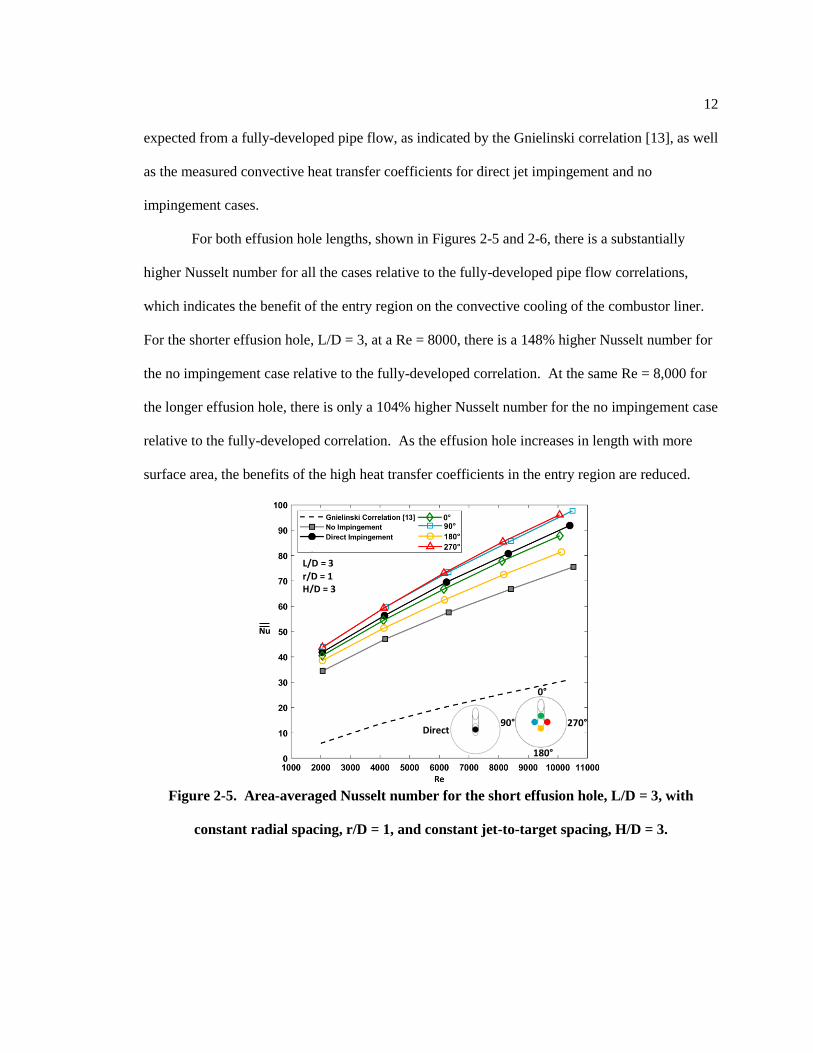
For both effusion hole lengths, shown in Figures 2-5 and 2-6, there is a substantially
higher Nusselt number for all the cases relative to the fully-developed pipe flow correlations,
which indicates the benefit of the entry region on the convective cooling of the combustor liner.
For the shorter effusion hole, L/D = 3, at a Re = 8000, there is a 148% higher Nusselt number for
the no impingement case relative to the fully-developed correlation. At the same Re = 8,000 for
the longer effusion hole, there is only a 104% higher Nusselt number for the no impingement case
relative to the fully-developed correlation. As the effusion hole increases in length with more
surface area, the benefits of the high heat transfer coefficients in the entry region are reduced.
Figure 2-5. Area-averaged Nusselt number for the short effusion hole, L/D = 3, with
constant radial spacing, r/D = 1, and constant jet-to-target spacing, H/D = 3.
L/D = 3 r/D = 1 H/D = 3
Direct
0°
90°
180°
270°
Page 24
13
Figure 2-6. Area-averaged Nusselt number for the long effusion hole, L/D = 6, with constant
radial spacing, r/D = 1, and constant jet-to-target spacing, H/D = 3.
Although it might be expected that direct impingement would result in the highest
Nusselt numbers, the data in Figures 2-5 and 2-6 indicate otherwise. In fact, the direct
impingement is between the side injection (90° and 270°) cases and the in-line injection (0° and
180°). These results indicate a major flowfield change when feeding the effusion hole using side
injection.
In addition to the augmentation of the convective heat transfer that occurs resulting from
the entry region of the effusion hole relative to a fully-developed pipe flow, there is also
significant augmentation for the impingement cases relative to that of no impingement. Figures
2-7 and 2-8 directly show the heat transfer augmentation for the jet impingement relative to the
no impingement case for both the long and short effusion holes for the circumferentially varying
jet locations. The augmentation results indicate that there is no dependence upon Reynolds
number with essentially a constant value for a given geometry. For each impingement case, the
L/D = 6 r/D = 1 H/D = 3
0°
90°
180°
270° Direct
Page 25
14
augmentation is always higher for the shorter hole length at L/D = 3 relative to the longer hole
length at L/D = 6.
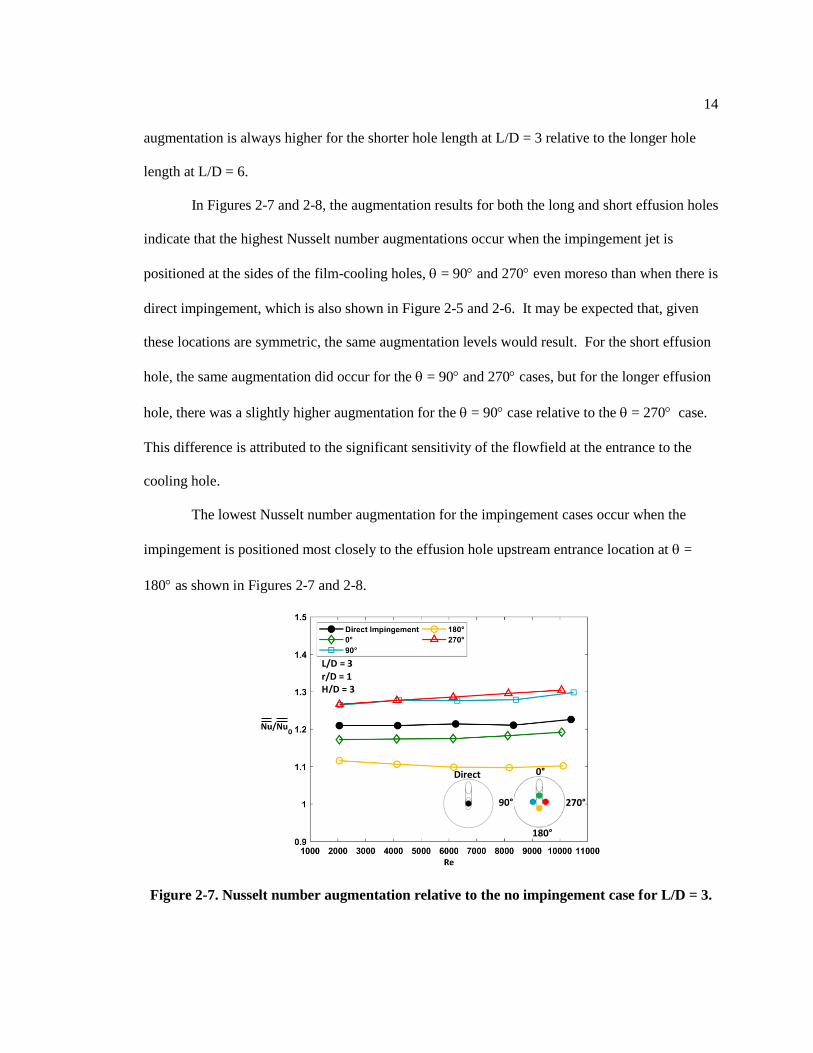
In Figures 2-7 and 2-8, the augmentation results for both the long and short effusion holes
indicate that the highest Nusselt number augmentations occur when the impingement jet is
positioned at the sides of the film-cooling holes, = 90 and 270 even moreso than when there is
direct impingement, which is also shown in Figure 2-5 and 2-6. It may be expected that, given
these locations are symmetric, the same augmentation levels would result. For the short effusion
hole, the same augmentation did occur for the = 90 and 270 cases, but for the longer effusion
hole, there was a slightly higher augmentation for the = 90 case relative to the = 270 case.
This difference is attributed to the significant sensitivity of the flowfield at the entrance to the
cooling hole.
The lowest Nusselt number augmentation for the impingement cases occur when the
impingement is positioned most closely to the effusion hole upstream entrance location at =
180 as shown in Figures 2-7 and 2-8.
Figure 2-7. Nusselt number augmentation relative to the no impingement case for L/D = 3.
L/D = 3 r/D = 1 H/D = 3
Direct 0°
90°
180°
270°
Page 26
15
Figure 2-8. Nusselt number augmentation relative to the no impingement case for L/D = 6.
To further evaluate the differences in augmentation from varying the impingement
positions seen in Figures 2-7 and 2-8, local Nusselt numbers at the entrance of the effusion holes
(10% along the length of the hole, l /D = 0.3 for the L/D = 3; and l /D = 0.6 for the L/D = 6) were
plotted in Figures 2-9 and 2-10 for Re= 8,000. As would be expected in Figures 2-9 and 2-10, the
local heat transfer coefficients are relatively symmetric for the impingement locations of θ = 0°
and 180° with only slight anomalies for the θ = 0° in Figure 2-9 for the short L/D hole, which is
attributed to the sensitivity due to the separation region.
For both L/D geometries in Figures 2-9 and 2-10, the general spread of the local
convective heat transfer coefficients when plotted were similar. At the same case for the = 0°
position, a substantial drop in Nusselt number is observed regardless of L/D. This drop is
indicative of the flow separation region as described in Kohli and Thole’s [7] CFD analyses,
which is caused by the turning angle of the fluid into the hole. It is important to note, however,
that not exactly the same values occurred, which is related to the fact that in both cases these
measurements were taken at 10% of the total length of the hole, which is effectively a larger
downstream distance for the longer cooling hole case of L/D = 6 relative to the shorter cooling
hole case of L/D = 3. When comparing L/D = 3 to L/D = 6 at = 0°, the local heat transfer
L/D = 6 r/D = 1 H/D = 3
Direct 0°
90°
180°
270°
Page 27
16
coefficients are nominally 30% higher for the L/D = 3 case further illustrating the importance of
the entrance region effects on heat transfer from the effusion holes.
As expected, Figures 2-9 and 2-10 show that there is an increase in the local heat transfer
coefficients for the θ = 90° and 270° cases on the side of the effusion hole where the
impingement took place. These local increases translate to higher overall averages of the heat
transfer augmentation for the θ = 90° and 270° cases as was shown in Figures 2-7 and 2-8. The
reason for these increased heat transfer coefficients, more so than other impingement locations, is
because of the differing entrance flow conditions. Kohli and Thole’s [7] study showed that,
depending upon the feed location of a film-cooling hole, it is possible to alter the flow separation
angle, which is present in the case of most film-cooling type flows, and even induce a swirl.
The hypothesis of an induced swirl for the θ = 90° and 270° impingement cases at the
hole entrance is supported by contrasting the data given in Figure 2-11, which shows the
streamwise distribution of the local heat transfer coefficients on both the upstream and
downstream walls of the effusion holes for the θ = 0° and 90° tests for the short L/D = 3 hole.
Referring back to Figure 2-2, it is important to note that for the θ = 0°, the impinging fluid is
targeting the upstream wall of the hole entrance. For the impingement fluid to enter the effusion
hole, a large flow turning angle is required, which induces a separation region on the upstream
wall. It would be expected that for the θ = 0° case, the large separation along the upstream wall of
the effusion hole would result in lower convective heat transfer coefficients which, in fact, is
shown in Figure 2-11. In contrast, for the θ = 90° case, the upstream wall has significantly higher
local heat transfer coefficients along the wall. In both the θ = 0° and 90° cases, the local heat
transfer coefficients along the downstream wall are nominally the same along the length of the
pipe.
Page 28
17
Figure 2-9. Local Nusselt numbers around the effusion hole entrance at the l/D = 0.3
position for the L/D = 3 effusion hole.
Figure 2-10. Local Nusselt numbers around the effusion hole entrance at the l/D = 0.6
position for the L/D = 6 effusion hole.
L/D = 3 r/D = 1 Re ≈ 8000 H/D = 3 l/D = 0.3
L/D = 6 r/D = 1 Re ≈ 8000 H/D = 3 l/D = 0.6
0°
90°
180°
270°
0°
90°
180°
270°
Page 29
18
Figure 2-11. Local Nusselt numbers along the upstream and downstream lengths of the
effusion holes contrasting two different impingement locations for L/D = 3, r/D = 1, and H/D
= 3.
2.6 Effect of Impingement Radial Spacing
To determine the sensitivity of the radial location of the impingement jets, the
impingement hole positioned at r/D = 3 was contrasted to that of r/D = 1 leaving the jet-to-target
spacing constant at H/D = 3 for both effusion hole lengths. In Figures 2-12 and 2-13, the area-
averaged Nusselt numbers for the increased radial position are compared to the close radial
position. Three angular θ locations, θ = 0°, 90°, and 180°, are shown in this section, as the θ =
90° and 270° impingement locations have similar results.
It is expected that for the varying radial spacing of the impingement jet in Figures 2-12
and 2-13, there is a substantial decrease in the heat transfer for the larger radial impingement
placement (r/D = 3) for both the θ = 0° and 90° cases relative to the close spacing, regardless of
Reynolds number. This decrease is seen for both L/D = 3 and L/D = 6. In contrast, for the θ =
180° impingement location, higher heat transfer occurs for the larger radial spacing (r/D = 3)
L/D = 3 r/D = 1 H/D = 3 Re ≈ 8000
l/D
0°
90°
180°
270°
Page 30
19
relative to the close spacing (r/D = 1) for both effusion hole lengths. This effect is due to a
separation region created by the farther radial spacing.
As shown in Figure 2-14, for the close radial spacing the upstream wall has an increased
Nusselt number along l/D < 1.5 when compared to the far radial spacing. However, at l/D ≥ 1.5,
the upstream wall heat transfer collapses onto the same line for both r/D impingement positions.
In addition, the downstream wall Nusselt number of the close radial spacing test is lower
throughout the entire length of the effusion hole, while the downstream wall of the far radial
spacing Nusselt number is on par with its respective upstream wall results past l/D=0. At the close
radial spacing for the θ = 180° case, the upstream and downstream wall results are indicative of a
direct impingement-like effect where the flow is attached to the upstream wall along the majority
of the effusion hole length, leading to the large difference in Nusselt number for both walls. For
the far radial impingement at θ = 180° the flow was more like a co-flowing crossflow as shown in
Kohli and Thole [7]. This crossflow initially had less cooling effectiveness at the entrance, but
since the flow was more like a fully-developed flow along the length of the hole rather than just
the upstream wall as in the r/D = 1 position, it had better cumulative heat transfer. This effect of
higher heat transfer at downstream l/D locations is also supported by the circumferential local
Nusselt numbers at l/D = 1.5 as seen in Figure 2-15. In Figure 2-15 for the close radial spacing,
the upstream wall has higher heat transfer that decreases by a significant amount along the
downstream wall. On the other hand, the far radial spacing at l/D = 1.5 has an almost constant
convection effect around the circumference of the effusion hole that is on par with the upstream
wall values seen in the r/D = 1 case.
The heat transfer augmentation of the r/D = 1 locations over the r/D = 3 locations is
displayed in Figure 2-16. Since the area-averaged Nusselt number augmentation is generally the
same between effusion hole lengths, as seen in the previous figures, Figure 2-16 was not
Page 31
20
replicated for the long effusion hole. For both the θ = 90° and 0° cases, the close radial spacing of
the impingement holes leads to roughly a 10% increase in area-averaged Nusselt number across
all Reynolds numbers when compared to the far radial spacing. The upstream impingement
location, θ = 0°, is not affected as much by the increase in radial spacing and there is, on average,
a 3% decrease in area-averaged Nusselt number between the r/D = 1 impingement site and the r/D
= 3 impingement site.
Figure 2-12. Area-averaged Nusselt number with changing r/D and θ for the L/D = 3
effusion hole.
0°
L/D = 3 H/D = 3
270°
180°
90°
0°
90°
180°
270°
Page 32
21
Figure 2-13. Area-averaged Nusselt number with changing r/D and θ for the L/D = 6
effusion hole.
Figure 2-14. Local Nusselt number along the upstream and downstream walls contrasting
two r/D values at θ = 180°.
l/D
L/D = 6 H/D = 3
L/D = 3 H/D = 3 Re ≈ 8000 θ = 180°
0°
270°
180°
90°
0°
90°
180°
270°
0°
180°
0°
90°
180°
270° 90° 270°
Page 33
22
Figure 2-15. Local Nusselt numbers around the effusion hole at the midpoint, l/D = 1.5,
position for the L/D = 3 effusion hole.
Figure 2-16. Average Nusselt number augmentation of the close radial spacing compared to
the far radial spacing for the L/D = 3 and H/D = 3 geometry.
L/D = 3 H/D = 3
L/D = 3 H/D = 3 l/D = 1.5 Re ≈ 8000
Nur D⁄ = 1
Nur D⁄ = 3
0°
90°
180°
270°
0°
270°
180°
90°
0°
180°
0°
90°
180°
270° 90° 270°
Page 34
23
2.7 Effect of Jet-to-Target Spacing
The impingement jet-to-target spacing was varied to determine the effects on the
sensitivity of the convective heat transfer. For these experiments, the closest radial spacing was
used at r/D = 1 for both short and long hole lengths. The data for the two hole lengths are shown
in Figures 2-17 and 2-18 to compare the area averaged Nusselt numbers for the close
impingement location, H/D = 3, to the far impingement location, H/D = 6.
The results in Figure 2-17 and 2-18 show that there is little sensitivity in the area
averaged Nusselt number when changing the jet-to-target distance except for the θ = 90° case,
which shows a higher convective heat transfer coefficient for the closer target spacing of H/D = 3
relative to H/D = 6. Given that all the results presented in this paper up to this point consistently
point to the turning of the impingement flow into the cooling hole having a large impact on the
effusion hole convection, it is expected that the data shown in Figures 2-17 and 2-18 is consistent.
By placing the impingement hole at θ = 90°, increases in convective heat transfer can be gained;
however, as the impingement jet is moved further from the effusion hole, this benefit decreases
resulting in lower convective heat transfer for the θ = 90° case with larger jet-to-target distance of
H/D = 6. In Figure 2-19, it is shown that there is little to no change in heat transfer augmentation
of the H/D = 3 location vs the H/D = 6 location for the θ = 0° and 180° angular impingement
positions, though the θ = 90° site had a 3.5% decrease on average when increasing the spacing.
Page 35
24
Figure 2-17. Total area-averaged Nusselt number with varying jet-to-target spacing for r/D
= 1 and L/D = 3.
Figure 2-18. Total area-averaged Nusselt number with varying jet-to-target spacing for r/D
= 1 and L/D = 6.
L/D = 3 r/D = 1
L/D = 6 r/D = 1
0°
90°
180°
270°
0°
90°
180°
270°
Page 36
25
Figure 2-19. Average Nusselt number augmentation of the close impingement jet-to-effusion
hole spacing compared to the large spacing for a radial spacing for the r/D = 1 and L/D = 3
geometry.
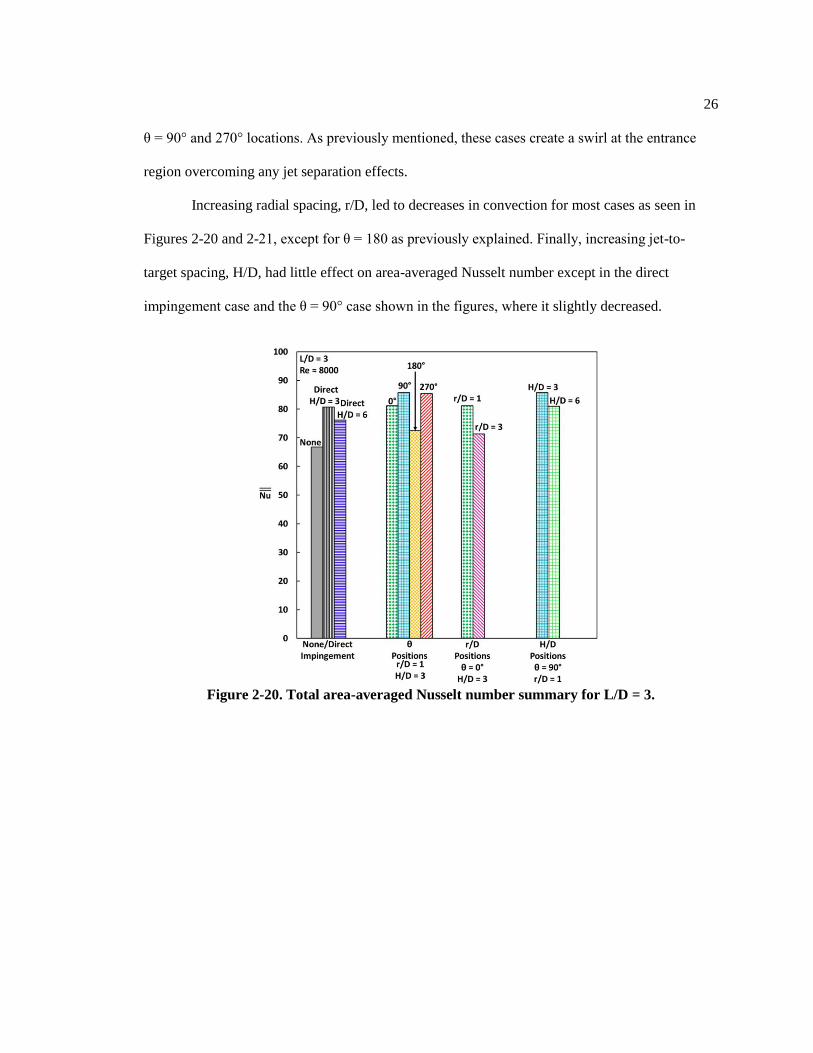
2.8 Summary
Overall, impingement positioning can have a large effect on the convective heat transfer
inside of effusion holes. Figures 2-20 and 2-21 show a complete summary of the effects
impingement position has on area-averaged Nusselt number as put forth in this study. The
effusion hole length did not strongly affect the trends seen between impingement cases although
the shorter L/D = 3 effusion hole had higher Nusselt numbers given the stronger influence of the
entrance region. For all the cases tested, Figures 2-20 and 2-21 show that higher convective heat
transfer within the effusion hole occurred when there was impingement relative to no
impingement case by 10%-30%.
The highest effusion hole heat transfer came from cases with close radial spacing, close
impingement jet-to-effusion plate distance when the impingement jet was positioned at either the
L/D = 3 r/D = 1
NuH D⁄ = 3
NuH D⁄ = 6
0°
90°
180°
270°
Page 37
26
θ = 90° and 270° locations. As previously mentioned, these cases create a swirl at the entrance
region overcoming any jet separation effects.
Increasing radial spacing, r/D, led to decreases in convection for most cases as seen in
Figures 2-20 and 2-21, except for θ = 180 as previously explained. Finally, increasing jet-to-
target spacing, H/D, had little effect on area-averaged Nusselt number except in the direct
impingement case and the θ = 90° case shown in the figures, where it slightly decreased.
Figure 2-20. Total area-averaged Nusselt number summary for L/D = 3.
Page 38
27
Figure 2-21. Total area-averaged Nusselt number summary for L/D = 6.
2.9 Conclusions
The cooling of combustor liners are typically done through the use of a double-wall
geometry containing both an impingement jet that supplies an effusion hole. These designs
heavily depend upon the convective nature of the effusion holes to contribute to the overall liner
cooling.
An experiment was designed and constructed to contain a scaled-up, double-wall
containing a single impingement jet feeding a single effusion hole to better understand the
convective the influences on the effusion hole. The impingement hole was varied in angular and
circumferential positions relative to the effusion hole for two different effusion hole lengths. In
addition, the impingement jet-to-effusion hole positioning was changed. A constant heat flux was
imposed on the effusion hole inner surface to evaluate the convective heat transfer at various
Reynolds numbers.
Page 39
28
All impingement cases were found to be much higher than the fully developed pipe flow
correlation as expected due to the short hole lengths and the entry region effects. The experiments
showed that impingement contributes to higher convective heat transfer by as much as 10%-30%
depending on impingement placement. At a close radial spacing and close jet-to-target spacing,
the highest convective heat transfer occurred for the jet impingement occurring at the sides of the
effusion hole. The increased augmentation seen for the side impingement locations was due to an
induced swirl seen in previous studies, which increases the heat transfer along the length of the
effusion hole and reduces the separation region at the hole entrance. This increase was seen in the
local Nusselt number measurements at the entrance and on the upstream and downstream walls
along the length of the hole.
The data presented that there was little effect on the convective heat transfer within the
effusion hole with differing impingement jet-to-effusion hole spacing. This particular result
enforces the finding that the dominating effect on the effusion hole convection has to do with how
the coolant enters into the effusion hole. Also, while the effusion hole lengths tested affected the
Nusselt number values, they did not have a large effect on the general trends between
impingement cases.
In summary, it was found that impingement location can have a large effect on the heat
transfer inside effusion cooling holes. This study adds to the body of knowledge for impingement
and effusion cooling in double-wall combustor liners. The results displayed can assist in
understanding and optimizing impingement hole placement for improved in-hole heat transfer,
which is an important parameter to cooling combustor liners.
Page 40
29
Chapter 3
Effects of Jet Impingement on Flow Discharge Coefficients for Combustor
Effusion Holes
3.1 Introduction
Advanced cooling techniques are required to ensure that modern combustor liners are
robust enough to survive the increased temperatures they are subjected to. A double-wall scheme
with effusion cooling and impingement is utilized in modern combustor liners. Impingement jets
are made to cool the bottom surface of the effusion wall, as well as feeding the effusion jets.
Effusion jets form a shielding film over the effusion wall surface. Understanding the discharge
coefficients in these cooling schemes is vital to creating an accurate liner design. Changes in
discharge coefficients can affect the amount of cooling flow and by extension the internal heat
transfer through the effusion holes which plays a large role in the overall cooling of the liner
walls. Impingement hole location can vary in most combustor liners due to constrictions in the
design or manufacturing variation. These changes in location can affect the discharge coefficient
of the effusion holes leading to changes in the internal convection of the effusion holes.
In the current literature, multiple studies have reported discharge coefficients, heat transfer, and
overall effectiveness data for effusion holes [3, 6, 9, 14]. There are not many studies that have
looked at discharge coefficients through effusion holes in relation to the impingement hole
location or its link to internal convection within effusion holes. The contribution made by this
paper is that experiments were conducted where discharge coefficients and internal heat transfer
coefficients of an effusion hole were measured for many different impingement hole setups.
Page 41
30
3.2 Literature Review
Many past studies have evaluated discharge coefficients in the field of gas turbines,
mainly analyzing discharge coefficients in film cooling holes without impingement. Hays and
Lampard [15] previously put together a broad review of the research in this area, breaking up the
studies based on geometries such as effusion hole angles [16-18] and flow conditions such as
internal [19-21] or external crossflow [22-23]. Most studies with a double wall impingement and
effusion setup focused on the heat transfer and cooling effectiveness or only evaluate the
discharge coefficient of the double-wall rather than the effusion discharge coefficient. Not much
of the current literature has looked at discharge coefficients through effusion holes when
impingement is present. Andrews et al. [24] studied the effects of Reynolds number on discharge
coefficients through effusion holes and also the effects of adding impingement. The effusion
holes used in their experiment ranged from an L/D of 2.4 to 10. Their results showed that past a
Reynolds number of 2000, the discharge coefficient was independent of Reynolds number. Their
data also revealed that impingement had little effect on the effusion discharge coefficient.
Wei-hau et al. [25] researched a double-wall impingement and effusion cooling scheme
that was curved, evaluating the effects of changing the effusion hole-to-hole spacing and the
effusion angle on the double-wall discharge coefficient. Yang found that decreasing the effusion
angle led to an increase in the double-wall discharge coefficient. Also, as the distance between
effusion holes was increased, the discharge coefficient decreased.
Zhang et al. [26] looked at the change in discharge coefficients for a double-wall
impingement and effusion setup for differing area ratios. The effusion and impingement holes
were arranged in a staggered format. Overall discharge coefficients were found to be similar for
all area ratios across the double wall. However, the discharge coefficients were different when
broken into their individual impingement and effusion discharge coefficients. At lower pressure
Page 42
31
parameters, the discharge coefficient of the impingement wall was lower than the effusion wall.
As the pressure parameter was increased, the impingement wall discharge coefficient increased
past the coefficient of the effusion wall.
In the previous studies, there has been little work in analyzing the discharge coefficients
of an effusion hole based on the placement of the impingement hole feeding it or its relation to
the internal heat transfer in the effusion hole. This study looks to add to this body of research by
presenting data on the discharge coefficients through single effusion holes as the impingement
hole position is changed. The heat transfer results shown in this paper are from a previous paper
by Huelsmann and Thole [27] analyzing the internal convective heat transfer of the effusion hole
using the exact same experimental setup. These results will be used to try and relate the
discharge coefficients from this research to some of the heat transfer effects that were seen in the
previous study.
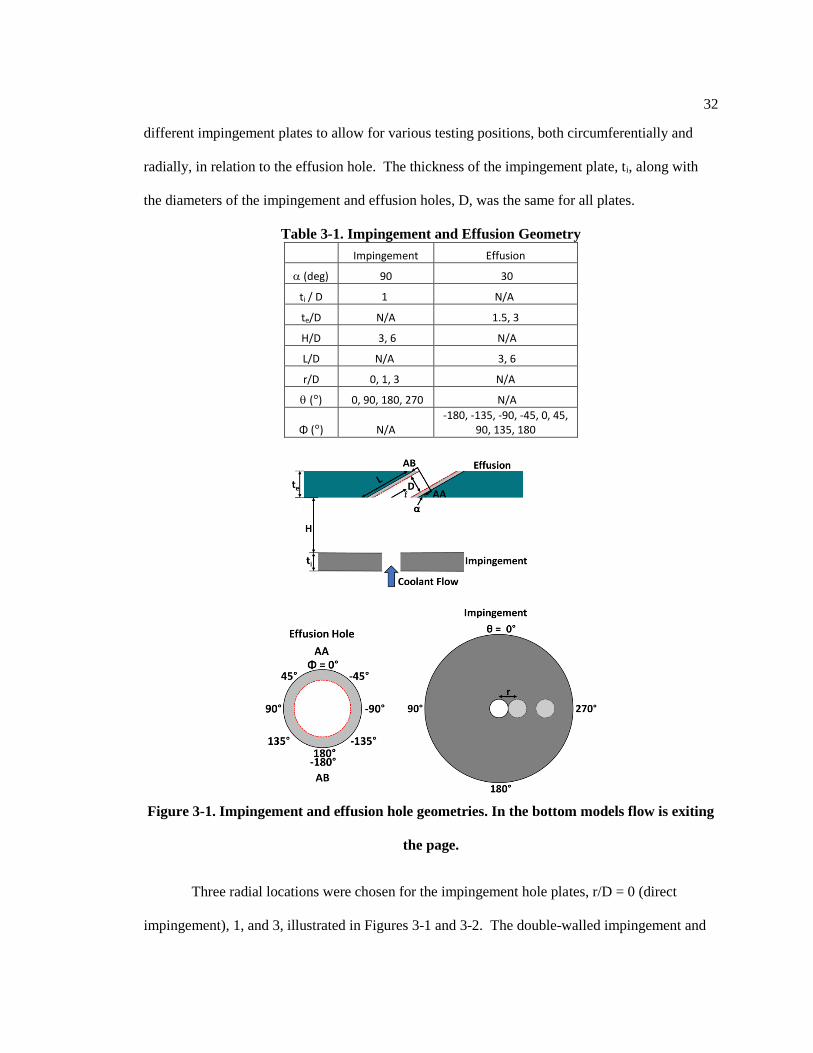
3.3 Impingement and Effusion Geometries
Table 3-1 and Figure 3-1 detail the geometry of the scaled-up double-wall combustor
liner built for the experiments. An exit flow was not simulated for the effusion hole since, as
shown by Cho and Goldstein [11], it does not have noticeable effects on the internal heat transfer.
However exit flow would have an effect on the discharge coefficients for turbine cooling
applications, but the focus of the research was on the entrance effects due to changing
impingement location on discharge coefficients and as such no exit crossflow was tested.
The effusion hole and impingement hole diameters, D, were equal for all tests (D = 2.54
cm) as seen in Figure 3-1. Additive manufacturing was used to create the effusion hole out of a
low thermal conductivity plastic. This additive effusion hole (pipe) had slots allowing for
specific thermocouple placement along the entire pipe length. A single hole was drilled into three
Page 43
32
different impingement plates to allow for various testing positions, both circumferentially and
radially, in relation to the effusion hole. The thickness of the impingement plate, ti, along with
the diameters of the impingement and effusion holes, D, was the same for all plates.
Table 3-1. Impingement and Effusion Geometry
Impingement Effusion
(deg) 90 30
ti / D 1 N/A
te/D N/A 1.5, 3
H/D 3, 6 N/A
L/D N/A 3, 6
r/D 0, 1, 3 N/A
(°) 0, 90, 180, 270 N/A
Φ (°) N/A -180, -135, -90, -45, 0, 45,
90, 135, 180
Figure 3-1. Impingement and effusion hole geometries. In the bottom models flow is exiting
the page.
Three radial locations were chosen for the impingement hole plates, r/D = 0 (direct
impingement), 1, and 3, illustrated in Figures 3-1 and 3-2. The double-walled impingement and
Page 44
33
effusion arrangements were made by swapping out the impingement plate and by rotating the
circumferential position of the impingement plates by 90° intervals. Figure 3-1 shows the two
jet-to-target spacing values, H/D = 3 and 6, that were selected for testing. 19 geometry
combinations were tested in these experiments. However, the discharge coefficient data is not
displayed for the 90° and 270° impingement positions in the results of this paper.
Figure 3-2. Effusion and impingement geometries studied.
3.4 Experimental Setup and Methods
To perform the discharge coefficient experiments, a sealed experimental rig with the
large-scale impingement plates and effusion hole was created as shown in Figure 3-3. A large
pipe had two endcaps placed over each side of the pipe and the impingement plate was mounted
inside. The diameter of the test rig was eight effusion hole diameters so that sidewall effects
could be avoided during testing. The endcap downstream of the impingement plate included the
effusion hole and a foam insulation block around the effusion hole to reduce any heat loss.
Page 45
34
Upstream of the impingement plate, the endcap had a splash plate and nozzle to diffuse the air
and allow the air to enter the rig respectively. A mass flow controller was used to control the air
flow through the rig.
Figure 3-3. Experimental rig with impingement plates and the additively manufactured
effusion hole.
The mass flow rate of the air was set to match a chosen Reynolds number through the
effusion hole. The calculation for the Reynolds number is shown in Equation 3-1. The Reynolds
numbers for the experiments ranged from 2,000 to 11,000. 3 pressure taps were placed 2.29 cm
upstream of the effusion hole entrance in the test rig sidewall to measure the static pressure at the
inlet in different locations. 3 different measurements were taken to ensure the pressure
measurement was not affected by the measurement location along the sidewall. For all tests, this
static pressure was borderline identical regardless of which pressure tap was chosen. This static
pressure was measured with a differential pressure transducer with respect to the atmospheric
pressure at the outlet of the effusion hole. The aforementioned atmospheric pressure was
measured with a separate pressure transducer. This static pressure measurement was used to
Page 46
35
calculate the discharge coefficient, Cd, as shown in Equation 3-2. Utilizing both the differential
pressure measurement across the effusion hole and the atmospheric pressure measurement, a
pressure ratio was also calculated across the effusion hole. Pressure ratio ranged from 1 to
1.00007. This pressure ratio is very low due to the large scale of the effusion hole used for
testing.
Re =m
D(π
4)μ
(3- 1)
Cd =m
π(D2
4)√2ρ∆P
(3- 2)
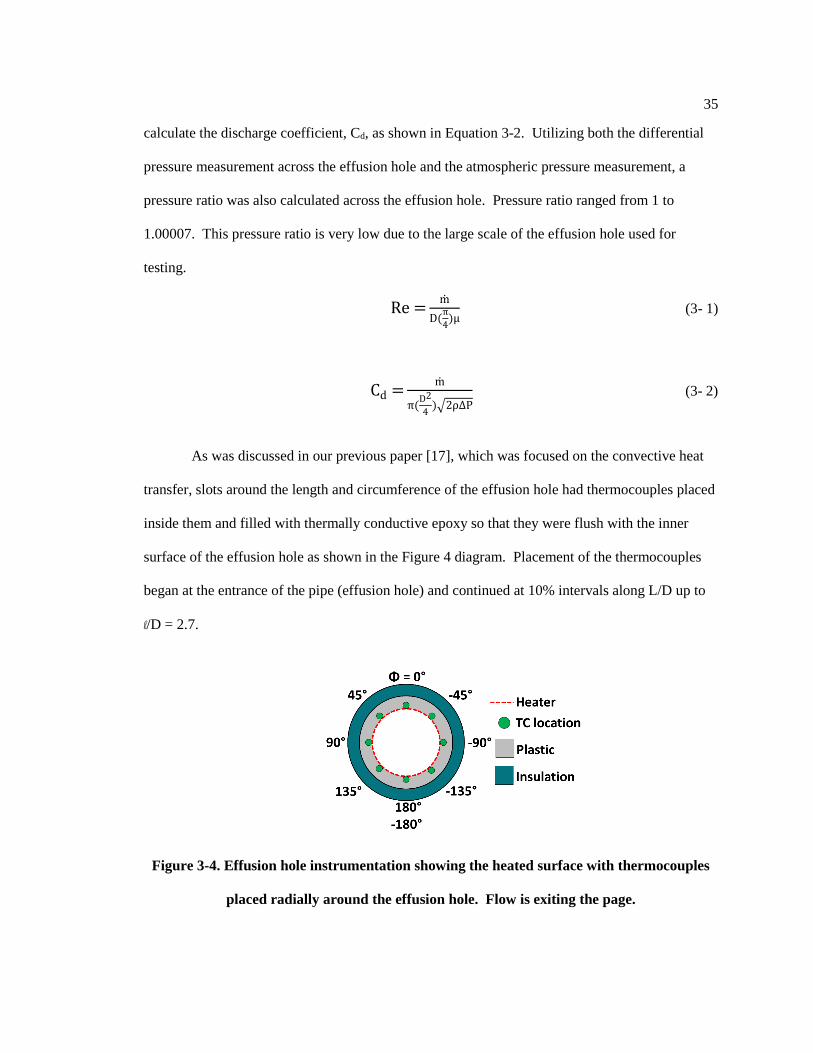
As was discussed in our previous paper [17], which was focused on the convective heat
transfer, slots around the length and circumference of the effusion hole had thermocouples placed
inside them and filled with thermally conductive epoxy so that they were flush with the inner
surface of the effusion hole as shown in the Figure 4 diagram. Placement of the thermocouples
began at the entrance of the pipe (effusion hole) and continued at 10% intervals along L/D up to
l/D = 2.7.
Figure 3-4. Effusion hole instrumentation showing the heated surface with thermocouples
placed radially around the effusion hole. Flow is exiting the page.
Page 47
36
A heater was made to impose a constant heat flux boundary condition on the inner pipe
walls of the effusion hole which is discussed in [27]. The heater was then adhered to the inner
surface of the pipe where it made contact with the aforementioned thermocouples. All tests input
a constant power into to the heater. Entrance flow temperature was also measured for the
effusion hole.
After steady state was reached, which usually took around 3 hours, the heater power and
surface temperatures were measured along with the static pressure. Thermocouples embedded
into the foam insulation block were utilized to account for the heat loss by performing a
conduction analysis. For all tests the conductive heat losses were within 2%-4%. Local heat
transfer coefficients, h, were calculated after the heat loss was subtracted from the input power.
A more detailed explanation of the local heat transfer measurements can be found in our previous
paper [27]. These local measurements were used in an area-weighted equation to find the area-
averaged heat transfer coefficient, h, presented in Equation 3-3 below. Since this paper focuses
on discharge coefficients and their relation to the overall internal heat transfer, only the area-
averaged heat transfer coefficient will be shown in the results. The majority of the results will
show how the discharge coefficients were affected by the impingement hole location.
h =∑ h∙A
Atotal (3- 3)
Experimental Uncertainty
The methods laid out in Kline and McClintock [12] were used to calculate the uncertainty
in the experiments. Uncertainty of the discharge coefficients was found to be around 8% for all
cases. The majority of this uncertainty comes from the accuracy of the mass flow controller.
Local Nusselt number uncertainty was between 3%-7%. This uncertainty increased with
increasing Reynolds number and decreased for the longer effusion hole. The uncertainty increase
for the increasing Reynolds numbers is attributed to a decrease in temperature difference between
Page 48
37
the cooling flow temperature and the temperature of the effusion hole surface. For the averaged
Nusselt numbers, uncertainty was under 1% for all tests. Uncertainty for the averaged Nusselt
numbers was found to be under 1% for all cases. Lastly, it was calculated that there was less than
1% uncertainty in the Reynolds number for all cases.
3.5 Effect of Angular Impingement Location
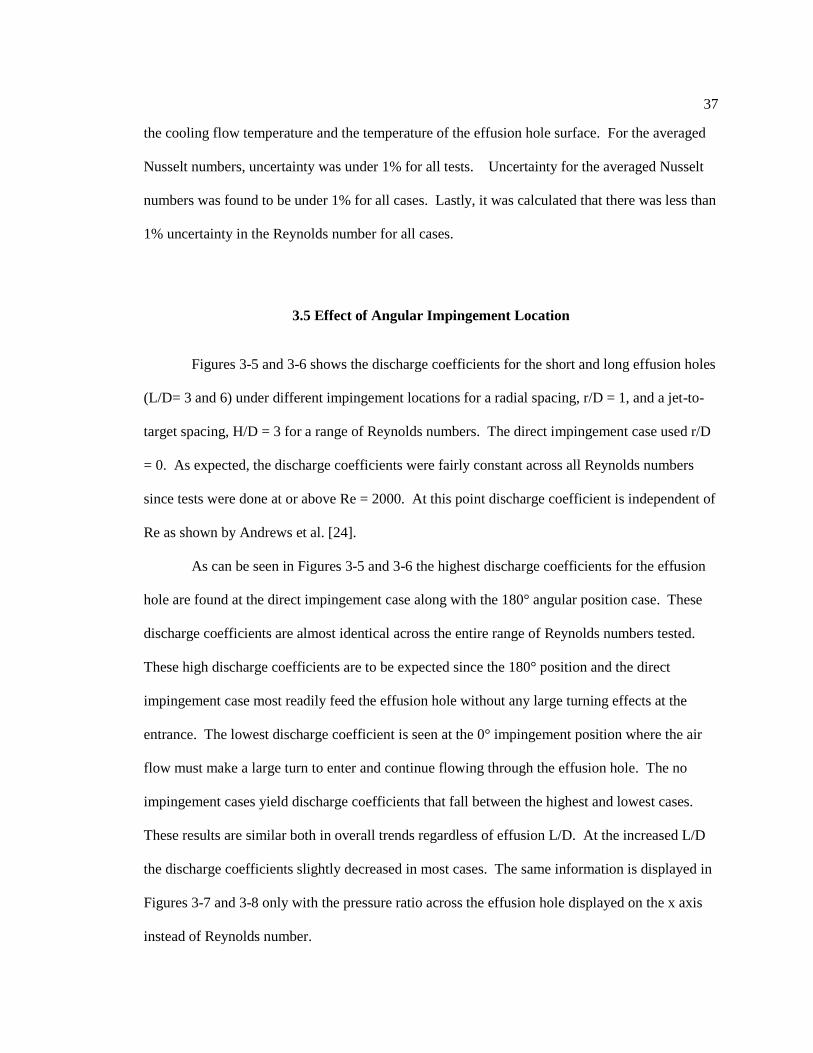
Figures 3-5 and 3-6 shows the discharge coefficients for the short and long effusion holes
(L/D= 3 and 6) under different impingement locations for a radial spacing, r/D = 1, and a jet-to-
target spacing, H/D = 3 for a range of Reynolds numbers. The direct impingement case used r/D
= 0. As expected, the discharge coefficients were fairly constant across all Reynolds numbers
since tests were done at or above Re = 2000. At this point discharge coefficient is independent of
Re as shown by Andrews et al. [24].
As can be seen in Figures 3-5 and 3-6 the highest discharge coefficients for the effusion
hole are found at the direct impingement case along with the 180° angular position case. These
discharge coefficients are almost identical across the entire range of Reynolds numbers tested.
These high discharge coefficients are to be expected since the 180° position and the direct
impingement case most readily feed the effusion hole without any large turning effects at the
entrance. The lowest discharge coefficient is seen at the 0° impingement position where the air
flow must make a large turn to enter and continue flowing through the effusion hole. The no
impingement cases yield discharge coefficients that fall between the highest and lowest cases.
These results are similar both in overall trends regardless of effusion L/D. At the increased L/D
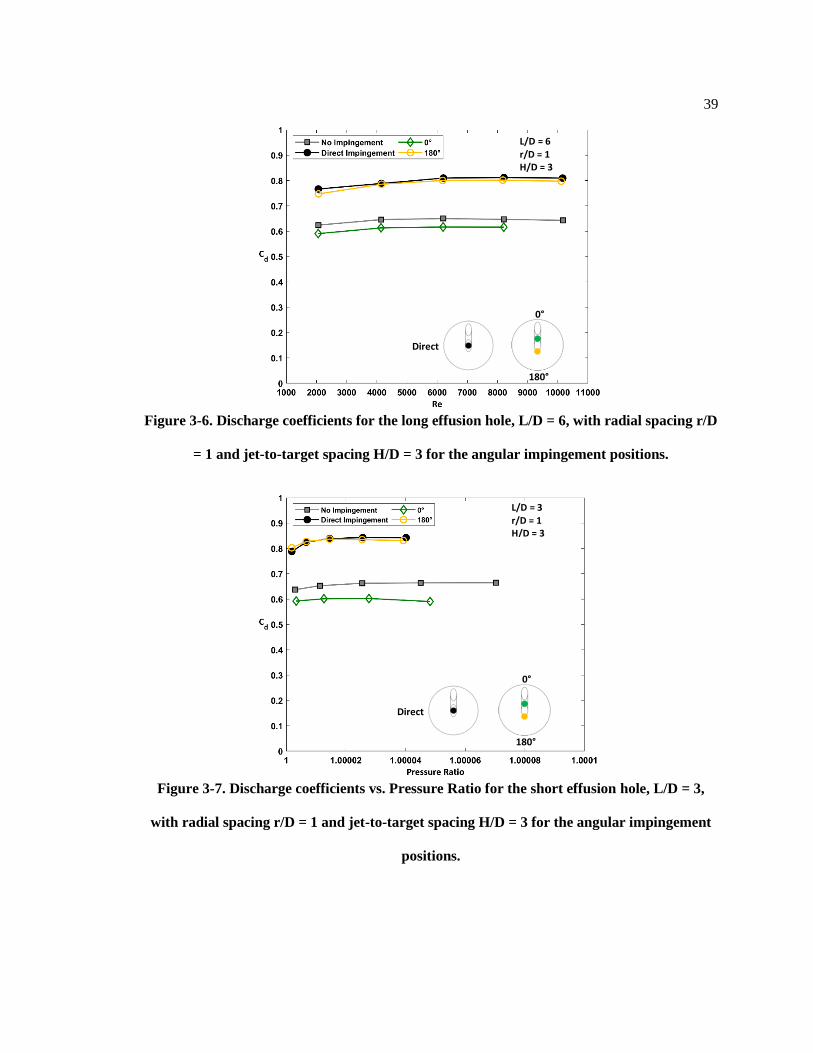
the discharge coefficients slightly decreased in most cases. The same information is displayed in
Figures 3-7 and 3-8 only with the pressure ratio across the effusion hole displayed on the x axis
instead of Reynolds number.
Page 49
38
It was originally thought that discharge coefficient could be linked to the internal heat
transfer through the effusion hole. As shown in Figures 3-9 and 3-10, which show the area-
averaged Nusselt number for the same cases seen in Figures 3-5 and 3-6 along with the 90° and
270° impingement data, the highest heat transfer is attained with an angular position of either 90°
or 270°. Figures 3-9 and 3-10 also include Nusselt number calculations from Gnielinski [13].
The increase in heat transfer for the side injection positions is due to an induced swirl similar to
an effect found in Kohli and Thole’s research [7]. This induced swirl effect along with local heat
transfer measurements from these tests is further expanded upon in our previous paper [27]. For
the 0° case, the initial turn into the effusion hole causes the drop in discharge coefficient when
compared to the side injection locations. Since this turn does not lead to any swirl within the
effusion hole, it does not have as large of an effect on the internal heat transfer through the
effusion hole even though the discharge coefficient of the effusion hole is lower. Overall,
impingement had a minor effect on the discharge coefficient except in the cases of the 180°
impingement location or the direct impingement case.
Figure 3-5. Discharge coefficients for the short effusion hole, L/D = 3, with radial spacing
r/D = 1 and jet-to-target spacing H/D = 3 for the angular impingement positions.
L/D = 3 r/D = 1 H/D = 3
Direct
0°
180°
Page 50
39
Figure 3-6. Discharge coefficients for the long effusion hole, L/D = 6, with radial spacing r/D
= 1 and jet-to-target spacing H/D = 3 for the angular impingement positions.
Figure 3-7. Discharge coefficients vs. Pressure Ratio for the short effusion hole, L/D = 3,
with radial spacing r/D = 1 and jet-to-target spacing H/D = 3 for the angular impingement
positions.
Direct
L/D = 6 r/D = 1 H/D = 3
0°
180°
Direct
L/D = 3 r/D = 1 H/D = 3
0°
180°
Page 51
40
Figure 3-8. Discharge coefficients vs. Pressure Ratio for the long effusion hole, L/D = 6, with
radial spacing r/D = 1 and jet-to-target spacing H/D = 3 for the angular impingement
positions.
Figure 3-9. Area-averaged Nusselt number for the short effusion hole, L/D = 3, with
constant radial spacing, r/D = 1, and constant jet-to-target spacing, H/D = 3.
L/D = 3 r/D = 1 H/D = 3
Direct
0°
90°
180°
270°
Direct
L/D = 6 r/D = 1 H/D = 3
0°
180°
Page 52
41
Figure 3-10. Area-averaged Nusselt number for the long effusion hole, L/D = 6, with
constant radial and jet-to-target spacing.
3.6 Effect of Impingement Radial Spacing
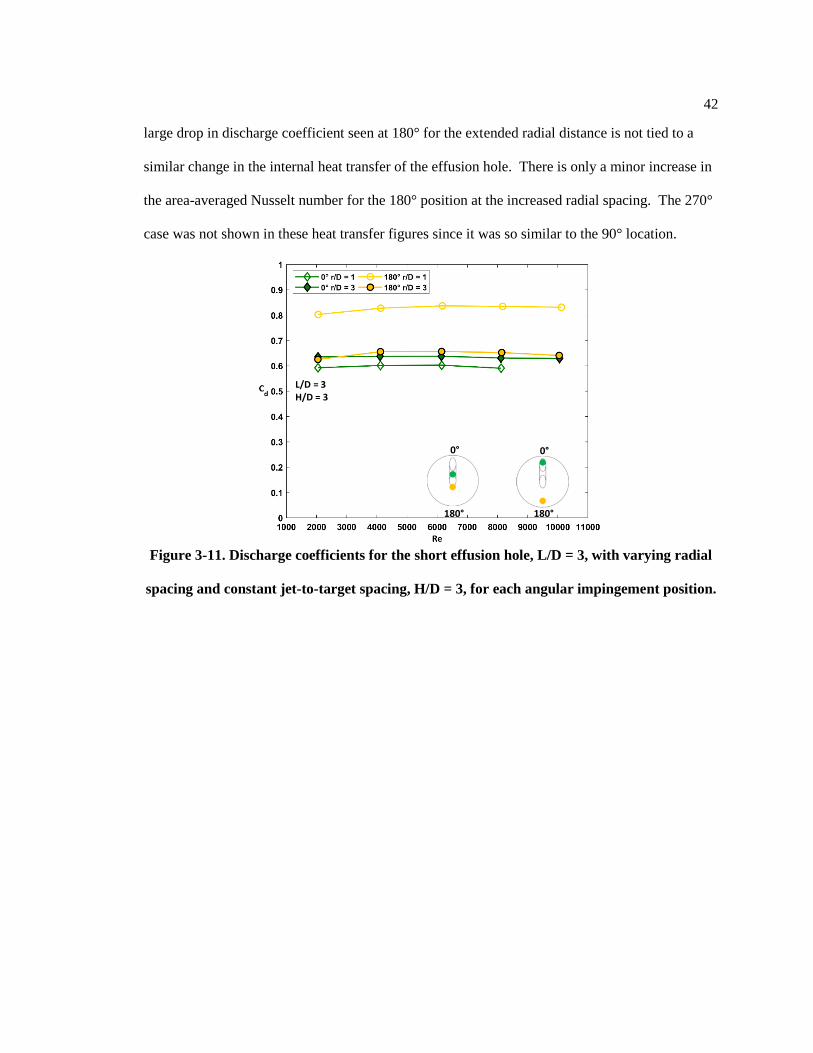
The effect of radial spacing on the discharge coefficient is shown in Figures 3-11 and 3-
12. These figures show the discharge coefficients across a range of Reynolds numbers for all
angular impingement positions for both an r/D = 1 and an r/D = 3. Both effusion hole lengths are
also shown. The jet-to-target spacing was kept constant at H/D = 3. Once again effusion length
has little effect on the discharge coefficients, only leading to minor decreases for most cases at
the longer length. At 0° there is no large change is discharge coefficient regardless of r/D.
However, at 180° the increase in radial spacing to r/D = 3 leads to a large drop in discharge
coefficient. This is the case for both effusion lengths. At an r/D = 3 there is very little difference
in discharge coefficient regardless of angular position since all impingement setups must first
impinge on the effusion wall before entering the effusion hole. Figures 3-13 and 3-14 show the
area-averaged Nusselt number for the same cases as Figures 3-11 and 3-12. Interestingly, the
L/D = 6 r/D = 1 H/D = 3
Direct
0°
90°
180°
270°
Page 53
42
large drop in discharge coefficient seen at 180° for the extended radial distance is not tied to a
similar change in the internal heat transfer of the effusion hole. There is only a minor increase in
the area-averaged Nusselt number for the 180° position at the increased radial spacing. The 270°
case was not shown in these heat transfer figures since it was so similar to the 90° location.
Figure 3-11. Discharge coefficients for the short effusion hole, L/D = 3, with varying radial
spacing and constant jet-to-target spacing, H/D = 3, for each angular impingement position.
L/D = 3 H/D = 3
0°
180°
0°
180°
Page 54
43
Figure 3-12. Discharge coefficients for the long effusion hole, L/D = 6, with varying radial
spacing and constant jet-to-target spacing, H/D = 3, for each angular impingement position.
Figure 3-13. Area-averaged Nusselt number for the short effusion hole, L/D = 3, with
varying radial spacing and constant jet-to-target spacing, H/D = 3.
L/D = 3 H/D = 3
0°
270°
180°
90°
0°
90°
180°
270°
L/D = 6 H/D = 3
0°
180°
0°
180°
Page 55
44
Figure 3-14. Area-averaged Nusselt number for the long effusion hole, L/D = 6, with varying
radial spacing and constant jet-to-target spacing, H/D = 3.
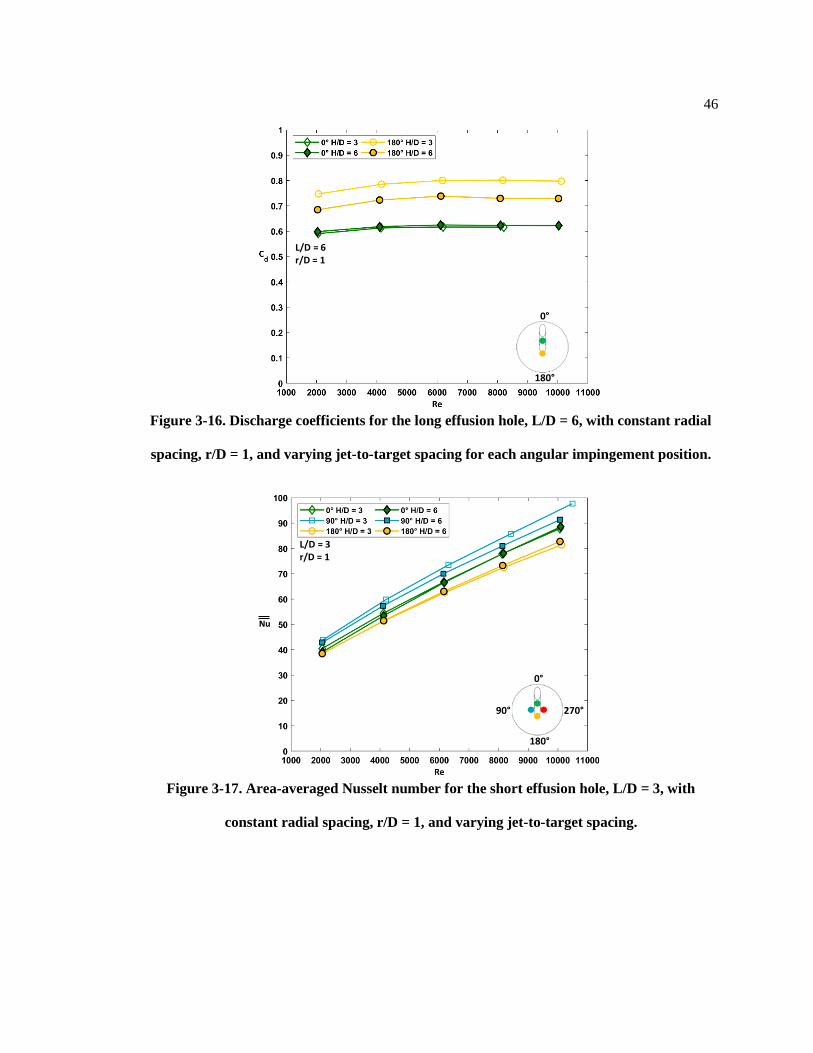
3.7 Effect of Jet-to-Target Spacing
The results of increasing the jet-to-target spacing from H/D = 3 to H/D = 6 is
shown in Figures 3-15 and 3-16, which show the discharge coefficient for a range of Reynolds
numbers at the close radial spacing, r/D = 1, for both the short and long effusion hole at the
varying angular impingement locations. Both H/D = 3 and H/D = 6 are shown in the results.
There is no discernible change in discharge coefficient for the 0° location across either jet-to-
target spacing. This matches with results seen in Andrews et al. [24] where no change in
discharge coefficient was seen unless jet-to-target spacing was reduced to 1. However, as seen
previously with the increased radial spacing, when impingement is at the 180° position the
discharge coefficient decreases with increasing H/D. Also, as seen in previous results, the length
of the effusion hole did not strongly affect the final results. Figures 3-17 and 3-18 follow the
format of Figures 3-15 and 3-16 except the area-averaged Nusselt number is evaluated. The
L/D = 6 H/D = 3
0°
270°
180°
90°
0°
90°
180°
270°
Page 56
45
lowest Nusselt number was seen at the 180° impingement position regardless of L/D or H/D
which was to be expected since the highest discharge coefficient was seen at that location. For
the 0° location, the discharge coefficient was constant regardless of L/D which matches what was
seen in the Nusselt number plots.
Figure 3-15. Discharge coefficients for the short effusion hole, L/D = 3, with constant radial
spacing, r/D = 1, and varying jet-to-target spacing for each angular impingement position.
L/D = 3 r/D = 1
0°
180°
Page 57
46
Figure 3-16. Discharge coefficients for the long effusion hole, L/D = 6, with constant radial
spacing, r/D = 1, and varying jet-to-target spacing for each angular impingement position.
Figure 3-17. Area-averaged Nusselt number for the short effusion hole, L/D = 3, with
constant radial spacing, r/D = 1, and varying jet-to-target spacing.
L/D = 3 r/D = 1
0°
90°
180°
270°
L/D = 6 r/D = 1
0°
180°
Page 58
47
Figure 3-18. Area-averaged Nusselt number for the long effusion hole, L/D = 6, with
constant radial spacing, r/D = 1, and varying jet-to-target spacing.
3.8 Summary
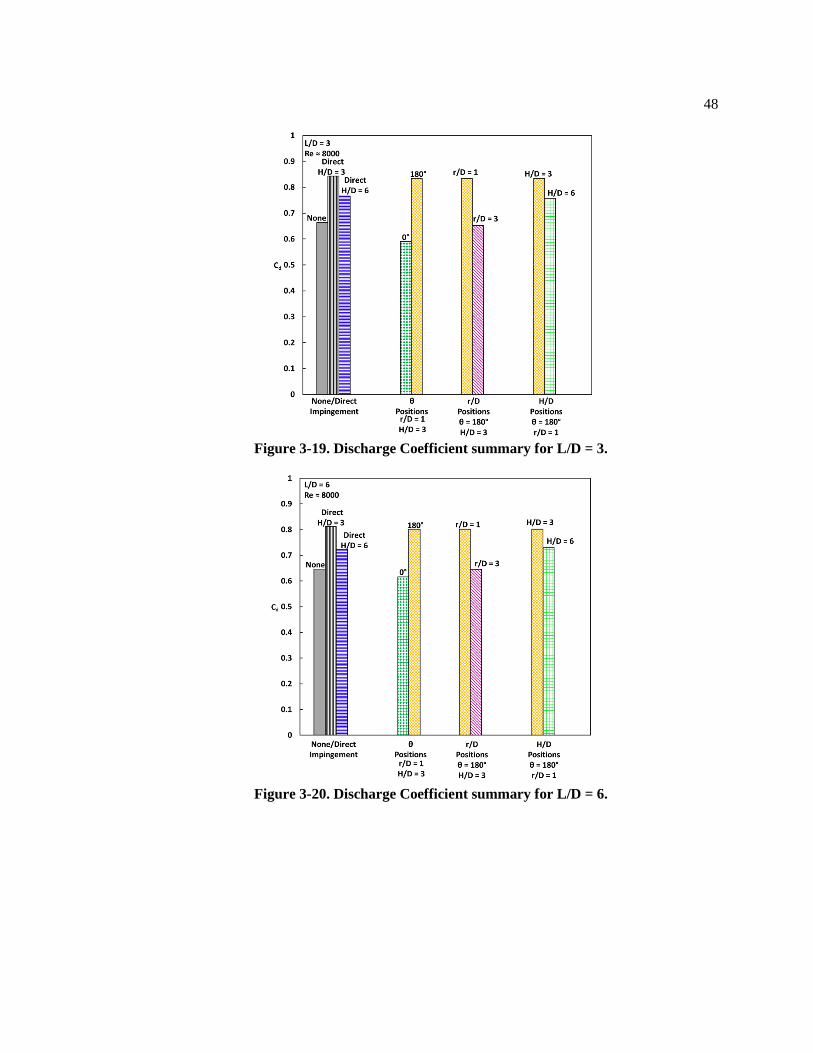
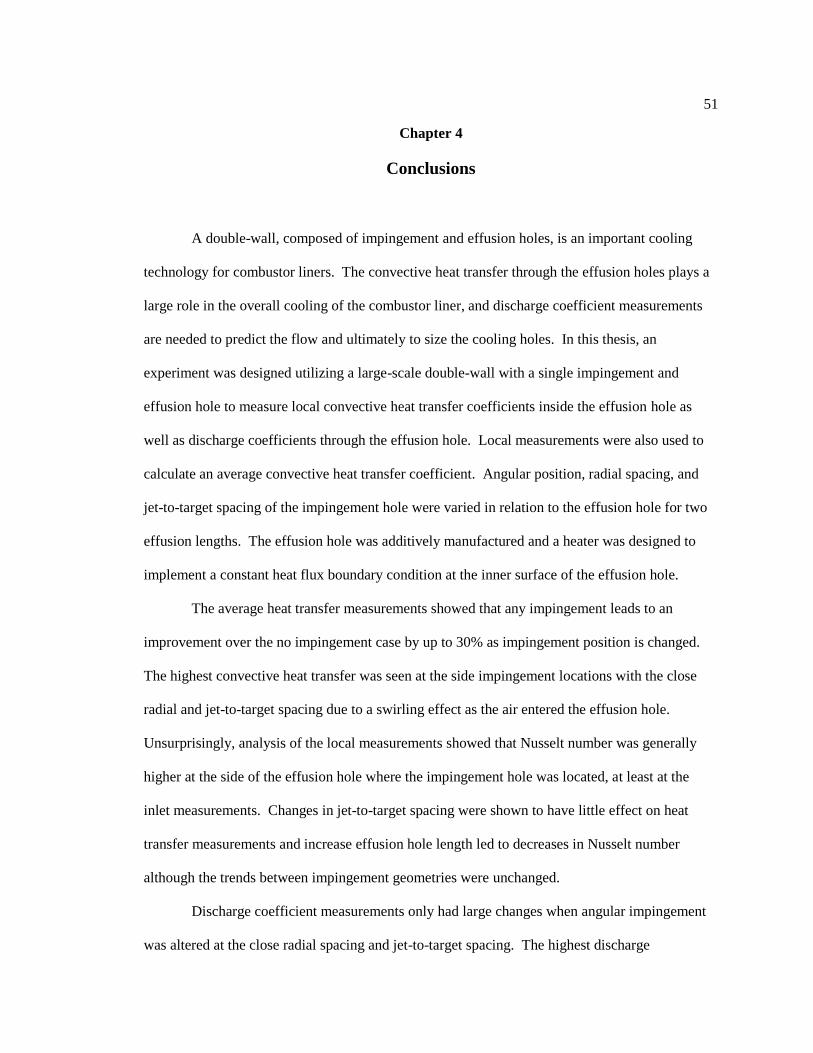
Figures 3-19 and 3-20 show a summary of all the major impingement changes and their
effects on the discharge coefficient for both the short and long effusion hole. These figures
display the discharge coefficients at a Reynolds number of 8000. Overall, changing impingement
locations can lead to large changes in discharge coefficients in certain situations, mainly changes
in the angular θ positions as shown in the figures. For the most part, changing the radial spacing
or the jet-to-target spacing led to very minor changes in discharge coefficient except at specific
impingement locations like 180° as discussed earlier in the paper or the direct impingement case
as seen in Figures 3-19 and 3-20. Increasing the effusion hole length led to a slight decrease in
discharge coefficient for most cases.
L/D = 6 r/D = 1
0°
90°
180°
270°
Page 59
48
Figure 3-19. Discharge Coefficient summary for L/D = 3.
Figure 3-20. Discharge Coefficient summary for L/D = 6.
Page 60
49
3.9 Conclusions
A double-wall design is typically used to cool combustor liners with an impinging jet
feeding an effusion hole. An understanding of the discharge coefficients within the effusion
holes is necessary to properly design the liner to supply the amount of coolant needed. A large
scale double-wall design with a single impingement and effusion hole was built to understand
how the discharge coefficient through the effusion hole changes as the impingement hole position
is altered. The discharge coefficients link to internal convective heat transfer in the effusion hole
was also explored.
The impingement hole angular position or impingement type did lead to changes in the
discharge coefficient at the close radial spacing and close jet-to-target spacing. The experiments
showed that the 180° location and direct impingement position had the highest discharge
coefficient, above 0.8. The lowest discharge coefficient was seen at the 0° position with a value
around 0.6. The no impingement case, 90°, and 270° had discharge coefficients between 0.6 and
0.7. The increase in heat transfer for the 90° and 270° cases can be linked to a swirl appearing
inside the effusion hole. The 0° position does have a lower discharge coefficient but it was
thought that this does not correlate to increased heat transfer because the bulk of the increased
discharge coefficient comes from the initial turn into the effusion hole rather than any flow
effects inside the hole.
Experiments revealed that radial spacing had very little effect on the discharge
coefficients through the effusion hole except at 180°. The data also showed that jet-to-target
spacing had a minimal effect on discharge coefficients except at the 180° or direct impingement
location which decreased with increasing H/D. Effusion hole length only had a noticeable effect
on discharge coefficient at the close radial spacing with the close jet-to-target spacing and
discharge coefficient decreased slightly in all cases for the higher L/D.
Page 61
50
To summarize, the angular impingement location led to the changes in discharge
coefficient especially at the 180° position or the direct impingement position. Effusion length
had minor effects on discharge coefficient. Radial spacing and jet-to-target spacing only had an
effect when the impingement hole was at the 180° location. This study adds to the current
research for impingement and effusion double-wall combustor liner cooling.
Page 62
51
Chapter 4
Conclusions
A double-wall, composed of impingement and effusion holes, is an important cooling
technology for combustor liners. The convective heat transfer through the effusion holes plays a
large role in the overall cooling of the combustor liner, and discharge coefficient measurements
are needed to predict the flow and ultimately to size the cooling holes. In this thesis, an
experiment was designed utilizing a large-scale double-wall with a single impingement and
effusion hole to measure local convective heat transfer coefficients inside the effusion hole as
well as discharge coefficients through the effusion hole. Local measurements were also used to
calculate an average convective heat transfer coefficient. Angular position, radial spacing, and
jet-to-target spacing of the impingement hole were varied in relation to the effusion hole for two
effusion lengths. The effusion hole was additively manufactured and a heater was designed to
implement a constant heat flux boundary condition at the inner surface of the effusion hole.
The average heat transfer measurements showed that any impingement leads to an
improvement over the no impingement case by up to 30% as impingement position is changed.
The highest convective heat transfer was seen at the side impingement locations with the close
radial and jet-to-target spacing due to a swirling effect as the air entered the effusion hole.
Unsurprisingly, analysis of the local measurements showed that Nusselt number was generally
higher at the side of the effusion hole where the impingement hole was located, at least at the
inlet measurements. Changes in jet-to-target spacing were shown to have little effect on heat
transfer measurements and increase effusion hole length led to decreases in Nusselt number
although the trends between impingement geometries were unchanged.
Discharge coefficient measurements only had large changes when angular impingement
was altered at the close radial spacing and jet-to-target spacing. The highest discharge
Page 63
52
coefficients were above 0.8, seen at the 180° position and the direct impingement position. The
lowest was attained at the 0° location, just below 0.6. The decreased discharge coefficient at the
0° locations is most likely linked to the large turn that the airflow must undergo to enter the
effusion hole. No strong link between effusion hole convective heat transfer and the discharge
coefficients was seen in the results. Overall, the results seen in this study could be used by
designers to aid in the optimization of their impingement hole placement for double-wall
combustor liner designs.
4.1 Recommendations for Future Work
The results displayed in this study could be expanded in multiple ways. Currently, the
local heat transfer measurements are only measured around the entire circumference of the
effusion hole in three locations. Increasing the number of measurement locations could better
capture the swirl effect described earlier in the study. A study focusing impingement hole
placement at 45° intervals rather than 90° could help designers further understand sensitivity of
impingement hole placement on effusion hole convective heat transfer. A study with multiple
impingement and effusion holes is also recommended to more accurately mimic the double-wall
design. Finally, measuring discharge coefficients for the above studies would also be of interest.
Page 64
53
References
[1] Shrager, A. C., Thole, K. A., and Mongillo D., 2019, “Effects of Effusion Cooling Pattern
Near the Dilution Hole for a Double-Walled Combustor Liner—Part 1: Overall
Effectiveness Measurements,” J. Eng. Gas Turbines Power, 141(1), p. 011022.
[2] Scrittore, J. J., Thole, K. A., and Burd, S. W., 2005, “Experimental Characterization of
Film-Cooling Effectiveness Near Combustor Dilution Holes,” GT2005-68704.
[3] Scrittore, J. J., Thole, K. A., and Burd, S. W., 2007, “Investigation of Velocity Profiles for
Effusion Cooling of a Combustor Liner,” J. Turbomach., 129(3), pp. 518-526.
[4] Shrager, A. C., Thole, K. A., and Mongillo D., 2019, “Effects of Effusion Cooling Pattern
Near the Dilution Hole for a Double-Walled Combustor Liner—Part II: Flowfield
Measurements,” J. Eng. Gas Turbines Power, 141(1), p. 011023.
[5] Boelter, L. M. K., Young, G., and Iverson, H. W., 1948, “An Investigation of Aircraft
Heaters XXVII – Distribution of Heat-Transfer Rate in the Entrance Section of a Circular
Tube,” NACA Tecn. Note No. 1451.
[6] Cho, H. H., Jabbari, M. Y., and Goldstein, R. J., 1997, “Experimental Mass (Heat)
Transfer in and Near a Circular Hole in a Flat Plate,” Int. J. Heat Mass Transfer., 140(10),
pp. 2431-2443.
[7] Kohli, A., and Thole, K. A., 1997, "A CFD Investigation on the Effect of Entrance Flow
Conditions in Discrete Film Cooling Holes," 32nd National Heat Transfer Conference,
vol. 12, pp. 223-232.
[8] Martiny, M., Schulz, A., and Wittig, S., 1997, “Mathematical Model Describing the
Coupled Heat Transfer in Effusion Cooled Combustor Walls,” 97-GT-329.
[9] Terrell, E. J., Mouzon, B. D., and Bogard, D. G., 2005, “Convective Heat Transfer
Through Film Cooling Holes of a Gas Turbine Blade Leading Edge,” GT2005-69003.
Page 65
54
[10] Bryant, E. C., and Rutledge, J. L., 2019, “A Computational Technique to Evaluate the
Relative Influence of Internal and External Cooling on Overall Effectiveness,” GT2019-
90999.
[11] Cho, H. H., and Goldstein, R. J., 1995, “Heat (Mass) Transfer and Film Cooling
Effectiveness With Injection Through Discrete Holes: Part I—Within Holes and on the
Back Surface,” J. Turbomach., 117(3), pp. 440-450.
[12] Kline, S. J., and McClintock, F. A., 1953, “Describing the Uncertainties in Single Sample
Experiments,” Mech. Eng., 75(1953), pp. 3–8.
[13] V. Gnielinski, 1976, “New Equations for Heat and Mass Transfer in Turbulent Pipe and
Channel Flow,” Int. Chem. Eng., 16(2), pp. 359-368.
[14] Hay, N., Henshall S. E., and Manning, A., 1994, “Discharge Coefficients of Holes
Angled to the Flow Direction,” J. Turbomach., 116(1), pp. 92-96.
[15] Hay, N., and Lampard, D., 1998, “Discharge Coefficient of Turbine Cooling Holes: A
Review,” J. Turbomach., 120(2), pp. 314-319.
[16] Hay, N., Lampard, D., and Benmansour, S., 1983, "Effect of Crossflows on the Discharge
Coefficient of Film Cooling Holes," J. Eng. Power., 105(2), pp. 243-248.
[17] Tillman, E. S., Hartel, E. O., and Jen, J. F., 1985, "The Prediction of Flow Through
Leading Edge Holes in a Film Cooled Airfoil With and Without Inserts,'' J. Eng. Gas Turbines
Power., 107, pp. 92-98.
[18] Tillman, E. S., and Jen, H. F., 1984, "Cooling Airfoil Studies at the Leading Edge of a
Film Cooled Airfoil," J. Eng. Gas Turbines Power., 106, pp. 106-221.
[19] Rhode, J., Richard, R., and Metger, G. W., 1969, "Discharge Coefficients for Thick Plate
Orifices With Approach Flow Perpendicular and Inclined to Orifice Axis," NASA TND-5467.
[20] Meyfarth, P. F., and Shine, A. J., 1965, "Experimental Study of Flow Through Moving
Orifices," J. Basic Eng., 87(4), pp. 1082-1083.
Page 66
55
[21] Chu, T., Brown, A., and Garrett, S., 1985, "Discharge Coefficients of Impingement and
Film Cooling Holes," 85-GT-81.
[22] Ligrani, P. M., and Camci, C., 1985, "Adiabatic Film Cooling Effectiveness From Heat
Transfer Measurements in Compressible Variable-Property Flow," J. Heat Transfer., 107(2), pp.
313-220.
[23] O'Malley, K., 1988, "An Experimental and Theoretical Investigation of Slot Injection and
Flow Separation," DPhil thesis, University of Oxford, United Kingdom.
[24] Andrews, G. E., and Mkpadi, M. C., 1984, “Full-Coverage Discrete Hole Wall Cooling:
Discharge Coefficients,” J. Eng. Gas Turbines Power., 106(1), pp. 183-192.
[25] Wei-hau Y., Jun C., Rui S., Xu-sheng H., and Shuang-wen S., 2011, “Experimental
Investigation on Impingement-Effusion Film-Cooling Behaviors in Curve Section,” Acta
Astronautica., 68(11-12), pp. 1782-1789.
[26] Zhang C., Xu Q., Zhao M., Lin Y., and Liu G., 2006, “Effect of Impingement/Effusion
Hole-Area Ratio on Discharge Coefficients of Double Cooling Wall,” GT2006-90612.
[27] Huelsmann, N., and Thole, K., 2020, “Effects of Jet Impingement on Convective Heat
Transfer in Effusion Holes,” GT-2020-15577.