REMOTE SENSINC OF ENVIRONMENT 19:47-61 (1986) Effects of Nitrogen Fertilization on Growth and Reflectance Characteristics of Winter Wheat* 47 L. D. HINZMAN, M. E. BAUER, AND C. S. T. DAUGHTRY ~ Laboratory for Applications of Remote Sensing and Department of Agronomy, Purdue University, West Lafayette, Indiana 47907 A valuable input to crop growth mad yield models would be estimates of current crop condition. If multispectral reflectance indicates crop condition, then remote sensing may provide an additional tool for crop assessment. Field experiments were conducted on a typic Argiaquoll at the Purdue Agronomy Farm, West Lafayette, IN to determine the effects of nitrogen fertilization on the spectral reflectance and agronomic characteristics of winter wheat (Triticum aestivum L). The fertilization treatments consisted of 0, 60, and 120 kg N/ha, applied as urea in the spring. Spectral reflectance was measured 11 times during the 1979 growing season and 10 times during the 1980 growing season with a spectroradiometer (Exotech 20C) in the 400-2400 nm wavelength region. Agronomic data included total leaf N concentration, leaf chlorophyll concentration, stage of development, leaf area index, plant moisture, and fresh and dry phytomass. Relationships between spectral and agronomic variables were developed using data from 1979 and tested with data from 1980. N fertilization of wheat reduced visible, increased near infrared, and deceased middle infrared reflectance, These changes were related to lower levels of chlorophyll and reduced leaf area in the nonfertilized plots. Green LAI, an important descriptor of wheat canopies, could be reliably estimated with multispectral data. This study demonstrated that N-stressed wheat could be distinguished from healthy wheat spectrally and, therefore, that multispectral imagery may be useful for monitoring crop condition. Introduction Remote sensing is rapidly becoming a practical tool for obtaining information about the earth's resources, especially its vegetation resources. Accurate assessment of crop condition would be useful for more efficient and economic determina- tion of the extent and severity of drought, diseases, insect infestations, and nutrient deficiencies. A capability to remotely sense variables related to crop condition would enable yield models to be imple- *Journal Paper No. 10,151, Purdue University Agri- cultural Experiment Station. This study was supported by NASA Johnson Space Center, Contracts NAS9-15466 and -16528. ~Former graduate research assistant (currently re- search assistant, University of Alaska); senior research agronomist (currently director, Remote Sensing Labora- tory, University of Minnesota); and senior research agronomist, Purdue University. mented through multispectral surveys of large areas. Satellite measurements of spectral radi- ance have been successfully used for identification of crop species and area estimation (MacDonald and Hall, 1980); however, detecting and recognizing crop stress using remote sensing is a more dif- ficult task (Bauer, 1975). Nitrogen de- ficiency, a problem common to field crops over much of the world, is a systemic stress characterized in wheat by leaf chlo- rosis, reduced net assimilation and rela- tive growth rates, and lower leaf area index (LAI), phytomass, and grain yield (Osman et al., 1977). These characteris- tics, as well as ease of inducing N stress experimentally, make it an ideal stress to determine the potential of multispectral remote sensing for crop condition assess- ment. -~c~ElsevierScience Publishing Co., Inc., 1986 52 Vanderbilt Ave., New York, NY 10017 00344257/86/$3,50
Transcript
REMOTE SENSINC OF ENVIRONMENT 19:47-61 (1986)
Effects of Nitrogen Fertilization on Growth and Reflectance Characteristics of Winter Wheat*
47
L. D. HINZMAN, M. E. BAUER, AND C. S. T. DAUGHTRY ~
Laboratory for Applications of Remote Sensing and Department of Agronomy, Purdue University, West Lafayette, Indiana 47907
A valuable input to crop growth mad yield models would be estimates of current crop condition. If multispectral reflectance indicates crop condition, then remote sensing may provide an additional tool for crop assessment. Field experiments were conducted on a typic Argiaquoll at the Purdue Agronomy Farm, West Lafayette, IN to determine the effects of nitrogen fertilization on the spectral reflectance and agronomic characteristics of winter wheat (Triticum aestivum L). The fertilization treatments consisted of 0, 60, and 120 kg N/ha, applied as urea in the spring. Spectral reflectance was measured 11 times during the 1979 growing season and 10 times during the 1980 growing season with a spectroradiometer (Exotech 20C) in the 400-2400 nm wavelength region. Agronomic data included total leaf N concentration, leaf chlorophyll concentration, stage of development, leaf area index, plant moisture, and fresh and dry phytomass. Relationships between spectral and agronomic variables were developed using data from 1979 and tested with data from 1980. N fertilization of wheat reduced visible, increased near infrared, and deceased middle infrared reflectance, These changes were related to lower levels of chlorophyll and reduced leaf area in the nonfertilized plots. Green LAI, an important descriptor of wheat canopies, could be reliably estimated with multispectral data. This study demonstrated that N-stressed wheat could be distinguished from healthy wheat spectrally and, therefore, that multispectral imagery may be useful for monitoring crop condition.
Introduction
Remote sensing is rapidly becoming a practical tool for obtaining information about the earth's resources, especially its vegetation resources. Accurate assessment of crop condition would be useful for more efficient and economic determina- tion of the extent and severity of drought, diseases, insect infestations, and nutrient deficiencies. A capability to remotely sense variables related to crop condition would enable yield models to be imple-
*Journal Paper No. 10,151, Purdue University Agri- cultural Experiment Station. This study was supported by NASA Johnson Space Center, Contracts NAS9-15466 and -16528.
~Former graduate research assistant (currently re- search assistant, University of Alaska); senior research agronomist (currently director, Remote Sensing Labora- tory, University of Minnesota); and senior research agronomist, Purdue University.
mented through multispectral surveys of large areas.
Satellite measurements of spectral radi- ance have been successfully used for identification of crop species and area estimation (MacDonald and Hall, 1980); however, detecting and recognizing crop stress using remote sensing is a more dif- ficult task (Bauer, 1975). Nitrogen de- ficiency, a problem common to field crops over much of the world, is a systemic stress characterized in wheat by leaf chlo- rosis, reduced net assimilation and rela- tive growth rates, and lower leaf area index (LAI), phytomass, and grain yield (Osman et al., 1977). These characteris- tics, as well as ease of inducing N stress experimentally, make it an ideal stress to determine the potential of multispectral remote sensing for crop condition assess- ment.
-~c~Elsevier Science Publishing Co., Inc., 1986 52 Vanderbilt Ave., New York, NY 10017 00344257/86/$3,50
48 L. D. HINZMAN ET AL
Laboratory studies have shown the ef- fects of nutrient deficiencies on the spec- tral reflectance and transmittance of single leaves (e.g., A1-Abbas et al., 1974), but there have been relatively few field mea- surements of crop canopies undergoing stress. By measuring the spectral reflec- tance in corn canopies, Walburg et al. (1982) were able to distinguish four levels of N fertilization. The reflectance dif- ferences were related to leaf chlorophyll and leaf total N concentrations, LAI, and percent soil cover. Stanhill et al. (1972) found that the spectral response of N- deficient wheat canopies was primarily related to differences in total phytomass and only secondarily to leaf optical prop- erties and canopy geometry. Spectral measurements related to canopy senes- cence rates and green leaf area duration were used by Pinter et al. (1981) to esti- mate grain yields of wheat and barley.
The objectives of this research were to (1) determine the seasonal changes in agronomic and spectral properties of winter wheat canopies with different levels of N fertilization and (2) relate key agronomic and spectral characteristics of wheat canopies. Relationships among spectral and agronomic variables were de- veloped with data from 1979 and tested with independent data from 1980.
Methods and Materials
Experiments were conducted at the Purdue Agronomy Farm, West Lafayette, IN, on a Chalmers silty clay loam (typic Argiaquoll) soil with 0-1% slope during the 1978-79 and 1979-80 growing sea- sons. Winter wheat (Triticum aestivum L., "Caldwell" and "Monon") was planted on 5 October 1978 and 10 Oc- tober 1979 in a randomized complete
block design. Three blocks were planted in 1978 and two in 1979. The plots were 3.0 m wide and 19 m long with 18 cm wide north-south rows. Each block con- tained three replications of N treatments consisting of 0, 60, and 120 kg N / h a applied as urea on 3 April 1979 and 2 April 1980. Originally, the within-block replicates of N fertility were three leaf rust treatments; however, because signifi- cant amounts of disease did not develop, these treatments were subsequently con- sidered as additional replications of the N treatments.
Spectral measurements. Spectral re- flectance measurements of the canopies over the wavelength range 4.90-2400 nm were made using an Exotech 20C spec- troradiometer (Leamer et al., 1973) mounted on the boom of a mobile aerial tower. Measurements were made at two locations over each plot, looking straight down from 6.0 m above the soil. With a 15 ° field of view, the sensor viewed an area 1.6 m in diameter. All spectral mea- surements were made on cloudless or near cloudless days prior to solar noon when the solar elevation was at least 45 ° . Data were acquired on 11 dates in 1979 and 10 in 1980, and all major stages of develop- ment from tillering to physiological ma- turity were included.
The spectral measurements were ex- pressed as reflectance factor which cor- rects for irradiance differences, facilitat- ing comparisons within and among dates. Reflectance factor is the ratio of incident radiant flux reflected by a sample surface (e.g., soil or crop canopy) to that reflected into the same beam geometry by a per- fectly diffuse (Lambertian) standard ref- erence surface identically irradiated and viewed (Nicodemus et al., 1977). A 1.2 × 1.2 m painted BaSO 4 panel with stable,
REFLECTANCE OF WINTER WHEAT CANOPIES 49
known reflectance properties was used as the reference surface. Robinson and Biehl (1979) have described the spectral mea- surements and calibration procedures.
Agronomic measurements. Plant sam- ples were collected from the southern half of each plot, reserving the northern half for spectral measurement. From each plot, all of the plants in two 1.0 m sections of row were cut at ground level and com- bined. Fresh and dry phytomass and LAI were obtained from these samples. A sub- sample of 25-30 tillers was randomly selected from each sample, the leaf blades removed, and the area of green leaf blades measured with an area meter (LI-COR LI-3000). The components of the subsam- pie (leaf blades, stems including leaf sheaths, and heads) and the remainder of the large sample were put in separate bags, dried at 70°C to constant weight, and weighed. The LAI for each plot was calculated using the ratio of green leaf area to dry weight ratio. Plant water con- tent was calculated as the percentage dif- ference between fresh and dry phyto- m a s s .
Stages of wheat development were as- sessed using the Feekes scale (Large, 1954). Total N of a random sample of all green leaves was determined using micro-Keldjahl analysis. Chlorophyll con- centration of the topmost fully expanded leaf or flag leaf was determined by meth- ods described by Koller and Dilley (1974). Chlorophyll density of canopy was calcu- lated as chlorophyll concentration on times green LAI.
Data analysis. Spectral response was represented in several forms for analysis. Treatment effects were analyzed qualita- tively by examining reflectance spectra of each treatment. Seasonal trends of agro- nomic and spectral variables were plotted
as means and standard deviations. Reflec- tance factor data were quantitatively analyzed as means of bands correspond- ing to the bands of the Lindsat thematic mapper (TM). The six TM bands in the reflective portion of the spectrum are: 450-520, 520-600, 630-690, 760-900, 1550-1750, and 2080-2350 nm.
In addition to the reflectance factors of individual wavelength bands, several vegetation indices were considered. The greenness index, a constrained principal components transformation, was calcu- lated by summing the products of a coef- ficient and the reflectance factor of each band; greenness index = 30 + ( - 0.1004 RF1) + ( - 0.1176 RF2) + ( - 0.3250 RF3) +(0,8577 RF4)+(0.1748 RF5)+(0.3228 RF6), where RF1-RF6 are the reflec- tance factors in the six reflective TM bands (Miller et al., 1984). An offset of 30 was added to the greenness index to as- sure positive values for bare soil. The ratio of IR / r ed was calculated as RF4 divided by RF3. Normalized difference ( N D ) was c o m p u t e d as (RF4 - RF3)/ (RF4 + RF3).
Resul ts and Di scuss ion
Seasonal changes
Although differences in the agronomic characteristics among the treatments were generally smaller in 1980 than in 1979, the three levels of N fertilization pro- duced three generally distinct groups of wheat canopies in both years.
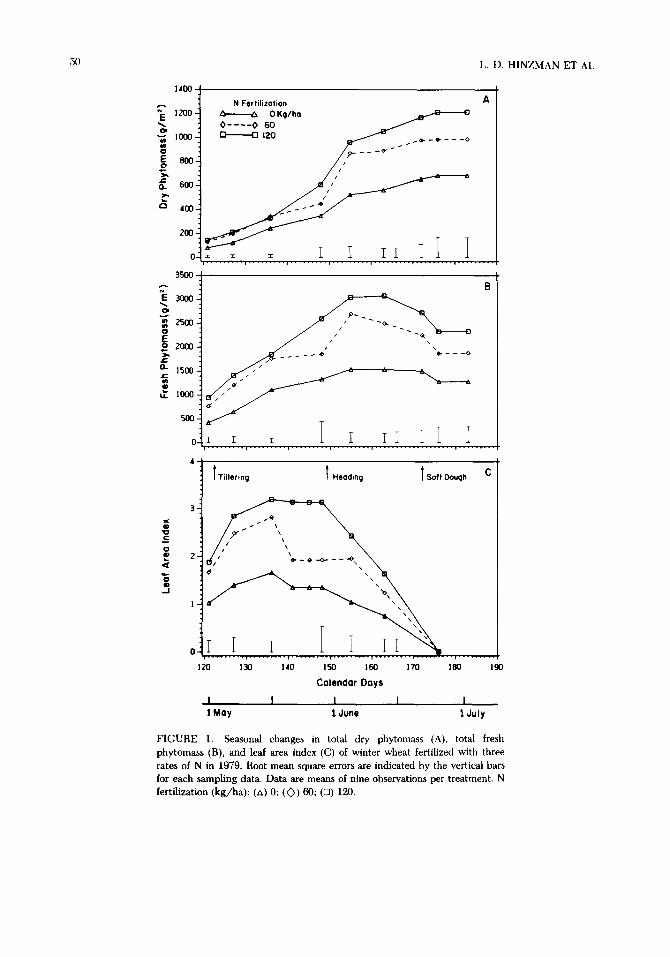
Maximum green LAI was reached prior to heading [Fig. 1(C)] and then declined as the lower leaves senesced. Wheat ferti- lized with 120 kg /ha of N had the highest LAI and maintained its green leaf area longer than the other treatments. Total
FIGURE 1. Seasonal changes in total dry phytomass (A), total fresh phytomass (B), and leaf area index (C) of winter wheat fertilized with three rates of N in 1979. Root mean square errors are indicated by the vertical bars for each sampling data. Data are means of nine observations per treatment. N fertilization (kg/ha): (zx) 0; ( ~ ) 60; (D) 120.
REFLECTANCE OF WINTER WHEAT CANOPIES 51
fresh and dry phytomass increased during grain filling even as green LAI declined (Fig. 1). Maximum dry phytomass oc- curred at physiological maturity of the grain.
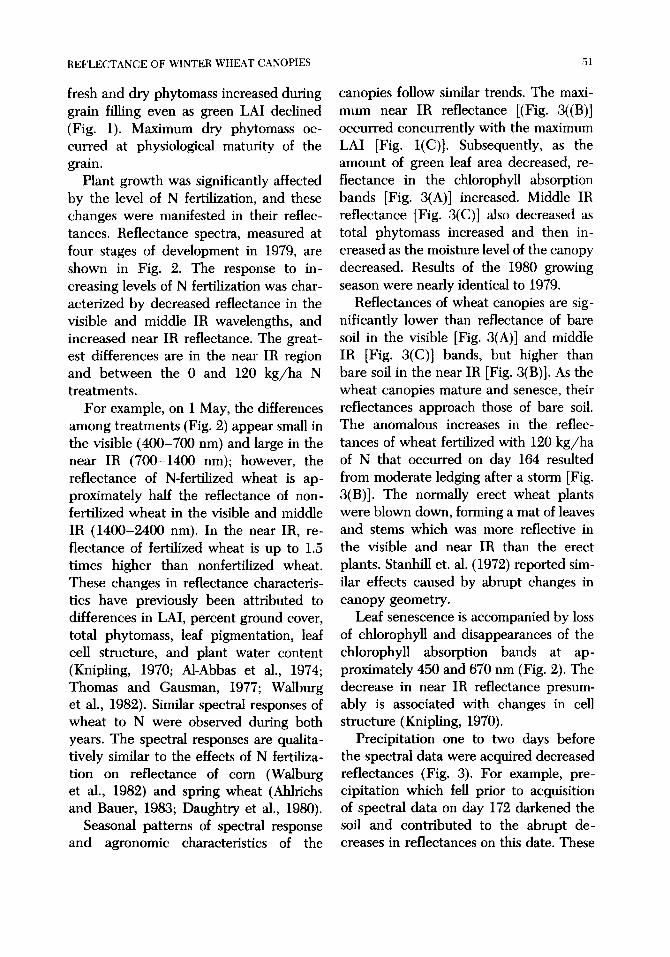
Plant growth was significantly affected by the level of N fertilization, and these changes were manifested in their reflec- tances. Reflectance spectra, measured at four stages of development in 1979, are shown in Fig. 2. The response to in- creasing levels of N fertilization was char- acterized by decreased reflectance in the visible and middle IR wavelengths, and increased near IR reflectance. The great- est differences are in the near IR region and between the 0 and 120 kg /ha N treatments.
For example, on 1 May, the differences among treatments (Fig. 2) appear small in the visible (400-700 nm) and large in the near IR (700-1400 nm); however, the reflectance of N-fertilized wheat is ap- proximately half the reflectance of non- fertilized wheat in the visible and middle IR (1400-2400 nm). In the near IR, re- flectance of fertilized wheat is up to 1.5 times higher than nonfertilized wheat. These changes in reflectance characteris- tics have previously been attributed to differences in LAI, percent ground cover, total phytomass, leaf pigmentation, leaf cell structure, and plant water content (Knipling, 1970; A1-Abbas et al., 1974; Thomas and Gausman, 1977; Walburg et al., 1982). Similar spectral responses of wheat to N were observed during both years. The spectral responses are qualita- tively similar to the effects of N fertiliza- tion on reflectance of corn (Walburg et al., 1982) and spring wheat (Ahlrichs and Bauer, 1983; Daughtry et al., 1980).
Seasonal patterns of spectral response and agronomic characteristics of the
canopies follow similar trends. The maxi- mum near IR reflectance [(Fig. 3((B)] occurred concurrently with the maximum LAI [Fig. I(C)]. Subsequently, as the amount of green leaf area decreased, re- flectance in the chlorophyll absorption bands [Fig. 3(A)] increased. Middle IR reflectance [Fig. 3(C)] also decreased as total phytomass increased and then in- creased as the moisture level of the canopy decreased. Results of the 1980 growing season were nearly identical to 1979.
Reflectances of wheat canopies are sig- nificantly lower than reflectance of bare soil in the visible [Fig. 3(A)] and middle IR [Fig. 3(C)] bands, but higher than bare soil in the near IR [Fig. 3(B)]. As the wheat canopies mature and senesce, their reflectances approach those of bare soil. The anomalous increases in the reflec- tances of wheat fertilized with 120 kg /ha of N that occurred on day 164 resulted from moderate ledging after a storm [Fig. 3(B)]. The normally erect wheat plants were blown down, forming a mat of leaves and stems which was more reflective in the visible and near IR than the erect plants. Stanhill et. al. (1972) reported sim- ilar effects caused by abrupt changes in canopy geometry.
Leaf senescence is accompanied by loss of chlorophyll and disappearances of the chlorophyll absorption bands at ap- proximately 450 and 670 nm (Fig. 2). The decrease in near IR reflectance presum- ably is associated with changes in cell structure (Knipling, 1970).
Precipitation one to two days before the spectral data were acquired decreased reflectances (Fig. 3). For example, pre- cipitation which fell prior to acquisition of spectral data on day 172 darkened the soil and contributed to the abrupt de- creases in reflectances on this date. These
52 L .D . HINZMAN ET AL
60 Ti l ler ing 1 May 1979 A
(J
k l .
(J C 10
50
40
30
20
10
0
6O
....... ,,.f--~,,,
,"~LL:~, X
I i I I
Heading
Ni t rogen Fer t i l i za t ion - - 0 k g / h a - - - - - - 60 . . . . . . . . . 120
I I I I I I
29 May 1979 B
(J
U .
U r- IO
50
4 0
3O
20
10
0
6 0
........ .....
t /
I i i i i
Soft Dough
j
21 June 1979 C
14 .
¢J ¢-
"5 m
5 0
4 0
30
2(]
10
60
....'"'"'........""" : :........,.
,. !/~-~/~ .
S . ,..,"'-.,.,,
I I f I i I i
Harvest Maturity I I I
2 July 1979 D
A ,,.,,
O Ii ~P tJ e" {0
50
40
3 0 ,...."'"'"'"'"''"'"'"''"k
..." f
.4 .6 .8 1.0 1. 1.4 1.6 1.8 2 2. 2 .4
Wavelength (pro)
FIGURE 2. Spectral reflectance of winter wheat at tour stages of development in 1979. N fertilization (kg/'ha): ( ) 0; (---) 60; ( . . . ) 120.
FIGURE 3. Seasonal changes in reflectance factors of winter wheat in 1979 for the red (A), near infrared (B), middle infrared (C) bands. Root mean square errors are indicated by the vertical bars for each sampling date. Data are means of nine observations per treatment. The occurrence and amount of rainfall are indicated (D). N fertilization (kg//ha): (zx) 0; ( ~ ) 60; (El) 120.
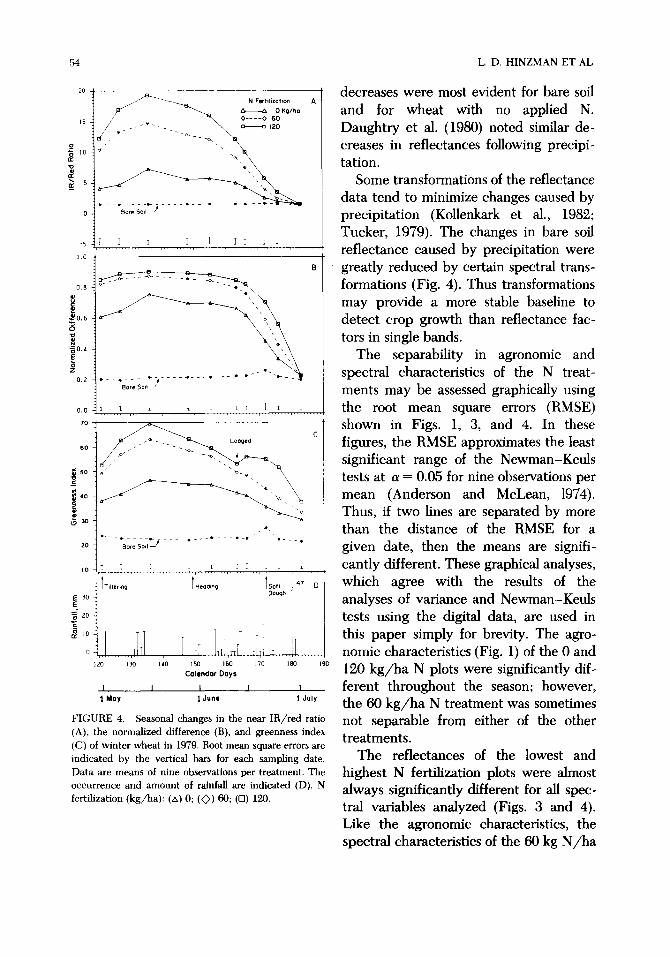
FIGURE 4. Seasonal changes in the near IR/ red ratio (A), the normalized difference (B), and greenness index (C) of winter wheat in 1979. Root mean square errors are indicated by the vertical bars for each sampling date. Data are means of nine observations per treatment. The occurrence and amount of rainfall are indicated (D). N fertilization (kg/ha): (zx) 0; ( ~ ) 60; (El) 120.
decreases were most evident for bare soil and for wheat with no applied N. Daughtry et al. (1980) noted similar de- creases in reflectances following precipi- tation.
Some transformations of the reflectance data tend to minimize changes caused by precipitation (Kollenkark et al., 1982; Tucker, 1979). The changes in bare soil reflectance caused by precipitation were greatly reduced by certain spectral trans- formations (Fig. 4). Thus transformations may provide a more stable baseline to detect crop growth than reflectance fac- tors in single bands.
The separability in agronomic and spectral characteristics of the N treat- ments may be assessed graphically using the root mean square errors (RMSE) shown in Figs. 1, 3, and 4. In these figures, the RMSE approximates the least significant range of the Newman-Keuls tests at a = 0.05 for nine observations per mean (Anderson and McLean, 1974). Thus, if two lines are separated by more than the distance of the RMSE for a given date, then the means are signifi- cantly different. These graphical analyses, which agree with the results of the analyses of variance and Newman-Keuls tests using the digital data, are used in this paper simply for brevity. The agro- nomic characteristics (Fig. 1) of the 0 and 120 kg/ha N plots were significantly dif- ferent throughout the season; however, the 60 kg/ha N treatment was sometimes not separable from either of the other treatments.
The reflectances of the lowest and highest N fertilization plots were almost always significantly different for all spec- tral variables analyzed (Figs. 3 and 4). Like the agronomic characteristics, the spectral characteristics of the 60 kg N/ha
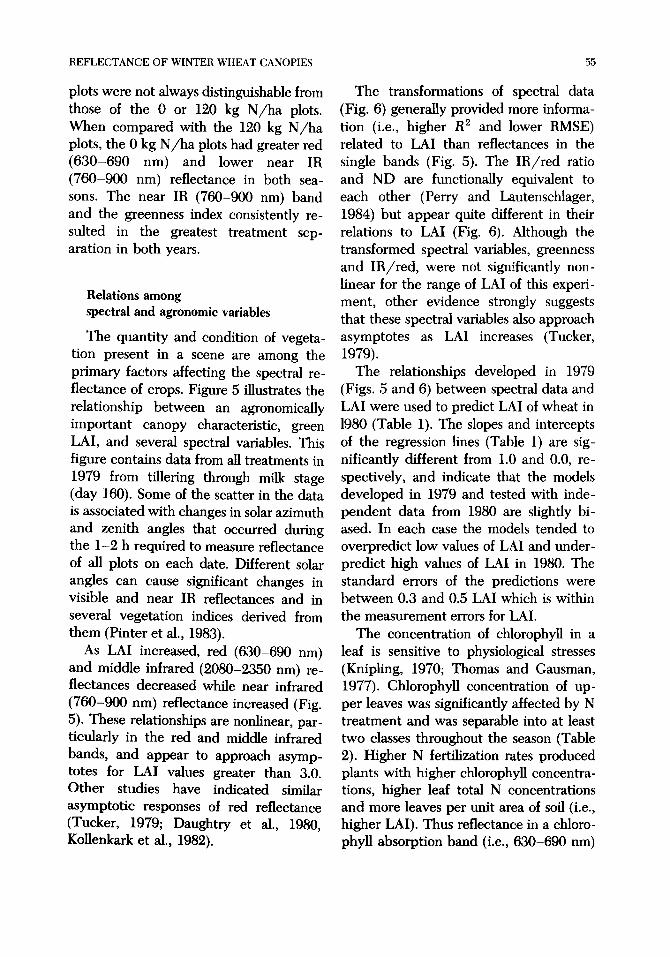
REFLECTANCE OF WINTER WHEAT CANOPIES 55
plots were not always distinguishable from those of the 0 or 120 kg N/ha plots. When compared with the 120 kg N/ha plots, the 0 kg N /ha plots had greater red (630-690 nm) and lower near IR (760-900 nm) reflectance in both sea- sons. The near IR (760-900 nm) band and the greenness index consistently re- sulted in the greatest treatment sep- aration in both years.
Relations among spectral and agronomic variables
The quantity and condition of vegeta- tion present in a scene are among the primary factors affecting the spectral re- flectance of crops. Figure 5 illustrates the relationship between an agronomically important canopy characteristic, green LAI, and several spectral variables. This figure contains data from all treatments in 1979 from tfllering through milk stage (day 160). Some of the scatter in the data is associated with changes in solar azimuth and zenith angles that occurred during the 1-2 h required to measure reflectance of all plots on each date. Different solar angles can cause significant changes in visible and near IR reflectances and in several vegetation indices derived from them (Pinter et al., 1983).
As LAI increased, red (630-690 nm) and middle infrared (2080-2350 nm) re- flectances decreased while near infrared (760-900 nm) reflectance increased (Fig. 5). These relationships are nonlinear, par- ticularly in the red and middle infrared bands, and appear to approach asymp- totes for LAI values greater than 3.0. Other studies have indicated similar asymptotic responses of red reflectance (Tucker, 1979; Daughtry et al., 1980, KoUenkark et al., 1982).
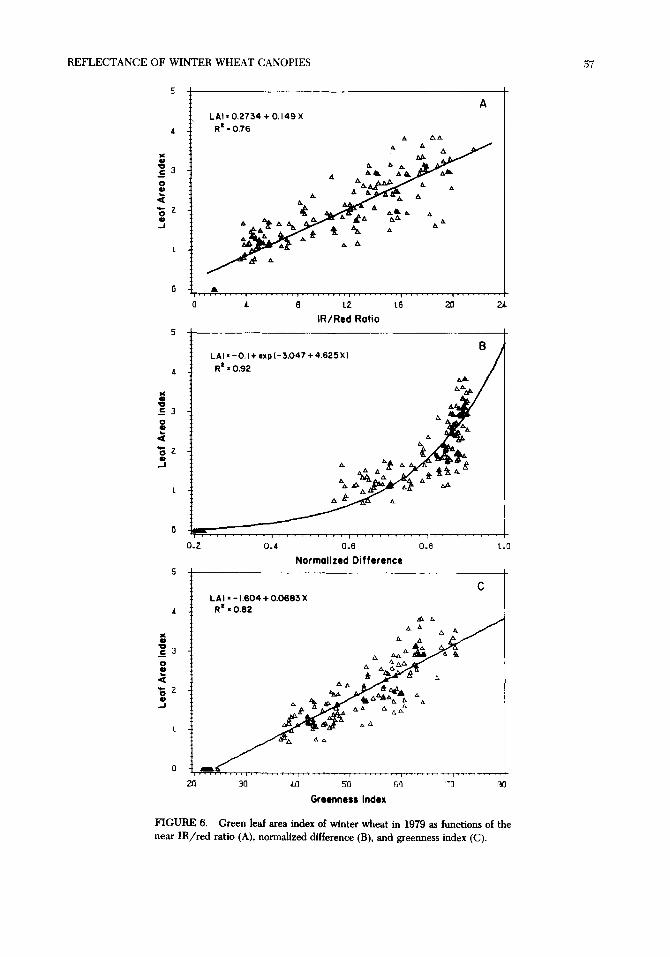
The transformations of spectral data (Fig. 6) generally provided more informa- tion (i.e., higher R 2 and lower RMSE) related to LAI than reflectances in the single bands (Fig. 5). The IR/red ratio and ND are flmctionally equivalent to each other (Perry and Lautenschlager, 1984) but appear quite different in their relations to LAI (Fig. 6). Although the transformed spectral variables, greenness and IR/red, were not significantly non- linear for the range of LAI of this experi- ment, other evidence strongly suggests that these spectral variables also approach asymptotes as LAI increases (Tucker, 1979).
The relationships developed in 1979 (Figs. 5 and 6) between spectral data and LAI were used to predict LAI of wheat in 1980 (Table 1). The slopes and intercepts of the regression lines (Table 1) are sig- nificantly different from 1.0 and 0.0, re- spectively, and indicate that the models developed in 1979 and tested with inde- pendent data from 1980 are slightly bi- ased. In each case the models tended to overpredict low values of LAI and under- predict high values of LAI in 1980. The standard errors of the predictions were between 0.3 and 0.5 LAI which is within the measurement errors for LAI.
The concentration of chlorophyll in a leaf is sensitive to physiological stresses (Knipling, 1970; Thomas and Gausman, 1977). Chlorophyll concentration of up- per leaves was significantly affected by N treatment and was separable into at least two classes throughout the season (Table 2). Higher N fertilization rates produced plants with higher chlorophyll concentra- tions, higher leaf total N concentrations and more leaves per unit area of soft (i.e., higher LAI). Thus reflectance in a chloro- phyll absorption band (i.e., 630-690 nm)
FIGURE 6. Green leaf area index of winter wheat in 1979 as functions of the near IR / red ratio (A), normalized difference (B), and greenness index (C).
,58 L .D. HINZMAN ET AL
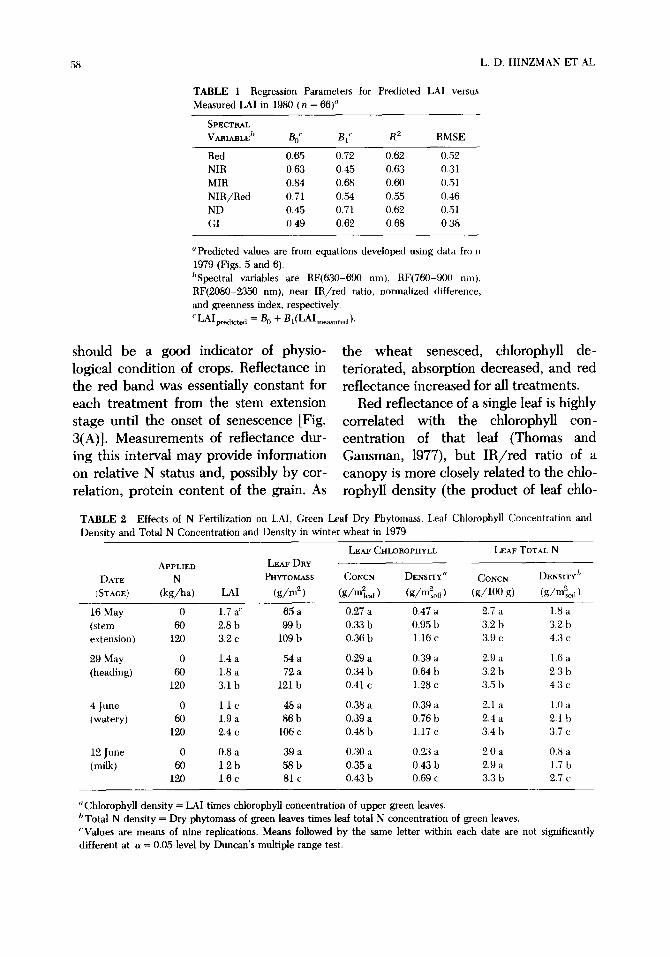
TABLE 1 Regression Parameters for Predicted LAI versus Measured LAI in 1980 (n = 66)"
SPECTRAL VARIABLE b Bo c Bl" R e RMSE
Red 0.65 0.72 0.62 0.52 NIR 0.63 0.45 0.63 0.31 MIR 0.84 0.68 0.60 0.51 NIR/Red 0.71 0.54 0.55 0.46 ND 0.45 0.71 0.62 0.51 GI 0.49 0.62 0.68 0.38
"Predicted values are from equations developed using data fro n 1979 (Figs. 5 and 6). 1'Spectral variables are RF(630-690 nm), RF(760-900 nm), RF(2080-2350 nm), near IR/red ratio, normalized difference, and greenness index, respectively.
LAI predicted = Bo + BI(LAI ...... . . a ).
should be a good indicator of physio- logical condition of crops. Reflectance in the red band was essentially constant for each treatment from the stem extension stage until the onset of senescence [Fig. 3(A)]. Measurements of reflectance dur- ing this interval may provide information on relative N status and, possibly by cor- relation, protein content of the grain. As
the wheat senesced, chlorophyll de- teriorated, absorption decreased, and red reflectance increased for all treatments.
Red reflectance of a single leaf is highly correlated with the chlorophyll con- centration of that leaf (Thomas and Gausman, 1977), but IR/red ratio of a canopy is more closely related to the chlo- rophyll density (the product of leaf chlo-
TABLE 2 Effects of N Fertilization on LAI, Green Leaf Dry Phytomass, Leaf Chlorophyll Concentration and Density and Total N Concentration and Density in winter wheat in 1979
LEAF CHLOROPHYLL LEAF TOTAL N
APPLIED LEAF DRY DATE N PHYTOMASS CONCN DENSITY a C O N C N DENSITY t,
(STAGE) (kg/ha) LAI (g /m 2 ) (g/m~e d ) ~ 2 (g/nl~oll) (g/lO0 g) (g/nlsoil)
16 May 0 1.7 a '' 65 a 0.27 a 0.47 a 2.7 a 1.8 a (stem 60 2.8 b 99 b 0.33 b 0.95 b 3.2 b 3.2 b extension) 120 3.2 c 109 b 0.36 b 1.16 c 3.9 c 4.3 c
29 May 0 1.4 a 54 a 0.29 a 0.39 a 2.9 a 1.6 a (heading) 60 1.8 a 72 a 0.34 b 0.64 b 3.2 b 2.3 b
120 3.1 b 121 b 0.41 c 1.28 c 3.5 b 4.3 c
4 June 0 1.1 c 48 a 0.38 a 0.39 a 2.1 a 1.0 a (watery) 60 1.9 a 86 b 0.39 a 0.76 b 2.4 a 2.1 b
120 2.4 c 106 c 0.48 b 1.17 c 3.4 b 3.7 c
12 June 0 0.8 a 39 a 0.30 a 0.23 a 2.0 a 0.8 a (milk) 60 1.2 b 58 b 0.35 a 0.43 b 2.9 a 1.7 b
120 1.6 c 81 c 0.43 b 0.69 c 3.3 b 2.7 c
"Chlorophyll density = LAI times chlorophyll concentration of upper green leaves. b Total N density = Dry phytomass of green leaves times leaf total N concentration of green leaves. "Values are means of nine replications. Means followed by the same letter within each date are not significantly different at a = 0.05 level by Duncan's multiple range test.
REFLECTANCE OF WINTER WHEAT CANOPIES 59
t.6
,~ o t.2
o
e-
Q .
B 0
u
12.0
Y = - 0 . 0 7 2 0 + 0 . 0 6 8 3 x R t = 0 . 9 0
. . . . . . . . i . . . . . . . . . i . . . . . . . . . i ,
l :a t2
t ~
• t . . . . . . . . . i . . . . . . . . .
t6 213
IR /Red Ratio
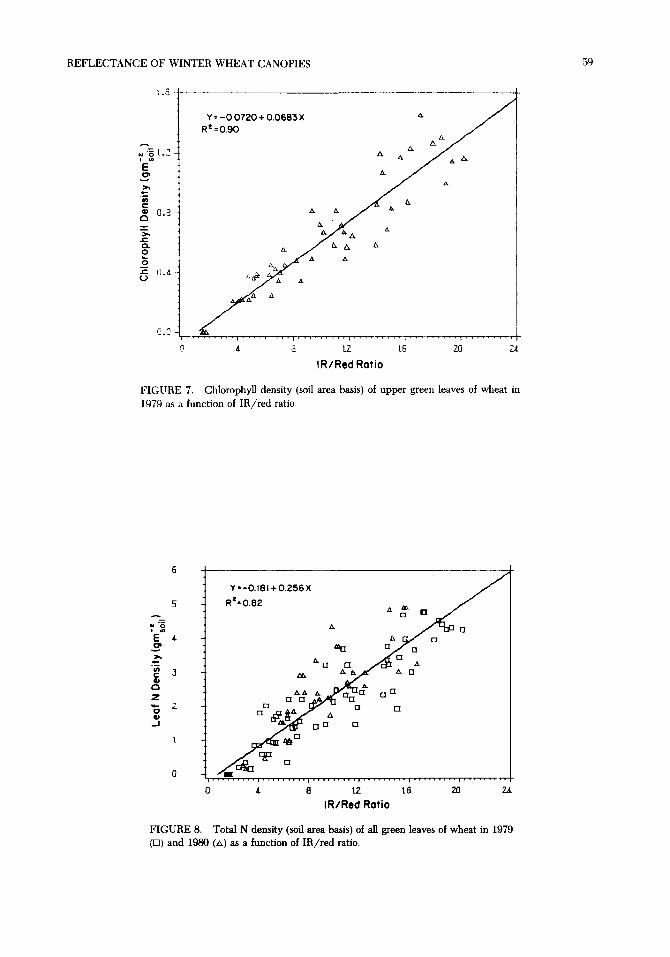
FIGURE 7. Chlorophyll density (soil area basis) of upper green leaves of wheat in
FIGURE 8. Total N density (soil ~ea basis) of all green leaves of wheat in 1979 (17) and 1980 (zx) as a function of IR/red ratio.
60 L. D. HINZMAN ET AL
rophyll concentration and green LAI) (Fig. 7) and total N density (the product of total N concentration of green leaves and dry phytomass of green leaves) (Fig. 8). Individually, LAI, green leaf phyto- mass, leaf chlorophyll concentration, and leaf total N concentration were not al- ways significantly different, but chloro- phyll density and total N density were very sensitive to N fertilization rate and separated into three significantly different classes on each sampling date (Table 2). Our estimates of chlorophyll density are inflated to the extent that chlorophyll concentrations in the upper leaves were greater than the mean chlorophyll con- centration of all green leaves in the canopy. The upper leaves of wheat are usually the last to senesce and conse- quently have higher concentrations of chlorophyll. If true mean chlorophyll con- centration of all green leaves had been determined, the differences in chlorophyll density among the treatments would have been even greater.
Summary and Conclusions
This study demonstrated the potential for using remote sensing to detect N- stressed wheat. Although it was almost always possible to distinguish the agro- nomic characteristics of the 0 kg N/ha plots from the 120 kg N/ha plots, the 60 kg N / h a plots were not always separable from either the 0 or the 120 kg N /ha plots. The plots deficient in N showed greater reflectance in the visible and mid- die IR wavelengths and lower reflectance in the near IR wavelengths than those with adequate or high N fertility. These differences were caused by lower levels of chlorophyll, reduced leaf area, and less phytomass in the low N fertility plots.
The reflectance of the lowest N fertiliza- tion plots was significantly different from the reflectance of the highest N fertiliza- tion plots for all spectral variables analyzed, suggesting that at least two condition classes can be identified from remote sensing data. However, the spec- tral reflectance characteristics of the 60 kg N / h a plots were frequently indis- tinguishable from the 0 or 120 kg N/ha plots. The near IR reflectance, IR/red ratio, and the greenness index performed best for discriminating treatment levels. Green LAI, an important descriptor of wheat canopies, can be reliably estimated with multispectral data.
References
Ahlrichs, J. S., and Bauer, M. E. (1983), Rela- tion of agronomic and multispectral reflec- tance characteristics of spring wheat cano- pies, Agron, J. 75:987-992.
A1-Abbas, A. H., Barr, R,, Hall, J. D., Crane, F. L., and Baumgardner, M. F. (1974), Spectra of normal and nutrient deficient maize leaves, Agron. 1. 66:16-20.
Anderson, V. L., and McLean, R. A. (1974), Design of Experiments: A Realistic Ap- proach, Dekker, New York.
Bauer, M. E. (1975), The role of remote sens- ing in determining the distribution and yield of crops, Adv. Agron. 27:271-304.
Daughtry, C. S. T., Bauer, M. E., Crecelius, D. W. and Hixson, M. M. (1980), Effects of management practices on reflectance of spring wheat canopies, Agron. I. 72:1055-1060
Knipling, J. B. (1970), Physical and physiologi- cal basis for the reflectance visible and near infrared radiation from vegetation, Remote Sens. Environ. 1:155-159.
REFLECTANCE OF WINTER WHEAT CANOPIES
Kollenkark, J. C., Daughtry, C. S. T., Bauer, M. E., and Housley, T. L. (1982), Effects of cultural practices on agronomic and reflec- tance characteristics of soybean canopies, Agron. 1. 74:751-758.
Koller, H. R., and Dilley, R. A. (1974), Light intensity during growth affects chlorophyll concentration and CO 2 assimilation of a soybean chlorophyll mutant, Crop Sci. 14:779-782.
Large, C. E. (1954), Growth stages in cereals, Plant Pathol. 3:128-129.
Leamer, R. W., Myers, V. I. and Silva, L. F. (1973), A spectroradiometer for field use, Rev. Sci. Instrum. 44:611-614.
MacDonald, R. B., and Hall, F. G. (1980), Global crop forecasting, Science 208:670-679.
Miller, G. P., Fuchs, M., Hall, M. J., Asrar, G., Kanemasu, E. T., Johnson, D. E. (1984), Analysis of seasonal multispectral reflec- tances of smaller grains, Remote Sens. En- viron. 14:153-167.
Nicodemus, F. E., Richmond, J. C., Hsia, J. J., Ginsberg, I. W. and Limperis, T. (1977), Geometrical considerations and nomencla- ture for reflectance, NBS Monograph 160, U.S. Govt. Printing Office, Washington, DC 20402.
Osman, A. M., Goodman, P.J., and Cooper, J. P. (1977), The effects of nitrogen, phos- phorns, and potassium on rates of growth and photosynthesis of wheat, Photosyn- thetica 11:66-75.
Perry, C. R., and Lautenschlager, L. F. (1984), Functional equivalence of spectral vege-
61
ration indices, Remote Sens. Environ. 14:169-182.
Pinter, P. J., Jr., Jackson, R. D., Idso, S. B., and Reginato, R. J. (1981), Multidate spec- tral reflectance as predictors of yield in water stressed whoat and barley, Int. J. Remote Sens. 2:43-48.
Pinter, P. J., Jr., Jackson, R. D., Idso, S. B., and Reginato, R. J. (1983) Diurnal patterns of wheat spectral reflectances, IEEE Trans. Geosci. Remote Sens. GE-21:156-163.
Robinson, B. F., and Biehl, L. L. (1979), Calibration procedures for measurement of reflectance factor in remote sensing field research, Proc. Soc. Photo-Opt. Instrum. Eng. 196:16-26.
Stanhill, G., Kafkaf, V., Fuchs, M., and Kagan, Y. (1972), The effect of fertilizer applica- tion on solar reflectance from a wheat crop, Israel J. Agric. Res. 22:109-118.
Thomas, J. R., and Gausman, H. W. (1977), Leaf reflectance versus leaf chlorophyll and carotenoid concentrations for eight crops, Agron. J. 69:799-802.
Tucker, C. J. (1979), Red and photographic infrared linear combinations for monitoring vegetation, Remote Sensing Environ. 8:127-150.
Walburg, G., Bauer, M. E., Daughtry, C. S. T., and Housley, T. L. (1982), Effects of nitrogen nutrition on the growth, yield, and reflectance characteristics of corn, Agron, J. 74:677-683.