Accepted Manuscript
Effects of pectin on molecular structural changes in starch during digestion
Yeming Bai, Peng Wu, Kai Wang, Cheng Li, Enpeng Li, Robert G. Gilbert
PII: S0268-005X(17)30104-2
DOI: 10.1016/j.foodhyd.2017.01.021
Reference: FOOHYD 3770
To appear in: Food Hydrocolloids
Received Date: 05 September 2016
Revised Date: 28 November 2016
Accepted Date: 16 January 2017
Please cite this article as: Yeming Bai, Peng Wu, Kai Wang, Cheng Li, Enpeng Li, Robert G. Gilbert, Effects of pectin on molecular structural changes in starch during digestion, Food
(2017), doi: 10.1016/j.foodhyd.2017.01.021Hydrocolloids
This is a PDF file of an unedited manuscript that has been accepted for publication. As a service to our customers we are providing this early version of the manuscript. The manuscript will undergo copyediting, typesetting, and review of the resulting proof before it is published in its final form. Please note that during the production process errors may be discovered which could affect the content, and all legal disclaimers that apply to the journal pertain.
ACCEPTED MANUSCRIPT
Addition of pectin slows starch digestion rate. Amylose to amylopectin ratio remains unchanged during digestion with pectin. Longer amylopectin chains digested slower with addition of pectin. Interaction between amyloglucosidase and pectin causes digestion rate reduction
ACCEPTED MANUSCRIPT
1
1 Effects of pectin on molecular structural changes in starch
2 during digestion
3
4 Yeming Baia,b, Peng Wub, Kai Wangc, Cheng Lia,b, Enpeng Lia,*, and Robert G. Gilberta, b,*
5 aYangzhou University, College of Bioscience and Biotechnology, Yangzhou 225009, China
6 bThe University of Queensland, Centre for Nutrition and Food Sciences, Queensland Alliance
7 for Agriculture and Food Innovation, Brisbane, QLD 4072, Australia
8 cCollege of Food Science, South China Agricultural University, Guangzhou 510642, China
9
10 *Corresponding authors:
11 The University of Queensland, Centre for Nutrition and Food Sciences, Building 83, Brisbane
12 4072, QLD, Australia. Email: [email protected]. Phone: +61 7 3365 4809. Fax: +61 7 3365
13 118
14 &
15 Yangzhou University, College of Bioscience and Biotechnology, Yangzhou 225009, China.
16 Email: [email protected]. Phone: + 86 27 87505266
17
ACCEPTED MANUSCRIPT
2
18 Abstract
19 Starch digestion rate is strongly related to metabolic diseases such as obesity and diabetes.
20 Starchy foods always contain non-starch components, which can affect starch digestibility.
21 Mixtures of ungelatinized corn starch with a common non-starch component, pectin, were
22 used to investigate pectin’s effect on starch digestibility rate and evolution of starch molecular
23 structure during digestion using amyloglucosidase and pancreatin. The whole-molecule size
24 distribution and the chain-length distribution of chains were measured by size-exclusion
25 chromatography and fluorophore-assisted carbohydrate electrophoresis. Digestion profiles
26 and changes in molecular size distributions of whole and debranched digesta during digestion
27 show that addition of pectin significantly decreased starch digestion rates. While pectin did
28 not change the amylose/amylopectin ratio during most of the digestion, it decreased the
29 digestion rate of short amylopectin chains compared to long ones. UV-visible spectral data
30 suggested that a major contributor to this digestion rate change is from substantial
31 pectin/amyloglucosidase interaction. This suggests an approach to designing nutritionally
32 more beneficial starch-based foods by taking account of interactions between pectin and
33 digestive enzymes.
34
35 Keywords: starch; pectin; starch digestibility; molecular structure; GPC
36
37 Chemical compounds studied in this article:
38 Amylose (PubChem CID: 53477771); Amylopectin (PubChem CID: 439207); Pectin
39 (PubChem CID: 6857565).
40
ACCEPTED MANUSCRIPT
3
41 Abbreviations
42 AM: amylose; AMG: amyloglucosidase; AP: amylopectin; AUC, area under the curve; CLD,
43 chain length distribution; DMSO, dimethyl sulfoxide; DP, degree of polymerization; SEC,
44 size-exclusion chromatography; FACE, fluorophore-assisted carbohydrate electrophoresis;
45 RID, refractive index detector.
46
47 1. Introduction
48 Starch provides ~ 50% of the average human energy intake in developed countries and the
49 percentage is even higher in many developing countries (Hoang et al., 2008). It is a branched
50 homopolymer made up of glucose units extended with (1⟶4)-α linear glycosidic linkages
51 and branched with (1⟶6)-α glycosidic linkages, comprising two main molecules: amylose
52 (AM) and amylopectin (AP). AM is largely linear with a few long-chain branches and
53 molecular weight ~ 105–6, and AP is hyperbranched with numerous short chains and
54 molecular weight ~ 107–8. The structural features of AM and AP (including amylose fraction)
55 in starch affect its cooking, eating, nutritional and other physiochemical properties.
56 Rapid digestion of starch by humans can cause a sharp increase of plasma glucose and results
57 in very little starch reaching the lower bowel, which may lead to increased risk of obesity,
58 type 2 diabetes and colorectal cancers (Dona, Pages, Gilbert, & Kuchel, 2010). The
59 digestibility of starch can be affected by starch structure, including its molecular and granular
60 structure, crystal type, and granule size (Zhang, Venkatachalam, & Hamaker, 2006), and by
61 other types of causes such as food structure, texture, viscosity and interactions with other
62 components (Singh, Dartois, & Kaur, 2010) in a food matrix.
63 Components such as non-starch polysaccharides are always present in starch-containing
64 foods, and also can be added to starch-containing products during food processing to improve
ACCEPTED MANUSCRIPT
4
65 the texture, water mobility, stability and viscosity. It has been suggested that additives which
66 strongly increase the viscosity of starchy foods would decrease the hydrolysis rate of amylase,
67 contributing to nutritional benefits (Brennan, 2005; Dhital, Warren, Butterworth, Ellis, &
68 Gidley, 2015). One such additive is pectin, a cell-wall material mainly composed of
69 galacturonic acid (Yapo, 2011) and commonly used as gelling agent and stabilizer (Willats,
70 Knox, & Mikkelsen, 2006). Previous studies (Sasaki & Kohyama, 2012; Sasaki, Sotome, &
71 Okadome, 2015) have reported that the addition of pectin increased the viscosity of starch
72 suspensions and decreased the starch in vitro digestibility. They also suggested the pectin’s
73 suppressive effect on starch digestibility is related to a number of factors and is not only due
74 to the rheological properties. It is noted that what matters for diffusion control of a reaction is
75 the relative rate of diffusion of the reacting entities, which may or may not be related to the
76 bulk viscosity. While a pectin solution has a high bulk viscosity, the enzymes involved are
77 relatively small (~ 10 nm); at all except very high pectin concentration, the average space
78 between pectin molecules is much larger than 10 nm: that is, the local viscosity for the
79 enzyme is close to that of pure solvent. The hypothesis of the present paper is that a major
80 effect in this slowed digestion rate will be from some sort of interaction between starch and
81 pectin in the food matrix.
82 There have as yet been no studies of starch molecular structural changes during digestion in
83 the presence of pectin. Since such studies have yielded useful mechanistic information for
84 starch without additives, e.g. (Zhang, Sofyan, & Hamaker, 2008), it is useful to do the same to
85 understand any effects of pectin addition. This is implemented here using size-exclusion
86 chromatography (SEC, also known as GPC and HPLC-SEC) and fluorophore-assisted
87 carbohydrate electrophoresis (FACE) to characterize both the molecular size distributions of
88 whole starch molecules, using SEC, and the chain-length distributions (CLDs), using both
89 SEC for the amylose chains and FACE (which gives a very accurate CLD, but currently is
ACCEPTED MANUSCRIPT
5
90 confined to chains shorter than ~ 180 glucose units (Wu, Li, & Gilbert, 2014)) for the
91 amylopectin chains.
92 In the present work, a suspension of ungelatinized corn starch is used as substrate, and in vitro
93 digestion uses pancreatin and amyloglucosidase. Interactions between pectin and
94 amyloglucosidase are investigated by UV/visible absorption spectroscopy. Only one starch
95 and one pectin concentration are considered hre. However, the possible mechanism whereby
96 pectin affects the digestion rate would most likely be the same for different starch and pectin
97 concentrations. Sasaki and co-workers (Sasaki & Kohyama, 2012) showed that the same
98 concentration of pectin as used here significantly affected the digestion rate of starch, but did
99 not examine specific reasons for this effect. The present paper is based on this previous work
100 and elucidates the underlying mechanisms by measuring molecular structural evolution.
101 2. Materials and methods
102 2.1 Materials
103 Corn starch (S4126), pectin from citrus peel (P9135) and porcine pancreatic pancreatin
104 (P1750) were purchased from Sigma-Aldrich Co., US. Amyloglucosidase, isoamylase from
105 Pseudomonas sp. and a glucose content assay kit were from Megazyme International Ireland
106 Ltd., Ireland. Pullulan standards for SEC analysis were from Polymer Standards Service
107 (PSS) GmbH, Germany, and cover the molecular weight range 342 to 2.35 106. GR grade
108 dimethyl sulfoxide (DMSO) was from Merck Co. Other chemicals were reagent grade.
109 2.2 In vitro digestibility and fitting to first-order kinetics
110 The preparation of starch suspension and starch suspension mixed with pectin were carried
111 out following a method modified from the literature (Sasaki & Kohyama, 2012). Pectin (125
112 mg on dry basis per group) was dispersed with 7.5 mL of distilled water in six 50 mL screw-
113 capped tubes and stirred at 500 rpm for 35 min using a magnetic stirrer. Six tubes without
ACCEPTED MANUSCRIPT
6
114 pectin were also prepared. After complete dispersion (judged by a clear appearance), the
115 pectin solution was heated at 50°C for another 30 min with continuous stirring. Then 200 mg
116 of corn starch was added to each tube and thoroughly dispersed by vortex mixing, and 2 mL
117 of 0.125 M HCl solution was then added. The starch suspensions were incubated at 37°C with
118 vigorous magnetic stirring for 30 min. The pH of the starch suspensions was adjusted to 5.2
119 by adding ~ 0.5 mL of 2.5 M sodium acetate solution. To prepare the enzyme solution for
120 digestion, 20 mg of pancreatin (4 × USP specifications) and 1 mL of amyloglucosidase (3260
121 U/mL) were mixed and thoroughly dispersed in 50 mL of water. After centrifuging at 2000 g
122 for 10 min, the supernatant of the enzyme solution was heated at 37°C in a water bath before
123 use. The digestion of starch suspensions was then performed by adding 2.5 mL of enzyme
124 solution in each tube with magnetic stirring. After 0, 2, 4, 6, 8, 24 and 48 h of incubation,
125 absolute ethanol was added to each tube to stop the hydrolysis of starch. The glucose
126 concentration in the supernatant was determined by using the Megazyme glucose assay
127 content kit after centrifugation at 1500 g for 10 min.
128 Digestibility curves were then fitted to a first-order equation, which in integrated form is:
129 (1)𝐶𝑡 = 𝐶f(1 ‒ 𝑒 ‒ 𝑘𝑡)
130 is the percentage of starch digested at time t (min), Cf (where the subscript f is for “final”) 𝐶𝑡
131 is the estimated percentage of starch digested by the end of reaction time and k (min–1) is the
132 starch digestion rate coefficient.
133 In practice, Cf and k are measured using a logarithm-of-slope (LOS) analysis described in
134 detail elsewhere (Butterworth, Warren, Grassby, Patel, & Ellis, 2012) through a transformed
135 equation:
136 = (2)ln𝑑𝐶𝑡
𝑑𝑡 ln (𝐶f 𝑘) ‒ 𝑘𝑡
ACCEPTED MANUSCRIPT
7
137 The derivative dCt / dt is obtained using second-order finite difference. From eq 2, a plot of
138 the logarithm of this derivative against time yields Cf and k, if this plot is linear.
139 2.3. Size-exclusion chromatography
140 The whole-molecule SEC used an Agilent 1260 Infinity SEC system (Agilent, Santa Clara,
141 CA, USA) with a refractive index detector (RID, Optilab UT-rEX, Wyatt, Santa Barbara, CA,
142 USA) following a published method (Cave, Seabrook, Gidley, & Gilbert, 2009; Vilaplana &
143 Gilbert, 2010). Starch samples were dissolved in dimethyl sulfoxide (DMSO) with 0.5%
144 (w/w) LiBr at a concentration of 2 mg/mL. DMSO/LiBr is used as a solvent combination both
145 to dissolve starch completely and to minimize degradation (Schmitz, Dona, Castignolles,
146 Gilbert, & Gaborieau, 2009), and it is also used as the mobile phase for SEC analysis after
147 being filtered through a 0.45 μm hydrophilic Teflon membrane filter. Starch samples were
148 injected into a series of PSS separation columns (Polymer Standards Service, Mainz,
149 Germany): SUPREMA pre-column, Gram 30 and Gram 3000. The injection volume was 100
150 μL, the flow rate 0.3 mL/min, and the column oven temperature 80°C. A series of pullulan
151 standards with different peak molecular weights ranging from 342 to 2.35 × 10⁶ was used to
152 convert elution volume to molecular size (the SEC hydrodynamic volume, Vh, or the
153 equivalent hydrodynamic radius, Rh, which is the separation parameter for SEC) using the
154 Mark-Houwink equation. The Mark-Houwink parameters K and α of pullulan dissolved in
155 DMSO-LiBr solution at 80°C are 2.424 × 10⁻⁴ dL g–1 and 0.68 (Cave et al., 2009).
156 To characterize the CLDs, the starch samples were firstly debranched using isoamylase in a
157 0.1 M acetate buffer solution (pH 3.5) and freeze-dried overnight as described elsewhere
158 (Hasjim, Cesbron-Lavau, Gidley, & Gilbert, 2010; Tran et al., 2011). The starch samples after
159 freeze drying were dissolved in DMSO/LiBr solution for 24 h in a thermomixer at 80°C with
160 shaking at 350 rpm. The supernatant of samples were transferred to SEC vials for analysis
161 after centrifugation at 4000 g for 10 min. The debranched-starch SEC distribution was
162 measured using an Agilent 1100 SEC system with a refractive index detector (Shimadzu RID-
ACCEPTED MANUSCRIPT
8
163 10A, Shimadzu Corp., Kyoto, Japan) and a series of PSS columns (GRAM precolumn,
164 GRAM 30, and 1000 analytical columns) at a flow rate of 0.6 mL/min. As linear molecules,
165 the Vh of debranched starch can be converted to X, the degree of polymerization (DP), by the
166 Mark-Houwink relation. The SEC weight distribution of linear glucan molecules, w(logX),
167 can also be converted to the number distribution, Nde(X), which is the relative number of
168 chains of DP X, using Nde(X) = X–2 w(log X) (Clay & Gilbert, 1995; Shortt, 1993). The Mark-
169 Houwink parameters K and α for linear starch dissolved in DMSO-LiBr solution at 80°C are
170 1.5 × 10⁻⁴ dL g–1 and 0.743, respectively (Liu, Castro, & Gilbert, 2011).
171 2.4. Fluorophore-assisted carbohydrate electrophoresis
172 We use two complementary techniques for measuring the CLD. FACE provides very accurate
173 CLD data for the amylopectin chains, which are relatively short. Longer chains, i.e. those of
174 amylose, are characterized by SEC (which is not nearly as accurate as FACE for the
175 amylopectin chains because of artifacts such as band broadening and inaccuracies in relating
176 SEC elution volume to degree of polymerization for these short chains). The preparation of
177 debranched samples for FACE was the same as for SEC analysis. The debranched starch after
178 freeze drying was labelled with 8-aminopyrene-1, 3, 6, trisulfonic acid (APTS), following a
179 procedure given elsewhere (Wu et al., 2014). The labelled starch was separated in an N-CHO-
180 coated capillary using a voltage of 30 kV at 25°C with a carbohydrate separation buffer
181 (Beckman-Coulter). A PA-800 Plus FACE System (Beckman-Coulter, Brea, CA, USA)
182 equipped with a solid-state laser-induced fluorescence detector and an argon-ion laser, was
183 used to obtain Nde(X) as the peak area from the elugram. CLDs from FACE analysis are
184 presented as log10 of peak area (i.e. Nde(X) on a logarithmic axis) as function of X.
185 2.5 UV/visible absorption spectra of amyloglucosidase pectin solution
186 Interactions between macromolecules such as polysaccharides and proteins in solution are
187 common (Tolstoguzov, 2003). The intermolecular association between biopolymers will affect
ACCEPTED MANUSCRIPT
9
188 their molecular structures and properties. UV/visible spectroscopy is an effective method to study
189 the interactions between polysaccharides and proteins (Kholiya, Chaudhary, Vadodariya, &
190 Meena, 2016; Wu et al., 2017). The UV/visible absorption spectra of a range of mixed pectin
191 and amyloglucosidase solutions in water were measured with a UV-6100s UV-Vis
192 spectrophotometer (MAPADA instruments, Shanghai, China). The compositions of the
193 control (A) and experimental groups (B, C, D, E and F) of amyloglucosidase/pectin solutions
194 were shown in Table 1. In group A, the concentration of AMG, pH value and the ionic
195 strength are the same as used in the in vitro digestion experiment. Group B had a higher
196 concentration of AMG. No acetate buffer was used in group C and no AMG was added in
197 group D. In groups E and F, the AMG was absent.
198 The pectin/AMG solutions were also prepared and incubated in the same procedure in the
199 digestion part. The samples after incubation at 37°C for 0, 8, 24 and 48 h were centrifuged at
200 1000 rpm for 5 min to remove air bubbles, to which pectin-containing solutions are prone
201 because of the significantly increased viscosity. The samples were then transferred to quartz
202 cuvettes and UV-Vis spectra then measured.
203 2.6 Viscosity measurements
204 Samples viscosities were measured using a rotational viscometer (NDJ-5S, Changji Shanghai)
205 at 37°C and 12 rpm with a No. 28 spindle. The suspensions with sodium acetate buffer were
206 heated to 37°C before measurement.
207 2.7 Statistical analysis.
208 Analysis of variance (ANOVA) with the general linear model and Tukey’s pairwise
209 comparisons in Minitab 16 (Minitab Inc., State College, PA, USA) were used for statistical
210 analysis. Significant differences of the mean values were determined at p < 0.05.
211
ACCEPTED MANUSCRIPT
10
212 3. Results and discussion
213 3.1 Starch digestion profiles
214 Figure 1A shows the change in starch digestion ratio of the pure starch solution and the mixed
215 solution of starch and pectin with digestion time; these plots are linear within experimental
216 uncertainty. Although the value of Cf estimated from the digestibility curves can be
217 unreliable, the rate coefficients (k values) encompass all the kinetic behaviour and reveal
218 whether changes occur in digestion rate from rapid to slow as digestion proceeds (Butterworth
219 et al., 2012). In Figure 1A, the pure starch and starch/pectin mixtures had similar digestion
220 trends with a rapid digestion in the first 10 h digestion followed by a much slower digestion
221 rate in the later digestion time, which follows first-order loss kinetics over the whole time
222 course (Figure 1B). The digestion rates of the pure starch solutions were always higher than
223 those of starch/pectin mixture, with first-order rate coefficients of 0.0016 and 0.0012 min–1
224 respectively, a reduction of 25%.
225 As mentioned above, the suppressive effect of pectin on digestion of both ungelatinized high-
226 amylose corn starch and gelatinized potato starch has been reported in the literature (Sasaki &
227 Kohyama, 2012; Sasaki et al., 2015). Sasaki and co-workers investigated the effects of several
228 polysaccharides, including pectin, guar gum, konjac glucomannan and xanthan gum, on the
229 starch’s in vitro digestibility, and they found that the starch solutions with highest viscosities
230 were not those with the slowest digestion rate, and that pectin with relatively low viscosity
231 showed a moderate effect on starch hydrolysis (Sasaki & Kohyama, 2012). Further, pectin’s
232 suppressive effect on gelatinized potato starch’s digestion was weakly dependent on its
233 concentration, unlike other non-starch polysaccharides (Sasaki et al., 2015). However,
234 pectin’s effect on the digestibility could not only have arisen from higher viscosities and the
235 resulting slowed diffusion. In the 2015 paper, pectin was found to significantly reduce starch
ACCEPTED MANUSCRIPT
11
236 hydrolysis and the glucose level at 60 min after ingestion. This result may arise from an
237 interaction between pectin and amylase.
238 From the LOS plots shown in Figure 1B, the curves of the pure starch solutions and the starch
239 solutions in presence of the pectin were similar, although the actual slope was different. LOS
240 plots of processed starch products can have two or more linear regions, while only one has
241 been seen for natural starch (Zou, Sissons, Gidley, Gilbert, & Warren, 2015). Furthermore, it
242 has been shown that starch digestion enzymes (α-amylase, amyloglucosidase and pepsin)
243 could not hydrolyse pectin (CarvalhoMunarin, Tanzi, & Petrini, 2012). Thus the decrease of
244 starch digestion rate in the presence of pectin must be due to physical rather than chemical
245 factors. Two possible explanations for this are: 1) enzymes bound with pectin, hindering the
246 access of the enzymes to the inner starch granules; 2) the slower diffusion rate of the enzymes
247 due to the increased viscosity of the starch suspensions in the presence of pectin.
248 The viscosity of the starch/pectin sample was much higher (5100 mPa•s) than that of pure
249 starch (10 mPa•s). (Parenthetically, this increased viscosity of pectin suspension created some
250 experimental difficulties: for instance, it was difficult to fully disperse starch powder in pectin
251 solution, and vigorous agitation was required; the increased viscosity also made it hard to
252 accurately transfer a given volume, and thus such transfer was always done by weight, not
253 volume.) The disproportionate decrease in digestion rate with the increase in viscosity
254 indicated that any pectin-related viscosity effect was not likely to be the limiting factor in
255 starch digestion. As mentioned above, Sasaki & Kohyama (2012) reported that the starch
256 digestion rate was not changed with increasing viscosity above a critical value. It is
257 reasonable to suppose that hydrogen bonding and/or other interactions between the enzymes
258 and substrate is a major determinant of the decreased starch digestion rate.
259 The amount of enzymes used in this experiment was much less than that in some previous
260 digestion studies (Syahariza, Sar, Tizzotti, Hasjim, & Gilbert, 2013; Witt, Gidley, & Gilbert,
ACCEPTED MANUSCRIPT
12
261 2010), leading to a slower starch digestion rate. This was done for easier correlation with
262 starch molecular structure throughout the whole digestion time, especially at the rapid
263 digestion stage.
264 3.2 SEC weight distributions and CLDs of starch in digesta
265 The time evolution of the debranched SEC weight distributions, w(log Rh), of samples with
266 and without pectin, normalized to the starch content in the digesta, is given in Figure 2 in two
267 different ways. Figure 2A and B show the data as line plots; C and D are three-dimensional
268 plots of the same data for better presentation to show the progression of the digestion in time.
269 As normally seen for native starch, two peaks were observed, arising from amylopectin (small
270 Rh) and amylose (large Rh) respectively, with the separation point at Rh ~ 5 nm
271 (corresponding to X ~ 100). This point (obtained from the RI signal of the debranched weight
272 distribution data) was then used to define the region of amylose in the SEC distribution plot.
273 The amylose fraction shown in Table 2 was calculated using a method described previously
274 (Vilaplana, Hasjim, & Gilbert, 2012) as the ratio of amylose region’s SEC debranched
275 distribution area under the curve (AUC) to the entire SEC distribution plot’s AUC (note that it
276 was shown in this reference that the fully branched SEC distribution, Fig. 4, cannot be used
277 for this purpose). In the starch/pectin group, the highest peak remained at Rh ~ 1 nm
278 throughout the digestion, while a new peak around Rh = 4 nm gradually appeared during the
279 digestion. The process is more clearly observed in Figure 2 D. In the pure starch group, the
280 peak at Rh ~ 1 nm was the highest in the first 24 h. After 48 h digestion, the highest peak
281 changed to Rh ~ 4 nm. The observation is consistent with a previous study (Witt et al., 2010),
282 where it was found that a small starch species was formed during digestion. In Witt’s paper,
283 the Rh of the digestion-generated starch species was ~ 2 nm; the slightly different Rh seen
284 here may be because of the different amylolysis procedure. The proportion of this digestion-
285 generated small starch species in the pure starch group is higher than that in the starch/pectin
ACCEPTED MANUSCRIPT
13
286 group, resulting in a higher proportion of amylose (~ 37%) in the starch group after 48 h
287 digestion, as shown in Table 2.
288 Debranched size distributions of digesta (Figure 2 and Table 2) show that the amylose
289 fraction and the debranched CLDs are similar for samples with and without pectin over the
290 first 24 h digestion. Thus whatever the nature of the interaction between starch and pectin, it
291 clearly had no significant effect on the great majority of individual chains. This is not
292 surprising, because of the low concentration of pectin relative to starch: an individual chain is
293 unlikely to have significant interaction with a portion of a pectin molecule. However, the
294 digesta of pure starch after 48 h of digestion contained higher proportions of AM than that of
295 starch with pectin (Figure 2); this late-digested material is sometimes termed “resistant
296 starch”.
297 The FACE data, Figure 3, shows the features previously reported in the literature (Wu, Witt,
298 & Gilbert, 2013). Note that the normalization of such distributions is arbitrary; because the
299 amount of starch present in samples taken at later times is very small, we show the features in
300 these CLD data by normalizing all to have the same maximum value rather than to the amount
301 of starch. The main features are a first peak (DP ~6 – 35) corresponding to chains confined to
302 a single lamella, and a second peak (DP ~36 – 100) corresponding to chains spanning more
303 than one lamella (Wu, Morell, & Gilbert, 2013). It is explained in this reference that the
304 parameters obtained from this model fitting replace the more common method of defining
305 fractions from chains in arbitrarily defined regions. Chains longer than DP 100 are mostly
306 considered as amylose, although there also might be some extra-long amylopectin chains
307 (Hanashiro et al., 2008). During the digestion, the most interesting phenomenon is that the
308 peaks of longer amylopectin chains (DP > 60) in the mixture group are always lower than
309 those of the pure starch group. This result indicates that the presence of pectin has an effect on
310 the digestion of long amylopectin chains more than the shortest ones. In addition, the longest
311 chains in starch group with DP > 100 in the first 24 h were hydrolysed to about DP 70 at 48 h.
ACCEPTED MANUSCRIPT
14
312 In comparison, with added pectin, the longest chains (DP > 100) were hydrolysed to DP 90 at
313 24 h and finally DP 60 at 48 h. CLDs after 48 h of digestion were significantly different from
314 those of other time points, as is also seen in whole size distribution and debranched size
315 distribution (Figures 2 and 4). For pure starch, the plots of longer AP chains to shorter chains
316 was higher than that of the starch/pectin samples throughout the entire time range examined,
317 showing the relative digestion rate of shorter chains, compared with longer chains, was
318 reduced with the addition of pectin.
319 Figure 4 shows the time evolution of the SEC weight distribution of the whole molecules as
320 functions of the hydrodynamic radius. Both groups show the usual bimodal features. The
321 molecules with Rh up to 75 nm, with peak at Rh ~15 nm, are amylose, and the molecules with
322 Rh larger than 75 nm, with peak at Rh ~200 nm, are amylopectin. There are no qualitative
323 differences in the behaviour of starch compared to that of starch plus pectin. This behaviour is
324 typical to that seen and discussed in detail previously (Witt et al., 2010).
325 The CLDs (Figures 2 and 3) show that a larger amount of longer AP chains were digested in
326 the starch/pectin system than in pure starch, suggesting that the hydrolysis of amylopectin by
327 amylase has chain length selectivity after adding pectin. The digestion of native starch
328 undergoes an “inside-out” or “side-by-side” pattern (Zhang, Ao, & Hamaker, 2006), and it
329 was reported that the molecular structure of amylopectin showed only minor changes during
330 the digestion of native starch because of a relatively non-specific attack of digestive enzymes
331 on amylopectin microstructure (Shrestha et al., 2012; Zhang et al., 2006). However, the
332 observed preference of the hydrolysis of longer AP chains in this study suggests that the
333 addition of pectin altered the hydrolysis pattern of the enzyme with starch. The effect might
334 be due to chain-length-dependent interactions involving the enzyme and pectin.
ACCEPTED MANUSCRIPT
15
335 3.3 UV/visible spectra of pectin/AMG solutions
336 The structure and properties of proteins can be affected by polysaccharides via various
337 interactions (Turgeon, Beaulieu, Schmitt, & Sanchez, 2003; Turgeon, Schmitt, & Sanchez,
338 2007). For example, in a previous study (Dhital et al., 2015), cellulose was found to inhibit α-
339 amylase’s in vitro digestion activity, and the interaction was reversible and non-specific. The
340 presence of interactions between pectin and AMG is checked here by UV/visible
341 spectroscopy. UV/visible spectra of the six kinds of pectin/AMG solutions are presented in
342 Figure 5. In Groups A, B and C, the absorbance intensity increased during the incubation. In
343 Groups D, E and F, the absorbance was unchanged. The absorbance peak at ~ 100 nm is due
344 to water and the peak at ~ 280 nm is attributed to phenyl groups in the enzymes.
345 Group A is the control group. The absorbance of Group A increased over the incubation
346 period, indicating pectin and AMG interacted with each other in the buffer. Group B had
347 higher concentration of AMG compared to Group A. The absorbance and the increment of
348 absorbance of samples in group B were all higher than in group A, suggesting that the degree
349 of interaction is in direct proportion to the AMG concentration. In group B, the absorbance
350 peaks of protein (AMG) at 280 nm were the most obvious. The absorbance intensity of AMG
351 rose during the incubation, but the symmetrical shape of the peak gradually disappeared. This
352 is probably caused by the substantial increase of background absorbance. The maximum
353 absorbance wavelength of AMG peak also decreased from 278 nm (0 h) to 272 nm (48 h).
354 Group C had no acetate buffer, and the increase absorbance was less obvious than in groups A
355 and B. This showed the extent of interaction between pectin and AMG decreased in the
356 absence of sodium acetate, indicating the interaction is ionic-strength and/or pH dependent.
357 The spectra of group D, E and F remained stable during the incubation, demonstrating the
358 increase of absorbance in the first three groups came from the interaction between pectin and
359 AMG but not self-aggregation of AMG or other possibilities.
ACCEPTED MANUSCRIPT
16
360 The changes of the UV/visible absorption spectrum reflect interactions between AMG and
361 pectin. The interactions leading to complex formation between polysaccharides and proteins
362 can be classified into two kinds: specific interaction such as covalent linkages, and non-
363 specific interactions such as electrostatic interactions, hydrophobic interactions, van de Waals
364 forces and hydrogen bonding (Girard, Turgeon, & Gauthier, 2002). The non-specific
365 interaction between AMG and pectin may be electrostatic interaction and/or hydrogen
366 bonding. The interactions between pectin and AMG provides an explanation for at least some
367 of the observed change in digestion kinetics and the decreased digestion rate of short
368 amylopectin chains compared to long ones. The contribution from a viscosity effect is also a
369 possibility, but previous studies have demonstrated that it could not be the only reason (Sasaki
370 & Kohyama, 2012; Sasaki et al., 2015). The overall reduction in the digestion rate and fewer
371 short AP chains in starch/pectin mixture are thus ascribed to the association between AMG
372 and pectin, while viscosity effects may also play a role.
373
374 4. Conclusions
375 Addition of pectin to starch slows in vitro enzymatic starch digestion; first-order kinetics are
376 followed both with and without pectin, with the rate coefficient for starch/pectin being much
377 less than that for starch alone. The amylose to amylopectin ratio basically remains the same
378 with and without pectin during most of the digestion but at later times with pectin, the
379 digestion rate of longer amylopectin chains was slower than that of shorter amylopectin
380 chains. An association between the digestion enzyme amyloglucosidase and pectin was seen
381 in UV/visible spectra, ascribed to electrostatic complexation and and/or hydrogen bonding.
382 The slowed digestion rate in starch/pectin might have a contribution from slowed diffusion
383 because of the much greater bulk viscosity, but for reasons given above, this is unlikely to be
384 the sole effect. Association between amyloglucosidase and pectin is highly likely to change
ACCEPTED MANUSCRIPT
17
385 the conformation of the enzyme and/or hinder access of it to starch, and is seen as the
386 principal reason for the slowed rate. This is consistent with the slower rate of digestion of
387 longer amylopectin chains, because these may be harder to undergo interaction with the
388 binding site of a hindered or conformationally-altered enzyme. Complex formation between
389 proteins and polysaccharides, and how these might change interfacial enzymatic reactions or
390 selective delivery of protein peptides during food digestion, are of interest. One significance
391 of these findings is in methods of increasing the amount of resistant starch (which depends to
392 some extent on the presence of longer chains) in a food formulation through the presence of
393 pectin, which is a common food additive.
394
395 Acknowledgements
396 We thank the National Science Foundation of China (grant C130401 3151101138). We
397 appreciate the contributions of Shiqing Zhou, Prudence Powell and Wenwen Yu for FACE
398 and SEC analysis, and Wei Zou for discussions.
399
400 Figure captions
401 Figure 1. Digestion curves (A) and LOS plots (B) of pure starch (full line) and starch/pectin
402 mixture (dashed line). The finite-difference method used for the LOS plot does not calculate
403 the slopes at the initial and final points, and thus the range of the time axis for the LOS plots
404 are less than that of the digestion curve from which they are derived.
405 Figure 2. Two-dimensional (A and B) and three-dimensional (C and D) plots of debranched
406 digesta size distributions from pure starch solutions (A and C) and starch/pectin solutions (B
407 and D). Here and in subsequent figures, the same data are presented in two different ways to
ACCEPTED MANUSCRIPT
18
408 help distinguish different aspects of the data: as multiple lines on the same plot (2D), and as
409 surfaces at different times. All distributions have been normalized to starch content, which
410 decreases as digestion proceeds.
411 Figure 3. Chain length distributions (CLDs) of starch in digesta from starch solutions with
412 (full line) and without pectin (dashed line). Figure 2A to F represent the results of CLDs
413 obtained from 0, 2, 4, 8, 24 and 48 h digestion time, respectively. All the distributions have
414 been normalized to their highest peak.
415 Figure 4. Two-dimensional (A and B) and three-dimensional (C and D) plots of whole
416 molecular size distributions of starch digesta from pure starch (A and C) and starch/pectin
417 mixtures (B and D). All the distributions have been normalized to starch content.
418 Figure 5. The UV-Vis spectra of different solutions: (A) AMG (0.4 μL/mL)-pectin-buffer; (B)
419 AMG (4 μL/mL)-pectin-buffer; (C) AMG-pectin-H2O-9 μL 0.125 M HCl; (D) pectin-buffer;
420 (E) AMG-buffer; (F) buffer.
421 Table captions
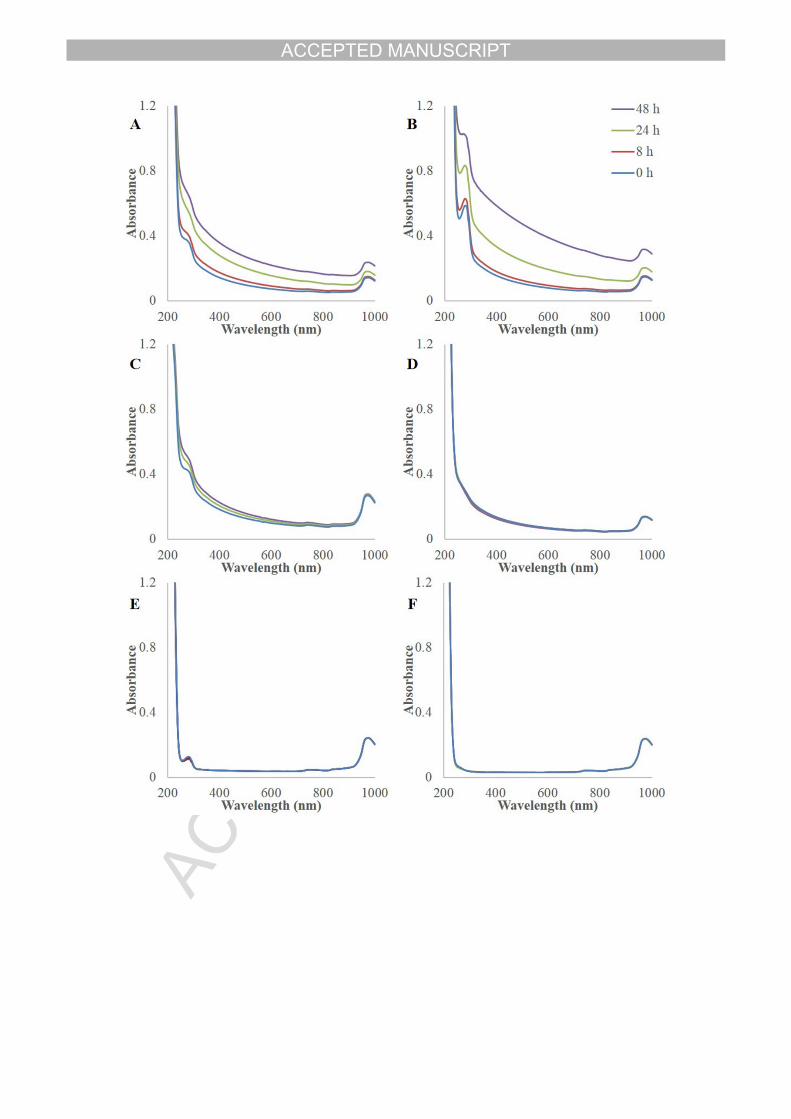
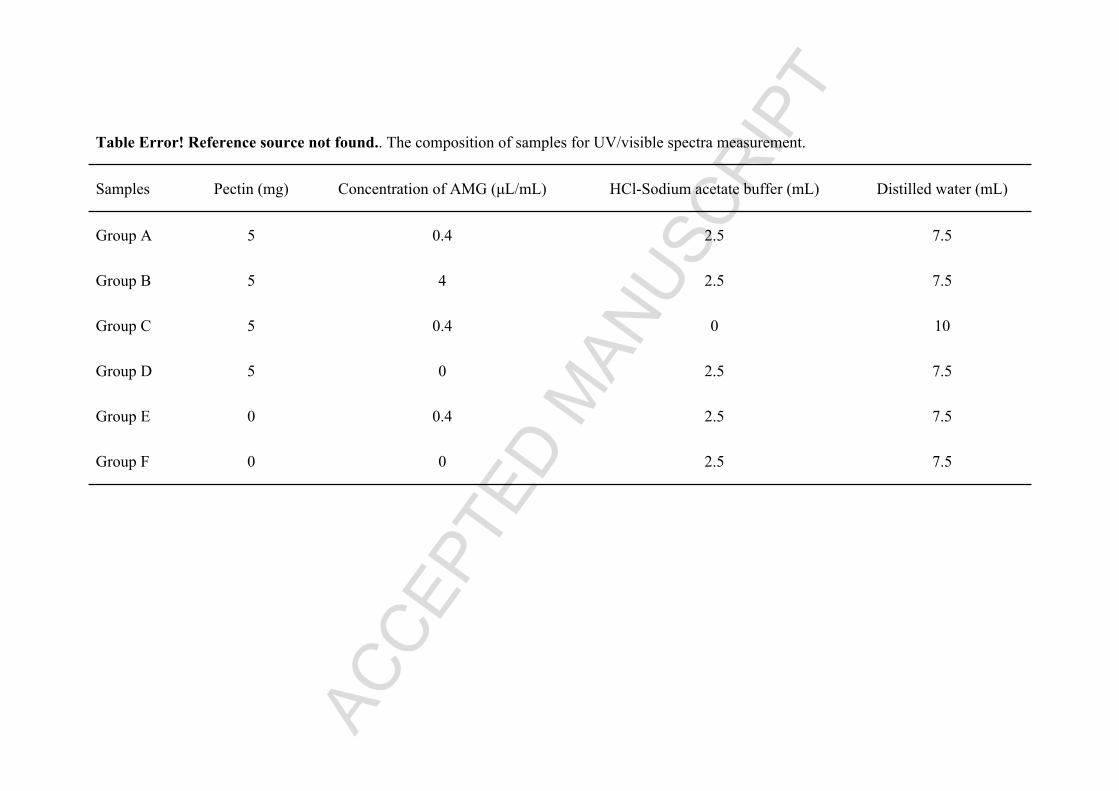
422 Table 1. The composition of samples for measurement of UV/visible spectra.
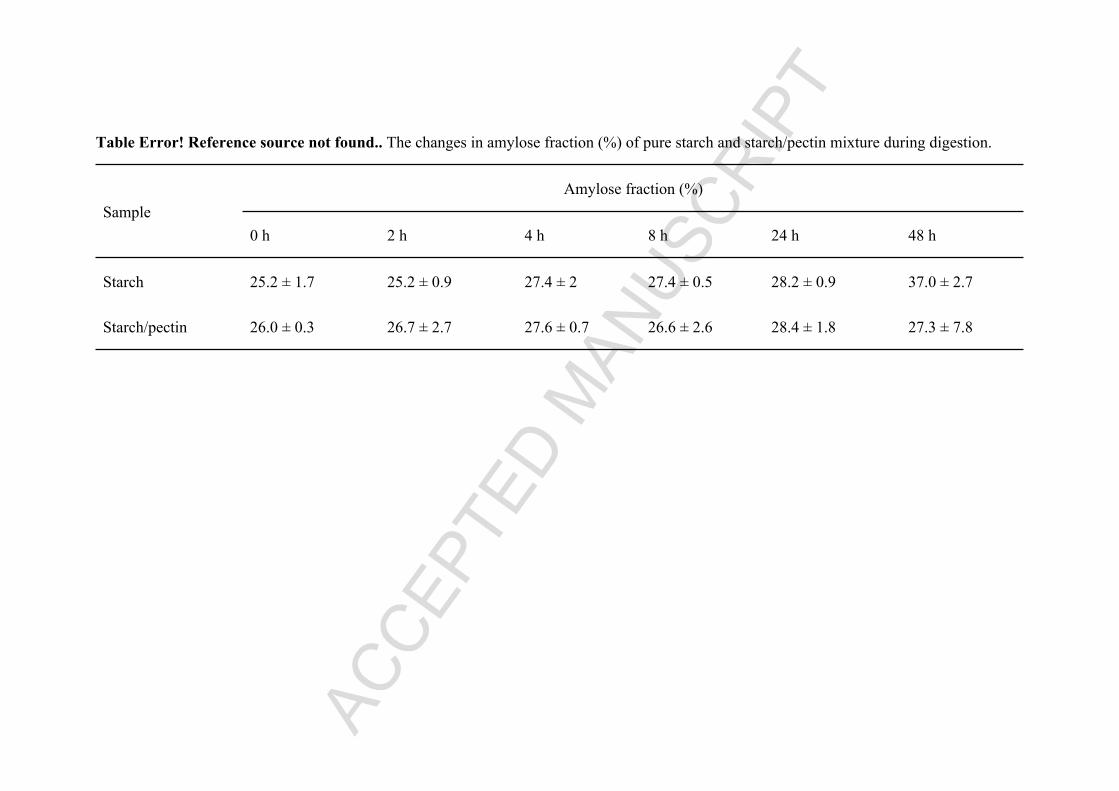
423 Table 2. The changes in amylose fraction (%) of pure starch and starch/pectin mixture during
424 digestion.
425
426
ACCEPTED MANUSCRIPT
19
427 References
428 Brennan, C. S. (2005). Dietary fibre, glycaemic response, and diabetes. Molecular Nutrition & Food 429 Research, 49(6), 1613-4125.430 Butterworth, P. J., Warren, F. J., Grassby, T., Patel, H., & Ellis, P. R. (2012). Analysis of starch 431 amylolysis using plots for first-order kinetics. Carbohydrate Polymers, 87(3), 2189-2197.432 CarvalhoMunarin, F., Tanzi, M. C., & Petrini, P. (2012). Advances in biomedical applications of pectin 433 gels. Int J Biol Macromol, 51(4), 681-689.434 Cave, R. A., Seabrook, S. A., Gidley, M. J., & Gilbert, R. G. (2009). Characterization of starch by size-435 exclusion chromatography: the limitations imposed by shear scission. Biomacromolecules, 436 10(8), 2245-2253.437 Clay, P. A., & Gilbert, R. G. (1995). Molecular weight distributions in free-radical polymerizations. 1. 438 Model development and implications for data interpretation. Macromolecules, 28, 552-569.439 Dhital, S., Gidley, M. J., & Warren, F. J. (2015). Inhibition of alpha-amylase activity by cellulose: 440 Kinetic analysis and nutritional implications. Carbohydrate Polymers, 123(1), 305-312.441 Dhital, S., Warren, F. J., Butterworth, P. J., Ellis, P. R., & Gidley, M. J. (2015). Mechanisms of Starch 442 Digestion by alpha-amylase-structural Basis for Kinetic Properties. Crit Rev Food Sci Nutr, 0.443 Dona, A. C., Pages, G., Gilbert, R. G., & Kuchel, P. W. (2010). Digestion of starch: in vivo and in vitro 444 kinetic models used to characterise glucose release. Carbohydrate Polymers, 80(3), 599–617.445 Girard, M., Turgeon, S. L., & Gauthier, S. F. (2002). Interbiopolymer complexing between β-446 lactoglobulin and low- and high-methylated pectin measured by potentiometric titration and 447 ultrafiltration. Food Hydrocolloids, 16(6), 585-591.448 Hanashiro, I., Itoh, K., Kuratomi, Y., Yamazaki, M., Igarashi, T., Matsugasako, J.-i., & Takeda, Y. (2008). 449 Granule-bound starch synthase I is responsible for biosynthesis of extra-long unit chains of 450 amylopectin in rice. Plant and Cell Physiology, 49(6), 925-933.451 Hasjim, J., Cesbron-Lavau, G., Gidley, M. J., & Gilbert, R. G. (2010). In vivo and in vitro starch 452 digestion: Are current in vitro techniques adequate? Biomacromolecules, 11(12), 3600-3608.453 Hoang, N.-L., Landolfi, A., Kravchuk, A., Girard, E., Peate, J., Hernandez, J. M., Gaborieau, M., 454 Kravchuk, O., Gilbert, R. G., Guillaneuf, Y., & Castignolles, P. (2008). Toward a full 455 characterization of native starch: separation and detection by size-exclusion 456 chromatography. Journal of Chromatography A, 1205(1-2), 60-70.457 Kholiya, F., Chaudhary, J. P., Vadodariya, N., & Meena, R. (2016). Synthesis of bio-based aldehyde 458 from seaweed polysaccharide and its interaction with bovine serum albumin. Carbohydrate 459 Polymers, 150, 278-285.460 Liu, W.-C., Castro, J. V., & Gilbert, R. G. (2011). Rate coefficients for enzyme-catalyzed reactions from 461 molecular weight distributions. Polymer, 52(7), 1490-1494.462 Sasaki, T., & Kohyama, K. (2012). Influence of non-starch polysaccharides on the in vitro digestibility 463 and viscosity of starch suspensions. Food Chemistry, 133(4), 1420-1426.464 Sasaki, T., Sotome, I., & Okadome, H. (2015). In vitro starch digestibility and in vivo glucose response 465 of gelatinized potato starch in the presence of non-starch polysaccharides. Starch-Starke, 466 67(5-6), 415-423.
ACCEPTED MANUSCRIPT
20
467 Schmitz, S., Dona, A. C., Castignolles, P., Gilbert, R. G., & Gaborieau, M. (2009). Quantification of the 468 Extent of Starch Dissolution in Dimethylsulfoxide by 1H NMR spectroscopy. Macromolecular 469 Bioscience, 9(5), 506-514.470 Shortt, D. W. (1993). Differential molecular weight distributions in high performance size exclusion 471 chromatography. J. Liquid Chromat., 16(16), 3371-3391.472473 Shrestha, A. K., Blazek, J., Flanagan, B. M., Dhital, S., Larroque, O., Morell, M. K., Gilbert, E. P., & 474 Gidley, M. J. (2012). Molecular, mesoscopic and microscopic structure evolution during 475 amylase digestion of maize starch granules. Carbohydr. Polym., 90(1), 23-33.476 Singh, J., Dartois, A., & Kaur, L. (2010). Starch digestibility in food matrix: a review. Trends in Food 477 Science & Technology, 21(4), 168-180.478 Syahariza, Z. A., Sar, S., Tizzotti, M., Hasjim, J., & Gilbert, R. G. (2013). The importance of amylose and 479 amylopectin fine structures for starch digestibility in cooked rice grains. Food Chem., 136(2), 480 742-749.481 Tolstoguzov, V. (2003). Some thermodynamic considerations in food formulation. Food 482 Hydrocolloids, 17(1), 1-23.483 Tran, T. T. B., Shelat, K. J., Tang, D., Li, E., Gilbert, R. G., & Hasjim, J. (2011). Milling of rice grains: the 484 degradation on three structural levels of starch can be independently controlled during 485 grinding. J. Ag. Food Chem., 59(8), 3964-3973.486 Turgeon, S. L., Beaulieu, M., Schmitt, C., & Sanchez, C. (2003). Protein–polysaccharide interactions: 487 phase-ordering kinetics, thermodynamic and structural aspects. Current Opinion in Colloid & 488 Interface Science, 8(4-5), 401-414.489 Turgeon, S. L., Schmitt, C., & Sanchez, C. (2007). Protein–polysaccharide complexes and coacervates. 490 Current Opinion in Colloid & Interface Science, 12(4-5), 166-178.491 Vilaplana, F., & Gilbert, R. G. (2010). Characterization of branched polysaccharides using multiple-492 detection size separation techniques. J. Separation Sci., 33(22), 3537–3554.493 Vilaplana, F., Hasjim, J., & Gilbert, R. G. (2012). Amylose content in starches: towards optimal 494 definition and validating experimental methods. Carbohydrate Polymers, 88(1), 103-111.495 Willats, W. G. T., Knox, J. P., & Mikkelsen, J. D. (2006). Pectin: new insights into an old polymer are 496 starting to gel. Trends in Food Science & Technology, 17(3), 97-104.497 Witt, T., Gidley, M. J., & Gilbert, R. G. (2010). Starch digestion mechanistic information from the time 498 evolution of molecular size distributions. J. Agric. Food Chem., 58(14), 8444-8452.499 Wu, A. C., Li, E., & Gilbert, R. G. (2014). Exploring extraction/dissolution procedures for analysis of 500 starch chain-length distributions. Carbohydrate Polymers, 114(1), 36-42.501 Wu, A. C., Morell, M. K., & Gilbert, R. G. (2013). A parameterized model of amylopectin synthesis 502 provides key insights into the synthesis of granular starch. PLoS ONE, 8(6), e65768.503 Wu, A. C., Witt, T., & Gilbert, R. G. (2013). Characterization methods for starch-based materials: state 504 of the art and perspectives. Australian Journal of Chemistry, 66(12), 1550-1563.505 Wu, S., Lai, M., Luo, J., Pan, J., Zhang, L.-M., & Yang, L. (2017). Interactions between α-amylase and 506 an acidic branched polysaccharide from green tea. Int J Biol Macromol, 94, 669-678.
ACCEPTED MANUSCRIPT
21
507 Yapo, B. M. (2011). Pectic substances: From simple pectic polysaccharides to complex pectins—A 508 new hypothetical model. Carbohydrate Polymers, 86(2), 373-385.509 Zhang, G., Ao, Z., & Hamaker, B. R. (2006). Slow Digestion Property of Native Cereal Starches. 510 Biomacromolecules, 7(7), 3252-3258.511 Zhang, G., Sofyan, M., & Hamaker, B. R. (2008). Slowly digestible state of starch: mechanism of slow 512 digestion property of gelatinized maize starch. J. Ag. Food Chem., 56(12), 4695-4702.513 Zhang, G., Venkatachalam, M., & Hamaker, B. R. (2006). Structural Basis for the Slow Digestion 514 Property of Native Cereal Starches. Biomacromolecules, 7, 3259-3`266.515 Zou, W., Sissons, M., Gidley, M. J., Gilbert, R. G., & Warren, F. J. (2015). Combined techniques for 516 characterising pasta structure reveals how the gluten network slows enzymic digestion rate. 517 Food Chemistry, 188, 559-568.
518
519
520
ACCEPTED MANUSCRIPT
Table Error! Reference source not found.. The composition of samples for UV/visible spectra measurement.
Samples Pectin (mg) Concentration of AMG (μL/mL) HCl-Sodium acetate buffer (mL) Distilled water (mL)
Group A 5 0.4 2.5 7.5
Group B 5 4 2.5 7.5
Group C 5 0.4 0 10
Group D 5 0 2.5 7.5
Group E 0 0.4 2.5 7.5
Group F 0 0 2.5 7.5
ACCEPTED MANUSCRIPT
Table Error! Reference source not found.. The changes in amylose fraction (%) of pure starch and starch/pectin mixture during digestion.
Amylose fraction (%)Sample
0 h 2 h 4 h 8 h 24 h 48 h
Starch 25.2 ± 1.7 25.2 ± 0.9 27.4 ± 2 27.4 ± 0.5 28.2 ± 0.9 37.0 ± 2.7
Starch/pectin 26.0 ± 0.3 26.7 ± 2.7 27.6 ± 0.7 26.6 ± 2.6 28.4 ± 1.8 27.3 ± 7.8