Page 1
Environ. Eng. Res. 2016
Research Article http://dx.doi.org/10.4491/eer.2016.037 pISSN 1226-1025 eISSN 2005-968X In Press, Uncorrected Proof
Effects of pH, molar ratios and pre-treatment on phosphorus recovery through struvite crystallization from effluent of anaerobically digested swine wastewater
Maneechotiros Daegi Kim1, Kyung Jin Min2,3, Kwanyong Lee4, Min Sung Yu2, and Ki Young Park2†
1Institute for Advanced Engineering, Gyeonggi-do 17180, Korea 2Department of Civil and Environmental System Engineering, Konkuk University, Seoul 05029, Korea 3AinChemTech Co., Ltd and EPS Solution Co., Ltd, Gyunggi-do, Korea 4Korea Institute of Civil Engineering and Building Technology, Gyeonggi-do 10223, Korea
Abstract Struvite precipitation has been proven to be an effective method in removing and recovering ammonia nitrogen (N) and phosphate phosphorus (P) from wastewater. In this study, effects of pH, molar ratios and pre-treatment of effluent of anaerobically digested swine wastewater were investigated to improve struvite crystallization. The magnesium: ammonium: phosphate ratio of 1.2 : 1.0 : 1.0 was found to be optimal, yet the molar ratio in the wastewater was 1 : 74.9 : 1.8. From the analysis, the optimum pH was between 8.0 and 9.0 for maximal phosphate P release and from 8.0 to 10.0 for maximal ammonia N and phosphate P removal from real wastewater. Analysis from Visual MINTEQ predicted the pH range of 7-11 for ammonia N and phosphate P removal and recovery as struvite. For pre-treatment, microwave pre-treatment was ineffective for phosphate P release but ultrasound pre-treatment showed up to 77.4% phosphate P release at 1,000 kJ/L of energy dose. Precipitates analysis showed that phosphorus and magnesium in the collected precipitate had almost same values as theoretical values, but the ammonia content was less than the theoretical value. Keywords: Ammonia and phosphate recovery, Magnesium ammonium phosphate, Pre-treatment, Struvite, Ultrasonic treatment
This is an Open Access article distributed under the terms of the Creative Commons Attribution Non-Commercial Li- cense (http://creativecommons.org/licenses/by-nc/3.0/)
which permits unrestricted non-commercial use, distribution, and repro- duction in any medium, provided the original work is properly cited.
Received February 29, 2016 Accepted September 6, 2016 † Corresponding Author E-mail: [email protected] Tel: +82-2-450-3736 Fax: +82-2-450-3726
Copyright © 2016 Korean Society of Environmental Engineers http://eeer.org
Page 3
1. Introduction
Recently livestock wastewater treatment and recycling in South Korea have become a big issue as
animal wastewater generation has reached to about 46,000 Mm3/y. Also, the wastewater from the pig
farming industry poses serious social and economic problems due to the negative effect on the
environment with respect to treatment and recycling of swine wastewater [1-2]. The treatment and
recovery of nutrient from the waste stream is important, since swine wastewater contains high
concentrations of nitrogen and phosphorus that cause eutrophication in water bodies. Recently, the
depletion of phosphorus resources has been a big issue, which has been discussed on a global basis
[3], although it is estimated that 7,000 billion kg of phosphate rock still exists [2].
Phosphorus as well as nitrogen in swine wastewater after anaerobic digestion has been widely
used as a liquid fertilizer in Korea. However, the quick-release fertilizer application is a principal
source of nitrogen and phosphorus pollution in the farming field, causing water pollution. Alternative
methods, however, such as crystallization and adsorption processes have been developed to recover
nutrients to high quality [4-6]. Among these techniques, the crystallization process of the magnesium
ammonium phosphate (MAP, also known as struvite) is considered to be one of the better techniques,
as struvite crystallization is cost-effective and yields high-quality nutrients, used as valuable slow-
release fertilizers [7-9].
Struvite (MgNH4PO4·6H2O) is a crystalline substance consisting of magnesium, ammonium,
and phosphate ions in equal molar concentrations. Struvite crystal is commonly formed as scale after
anaerobic digestion on pipe walls and reactor vessels. The chemical equation for struvite crystal
formation is as follows [10]:
Mg2+ + NH4+ + HPO4
2- + 6H2O → MgNH4PO4〮6H2O + H+ (1)
Struvite precipitation from wastewater is influenced by a large number of parameters such as pH of
Page 4
the reaction, molar ratio, interfering ions in the feed, reaction time, types of chemicals added, types of
the reactor used and temperature. From these, the reaction pH and molar ratios of reactants, namely
magnesium: ammonium: phosphate molar ratios, are the main factors for struvite precipitation.
The pH of the reaction plays a significant role during struvite precipitation process, and not only
affects the amount of struvite precipitation, but also its purity. Increasing the pH and the reactant
concentration can reach solution saturation but increasing the pH of the solution is more feasible and
allows for more varied applications [11]. Struvite can be precipitated at a wide pH range (from 7.0 to
11.5), but the suitable pH range is from 8.0 to 9.5. Struvite precipitation is a physico-chemical
process that can occur over a range of pH values bounded by the speciation of struvite components so
that the concentrations of magnesium, ammonium and phosphate ions can be affected by the pH of
the solution [12]. A variety of magnesium and phosphate complex ions patterns in the reactor
solution, including MgOH+, Mg(OH)3-, MgH2PO4
+, MgHPO4, H3PO4, H2PO4-, HPO4
-2 , MgPO4- can
be formed when the pH of solution is varied [13].
The pH of the solution in the struvite precipitation reactor influences struvite solubility. With
increasing the pH, the struvite solubility decreases, but the solubility begins to increase when the pH
rises above pH 9; this is because the ammonium ion concentration decreases and the phosphate ion
concentration increases [12, 14]. As various factors such as reaction pH, ionic strength and
temperature affect struvite solubility, which in turn determines the supersaturation ratio [15]. It is the
excess supersaturation in the liquid that is the major parameter in predicting struvite precipitation
potential [16]; therefore, it is important to use chemical equilibrium-based models to calculate and
predict the practical conditions for struvite formation. There is a geochemical equilibrium speciation
model MINTEQ that could be used to model struvite formation [17]. For calculating metal speciation,
solubility equilibria, sorption, etc., for natural waters, visual MINTEQ is available as a freeware
chemical equilibrium model.
For the anaerobically digested effluent of swine wastewater from livestock, there is generally less
magnesium and phosphate ions compared with ammonium ion. It is then necessary to add a source of
magnesium and phosphate ions to enhance the struvite crystallization process. The concentration of
Page 5
phosphate ion is expected to increase through solubilization of total phosphorus. The first step, thus,
is to enable phosphate P release from solid phases to increase the recovery of phosphorus by the
struvite crystallization process. The general methods to facilitate phosphate P release are physical and
chemical techniques [18-20]. Among these techniques, alkaline-ultrasonic pre-treatment is preferred
as it also disintegrates the solid from swine wastewater and enhances the anaerobic digestion process
[21-22].
The objectives of this study were to investigate the effect of pH and molar ratios for magnesium,
ammonium, and phosphate ions on ammonia N and phosphate P removal and recovery. Also
alkaline-ultrasonic pre-treatment was applied to the struvite crystallization process to enhance
nutrient recovery.
2. Materials and Methods
2.1. Materials
The anaerobically digested effluent of swine wastewater used in the study was from the P-city swine
wastewater treatment plant in Korea. The effluent of swine wastewater was concentrated at 4°C for
24 h and its main characteristics are shown in Table 1. Based on the initial composition of the
effluent solution, magnesium and phosphate ions concentrations were very low, and they needed to
be increased to reach the desired molar ratios for magnesium, ammonium, and phosphate ions. For
both synthetic and real wastewater, the concentrations of magnesium, ammonium and phosphate ions
were adjusted to the required molar concentration using MgCl2 6H2O, NH4Cl and KH2PO4 solutions,
respectively. All reagents were of analytical grade. To investigate the effect of reaction pH, 2 N HCl
and 2 N NaOH were used to adjust the pH, and the pH was monitored with a pH meter. In addition,
the pH influenced the phosphorus fractions [22-23].
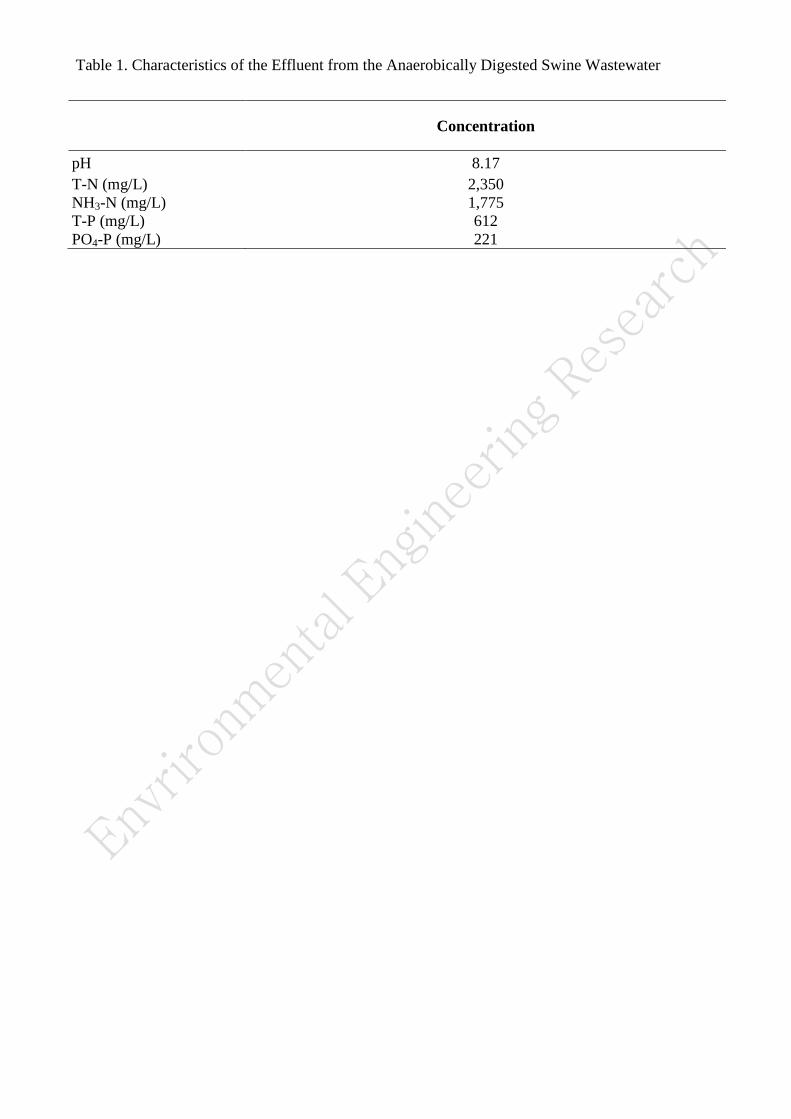
Table 1. Characteristics of the Effluent from the Anaerobically Digested Swine Wastewater
Page 6
2.2. Crystallizations Experiments
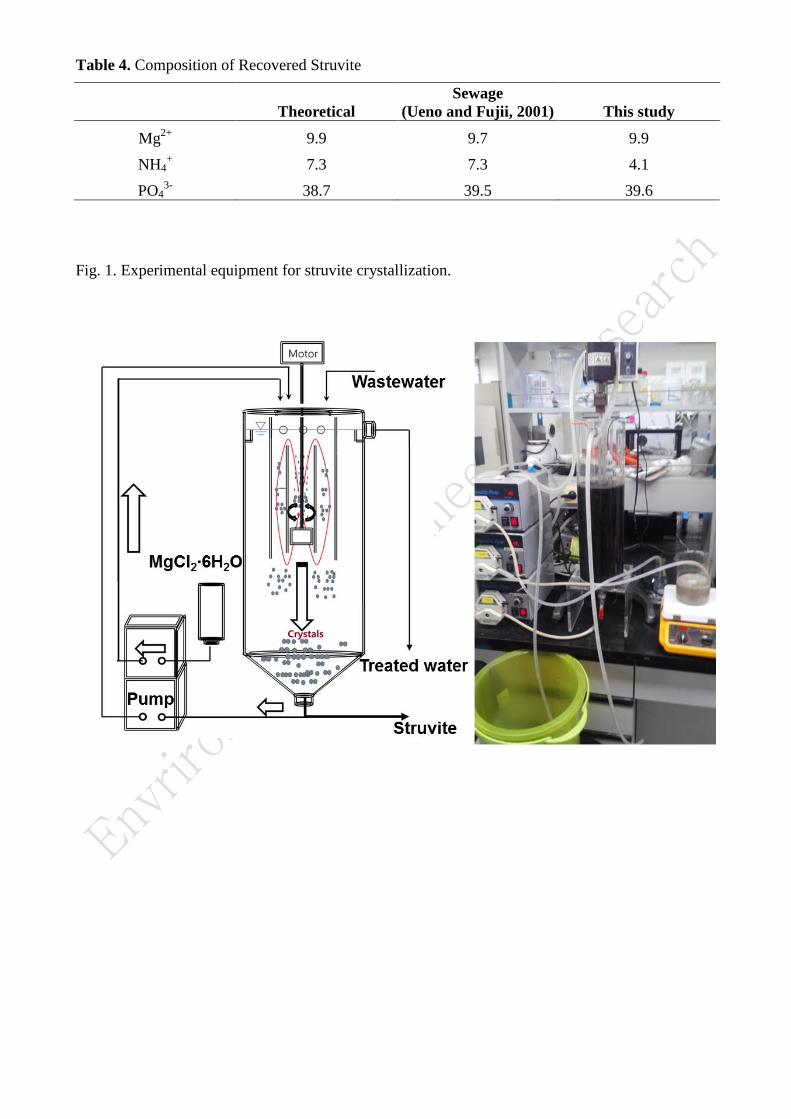
A lab-scale airlift reactor with a working volume of 5 L was used for struvite crystallization. The
schematic diagram of the experimental apparatus for struvite crystallization is shown in Fig. 1. The
reactor operated with a 10 min hydraulic retention time for the mixing zone and 3 h for the whole
reactor. The obtained struvite cake from the process was dried at room temperature to form a powder.
Fig. 1. Experimental equipment for struvite crystallization.
2.3. Pre-treatment for Phosphate P Release
Ultrasonic pre-treatment was performed for phosphate P release with STH-750S ultrasound
(Sonitopia, Korea) with operating frequency of 20 kH and maximal power of 750 watt. Microwave
pre-treatment device had a microwave frequency of 2450 MHz with maximal power of 600 watt.
During pre-treatment, the supplied energy density ranged from 100 to 20,000 kJ/L. The energy
density of pre-treatment device can be defined with following Eq. (2) (the energy density conditions
of pre-treatment are shown in Table 2):
V
tPowerLkJdensityEnergy
⋅×
=1000
)/( (2)
where Power is in watt, t (time) in s, and V (sample volume) in L.
Table 2. Energy Density Used in Pre-treatment
2.4. Analysis and MINTEQ Model
Page 7
The concentrations for total nitrogen (T-N), ammonia N, pre-treatment for organic phosphate
measurement were determined by the following standard methods [24]. To study the release of
phosphate ions concentration at different ultrasonic doses with ultrasonic disintegration, total
phosphorus (T-P) and ortho-phosphate P (PO43--P) levels in the effluent of the swine wastewater
were established by the Persulfate Digestion Method in HACH methods 10072. The phosphorous
concentrations were determined by the ascorbic acid method, using a UV-Vis spectrophotometer at
800 nm (Smart Plus SP-1900PC, Woongki Science, Seoul, Korea). The pH meter (Orionstar, Thermo
Scientific, Waltham, MA, USA) was calibrated after each experiment. The potential for struvite
formation as a function of pH was predicted by using chemical equilibrium freeware Visual
MINTEQ 3.0 developed by the U.S. Environmental Protection Agency. Using the composition of the
anaerobically digested effluent of swine wastewater from P-city as input, the model’s.
3. Results and Discussion
3.1. Effect of Magnesium, Ammonium, and Phosphate Molar Ratios on Struvite Formation
In this research, the effects of Mg2+ : NH4+ : PO4
3- molar ratios on struvite crystallization using
synthetic swine anaerobic digester wastewater were analyzed based on indications from previous
work [25-27]. At the start of the experiment, using a 0.1 NaOH solution, the initial pH of the digester
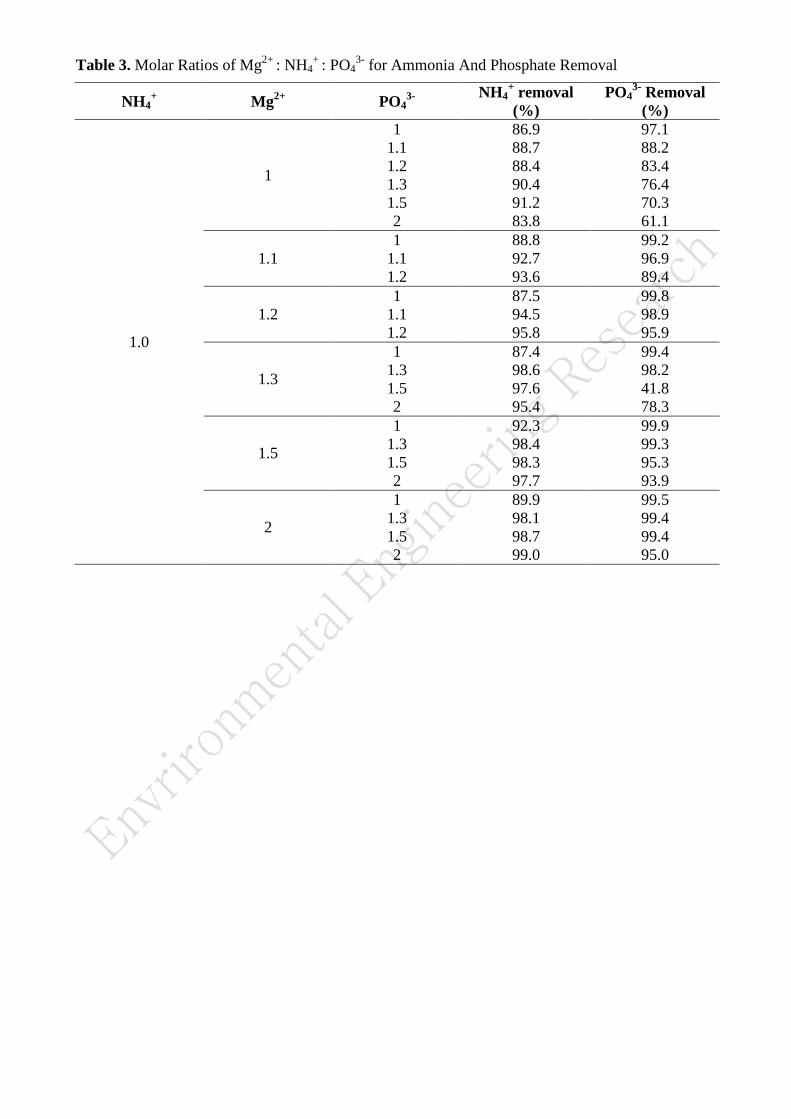
effluent sample was adjusted to 9.0. Table 2 shows the effect of molar ratios on ammonia and
phosphate ions removal. Molar ratio of Mg2+ : NH4+ : PO4
3- for the effective removal seemed to be
1.2 : 1.0 : 1.1.
Nelson et al. reported that adding magnesium ions did not play an important role in phosphorus
removal [11]. Therefore, external addition of magnesium and phosphate should be controlled to
ensure the feasibility of struvite precipitation from wastewater. Rahman et al. had a wide range of
PO43- and Mg2+ ratios tested for struvite precipitation, but in most cases, the effective ratio was 1:1 or
1:1.2 [28]. Most research to date has reported that the optimum molar ratio of Mg2+ : NH4+ : PO4
3- for
struvite precipitation is between 1.0 : 1.0 : 1.0 and 1.6 : 1.0 : 1.0 [28], although phosphate removal is
Page 8
not affected when Mg2+: NH4
+: PO43- molar ratio is more than 1.3 : 1.0 : 1.0 at pH 9.0 in a full-scale
plant [26].
Table 3. Molar Ratios of Mg2+ : NH4+ : PO43- for Ammonia And Phosphate Removal
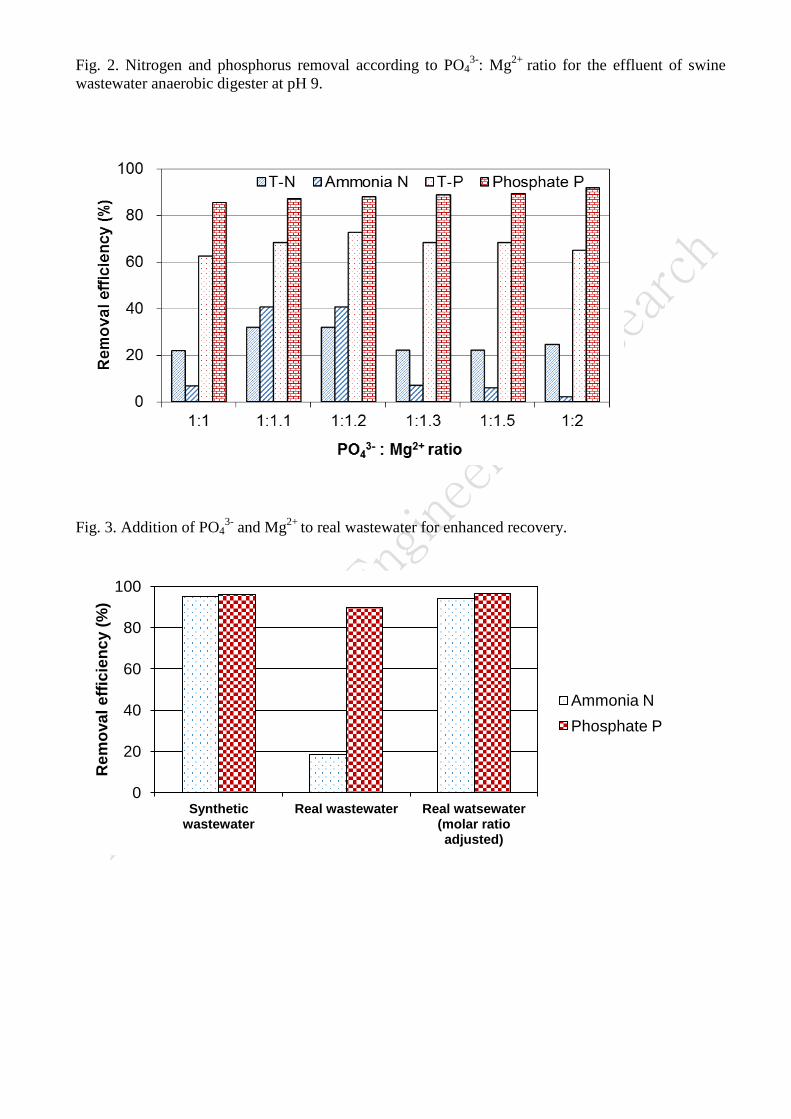
There was a significant difference between ion removals in real and synthetic effluents of swine
wastewater anaerobic digester. Ammonia N removal efficiency from synthetic wastewater was over
90%, while real wastewater had lower than 50% ammonia N removal. Addition of magnesium ion
facilitated ammonia N removal up to ratio of 1.2 and then it negatively influenced it. However, more
ammonia N was removed than would be predicted based on the magnesium removal and the
chemical formula for struvite as shown in Fig. 2.
Fig. 2. Nitrogen and phosphorus removal according to PO43-: Mg2+ ratio for the effluent of swine
wastewater anaerobic digester at pH 9.
Initial levels of magnesium, ammonium and phosphate ions in the effluent of swine wastewater
anaerobic digester were 32, 1,775, and 221 mg/L (molar ratio 1 : 74.9 : 1.8), respectively. The
ammonium ion concentration was much higher than magnesium and phosphate ions concentrations.
Therefore, magnesium and phosphate ions sources had to be adjusted to completely remove the
ammonium ion. The experimental design allowed observing the effects of magnesium and phosphate
ions source dosage on ammonia N and phosphate P removal as struvite. Experiments were carried out
with 10 min in the mixing zone and 3 h for the whole reactor retention time and a pH of 9.0
according to previous results.
The addition of magnesium and phosphate ions was required to maximize ammonia recovery
from the effluent of swine wastewater anaerobic digester. The removal efficiency reached over 95%,
Page 9
and it was almost the same for the synthetic effluent. Moreover, increasing added magnesium likely
attributed to both improvement of struvite precipitation and reduction of phosphate P dose. Over
dosing of magnesium could also contribute to decreased residual phosphorous concentration in the
effluent and phosphate recovery. However, if the concentration of magnesium was increased up to a
certain value, phosphorus removal would not change (Jaffer et al., 2002).
Fig. 3. Addition of PO43- and Mg2+ to real wastewater for enhanced recovery.
3.2. Effect of pH on Ammonia N and Phosphate P Removal
The ideal pH range for struvite precipitation could occur at a wide pH range of 7.0 to 11.5. However,
the suitable pH range for struvite formation is 8 to 9.5 [30]; this is consistent with many other reports
[17, 29]. Interfering ions in solution also affect the pH range for struvite precipitation and nutrient
removal. To investigate the effect of pH on ammonia N and phosphate P removal and recovery from
the effluent of swine wastewater anaerobic digester, the residual concentrations of ammonia N and
phosphate P were examined after each experiment. Removal of ammonia N and phosphate P was
calculated based on the change between the initial concentration and the residual concentration.
Experiments were carried out under the same reactor conditions at the pH range of 6.0 to 12.0 and an
equal ratio (Mg2+ : NH4 + : PO43-=1.0 : 1.0 : 1.0).
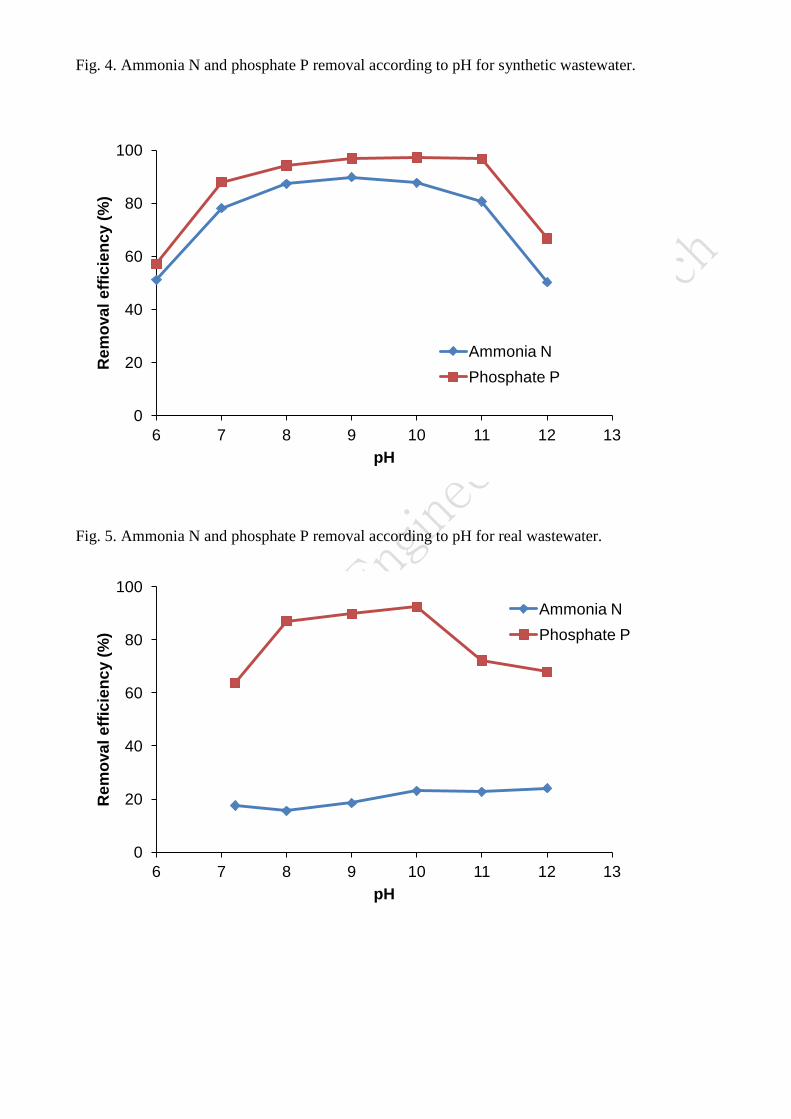
Based on the batch experiment, the optimum pH for struvite precipitation was investigated. Fig. 4
and Fig. 5 display the removal efficiencies, depending on the pH, for ammonia N and phosphate P in
synthetic and real wastewaters, respectively. For synthetic wastewater, as shown in Fig. 4, both
ammonia N and phosphate P removal efficiencies depended on the reaction pH, and the maximum
ammonia N and phosphate P removal occurred at pH 9.0 and 11.0, respectively. For real wastewater,
from Fig. 5, the optimal range of phosphate P was reduced to between pH 8 and 10. The maximum
removal efficiency of phosphate P achieved were over 95% in both wastewater types, while the
Page 10
maximum ammonia N removal efficiency was very low in real wastewater due to the high initial
concentration of ammonia N. Thus, the pH of 8.0-10.0 can be considered as the optimum pH range
for both ammonia N and phosphate P removal from the effluent of swine wastewater anaerobic
digester.
Fig. 4. Ammonia N and P phosphate removal according to pH for synthetic wastewater.
Fig. 5. Ammonia N and phosphate P removal according to pH for real wastewater.
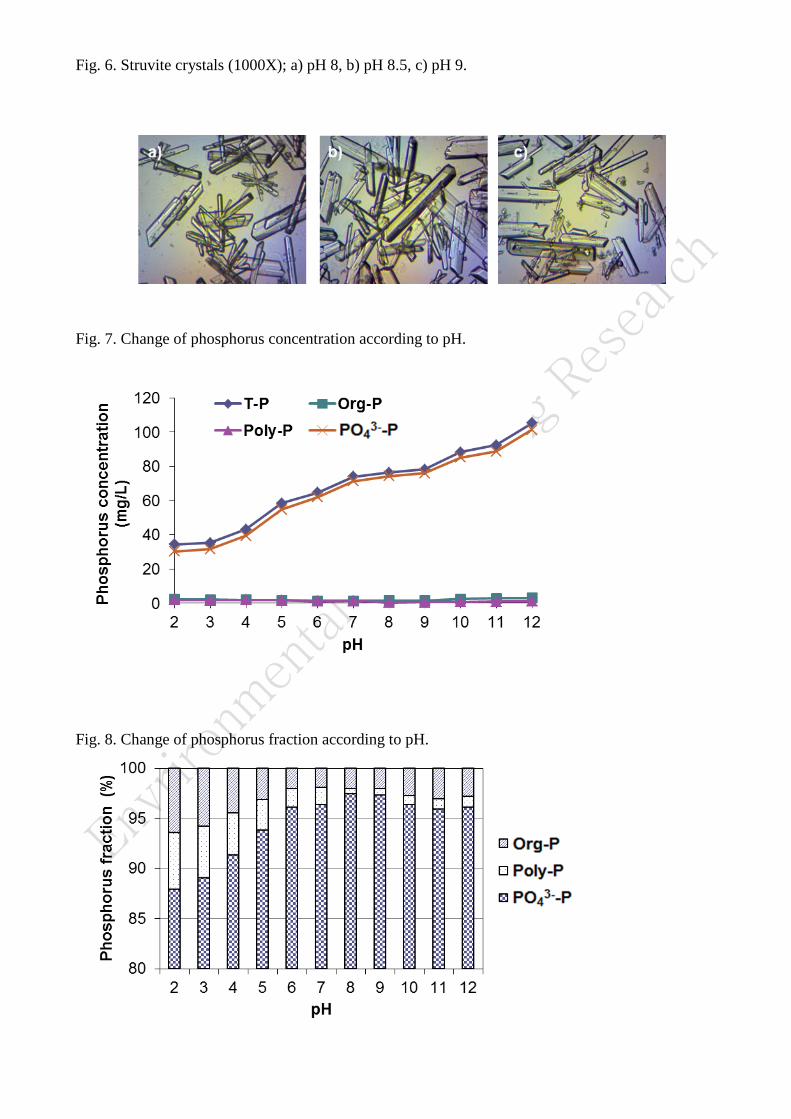
Fig. 6 shows the optical microscope images of the struvite crystals at various reaction pH values.
This indicates larger struvite crystals seen in higher pH values. Moreover, the increased size affected
struvite formation, and led to more precipitates forming at high pH values. This could be explained in
terms of more ammonia-based precipitates forming compared to phosphate-based precipitates at
these conditions.
Fig. 6. Struvite crystals (1000X); a) pH 8, b) pH 8.5, c) pH 9.
3.3. Pre-treatments Affecting Phosphate P Release
Acid-alkaline pre-treatments were applied for phosphate P release from the effluent of swine
wastewater anaerobic digester of P-city. In this experiment, the initial pH was 7.2 and the pH was
changed with HCl and NaOH for the test pH range of 2.0-12.0. Acid-alkaline pre-treatments were
carried out under the same conditions so that the ammonia N and phosphate P removals could be
tested in terms of the pH conditions of the wastewater. As shown in Fig. 7, both T-P and phosphate P
concentrations increased with the increasing reaction pH, while poly-P concentration was slightly
decreased with the increasing pH. Fig. 8 shows the change of phosphorus fraction according to pH.
Page 11
Maximum phosphate P release was observed at pH between 8.0-9.0.
Fig. 7. Change of phosphorus concentration according to pH.
Fig. 8. Change of phosphorus fraction according to pH.
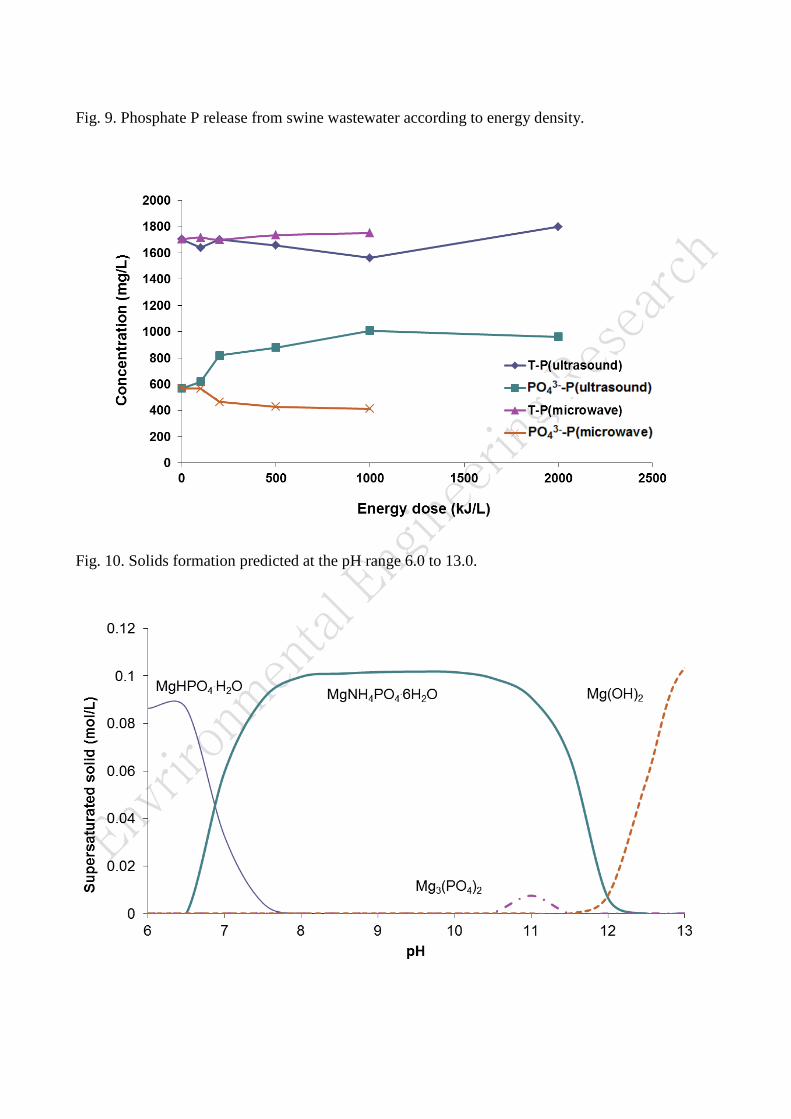
In this work, the effect of ultrasonic and microwave pre-treatment was also studied for changes in
phosphate P release from the effluent of swine wastewater anaerobic digester. The range of the
supplied energy density was from 100 to 20,000 kW/L. From this analysis, phosphate P levels
increased by increasing ultrasonic energy density (up until 1,000 kJ/L); however, microwave pre-
treatment did not lead to any increases. At 1,000 kJ/L of energy dose by using ultrasound, the highest
phosphate P release (at 77.4%) was observed (Fig. 9).
Fig. 9. Phosphate P release from swine wastewater according to energy density.
3.4. Composition of Recovered Struvite
Precipitates from the anaerobically digested effluent of swine wastewater collected from the
experimental reactor were analyzed for the composition of struvite. The contents of phosphorus and
magnesium were similar to theoretical values but the ammonia content was less than the theoretical
value. This observed low ammonia content could likely be attributed to precipitation of other
minerals, such as potassium struvite (KMgPO4·6H2O) instead of magnesium ammonium phosphate
due to introduction of potassium (KH2PO4) for phosphate P supply.
Table 4. Composition of Recovered Struvite
Page 12
For samples from the effluent of swine wastewater anaerobic digester of P-city, Visual MINTEQ 3.0
was applied to concentrations of Mg2+, NH4+ and PO4
3- at the pH range of 6.0 to 13.0 at 25oC to
investigate the effect of pH on the amount and purity of struvite formation from ammonia N and
phosphate P removal in the wastewater. Fig. 10 shows the levels and types of supersaturated solids
modeled by Visual MINTEQ. From the analysis, struvite would be precipitated in the pH range 6.5 to
12.5, and as the ion activity product (IAP) exceeded the minimum equilibrium constant of solubility
[31], struvite crystals would be formed in the pH 7.5 to 10.5.
Fig. 10. Solids formation predicted at the pH range 6.0 to 13.0.
4. Conclusions
In this study, a wide range of molar ratios and pH values were tested to determine optimum struvite
recovery in terms of efficiency. Microwave and ultrasonic pre-treatments were also investigated for
phosphate P release from solid phases for increased recovery of phosphorus from wastewater. From
this analysis, the optimum molar ratio of Mg2+ : NH4+ : PO4
3- for the effective removal was 1.2 : 1.0 :
1.1. For real wastewater, the optimal pH range of phosphate P was found to be between 8 and 10.
The pH range of 8 to 9 was found to lead to maximum phosphate P release and could be the optimum
condition for phosphorus recovery. Ultrasound pre-treatment had the highest phosphate P release of
77.4% at 1,000 kJ/L of energy dose but the microwave pre-treatment had no effect under the tested
conditions. Contents of phosphorus and magnesium in the collected precipitate were similar to
theoretical values but the ammonia content was less than the predicted value. The modeling by
Visual MINTEQ pointed to struvite as the dominant solid phase in the pH range 7 to 11.
Page 13
Acknowledgements
This study was supported by the Korea Ministry of the Environment (MOE) as an “Eco-Innovation
Project” (Project No. 2014-000015-0017) and the Waste to Energy and Recycling Human Resource
Development Project funded by the Korea Ministry of the Environment.
References
1. Seyhan D. Country-scale phosphorus balancing as a base for resources conservation. Resour.
Conserv. Recy. 2009;53:698-709.
2. Xu H, He P, Gu W, Wang G, Shao L. Recovery of phosphorus as struvite from sewage sludge ash.
J. Environ. Sci. 2012;24:1533-1538.
3. United States Geological Survey (USGS) Phosphate rock, mineral commodity summaries. US
Department of the Interior, US Geological Survey, US Government Printing Office. Washington
D.C.: USA; 1997. p. 124-125
4. Choi JW, Lee SY, Lee SH, et al. Comparison of Surface-Modified Adsorbents for Phosphate
Removal in Water. Water Air Soil Poll. 2012;223:2881-2890.
5. Jutidamrongphan W, Park KY, Dockko S, Choi JW, Lee SH. High removal of phosphate from
wastewater using silica sulfate. Environ. Chem. Lett. 2012;10:21-28.
6. Choi JW, Lee KB, Park KY, Lee SY, Kim DJ, Lee SH. Comparison between Ti- and Si-based
mesostructures for the removal of phosphorous from aqueous solution. Environ. Prog. Sustain.
Energy. 2012;31:100-106.
7. Hu HQ, Li XY, Liu JF, Xu FL, Liu J, Liu F. The effect of direct application of phosphate rock on
increasing crop yield and improving properties of red soil. Nutr. Cycl. Groecosy. 1996:46:235-
239.
8. Shu L, Schneider P, Jegatheesan V, Johnson J. An economic evaluation of phosphorus recovery as
struvite from digester supernatant. Bioresour. Technol. 2006;97:2211-2216.
Page 14
9. Wang X, Qiu Z, Lu S, Ying W. Characteristics of organic, nitrogen and phosphorus species
released from ultrasonic treatment of waste activated sludge. J. Hazard. Mater. 2010;176:35-40.
10. Huang H, Xu C, Zhang W. Removal of nutrients from piggery wastewater using struvite
precipitation and pyrogenation technology. Bioresour. Technol. 2011;102:2523-2528.
11. Nelson NO, Mikkelsen, RL, Hesterberg DL. Struvite precipitation in anaerobic swine lagoon
liquid: effect of pH and Mg: P ratio and determination of rate constant. Bioresour. Technol.
2003;89:229-236.
12. Snoeyink VL, Jenkins D. Water chemistry. John Wiley and Sons, New York; 1980;449:306-309.
13. Bouropoulos NC, Koutsoukos PG. Spontaneous precipitation of struvite from aqueous solutions.
J. Cryst. Growth. 2000;213:381-388.
14. Booker NA, Priestly AJ, Fraser IH. Struvite formation in wastewater treatment plants:
Opportunities for nutrient recovery. Environ. Tech. 1999;20:777-782.
15. Hanhoun M, Montastruc L, Azzaro-Pantel C. Biscans B, Freche M, Pibouleau L. Temperature
impact assessment on struvite solubility product: A thermodynamic modeling approach. Chem.
Eng. 2010;167:50-58.
16. Miles A, Ellis TG. Struvite precipitation potential for nutrient recovery from anaerobically treated
wastes. Water Sci. Technol. 2001;43:259-266.
17. Buchanan JR, Mote CR, Robinson RB. Thermodynamic of struvite precipitation. T. ASAE.
1994;37:617-621.
18. Tao XUE, Xia H. Releasing characteristics of phosphorus and other substances during thermal
treatment of excess sludge. J. Environ. Sci. 2010;19:1153-1158.
19. Yan Y, Feng L, Zhang C, Wisniewski C, Zhou Q. Ultrasonic enhancement of waste activated
sludge hydrolysis and volatile fatty acids accumulation at pH 10.0. Water Res. 2010;44:3329-
3336.
20. Wei B, Li Y, Hu Y. Recovery of phosphorus and nitrogen from alkaline hydrolysis supernatant of
excess sludge by magnesium ammonium phosphate. Bioresour. Technol. 2014;166:1-8.
Page 15
21. Ahmad AA, Idris A. Release and recovery of phosphorus from wastewater treatment sludge via
struvite precipitation. Desalin Water Treat. 2014;52:5696-5703.
22. Kim M, Han DW, Kim DJ. Selective release of phosphorus and nitrogen from waste activated
sludge with combined thermal and alkali treatment. Bioresour. Technol. 2015;190:522-528.
23. Xu Y, Hu H, Liu J, Luo J, Qian G, Wang A. pH dependent phosphorus release from waste
activated sludge: Contributions of phosphorus speciation. Chem. Eng. J. 2015;267: 260-265.
24. APHA, AWWA, WEF. Standard Mthethods for the Examination of Water and Wastewater. 21st
ed. American Public Health Association, Washington D.C.; 2005.
25. Wang J, Burken JG, Zhang X, Surampalli R. Engineered struvite precipitation: Impacts of
component-ion molar ratios and pH. J. Environ. Eng. 2005;131:1433-1440.
26. Ueno Y, Fujii M. Three years experience of operating and selling recovered struvite from Full-
Scale Plant. Environ. Technol. 2001;22:1373-1381.
27. Lee JE, Rahman MM, Ra CS. Dose effects of Mg and PO4 sources on the composting of swine
manure. J. Hazard. Mater. 2009;169:801-807.
28. Rahman MM, Liu YH, Kwag JH, Ra CS. Recovery of struvite from animal wastewater and its
nutrient leaching loss in soil. J. Hazard. Mater. 2011;186:2026-2030.
29. Jaffer Y, Clark TA, Pearce P, Parsons SA. Potential phosphorus recovery by struvite formation.
Water Res. 2002;36:1834-1842.
30. Battistoni P, Deangalis A, Pavan P, Prisciandaro M, Cecchi F. Phosphorus removal from a real
anaerobic supernatant by struvite crystallization. Water Res. 2001;35:2167-2178.
31. Celen I, Buchanan JR, Burns RT, Robinson RB, Raman DR. Using chemical equilibrium model
to predict amendments required to precipitate phosphorus as struvite in liquid swine manure.
Water Res. 2007;41:1689-1696.
Page 16
Table 1. Characteristics of the Effluent from the Anaerobically Digested Swine Wastewater
Concentration
pH 8.17 T-N (mg/L) 2,350 NH3-N (mg/L) 1,775 T-P (mg/L) 612 PO4-P (mg/L) 221
Page 17
Table 2. Energy Density Used in Pre-treatment
Energy density (kJ/L) Electricity (watt) Contact time (s) 100 33 300 200 67 300 500 167 300
1,000 333 300 2,000 667 300 5,000 750 667 10,000 750 1,334 20,000 750 2,667
Page 18
Table 3. Molar Ratios of Mg2+ : NH4
+ : PO43- for Ammonia And Phosphate Removal
NH4+ Mg2+ PO4
3- NH4+ removal (%)
PO43- Removal
(%)
1.0
1
1 86.9 97.1 1.1 88.7 88.2 1.2 88.4 83.4 1.3 90.4 76.4 1.5 91.2 70.3 2 83.8 61.1
1.1 1 88.8 99.2
1.1 92.7 96.9 1.2 93.6 89.4
1.2 1 87.5 99.8
1.1 94.5 98.9 1.2 95.8 95.9
1.3
1 87.4 99.4 1.3 98.6 98.2 1.5 97.6 41.8 2 95.4 78.3
1.5
1 92.3 99.9 1.3 98.4 99.3 1.5 98.3 95.3 2 97.7 93.9
2
1 89.9 99.5 1.3 98.1 99.4 1.5 98.7 99.4 2 99.0 95.0
Page 19
Table 4. Composition of Recovered Struvite
Theoretical Sewage
(Ueno and Fujii, 2001) This study
Mg2+ 9.9 9.7 9.9 NH4
+ 7.3 7.3 4.1 PO4
3- 38.7 39.5 39.6
Fig. 1. Experimental equipment for struvite crystallization.
Page 20
Fig. 2. Nitrogen and phosphorus removal according to PO4
3-: Mg2+ ratio for the effluent of swine wastewater anaerobic digester at pH 9.
Fig. 3. Addition of PO43- and Mg2+ to real wastewater for enhanced recovery.
0
20
40
60
80
100
Synthetic wastewater
Real wastewater Real watsewater (molar ratio adjusted)
Rem
oval
effi
cien
cy (%
)
Ammonia N Phosphate P
Page 21
Fig. 4. Ammonia N and phosphate P removal according to pH for synthetic wastewater.
Fig. 5. Ammonia N and phosphate P removal according to pH for real wastewater.
0
20
40
60
80
100
6 7 8 9 10 11 12 13
Rem
oval
effi
cien
cy (%
)
pH
Ammonia N Phosphate P
0
20
40
60
80
100
6 7 8 9 10 11 12 13
Rem
oval
effi
cien
cy (%
)
pH
Ammonia N Phosphate P
Page 22
Fig. 6. Struvite crystals (1000X); a) pH 8, b) pH 8.5, c) pH 9.
Fig. 7. Change of phosphorus concentration according to pH.
Fig. 8. Change of phosphorus fraction according to pH.
Page 23
Fig. 9. Phosphate P release from swine wastewater according to energy density.
Fig. 10. Solids formation predicted at the pH range 6.0 to 13.0.