EFFECTS OF PLANT DENSITY AND PHOSPHATE LEVELS ON GROWTH, YIELD AND YIELD COMPONENTS OF FIELD BEANS PHASEOLUS VULGARIS L. f/ by GRACE WANGARI MBUGUA ctr* o* A thesis presented to the Faculty of Agriculture in the University of Nairobi in partial fulfilment of the requirements for the degree of MASTER OF SCIENCE IN AGRONOMY. DEPARTMENT OF CROP SCIENCE NAIROBI, KENYA. 1983
Transcript
EFFECTS OF PLANT DENSITY AND PHOSPHATE LEVELS ON
GROWTH, YIELD AND YIELD COMPONENTS OF FIELD BEANS
PHASEOLUS VULGARIS L. f /
by
GRACE WANGARI MBUGUA
ctr* o*
A thesis presented to the Faculty of Agriculture
in the University of Nairobi in partial fulfilment of
the requirements for the degree of MASTER OF SCIENCE IN AGRONOMY.
DEPARTMENT OF CROP SCIENCE
NAIROBI, KENYA.
1983
(ii)
D E C L A R A T I O N
This is my original work and has not been
presented for a degree in any other University.
SignedGrace Wangari^Mbugua
Date
This thesis has been submitted for
examination with my approval as a University
Supervisor.
SignedDr. D.R. Basiime
Date A(>. n s z
(ii)
D E C L A R A T I O N
This is my original work and has not been
presented for a degree in any other University.
Signed * C UGrace WangarivMbuguaX
Date ^ _lSI.5.This thesis has been submitted for
examination with my approval as a University
Supervisor.
SignedDr. D.R. Basiime
Aj nszDate
(iii)
D E D I C A T I O N/
To Mrs Leah N. Ngini, my teacher and
friend, whose assistance, encouragement and
inspiration during my High School days enabled
me to pursue education up to the University.
(iv)
A C K N O W L E D G E M E N T S
I am very grateful to the Ministry of Agriculture
(Kenya) for providing the scholarship, and to the University of Nairobi for providing the facilities
which enabled this work to be carried out.
I express my sincere gratitude to Dr. David
R. Basiime of Crop Science Department, University of
Nairobi under whose supervision this work was carried
out. Hi$ patience, untiring guidance, helpful
suggestions and constructive criticisms are greatly
appreciated.
Thanks also go to the staff of Crop Science
Department for both their technical and general
assistance, and to the staff of Meteorological
Department, Dagoretti for providing the rainfall and
temperature data. Special thanks go to my son Moses
for his patience during long hours of my absence
throughout the study. Last but not least the work
of Mrs Jane N. Mbugua who typed this thesis is very
much appreciated.
(V)
A B S T R A C T
Field bean (Phaseolus vulgaris) crown mainly for its protein rich dry bean seeds, is the most important
legume and the second most important crop in Kenya.
Bean yields have been shown to be increased by
phosphate fertilizers particularly in areas which
are low in available phosphorus which is the case
in most farming areas of Kenya. Increasing bean
plant populations under optimal growth conditions
has resulted in increase in bean yields mainly due
to the increase in number of pods per unit area.
The objective of this study was to investigate the
effects of phosphate fertilizer, plant population
density, and population density x fertilizer
interaction on growth and yield of Phaseolus vulgaris.
Two experiments were conducted at the
University of Nairobi, Kabete in 1979 and 1980.
Kabete has an annual average rainfall of 950 mm and
mean maximum and minimum temperatures of 23°C and
13°C respectively. The soils are deep red friable
loams.
Bean seeds (cultivar Rose Coco) were planted
at 25 x 25 cm, 20 x 20 cm, 15 x 15 cm and 10 x 10 cm
to give population densities of 160,000, 250,000,
(vi)
444,444 and 1,000,000 plants/ha respectively. Triple
superphosphate fertilizer (46% p2°5 ̂ was aPPlie<3 at the rates of 0 (control), 50, 100 and 150 kg
P/ha. The 4 x 4 treatment combinations were replicated
four times in a randomized complete block design.
The crop was grown following the recommended
agronomic practices.
Six sequential harvests, each of which
comprised 10 and 5 plants per plot in 1979 and 1980
respectively, were harvested at 2 week-intervals.
From the samples, leaf, stem, pod and root dry
weights, nodule number and nodule weight per plant
were determined. Leaf Area Index (LAI) was also
determined using the disc method. Seed yield, pods/
plant, seeds/pod, 100 seed weight, total dry matter
and Harvest Index (HI) were determined at the final harvest*
Growth rate was also monitored throughout the growing seasons.
Phosphate fertilizer increased LAI, plant
growth rate, rate of plant senescence, and number
and weight of nodules. Pod number per plant, seeds/
pod, and 100-seed weight in 1980, were also higher
in the fertilized than in the control plants. There
was 13% and 9% increase in seed yield over the
, control in 1979 and 1980 respectively at the 150 kg
P/ha treatment and this increase could be attributed
to the increase in the number of pods T3er plant.
(vii)
Yield differences resulting from the different
fertilizer rates (50-150 kg P/ha) were insignificant,
consequently application of 50 kg P/ha appeared the
best.
With increase in plant population, growth
rate, dry matter yield and rate of senescence per
plant, pods/plant and seeds per pod all decreased,
while LAI, rates of growth, dry matter yield, rate
of senescence and number of pods per hectare increased.
100-seed weight was apparently unaffected. Seed
yield decreased with increase in plant density hence
this did not reflect increases in vegetative dry
matter with rise in plant population. High
populations favoured vegetative rather than
reproductive growth as indicated by decreasing HI
values with increase in plant density. Therefore
no yield benefit was obtained by increasing plant
population of this particular variety beyond
160,000 plants/ha.
Population density x fertilizer interactions
were largely insignificant. Where the interactions
were significant, responses in growth and yield to
the different plant densities occurred mainly where
fertilizer was applied. This seemed to indicate
that phosphorus can be limiting in Kabete soils.
C O N T E N T S
Page
DECLARATION................................ ii
DEDICATION................................. 1 1 1
ACKNOWLEDGEMENT........................... iv
ABSTRACT................................... V '
LIST OF FIGURES........................... xv
LIST OF TABLES............................ xvii
LIST OF APPENDIX TABLES................... xxi
1. CHAPTER ONE: INTRODUCTION................ 1
1.1 Importance of Legumes in Kenya............ 1i
$L.2 Effect of phosphate fertilizer on yieldoof field beans............................
1.3 Effect of Plant Population Density on Yieldoof Field Beans.............................
1.4 Popoulation Density x FertilizerInteraction................................ ^
2. CHAPTER TWO: LITERATURE REVIEW.......... 6
2.1 Effect of Plant Density on Bean Yield.... ®
2.2 Effect of Plant Arrangement on Yield....
2.3 Effect of Plant Density on YieldComponents................................ ®
2.4 Some Problems Encountered with HighPlant Densities......................... ^
2.5 Effect of Phosphate Fertilizer on Yield.. ^2.6. Effect of Phosphate Fertilizer on Yield
Components................................ .14
2.7. Effect of Phosphate Fertilizer on Modulation..2.8- Population Density-Fertilizer Interaction..... 15
(viii)
Page
3. CHAPTER THREE:MATERIALS AND METHODS... 1 7
1 7‘3.1. The Experimental Site..................
3.2. Soils..................................
3.3. The Bean Variety Used in theExperiment.............................
3.4. Planting Methods...................... ^9
3.5. Sampling Techniques................... 242 83.6. Statistical Analysis.................. k
4. CHAPTER FOUR: RESULTS................ 29
294.1. Seasonal Differences..................
4.2. Effect of Phosphate Fertilizer onGrowth Rate............................
4.2.1. Leaf growth rate....................... 24
4.2.2. Stem growth rate....................... 35
4.2.3. Pod growth rate....................... 39
4.2.4. Root growth rate...................... 39
4.2.5. Rate of total dry matter increase.... 39
4.3. Effect of Phosphate Fertilizer onLeaf Area Index...................... 46
4.4. Effect of Phosphate Fertilizer on DryMatter................................ 4 /
4.4.1. Leaf dry matter....................... 47
4.4.2. Stem dry matter....................... 51
4.4.3. Pod dry matter....................... 54
4.4.4. Root dry matter...................... 54
(ix)
62
62
62
66
66
66
68
68
68
72
73
73
76
7880
82
(x)
4.4.5.
4.4.6.
4.5.
4.5.1.
4.5.2.
4.5.3.
4.6.
4.7.
4.8.
4.8.1.
4.8.2.
4.9.
4.9.1.
4.9.2.
4.9.3.
4.9.4.
4.9.5.
4.10.
Total dry matter....................
Total dry matter at harvest........
Effect of Phosphate Fertilizer on Yield Components....................
Number of pods per plant...........
Number of seeds per pod.............
100-Seed weight.....................
Effect of Phosphate Fertilizer on Seed Yield..........................
Effect of Phosphate Fertilizer on Harvest Index.......................Effect of Phosphate Fertilizer on Number and Weight of Nodules.......
Number of nodules per plant........
Nodule weight.......................
Plant Population Effects on the Rate of Growth......................
Leaf growth rate....................
Stem growth rate....................
Pod growth rate.....................
Root growth rate....................
Rate of total dry matter increase...
Effect of Plant Population on Leaf Area Index.........................
(xi) Page
4.11.
4.11.1.
4.11.2.
4.11.3.
4.11.4.
4.11.5.
4.11.6 .
Effect of Plant Population onDry Matter ........................
Leaf dry matter....................
Stem dry matter....................
Pod dry matter.....................
Root dry matter....................
Total dry matter...................
Total dry matter at • .
86
86
91
91
93-
93
98
4.12.
4.12.1.
4.12.2.
4.12.3.
Effect of Plant Population on Yield Components.........................
Number of pods.................. . . .
Number of seeds per pod............
100-Seed weight....................
98
98
102
102
4.13.
4.14.
4.15
4. 15.1.
Effect of Plant Population on Seed Yield.............................. 104
Effect of Plant Population on Harvest Index...............................
Interaction between Plant Population Density and Fertilizer..............
Stem growth rate: 15th week of growth: 1980................................ 104
The net plot (enclosed area in the centre) was 325 x 75 cm for second rains 1979, and 1- x 1 m for first rains 1980 for all spacings from which final harvest was taken. Plants for sequential harvests were obtained from similar positions in their respective plots.
22
Depending on the plot size and spacing, the
number of rows per plot were determined, then
the fertilizer amount required per row was weighed
out as indicated below:
Fertilizer rate, kg P per ha
TSP 46%, P205
kg per plotSpacingan
No. of TSP per row rows (grams)
0 0 25 x 25 15 0
20 x 20 18 0
15 x 15 24 0
10 x 10 35 0
50 o*mi_ 25 x 25 15 26.0720 x 20 18 21.7315 x 15 24 16.3010 x 10 35 11.17
100 0.7748 25 x 25 15 51.6520 x 20 18 43.0415 x 15 24 32.2810 x 10 35 22.14
150 1.1622 25 x 25 15 77.4820 x 20 18 64.5715 x 15 24 48.4310 x 10 35 33.21
(Conversion factors for P:% P = %P205 x 0.436
%P2°5 = %P x 2. 29) (Ahn, 1970)
The fertilizer was applied in furrows
at planting time and mixed with the soil. The
23
seeds were then placed singly in the furrows and
covered with the soil to a depth of about 2 to
3 cm.
The first experiment's crop was planted on
5 November 1979. The first weeding was carried
out on 22 November, three weeks after planting
when the plants had about 2 to 3 leaves. The
second weeding was done three weeks Iter, i.e.A.
six weeks after planting.
Soon after the first weeding calcium
ammonium nitrate (CAN: 26% N) was applied at the
rate of 13 kg N per hectare. The fertilizer was
top-dressed between the rows.
Due to the drought that persisted
throughout most of the season, the crop was
irrigated twice: in December 1979 and again inJanuary 1980.
The crop was sprayed twice, on 7 January,
1980 and again on 17 January 1980 with Dithane M 45
(40% emulsifiable oonaentrate) at the rate of 4 litres
in 600 litres of water/hectare using Knapsack sprayers.
24
3.5. Sampling Techniques
Sequential harvests were carried out on
4th, 6th, 3th, 9th, 11th and 13th week after
planting. At flowering and pod-forming stage,
changes in plant growth were expected to be rapid
and so only one week interval was allowed between
the 3rd and the 4th sequential harvests. Ten
plants were uprooted from a pre-determined area
in each plot (see Fig. 2) , making sure that most
of the tap root and main lateral roots and most
of the root nodules were recovered. The plant
samples were then put in plastic bags to
preserve their water content, then taken to the
laboratory for weighing and measurement.
Leaf area was determined using the disc
method and the cross-sectional area of the punch 2was 2.43 cm . Twenty whole discs were taken
to calculate the area/weight relationship of
the sample.
Total fresh weight of the plants, excluding
the roots, was taken. Then the plant was
separated into stem, leaves and pods and the fresh
weight of these parts was recorded. The number
25
of pods per plant was recorded at 4th, 5th and
6th harvests, i.e. 9, 11 and 13 weeks after
planting, respectively.
During the first, third and fourth harvests,
root nodules from each plant were counted. Nodule
weight from the ten plants per sample per harvest
was also recorded. During subsequent harvests
the nodules were shrivelled and very few, making
it difficult to separate them from the soil, to
count or to weigh them.
f The final harvest was taken on 5th March21980 from an area of 75 x 325 cm per plot
(see Fig. 2). The number of the harvested plants
differed with the varying plant population
densities and this was achieved by harvesting as
indicated below:
Spacing in cm Number of rows harvested per plot
25 x 25
20 x 20
15 x 15
1 0 x 10
3 centre rows, omitting two plants at each end of every row.4 centre rows, omitting two plants at each end of every row.6 centre rows, omitting three plants at each end of every row.8 centre rows, omitting four plants at each end of every row.
From the final harvest, the following data
26
were obtained.
seed yield in grams per plot
number of pods per plant
number of seeds per pod
- Weight of 100 seeds which were randomly
selected from each sample. The 100-seed
weight was taken after drying the seeds
in the oven at 100°C for 24 hours,
total dry matter
harvest index. This was the ratio of
seed yield to total dry matter:
Harvest index 100 x seed yield in kg/ha_______total dry matter in kg/ha
Field 14 was used for the second experiment.
The land was ploughed in early April 1980 then
harrowed twice to a fine tilth just before
planting. The crop was planted on 23rd April
1980, using the same procedure as in the first
experiment. The first weeding was done during
the third week after planting at two to three
leaf-stage. The second weeding was carried out
one month later.
The crop was top-dressed with CAN (26% N)
31days after planting, i.e. on 26 May 1980 at
27
the rate of 13 kg of nitrogen per hectare.
The rainfall received during the season was
satisfactory hence the plants were not irrigated.
Samples were taken on 4th, 6th, 9th, 11th,
13th and 15th week after planting. The third
sequential harvesting was done on the 9th rather
than the 8th week after planting due to unavailability
of workers during the latter period). The growing
season was expected to be longer and the crop to
remain green in the field for a longer time than
in the previous season hence the interval between
sequential harvests remained a constant two weeks.
Five plants per plot (and not ten as in the
previous season) were sampled in each harvest.
This was to ensure that sufficient number of plants
were left for final harvest since poor germination
due to the very heavy rain that fell two days after
planting resulted in fewer plants per plot than
expected. As in the first experiment, total leaf,
stem and pod fresh and dry weights were determined.
Root fresh and dry weights were also determined.
The number and weight of root nodules were recorded
\
28
in the first, second and third and fourth harvests.
Final harvest was carried out on 21st
and 22nd August 1980. Plants for final harvest
were taken from an area of 1 x 1 meter square.
Seed yield in grams per plot, number of pods per
plant, number of seeds per pod and harvest index
were determined as in the first experiment.
3.6. Statistical Analysis
Separation of means was done using Duncan's
y New Multiple Range Test.
£c i a - ^ 30 0 u ^ S i i
. . C O •"'>
29
C H A P T E R F O U R
RESULTS
4.1. Seasonal Differences
Tables 2 and 3 show the dry matter★accumulation and growth rate averaged over all the
fertilizer levels and all the plant populations.
In the 1979 crop total dry matter per plant
increased at an increasing rate up to the 9th week
after planting. The highest growth rate of 2.17
gm/plant per week was attained in the 9th week
when the average dry weight per plant was 7.2 gm.
After the 9th week, the rate of growth dropped
to 0.56 gm/plant/week.
The rate of dry matter accumulation in the
leaves increased from 0.70 gm/plant/week in the
6th week to 0.97 gm/plant/week in the 8th week.
During the two weeks that followed,the rate
dropped to 0.45 gm/plant/week, after which negative
growth rate set in. The leaves attained their
maximum dry matter in the 9th week.
In the 6th week stem dry matter
increased at the rate of 0.25 gm/plant/week.
refers to ^solute growth rate in the text
Table 2. Change in dry matter (qm/plant) with time:
Weeksafterplanting
Second rains 1979 First rains 19 80leaf stem pod * total Weeks
P4 207.Obcde 184.5 de 357.0 abcde 278. Oabode -256.63
Mean 176.88 325.75 320.63 410.85s.e. mean 72
N.B. Figures with the same letter do not differ significantly.
118
- 119 -
at the 100 kg P/ha fertilizer level while at P2 and
P3, the highest nodule weight occurred at the 150 kg
P/ha level. The highest recorded nodule weight per
plant was at P^ with 100 kg P/ha fertilizer level.
120
C H A P T E R F I V E
DISCUSSION
5.1. Seasonal Differences
The rate of growth, number of pods per plant
number of seeds per pod, 1 0 0-seed weight and
consequently seed yields 'were higher in
the first rains of 1980 than in the second rains
of 1979. The differences could have been mainly
due to the drier conditions in 1979 than in 1980.
In the second rains of 1979 (October to December)
only 242 mm of rain was received as compared to
443 mm received in the long rains of 1980 from
March to May (see Appendix I). For the crop to
be most successful, it must receive at least
300-380 mm of rainfall over a 10-week growing
season (Kay, 1979) but the rainfall received in
the 1979 season was well below this requirement.
Though the crop was irrigated twice the moisture
supplied could have been insufficient to fully
meet the crops requirement for best performance
hence subjecting the crop to water stress. Robins
121
and Domingo (1956) showed that water stress prior
to flowering reduced the number of pods per plant,
and that water stress during flowering and early
pod-fill stage reduced the number of seeds per
pod and later on reduced the mean seed weight of P. vulgaris. Shibles and Weber (1966) found in
soya beans that water stress during pod set was
beneficial, but excessive water stress caused
excessive pod and seed abortion which could lead
to complete loss of yield.
5.2. Phosphate Fertilizer Effects
5.2.1. Effect of phosphate fertilier on the rate of
growth and accumulated dry matter
The rates of dry matter increase in the
leaves, stems, pods and roots were increased by
the phosphate fertilizer before the onset of
negative growth. Phosphorus is essential for
cell development and division hence more
satisfactory growth is expected in the phosphorus
treated than in the control plants.
The rate of root growth was generally
higher in the fertilized than in the control
122
plants, resulting in higher root dry matter in
the former than in the latter plants, although
the differences were not significant. This
indicated that phosphorus stimulated production
of a stronger and more vigorous root system
which could provide better anchorage of the
plants in the soil, explore the soil for and
absorb more nutrients including phosphorus, and
water from the soil. This would lead to improved
growth and- development by the plant as a whole
as compared to the unfertilized plants.
Improved growth rate and dry matter
accumulation in the fertilized plants could also
have been due to improved nitrogen uptake by these
plants. Fertilized plants had higher number and
weight of nodules than the control plants, hence
the rate of nitrogen fixation and uptake could also
have been higher in the fertilizer-treated than in
the control plants. Sundara Rao (1971) found
that phosphate application increased nitrogen
uptake by lucerne crop by 26.4 kg N/ha.
The greater rate of leaf growth in the
fertilized than in the control plants resulted in
higher leaf area indices in these plants. Hence
123
greater amounts of photosynthates could have been
manufactured in the fertilized than in the control
plants, resulting in greater rates of growth and
higher dry matter quantities in the former than
in the latter plants.*
Higher stem dry matter amounts in the
fertilizer-treated plants implied that phosphorus
helped in producing stronger stems which had more
resistance to lodging, or taller plants with
consequent higher height to the first inflorescence
hence the reproductive organs were carried further
above the soil surface where they were less likely
to be damaged by soil fungi.
Peak rates of dry matter production and
peak dry matter amounts were higher in the
ferti 1 izer-treated than in the control plants. N<
Peak growth rates in the leaves, stems, and roots
were attained in the 9th week. Peak dry matter
amounts were attained in the same week, except
in the stems whose peaks were attained in the 11th
week. The peaks were more sharply defined, and
earlier, in the leaves than in the stems probably
because of leaf senescence and abscission.
Negative leaf growth occurred earlier in
124
the fertilizer-treated than in the control plants
in the 1979 crop. Negative leaf growth at the
50 kg P/ha treatment commenced in the 9th week,
and in the 11th week for all the other treatments.
In the 1980 crop negative leaf growth commenced
in the 11th week. The rates of leaf dry matter
decline in the leaves and in the other plant
organs were higher in the fertilizer-treated than
in the control plants. This could probably be
connected with the effect phosphorus has on
enhancing plant maturity, particularly if the
nutrient is in excess in relation to other nutrients
(Gt. Brt. Min. Agric. 1964), nitrogen being
one of the most important. When available
phosphates are abundant in the rooting medium, the absorption of inorganic nitrogen compounds
is depressed. The application of phosphatic
fertilizers may therefore alter the nitrogen
balance of the plant, resulting in the earlier
maturation of plants when available phosphates are
high, and the delay in reaching maturity occassioned
by phosphorus deficiency ( Meyer and Anderson,
1968). It is probable that the rates of
phosphorus used in this work were in sufficient
quantities to cause the nutrient imbalances
125
which would result in the above effect. The
quantity of fixed nitrogen in the fertilizer-
treated plants could probably not match the
amounts of available phosphates, and in the
latter stages of growth small or no amounts of
nitrogen could probably have been fixed due to
decay and disintegration of the nodules. Hence
the absorbed phosphorus might have accumulated
in the plant tissues without improving growth
or enhancing dry matter production. Parodi £_t
al* (1977) reported that phosphorus applications to
potted plants (P. vulgaris) increased the
relative and absolute content of phosphorus in the
plant but dry matter production did not increase.
Martin (1976) also found that phosphorus, potassium
and sulphur accumulated in the plant tissues
(P. vulgaris) in the absence of nitrogen.
The greater rate of leaf dry matter decline
in the fertilized plants implied higher rates of
leaf senescence than in the control plants. This
would lead to greater rates of reduction in
photosynthetic surface. Consequently rates of
dry matter production would also be lower than in
the control plants. Since the rates of leaf dry
matter decline were lower in the control than in
126
the fertilized plants, the former plants retained
their leaves and continued to produce plant dry
matter for a longer time than the fertilized
plants, hence the lower rates of plant dry matter
decline in the control plants, and the small
differences in dry matter between the fertilized
and the control plants.
-5.2.2. Effect of Phosphate Fertilizer on Leaf Area
Index
Leaf Area Index (LAI) increased with
increase in fertilizer level. The increase was
significant between the control and the fertilized
plants, but the difference within the fertilizer
treatments was not significant. These results
agree with Mahatanya's (1976) work in which he
also obtained higher LAI in the phosphorus-
treated than in the unfertilized plants but the
LAI differences within the different fertilizer
treatments were not significant. The higher the
LAI the higher the photosynthetic potential of a
crop up to a certain limit. Hence greater amounts
of photosynthates are manufactured at higher leaf
areas resulting in higher growth rates in the
leaves, stems and roots, and the plant as a whole.
127
The corresponding increase in dry matter with
increase in fertilizer level could therefore have
been partly due to the corresponding increase in
LAI. Watson (1956) concluded that leaf area
and yield are closely related and that increasing
the former will increase the latter.
It can be noted that at the two highest
fertilizer levels the LAI was beyond 5 in the 6th
week and beyond 6 in the 9th week in the 1980 crop
(Table 9): An optimum LAI for every economic
crop ranges from 2.5 to 5 (Mitchell/ 19 70) .
Probably, plants at the high fertilizer levels
produced more leaves of which the lower ones were
shaded by the upper ones, hence they could not
intercept sufficient incoming radiation to
photosynthesize efficiently. A condition of
parasitism might therefore have occurred, the
lower leaves using carbohydrates at a greater
rate than they could photosynthesize. This could
probably explain whyfwhile the increase in LAI
with increase in fertilizer level was significant
from the 6th to the 11th week in the 1980 crop,
the increases in seed yield and total dry matter
at final harvest with the rise in fertilizer level
were not significant.
128
5.2.3. Effect of Phosphate Fertilizer on Pod Dry
Matter and Number of Pods per Plant
The number of pods per plant increased with
increase in fertilizer level except at final
harvest in the 1980 crop. Other researchers
including Edje et al.. (1975) and Haag et al ( 1978)
also obtained increases in pod number per plant
with increase in fertilizer level. It is noted,
however, that the differences in pod number were
not significant. The rate of dry matter decline
was higher in the fertilizer-treated than in the
control plants. The rate of pod abscission could
also have been higher in the control than in the
fertilizer-treated plants, making the number of
pods more uniform at all the treatments. Also,
LAI at the control and at the lowest fertilizer
level was lower than at the two higher fertilizer
levels. Hence at the former two treatments,
the pods were less heavily shaded in the leaf
canopy and greater photosynthesis by the pods could
have occurred than at the two higher fertilizer
levels. Greater rate of leaf fall which was
indicated by the higher rate of negative leaf
growth from the 11th week in the fertilized plants
meant greater reduction in photosynthetic potential
129
of these plants. This would mean reduction in
dry matter that is partitioned to the pods. At
the control and at the lower fertilizer level
where the rates of leaf fall were lower, the
leaves could have photosynthesised for a longer
period, hence producing greater amounts of dry
matter for their pods. The greater rate of
pod abscission,the greater degree of pod shading,
and the higher rate of leaf fall at the highert
fertilizer levels would all tend to reduce the
advantage the plants at these levels have of
increased pod dry matter by the phosphate
fertilizer/ hence the insignificant increases in
pod dry matter and pod number per plant with
increase in fertilizer level. Duarte (1967)
found that defoliation at flowering reduced the
number of pods per plant but did not significantly
affect the number of seeds per pod or 100-seed
weight.
5.2.4. Effect of Phosphate Fertilizer on the
Number of Seeds per Pod and 100-Seed Weight
In the 1979 crop, the number of seeds per
pod at the 150 kg P/ha treatment was significantly
higher than at the control, but the seed number
130
differences within the three fertilizer treatments
were not significant. In the 1980 crop, no
significant changes in seed number per pod with
changes in fertilizer level were observed.
Mahatanya (1976) also reported increases in seed
number per pod with increase in fertilizer level,
but seed number differences within the fertilizer
treatments were not significant. Haag et al.
(1978) obtained significant increases in the
number of seeds per pod with increase in
fertility level. However, other researchers
including Leakey (1972) and Edje et al.(1975)
did not obtain significant effect of fertilizer
on the number of seeds per pod.
In both seasons, 100-seed weight was not
apparently affected by phosphate fertilizer
application. Leakey (1972) also found that the
mean seed weight was not altered by changes in
fertility level. Gurnah (1979) also did not obtain
any effect on Soybean weight by phosphate
fertilizer, but Haag et a_l. ( 1978) reported an
increase in bean seed weight with increase in
fertility level.
Since there was an increase in seed yield
with increase in fertility level, yet seed number
131
per pod and 100-seed weight increases were only
slight, the increase in seed yield could have
been largely due to the increases in the number
of pods per plant. Mujeeb and Greig (1973) found
that bean yield of four mutants were significantly
related to pod number which contributed more
to yield than did number of seeds per pod or
lOO-seed weight.
5.2.5. Effect of Phosphate Fertilizer on Seed Yield
In 1979 the 13% increase in seed yield at
the highest fertilizer level over the control
could probably be attributed to the higher number
of pods per plant and higher number of seeds per
pod. These two components of yield increased
with increase in fertilizer level, while the 100-
seed weight was seemingly unaffected by fertilizer
level changes. Haag et al. (1978) reported that
the main effect of high fertility level was to
enhance the role of "pods per plant" and "single
seed weight" in influencing seed yield. Hodgson
and Blackman (1955) and Goulden (1975) reported
that seed yield production was solely governed
by the number of mature pods formed.
132
In 1980, the 9% increase in seed yield at
the highest fertilizer level over the control was
probably due to the higher number of seeds per
pod and 100-seed weight. These yield components
increased, though insignificantly, with increase
in fertilizer level, while pod number per plant at
final harvest did not increase in fertilizer level.
Fertilized plants dried earlier than the
untreated’plants, but final harvest was taken at
the same time for all the treatments when all the
plants had dried. This implied that by final harvest
greater seed loss through seed shattering could have
occurred at the higher fertilizer levels where
plants dried earlier than at the control and the
lower fertilizer level. This might help to explain
the non-significant difference in seed yield between
the fertilized and the unfertilized plants.
5.2.6. Effect of Phosphate Fertilizer on Harvest
Index
This is a measure of dry matter
partitioning between economically useful parts and
the rest of the plant. It is expressed as:-
133
Harvest Index Economic yield x 100Total biological yield(F.A.O., 1977)
When calculating harvest index (HI) in this study,
the numerator was seed yield in kg/ha, and the
denominator was total dry matter at harvest in kg/
ha. These two components were not significantly
affected by fertilizer level changes. Consequently,
H.I. was also not significantly altered by
fertilizer rates.
The average HI in 1979 crop was higher than
in 1980 crop, being 40% and 38% respectively. It
therefore appears that a greater proportion of dry
matter was partitioned to the seeds in 1979 than
in 1980. The more favourable rainfall regime in
the first rains of 1980, and consequently better
growth conditions than those of 1979, might have
favoured production of greater proportion of
vegetative growth.
In many food legumes there is a continuous
senescence and fall of leaves during the growth
of plants. These leaves are also part of the
biological yield produced by the plant, hence
harvest indices calculated from final harvest data
may be higher than they actually should be because
134
only sun-dried shoots without, or with very few,
leaves, are used to determine the H.I. The
figures therefore do not trully represent the H.I.
(F.A.O. 1977).
5.2.7. Effect of Phosphate Fertilizer on Number
and Weight of Nodules
In the second rains of 19 79 the number and
weight of nodules was lower than in the first
rains of 1980. A possible explanation could be
that the 1979 crop was planted in field 19 while
the 19 80 crop was grown in field 14*, rhizobia
strains capable of nodulating bean roots are
lacking in field 19 (Keya and Mukunya, 1979).
The poorer growth conditions in 1979 which adversely
affected general plant growth including the roots,
could also have interfered with nodule formation.
Phosphorus significantly increased the number
and weight of the nodules formed. The phosphorus
effect agrees with Keya's (1975) observation that
the effect of superphosphates in legume nodulation
was to increase the number of nodules formed per
plant. Singh (1971) working with chickpeas,
(Cicer arietinum L.) also obtained significant
135
increases in nodule number and weight. Thus
with 67.5 kg P2 O^/ha, a maximum of 138 nodules
having 471 mg dry weight were produced. Most
probably phosphorus stimulated nodulation more
through its effect on bacteria than on the hosts.
In the presence of adequate phosphorus, the
bacterial cells become motile and flagellate, the
pre-requisite for bacterial migration, whereas in
the absence of phosphorus or with its inadequate
supply, the infection remains latent, leading to
the poor development of nodules (Singh, 1971).
The effect of increasing the rate of growth,
plant dry matter and yield by phosphorus could
partly be attributed to the increase in the number
and weight of nodules by the phosphate fertilizer.
The increase in the number and weight of nodules is
associated with increase in nitrogen fixation. Nodule
number and nodule mass can serve as reliable
indicators of nitrogen fixation even as early as 3
weeks after emergence (Keya and Mukunya, 1979). During
the late stages of growth, these indicators become
less reliable because the nodules decay and
disintegrate as the plant approaches maturity.
The number and weight of nodules increased
136
significantly with increase in fertilizer level, the corresponding yield increase was not
significant. Ttiis implied that the effect of phosphorus on the magnitude of nodulation was not
same for the dry matter production. This could mean that some or most of the nodules formed might have been partially or wholly ineffective in fixing nitrogen. Kintungulu Zake (1979) had found in groundnuts that, while phosphorus increased root number of nodules l i ne ar l y , it increased the dry weight of
groundnut tops in a quadratic manner, and the find in g s warned against equating nodulation with
nitro g e n fixation.
It can be noted that the number and weight
of nodules decrease as plant maturity was approached. The same effect was observed by Keya and Mukunya (1979) who obtained peak nodulation between 30-40 days after plant emergence, one nonth later, the number of nodules decreased
drastically irrespective of treatment.
137
maximum number of nodules is formed shortly before
anthesis, and the nodules decay by the time the
plants are mature. This is probably due to
competition for photosynthates between the
developing pods and the nodules. Since the
developing pods provide a "sink" closer to the
"source" leaves, the former become the
recipients of photosynthates at the cost of the
nodules (F.A.O. 1977).
5.2.8. Possible Reasons for Lack of Significant
Phosphate Fertilizer Effects on Growth
and Yield
1. Field beans (P. vulgaris) like other legumes
have a well-developed tap root system with
an extensive lateral root system
concentrated largely in the top 25 cm of
the soil (Smartt, 1976)*, the tap root
grows deeper into the soil. Phosphorus
was applied at a depth of about 3 cm in
the furrows at planting time. Being one
138
of the less mobile elements, Phosphorus
could have been out of reach of most of
the bean roots. Dow et al. (1970) obtained
little or no response of dry beans
(P. vulgaris) to NPKS and Zn fertilizers
and it was suggested that one of the
reasons for lack of response was deep
rooting,
2. Excess of phosphorus in relation to other
nutrients can cause the too early maturation
of a crop so that yields are decreased
(Gt. Brt. Min. Agric. 1964). In this
study, the high concentrations of phosphorus,
ranging from 50 to 150 kg P/ha, which were
used could have caused imbalances of the
other essential nutrients particularly
nitrogen, sulphur and the micro-nutrients
zinc and molybdenum, causing the overall
effect of depressed growth in the latter
stages of growth and reduced yield.
Excess phosphate has been found to induce
zinc deficiency (Dow et aj.. 1970).
Devarajan e_t cal. (1980) working with red
gram (Cajanus cajan), black gram (Phaseolus
reported antagonistic effect of phosphorus
and zinc where high levels of phosphorus
(50 kg P/ha) resulted in lower straw and
grain yield,P content and uptake of
nutrients. Anderson (1956) observed
molybdenum deficiencies after thet
application of phosphorus in groundnuts.
Phosphorus fixation could also have occurred. Fixation refers to processes by which phosphorus is combined with soil constituents to form insoluble compounds which are largely unavailable to plants. Phosphorus may form insoluble compounds of calcium,magnesium, iron, aluminium and manganese. It may also combine with organic matter, or it may be adsorbed by the clay complex (Gt. Brt. Min. Agric. 1964). The pH range within which forms of phosphorus which the plants can absorb occur is between 5 . 5 , - 7. oH soils have high c oncentrations of iron, aluminium and manganese. if the pH is below 5 . 5 ,
insoluble compounds of iron and aluminium
140
immediate value for crops. Kaolinitic
soils are high fixers of phosphorus,
fixing it in the order of 500 to 1000 ppm
added P, except for coarse-textured soils
(Sanchez, 1976). Kabete soils are
basically kaolinitic, with a low pH
(5.2 - 5.6 as measured in 0.01 m calcium
chloride solution) , hence fixation of
the applied phosphate could have occurred.
Fixation capacity of the soils requires
to be satisfied at least locally around
the bands or spots where the fertilizer
is applied, before crops would show a
response.
The low response to phosphorus could also
have been due to there being an adequate
amount of phosphorus already present in
the soils. Soil analysis indicated that
the soil phosphorus was in the region of
4 ppm. This value is just below the
margin above which phosphate fertilizer
response is only probable (see Table 1 and the note below it)
141
5. In 1979, the limited phosphate fertilizer
response could have been caused by lack
of sufficient soil moisture due to the
dry conditions that persisted throughout
most of the growing season. Soil water
must be adequate to keep the nutrient
elements in solution from which they can
be absorbed by the plants. This is
particularly important for phosphorus
because the diffusion rate of phosphate
anion, which is slow enough even in moist
soils, is drastically reduced due to lack
of continuous moisture films as the soil
dries up. Phosphate anions diffuse in
short distances of not more than 1 mm.
Root growth is also restricted during
the dry season hence the root will not be
able to explore the soil for phosphorus
during this dry season. Where rainfall
is marginal for crop production, no
benefit from fertilizers may be obtained,
and in other areas where cropping
intensity and other yield potentials are
limited by low or poorly distributed
142
rainfall, only relatively small dressings may prove economic (Webster and Wilson, 1966).
5.3. Plant Population Effects
5.3.1. Effect of plant population on growth rate
The rate of dry matter accumulation in each
plant decreased with increase in plant population
(Table 25) . This indicated that the increase in
plant numbers imposed a stress which restricted
plant growth. This stress increased progressively
from the lowest to the highest plant population.
Supply of factors of production (nutrients,
moisture, light etc) apparently became less and
less as plant population was increased, hence
competition for these factors increased as plant
numbers per unit area increased. Among the
vegetative organs, the leaves were the most
affected by the competitional stress, as compared
to the stems and roots; this was indicated by
the more frequent significant differences in leaf
than in stem and root growth rates between the
various populations (Tables 21, 22 and 24).
143
On the "per unit area" basis, the rate of
increase in total dry matter per hectare increased
with increase in plant population (Table 25).
Hence growth rate per plant decreased,but growth rate per unit area increased with increase in
plant population. The decrease in the rate of
growth per plant was therefore more than
compensated for by the increase in plant numbers
per unit area. This trend was similar to that
observed in the rate of dry matter changes in
the leaves up to the 8th and the 6th week in the
1979 and the 1980 crops respectively. In the
stems and roots the trend was observed up to the
9th week in both seasons, while for pods it was
observed up to the 13th week.
Negative growth in the leaves, stems and
roots tended to commence earlier in the higher
than in the lower plant populations, again due to
the more severe inter- and intra-plant competition
at the higher populations. The rate of negative
growth per plant decreased with increase in plant
population, but the rate of negative growth per
hectare increased with increase in plant
population. Hence the higher plant populations
144
lost dry matter per hectare at a faster rate than
the lower populations. Among the vegetative organs,
this effect was again most obvious in the leaves.
The rate of stem and root growth did not appear to
be very much influenced by plant population
changes.
In the 9th week of the 1979 crop, stem
dry matter was still increasing at the rate of
270 kg/ha/week at the highest plant population,
but leaf dry matter was decreasing at the rate
of 250 kg/ha/week (Tables 21 and 22). In the
11th week of the 1980 crop stem dry matter was
increasing at the rate of 88.9 and 10.0 kg/ha/week
at the second highest and the highest populations
respectively. In the same week, root dry matter
was decreasing at the rate of 31.1 and 60.0 kg/ha/
week at the respective plant populations (Table
24). Hence the sharp drop in the rate of total
dry matter increase at the highest plant population
in the 9th week of the 1979 crop and the 11th week
of the 1980 crop could have been caused mainly by
the drop in the rate of leaf dry matter production.
Leaf dry matter decrease w a s caused mainly by
leaf senescence and a b s c i s s i o n a s a result of
translocation of n u t r i e n t s f r o m t h e l e a v e s to t h e
145
pods. The leaves withered faster in the high
than in the low plant populations probably due
to the mutual shading of the lower leaves, and
the more severe inter- and intra-plant competition
at the higher than at the lower plant populations.
Between the 11th and 13th weeks of growth,
the rise in the rate of total dry matter
production per unit area with increase in plant
population was due mainly to the increase in the
rate of pod dry matter accumulation with rise in
plant population. At this stage, the rate of
pod growth per hectare was positive, and increased
with increase in plant population (Table 23),
while the other plant parts i.e. leaves, stems and
roots had negative growth rates. Hence after pod
initiation, the available assimilates were
translocated to the pods, rather than to the
vegetative organs.
In the 15th week of the 1980 crop, the
rate of growth was still positive at the lowest
plant population, but negative at all the three
higher populations. Hence the more sparsely
spaced plants continued to accumulate dry matter
for a longer time than the more densely packed
plants. This was because of lack of competition
146
between the low population plants, so that a
positive continued growth was observed.
5.3.2. Effect of plant population on Leaf Area
Index
Leaf Area Index (L.A.I.) increased
progressively with increase in the number of
plants per hectare (Table 26). Optimum L.A.I.
for economic crops ranges from 2.5 to 5 (Mitchell,
1970) but leaf area indices at the two lower
populations did not get beyond 2.3, and at the
lowest population the L.A.I. was below 2 in the
1979 crop. At the lowest population in the 1980
crop, peak L.A.I. of 4.2 occurred in the 9th
week, while at the highest population the peak
was 9.3. This implied that more complete ground
cover was attained at the higher than at the
lower plant populations. Consequently,
interception of photosynthetically active
radiations would also be expected to be higher
at the higher plant populations, resulting in
higher rates of photosynthesis and dry matter
accumulation than at the lower populations. The
observed higher rates of growth and dry matter
- 147 -
accumulation per hectare at the higher plant
populations could therefore have been due to the
higher L.A.I.
It was noted that L.A.I. at the highest
plant population in the 8th week of the 1979 crop
was higher than 5. In the 6th week of the 1980
crop also,the two highest, and in the 9th week
the three highest populations had leaf area
indices which were higher than 5. It was also
observed that the rate of dry matter decline per
hectare, particularly leaf dry matter was higher
at the high than at the low plant populations.
This could probably have been due to insufficient utilisation of all the available leaf area at the high plant populations because of excessive shading of the lower leaves. The lower leaves were therefore shed earlier and at a faster rate at the high than at the low plant populations.
After pod initiation in the 7th week,
the developing pods at the lowest plant
populations were not as heavily shaded in the leaf
canopy as those at the higher populations, hence
direct sunlight could have had access to these
pods which could therefore have photosynthesised
- 148 -
a t a g r e a t e r r a t e t h a n t h o s e a t t h e h i g h e r
p o p u l a t i o n s . T h e h i g h e r n u m b e r o f p o d s p e r
p l a n t , n u m b e r o f s e e d s p e r p o d and s e e d w e i g h t
a t t h e l o w e r t h a n a t t h e h i g h e r p l a n t p o p u l a t i o n s
c o u l d h a v e b e e n p a r t l y d u e t o t h i s e f f e c t .
Lucas and Milbourne (1970) reported that a
reduction in leaf area after flowering and
during the podding stage enhanced seed-weight as
well as increasing the number of filled pods,
and this provided evidence of the Dossible value
of direct sunlight to the pods.
5.3.3. Effect of plant population on dry matter
T h e v a r i a t i o n s i n d r y m a t t e r a c c u m u l a t i o n
r a t e s c a u s e d b y t h e v a r i o u s p l a n t p o p u l a t i o n s
w e r e r e f l e c t e d i n t o t a l d r y m a t t e r a c c u m u l a t e d
a t v a r i o u s s t a g e s o f g r o w t h ( T a b l e 30). A s
w i t h t h e r a t e o f g r o w t h , d r y m a t t e r p e r p l a n t
d e c r e a s e d w h i l e d r y m a t t e r p e r u n i t a r e a i n c r e a s e d
w i t h i n c r e a s e i n p l a n t p o p u l a t i o n . E v e n a t w e e k
13 o f b o t h c r o p s i n t h e h i g h e s t p l a n t p o p u l a t i o n
t o t a l d r y m a t t e r p e r u n i t a r e a w a s s t i l l
i n c r e a s i n g . T h i s i n d i c a t e d t h a t t h e d e c r e a s e in
d r y m a t t e r p e r p l a n t w i t h i n c r e a s e i n p l a n t
- 149 -
population was still being more than compensated
for by the increase in plant numbers per
hectare even at the highest plant population.
This implied an asymptotic relationship between
plant density and dry matter yield. Similar
effect has been reported in P. vulgaris by
Leakey (1972) and Enyi (1975) among others.
In the 1980 crop, the three highest
populations attained their peak dry matter per
unit area in week 13 after which there occurred
a rapid decline towards the 15th week of growth.
At the lowest population, dry matter per unit
area was still increasing even in week 15. The
continued dry matter additions at the lowest
plant population could have been due to the
lower rate of leaf dry matter decline. The
leaves at this population in the 15th week were
being shed at the rate of 368 kg/ha/week as
compared to the rate of 850 kg/ha/week at the
highest population,a difference of about 57%
(Table 21). The lower rate of leaf senescence
at the lowest plant population also implied that
there was a greater number of leaves which could
photosynthesise, hence cause dry matter additions.
150
Lucas and Milbourne (1976) also reported slower
senescence and prolonged photosynthetic activity
in the more widely spaced plants.
In the 1979 crop, peak total dry matter
was not attained and continued to increase up to
the 13th week in all the plant populations. This
was probably because sequential harvesting was
terminated two weeks earlier in this season than
in the 1980 crop. A similar effect as that
observed in the 1980 crop could probably have
been obtained had a further harvest been taken
in the 15th week.
In the 1979 crop, peak leaf dry matter
per plant was obtained in the 8th week at the
highest plant population, but in the 9th week at
all the other populations, (Table 27). In the
1980 crop, peak leaf dry matter was obtained in
the 9th week in all the four populations. Peak
stem and root dry matter per plant also tended
to occur later at the lowest plant population
(Tables 28 and 30). Hence peak dry matter per
plant tended to occur later at the lower than at
the higher plant populations indicating that at
the lower population, dry matter production per
- 151 -
plant, and hence per unit area, continued for a
longer time than at the higher plant populations.
The increase in plant numbers compensated for
this effect by having higher peaks per unit
area than at the lowest plant population, hence
the advantage of longer period of dry matter
production at the lowest plant population was
offset when considering dry matter production
per unit area.
5.3.4. Effect of plant population on total dry
matter at harvest
As observed earlier plants at the higher
populations lost their dry matter per unit area
at a faster rate than those at the lower plant
populations (Table 25). This had the effect of
reducing the difference in dry matter between the
lower and the higher plant populations caused by
the higher dry matter accumulation rates per
hectare at the higher populations during the
earlier stages of growth. It was also observed
that the leaves at the lower populations continued
to produce dry matter for a longer period than
those at the higher plant populations, hence dry
152
matter production continued at the lower
populations while production at the higher
populations had already stopped. This might be
attributed to less competition in lower populations
and hence continued growth. This might probably
account for the lack of significant differences
in the final dry matter at harvest in the 1979
crop, and for the lowest population having
higher final total dry matter than the higher
plant populations.
5.3.5. Effect of Plant Population on Yield Components
5.3.5.1. Number of pods
As was the case with the vegetative dry
matter", the number of pods per plant decreased with
increase in plant populations and the number of
pods per hectare increased with increase in plant
population (Table 33). This is in agreement with
the findings of Leakey, (1972) , Rojas et a_l. ( 1975) ,
and Westermann and Crothers (1977).
T h o u g h n o d a t a w a s c o l l e c t e d on t h e numbe r
o f b r a n c h e s i t w a s o b s e r v e d t h a t a s p l a n t
p o p u l a t i o n w a s i n c r e a s e d , p l a n t s t e n d e d t o g r o w/
t a l l e r d u e t o i n c r e a s e d i n t e r n o d e l e n g t h , a n d t o
h a v e f e w e r b r a n c h e s t h a n p l a n t s a t t h e l o w e s t
population. Hodgson and Blackman (1956) reported
an increase in the number of podless stems per
plant with increase in plant density. Bennet
et al. (1977) had found in P. vulgaris that the
number of racemes per node and branches per plant
were significantly reduced by increasing plant
population density. Most of the variation in
the number of pods per plant was attributed to
changes in the number of branches and raceme
development.
Edje and Mughogho (1975) also reported
a decrease in the number of flowers setting mature
pods, resulting from interplant competition at
high plant densities. Leakey (1972) also
reported that the number of pods produced per
plant was actually much less than the number of
flowers. Hodgson and Blackman (1956) found in
broad beans (Vicia faba) that as plant density
was increased, the number of nodes bearing pods
diminished primarily due to the abscission of
the inflorescences. Meadley and Milbourne (1970)
reported that there was a 34% greater flower and
pod wastage in vining peas planted at 172 plants
per meter square than at a lower plant population.
This reduction in the number of flowers with
154
increase in plant density was due to competition
between plants for environmental resources,and
within plants for the available assimilates, which
results in the reduction in the number of potential
"sinks".
The observed reduction in the number of
pods per plant with increasing plant population
could therefore have been due to:
1. decrease in the number of branches per
plant
2. decrease in the number of productive
stems or decrease in the number of
branches that bear flowers
3. greater flower wastage at high plant
densities.
When plant population is increased, the resulting
reduction in the number of pods per plant is
relatively less, so that pods per unit area rises./
5.3.5.2. Number of seeds per pod
In both seasons, the highest plant population
had significantly lower number of seeds per pod
than the lower populations (Table 34). Leakey
(1972), and Westermann and Crothers (1977) had also
obtained a similar trend. Hence at the highest
155
population competition was severe enough to affect
the seed number per pod, but in the 1979 crop,
competition was apparently not severe enough to
result in significant differences in seed number
per pod between the three lower plant populations
5.3.5.3. 100-seed weight
No significant changes in 100-seed weight
with variations in plant population were obtained4
in the 1980 crop, and in the 1979 crop the
variations were irregular (Table 34). However,
the lowest 100-seed weight was obtained at the
highest population in the 1979 crop, and the
difference in seed weight between this population
and the other three was significant. This
implied that competition between and within
plants must have been quite severe in this season
at the highest plant population, probably
because of the less favourable rainfall regime
in that season as compared to the 1980 season.
Froussios (1970) had also found that the weight
of seed decreased at plant densities higher than 2100 plants/m , Enyi (1975) and Westermann and
Crothers (1977) also reported that grams/seed
increased as plant population decreased.
156
Among t h e h i g h l y p l a s t i c c o m p o n e n t s o f
y i e l d , t h a t i s , n u m b e r o f p o d s p e r p l a n t , n u m b e r
o f s e e d s p e r p o d , a n d s e e d w e i g h t , t h e l a t t e r
c o m p o n e n t i s n o r m a l l y t h e l a s t t o b e a f f e c t e d b y
c o m p e t i t i o n a l s t r e s s ( A r n o n , 1972).H a r p e r (1961)
c o n s i d e r s t h i s t o b e an i n t e r n a l o-r p h y s i o l o g i c a l
h o m e o s t a s i s w i t h r e s p e c t t o t h e o r g a n t h a t i s
e s s e n t i a l f o r r e p r o d u c t i o n a n d d i s p e r s a l .
5.3.6. Effect of plant population on seed yield
I t w a s n o t e d e a r l i e r t h a t t h e r a t e o f
l e a f s e n e s c e n c e p e r h e c t a r e i n c r e a s e d a s p l a n t
p o p u l a t i o n r o s e ( T a b l e 21). C o n s e q u e n t l y
p l a n t s a t t h e h i g h e r p l a n t p o p u l a t i o n s d r i e d
f a s t e r t h a n t h o s e a t t h e l o w e r p o p u l a t i o n s , h e n c e
s e e d l o s s t h r o u g h s e e d s h a t t e r i n g c o u l d h a v e
b e e n g r e a t e r a t t h e h i g h e r t h a n a t t h e l o w e r p l a n t
p o p u l a t i o n s . L e a k e y (1972) a l s o r e p o r t e d a d e c l i n e
i n s e e d y i e l d a t h i g h p l a n t d e n s i t i e s d u e t o s e e d
s h a t t e r i n g . P l a n t s a t t h e l o w e r p o p u l a t i o n s
w h i c h had a l o w e r r a t e o f l e a f s e n e s c e n c e p e r
h e c t a r e c o u l d a l s o h a v e p r o d u c e d more p o d d r y
m a t t e r , h e n c e g r e a t e r n u m be r o f p o d s an d s e e d s
a f t e r t h e p l a n t s a t t h e h i g h p o p u l a t i o n s h a d
157
already stopped to produce additional dry matter.
The seeds at the highest plant populations were
also significantly lighter than those at the
lower populations. These factors might probably
help to explain the decrease in seed yield
with increase in plant population.
5.3.7. Effect of Plant Population on Harvest Index
Harvest index decreased significantly
with increase in plant population, indicating
that the proportion of vegetative dry matter
increased as plant population rose (Table 35).
This is in agreement with Nichols (1975) who
suggested that with increasing plant density,
a smaller proportion of assimilates is
partitioned to the seeds, and more to the leaves
and stems. Arnon (1972) reported that the internal
competition within the individual plant between
vegetative and reproductive parts becomes more
severe as competition between plants increases,
for example with increasing population pressure.
As plant density is increased, changes may occur
in the allocation of assimilates to different
parts of the plant as a result of which greater
- 158 -
proportion of the plants or of the reproductive
parts of an individual plant may become
barren. Grain production then shows a decline
in yield whereas the total dry matter production
may remain constant (Arnon, 1972).
5.4. Plant Population Density x Fertilizer
Interaction
Significant interactions between plant
population density and fertilizer were obtained
at only a few stages of growth (Tables 36 to
43) . Tables 36, 37, 39, 41 and 43 show that
where fertilizer was not applied( control)
significant differences in stem growth rate in
the 15th week, pod growth rate in the 13th week,
leaf area index in the 11th week, pod dry matter
in the 9th week and nodule weight in the 4th week,
between different populations were not obtained.
Significant differences were obtained only where
fertilizer was applied. Where significant
differences at the control occurred, they were not
as clearly marked as where the fertilizer was
applied. During the 15th week of growth for
example, significant differences in leaf growth
- 159 -
rate (Table 36 ) between the four population
densities were obtained but the clearest
responses occurred at the 100 kg P/ha and 150 kg
P/ha fertilizer levels. This tends to indicate
that phosphorus is already a limiting factor in
Kabete soils, and responses to plant population
densities can only be obtained after phosphorus
application. Different phosphate fertilizer
levels did not influence the various population
densities differently.
160
C H A P T E R 6
CONCLUSION
In this study, significant phosphate fertilizer
effects on growth and yield of beans were not
obtained. However, fertilized plants showed improved
growth, dry matter and seed yield over unfertilized
plants. Fertilized plants had:-
1. More vigorous root systems which indicated
improved water and nutrient absorption
from the soil.
2. Higher leaf growth rate with consequent
higher LAI resulting in manufacture of
greater amounts of photosynthates.
3. Higher stem dry matter indicating
production of stronger stems more
resistant to lodging and higher height
to the first inflorescence protecting
the reproductive organs from possible
soil pathogens.
4. Higher number of pods per plant and higher
number of seeds per pod which resulted
in 13% and 9% increase in seed yield in/
161
1979 and 1980 respectively over
unfertilized plants.
5. Significantly higher number and weight
of nodules which could have resulted in
higher rates of nitrogen fixation with
consequent improvement in crop growth
rate and yield.
6. H i g h e r r a t e o f p l a n t s e n e s c e n c e w h i c h
e x e m p l i f i e d t h e e f f e c t p h o s p h o r u s has
i n e n h a n c i n g p l a n t m a t u r i t y .
The non-significant differences in growth and
yield due to the different fertilizer levels indicated
that the bean plants did not substantially benefit
from fertilizer rates higher than 50 kg P/ha. Higher
fertilizer rates also tended to result in
excessively high LAI in 1980 which did not result in
corresponding increase in yield. Taking into
account the improved performance of the fertilized
plants and the non-significant yield differences
due to the various fertilizer levels, application of
50 kg P/ha to the bean plants appears to be the best
under Kabete conditions.
Rising rates of dry matter production with
increase in plant population did not result in
162
corresponding increase in seed yield. This indicated
that vegetative rather than reproductive growth
increased as plant population density was raised as
shown by decrease in Harvest Index Values with increase
in plant population. Thus vegetative growth
appeared to have increased at the expense of
reproductive growth. Since this particular crop is
grown mainly for its seed, increasing plant
population beyond 160,000 plants/ha does not appear
to result in any advantage. Hence for this particular
bean variety and under the Kabete conditions,
population of 160,000 plants/ha appears to be the
best.
Plant population density x fertilizer
interactions were largely insignificant. In the few
instances where significant interactions were
obtained, significant differences in different plant
densities occurred only where fertilizer was applied
and not at the control. This seemed to indicate
that phosphorus can be limiting in Kabete soils and
responses to plant population densities can only be
obtained after application of the element.
163
LITERATURE CITED
Acland, J.D., 1971: East African Crops.
Longman Group Ltd., london.
Adams, M.W., 1967: B a s i s o f y i e l d c o m p o n e n t
compensation in crop plants with special
reference to the field beans Phaseolus
vulgaris. Crop Sci. 7: 505-510.
Ahn, P.M., 1973, 1975: A n a l y t i c a l m e th o d s used
in t h e D e p a r tm e n t o f S o i l S c i e n c e ,
U n i v e r s i t y o f N a i r o b i . T e c h n i c . Communic.
1 and 5 .
Ahn, P.M., 1970. West African Soils. Oxford
U n i v e r s i t y P r e s s , London. (332 pp).
Almeida, D.L. De, 1973: /'Effect of liming and
NP fertilization on bean nodulation and
yield_/. Serie Agronomica 8 : 127-130.
Anderson, A.J., 1956: Molybdenum deficiencies
in legumes in Australia: Soil Sci.
81: 173-182.
Anderson, G.D., 1973: Bean responses to fertilizer
on Mt. Kilimanjaro in relation to soil and
climatic conditions. E.A. Agric.For. J. 34:
164
Appadural, R.R., J.B. Rajakarana and H. Gunasema,
1967. Effect of spacing and leaf area
on pod yields of kidney beans, Phaseolus
vulgaris. Ind. J. Agric Sci., 37: 22-26.
Arnon, I., 1972. Crop Production in Dry Regions.
Leonard Hill, London.
Bennett, J.P., Adams, M.W., and Burga, C. 1977.
Pod yield component variation and intercorrelation in Phaseolus vulgaris L.
as affected by planting density. Crop
Sci. Vol. 17: 73-75.
Carvalho, B.C.L. De, et al. 1974. / Planting
distances and density for beans in the
Northern State of Bahia/. In Procecto
Feljao, Brazil.
Chagas, I.M. and Viera, A.C., 1975. Influence of
planting distances and levels of
fertilization on bean yields and its
components. Revista ceres 22 (122): 244-263.
Comacho, L.H.S., S.H. Orozco and G. Bastidas, 1968.
Yield component vs. plant spacing in
beans. Bean Improv. Coop. Ann. Rep. 11:15.
165
Devarajan, R. , Moosa Sherrif, M., Ramanathan, G.
and Selvakumari, G. 1980. Effect of
phosphorus on yield content and its uptake
by pulse crops. Indian J. Agric. Res. 1980,
14(1): 47-52.
Donald, C.M., 1963. Competition among crop and
pasture plants: Adv. Agron. 15: 1-118.
Dow, A.I., Roberts, S. and Hintze. R., 1970.
Fertilizer trials on irrigated beans in
Central Washington. Washington
Agricultural Experiment Station. Circular
No. 564. 1973. 14p.\
Duarte, M.W. and Adams, M.W., quoted by Denis,
J.C. and Adams, M.W. Factor analysis of
plant variables related to yield in dry
beans 1. Morphological traits. Crop
Science Vol. 18 (1) : 74-78.
Edje, 0. T. , Mughogho, L.K., Ayonoadu, U.W.V. ,
1975. Bean yield and yield components
as affected by fertilizer and plant
population. Turrialba 25(1): 79-84.
166
Enyi, B.A.C., 1975. Effect of plant population on
grain yield production and distribution
of dry matter in beans (Phaseolus vulgaris)
Ghana J. Agric. Sci. 15 (2): 159-169.
F.A.O. Fertilizer programme. Ministry of Agric.
Kenya, 1971-1972: Crop Production
Division. Report Nos. 3 and 4.
F.A.O. 1977: Food legumes. Distribution,
adaptability and biology of yield. Sinha,
S.K., F.A.O. Consultant.
Froussios, G., 1970. Genetic diversity and
agricultural potential in Phaseolus
vulgaris L. Experimental Agric. 6 : 129-41.
Goulden, D.S., 1979. Effect of plant population
and row spacing on yield and components
of yield of navy beans. Phaseolus vulgaris
N.Z. Journal of Experimental Agric. 4:
177-80.
Grain Legume Project: Ministry of Agriculture.
National Horticultural Research Station,
Thika. Interim Report Nos. 8 , 9, 13 and 14
(1975, 1976, 1978, 1979).
167
Gt. Brit. Ministry of Agriculture. Fertilizers for
the Farm. Bulletin No. 195. Her
Majesty's Stationery Office. 1964.
Gurnah, A.M. 1979 . The effect of phosphate, plant
population and plant arrangement on yield
of soya beans at Kabete, Kenya. Paper
presented at the Symposium on Grain Legume
Improvement in Eastern Africa, Nairobi,
Kenya: August, 1979.
Haag, W.L., Adams, M.W. and Wiersman, J.U., 1978.
Differential responses of dry bean
genotypes to Nitrogen and Phosphorus
Fertilization of a Central American Soil.
Agron. J. 70: 565-568.
Harper, J.L., 1961. Approaches to the study of
plant competition: pp. 1-39. In
Mechanisms in Biological Competition.
Ed. F.L. Mithorpe, quoted by Arnon, 1972.
Hiroce, R., Romano, G., and Mascarenhas, H.A.A.
1970. / Leaf analysis in beans II.
Diagnosis of P. nutrition_?. Bragantia
(Brazil). 29 (2) : VII-XIII.
168
Immer, A.M. , Fischer, D.A. , Joshuel, S., 1977.
Effects of plant density and thinning on
high yielding dry beans (Phaseolus vulgaris)
in Mexico. Expl. Agric. 13: 325-335.
Kay, D.E., 1979. Crop Product Digest No. 3. Food
Legumes. London: Tropical Products
Institute, XVI +435 pp.
Keya, S.O., 1977. Nodulation and Nitrogen Fixation
in Legumes in E. Africa. In Biological
Nitrogen Fixation in Farming Systems of
the Tropics. A. Ayanaba and P.J. Dart
(eds.) John Wiley and Sons, New York.
Keya, S.O. and Mukunya, D.M. , 1979. The influence
of phosphorus and micronutrients on
nodulation of P. vulgaris at Kabete, Kenya.
Paper presented at the Symposium on Grain
Legume Improvement in Eastern Africa,
Nairobi, Kenya. August 1979.
Kintungulu Zake, J.V. 1979. The effect of Phosphorus,
S u l p h u r a n d tolybdenum on t h e g r o w t h o f
g r o u n d n u t s (A r a c h i s h y p o g a e a ) . P a p e r
p r e s e n t e d a t t h e S y m p o s i u m on G r a i n Legu me
I m p r o v e m e n t i n E a stern A f r i c a , N a i r o b i , Keny£i.
August 1979.
169
Kueneman, E.A., et al., 1979 . Effect of plant
arrangement and densities on yield of
dry beans. Agronomy journal 71: 419-424.
Lang, A .L . et al. (1956). Influence of population
and nitrogen levels on yield and protein
and oil contents of nine corn hybrids.
Agron. J. 48: 284-9. Quoted by Arnon,
1972./
Leakey, C.L.A. 1972. The effects of plant population
and fertility level on yield and its
components in two determinate cultivars
of P. vulgaris L. Savi. J. Agric. Sci.
79: 259-267.
Lucas, E.O. and Milbourne, G.M. 1975. The effect
of density of planting on the growth of
two Phaseolus vulgaris varieties in
England. J. Agric. Sci. 87: 88-98.
Mahatanya, E.T. 1976. The effects of P and Cu on the
bean plant. P. vulgaris. Mysore J.
Agric. Sci. 10 (2): 214-225.
170
Martin, M.I., Teixeira, N.T. and Netto, A. 1976.
/ Evaluation of micronutrients and total
and soluble nitrogen in beans/. Revista
Livroceres 1(2): 5-6.
Mascarenhas, H.A.A. (1966). (Spacing trials of the
dry bean variety Goiano brecace).
Bragantia 25: LI - LIII.
Matthews, W.A. 1933. The influence of planting
distances on the yield of snap and lima
beans. Proc. Am. Soc. Hort. Sci. 30:/
567-570.
Meyer, B.S., and Anderson, D.B. 1968. Plant
Physiology. D. Van Nostrand Co.
(Canada) Ltd.
Mitchell, A .R. 1964. Fertilizers for culinary
bean seed production in Northern Queensland,
Australia. Queensland J. Agric. Sci. 21
(3-4): 295-302.
Mitchell, R.L. 1970. Crop growth and culture.
Iowa State University Press, Ames.
Miyasaka, S. et al. (1965) / Fertilizer experiments
with dry beans on sandy soils of the
"Arenito Bauru" type/: Bragantia 24 (20):
231-245.
171
Mosley, A.R. 1972: Responses of bush snap bean
P. vulgaris to population density and
planting arrangement. Ph.D. thesis
Corvallis, Oregon State University.
Mujeeb Kazi, A. and Greig, J.K., 1973. Gamma
irradiation induced variability in
P. vulgaris L. Cu. Blue Lake. Radiat.
Bot., 13: 121-126, quoted by Mahatanya,
1976.
Nichols, M.A. 1974. Effect of sowing rate and
fertilizer application on yield of
dwarf beans. New Zealand J. Expl.
Agric. 2: 155-159.
Parodi, A.E., Opazo, A.J.D. and Masjidisch, J.1977. /"Effect of applying phosphorus on
biological yield and N.P.K. content of
the bean plant/. Agriculture Tecnica
37 (1): 12-18.
Pursglove, J.W. 1968. Tropical Crops.
Dicotyledons. Longman Group Ltd. London.
Rojas, G., Bravo, A., and Parodi, P. 1975 / The
effect of spacing on the yield of four
beans cultivars). Cienciae investigation
172
Agraria 2: 163-168.
Sanchez, Pedro A. Properties and Management of
Soils in the Tropics. John Wiley and Sons.
1976.
Schonher, S. and Mbugua, E.S., 1976. Bean Production
in Kenya's Central and Eastern Provinces.
University of Nairobi. Institute for
Development Studies. Occasional Paper
No. 23. 69p.
Singh, R.G. 1971. Responses of gram (Cicer
arietinum L.) to the application of
nitrogen and phosphate. Indian J. Agric.
Sci. 41 (2): 101-6.
Smartt, J. 1976. Tropical pulses. Longman Group
Ltd. London.
Stephens, D. 1967: The effect of ammonium sulphate
and other fertilizers and innoculation
treatments on beans P. vulgaris.
E.A.A.F. Journal 32: 411-417-
Sundara, Rao, W.V.B. 1971. Field experiments on
nitrogen fixation by nodulated legumes.
Plant and Soil. Special Volume 1971:
287-291.
173
Treshaw, M. 1970. Environment and plant responses,
MacGraw-Hill Book Company.
Watson, D.J. 1956. In the growth of leaves.
Proc. 3rd Easter Sch. University of
Nittingham, quoted by Mahatanya, 1976.
Webster, C.C. and Wilson, P.N. 1966. Agriculture
in the Tropics. Longman Group Ltd.,
London.
Westermann, D.T. and Crothers, S.E. 1977. Plant
population effects on the seed yield
components of beans. Crop Sci. 17:
493-496.
Wiley, R.W. and Osiru, D.S.O. 1972. Studies on
mixtures of maize and beans (Phaseolus
vulgaris) with special reference to plant
population. J. Agric. Sci. Camb. 79:
517-529 .
A P P E N D I X ___I: Rainfall and Temperature Data: Kabete


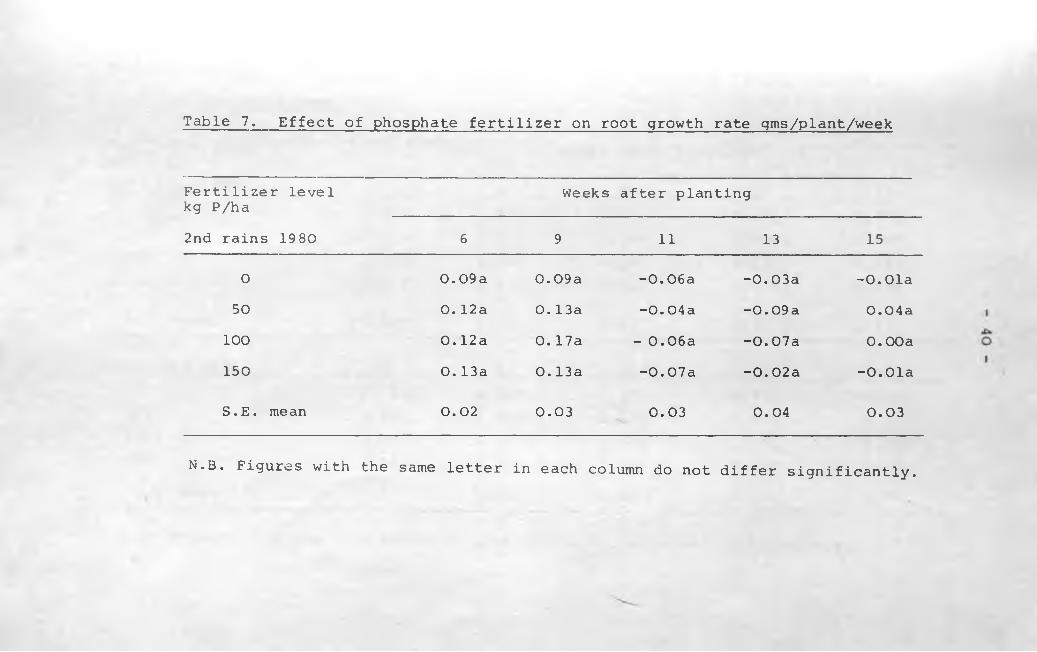


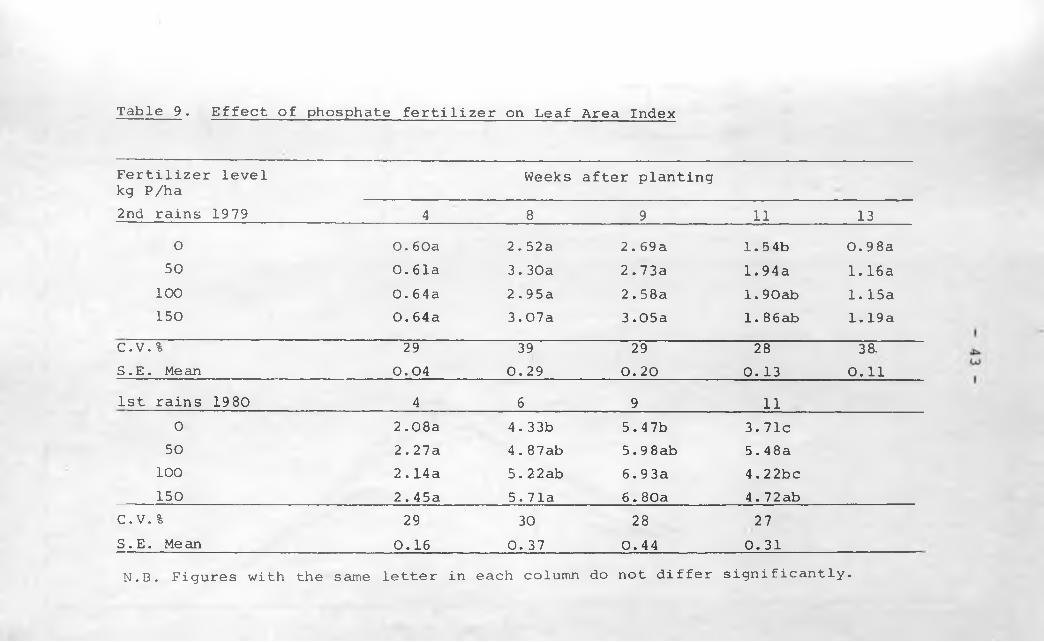


![Emerging Paradigms in Biosolids Management › wp-content › uploads › roadshow...1940 1960 1980 2000 2020] Super-phosphate 20% phosphate Super-phosphate 44-46% phosphate Diammonium](https://static.documents.pub/doc/80x56/5f0eaf737e708231d4406f3e/emerging-paradigms-in-biosolids-management-a-wp-content-a-uploads-a-roadshow.jpg)


