International Journal of Scientific and Research Publications, Volume 5, Issue 4, April 2015 1 ISSN 2250-3153 www.ijsrp.org Effects of Project Environment and Competetive Advantage on Market Performance of Urban Housing Projects: Case of Kilimani Area, Nairobi Keritu Angela Mukami * , Dr. Kinyanjui Nganga ** * Master of Science in Project Management student, Jomo Kenyatta University of Agriculture and Technology ** University Supervisor, Jomo Kenyatta University of Agriculture and Technology Abstract- The purpose of this research was to investigate on the factors affecting market performance of urban housing projects with specific reference to Kilimani area. The focus was on the project developer, the project architect and the project contractor of the housing projects in Kilimani area, Nairobi County. Although there are many factors that may influence market performance of housing projects, this study delimited itself to project competitive advantage and project environment. The research designs for this study were correlational and the descriptive research designs. The study targeted 167 respondents who were drawn from 56 housing projects which were randomly selected. A questionnaire was used to collect the data and 114 responses were received representing a 68% response rate. The Pearson Product Moment Correlation test was used to calculate to determine whether there was a linear relationship between the factors under study and the market performance of housing projects in Kilimani. The correlation analysis was done at 0.05 level of significance. To test the hypothesis, if the p value was ≤ 0.05 then a relationship existed and the null hypothesis was then rejected. From the analysis, all the four null hypothseses were rejected. With r = -0.6124 and p = 0.0256 < 0.05, H1 was rejected and it was concluded that there was a significant relationship between project cost and market performance of housing projects. With r = -0.1979 and p = 0.0134 < 0.05, H3 was rejected and it was concluded that there was a significant relationship between project environment and market performance of housing projects. Finally, with r = -0.4872 and p = 0.016 <0.05, H4 was rejected and it was concluded that there was a significant relationship between project competitive advantage and market performance of housing projects. It was recommended that project developers should be aware of the economic and political environment within which the project exists as these two factors greatly influence the number of houses sold and the project lead time. The project developer should also invest in the level of technology used in a project as it would influence the house prices. Index Terms- Competetive Advantage, Project Environment, Market Perfomance I. INTRODUCTION 1.1 Background of the Study rojects are authorized as a result of market demand and as such, their market performance is key to the success of the project (PMBOK, 2008). Market performance is thus a common and contemporary goal of many development projects in various countries (Chang & Lee, 2008). Numerous housing projects are developed worldwide as housing projects have gone beyond simply providing shelter and protection and moved to the consideration of comfort (Schoenauer, 2000). The development of housing sector necessitates knowledge on urban factors that could have an effect on the market performance of housing schemes. Since the economic crisis began in the United States and Europe in 2008, the global economy has undergone a massive change. According to Acharya et al. (2009) the United States real estate market is facing its worst hit in two decades due to the slowdown of housing sales. The most affected by this decline were real estate investors and home developers who were struggling to break-even financially on their investments. For these project investors, it is of importance to evaluate the current status of the market and predict its performance over the short- term in order to make appropriate financial decisions (Schoenauer, 2000). Additionally, Acharya et al. (2009) found that after the depression there was a decrease in the number of units sold as the projects costs had gone up. As a result the market performance of housing projects slowed down as lesser units were sold and they were sold at a longer duration. Investors in the United States were cautious in investing in the industry that was seemingly collapsing as the housing projects were doing poorly in the market which was not good for business. The decrease of prices of housing units raised come concern as it was having a direct effect on the market of housing projects. The study by Potepan (1996) also concluded that house prices increase with project costs which then lead to a sales drop of houses. Late completion of housing projects will have a significant effect on how the project will perform in the market because it delays what was already planned. The time overrun will affect the project since the developers or investors operate on a time- line where they are supposed to deliver the completed projects to certain stakeholders without delay. Okuwoga (1998) further adds that any delay caused is likely to lead to the stakeholders losing interest or the prices either moving up or down than it was earlier estimated hence effecting how the housing projects will perform at the time that they will be in the market. For a project to perform well, it exhibits some aspects of competitive advantage in comparison to other similar projects. Porter (2008) concluded that fundamental basis of above-average P
Transcript
International Journal of Scientific and Research Publications, Volume 5, Issue 4, April 2015 1 ISSN 2250-3153
www.ijsrp.org
Effects of Project Environment and Competetive
Advantage on Market Performance of Urban Housing
Projects: Case of Kilimani Area, Nairobi
Keritu Angela Mukami *, Dr. Kinyanjui Nganga
**
* Master of Science in Project Management student, Jomo Kenyatta University of Agriculture and Technology
** University Supervisor, Jomo Kenyatta University of Agriculture and Technology
Abstract- The purpose of this research was to investigate on the
factors affecting market performance of urban housing projects
with specific reference to Kilimani area. The focus was on the
project developer, the project architect and the project contractor
of the housing projects in Kilimani area, Nairobi County.
Although there are many factors that may influence market
performance of housing projects, this study delimited itself to
project competitive advantage and project environment. The
research designs for this study were correlational and the
descriptive research designs. The study targeted 167 respondents
who were drawn from 56 housing projects which were randomly
selected. A questionnaire was used to collect the data and 114
responses were received representing a 68% response rate. The
Pearson Product Moment Correlation test was used to calculate
to determine whether there was a linear relationship between the
factors under study and the market performance of housing
projects in Kilimani. The correlation analysis was done at 0.05
level of significance. To test the hypothesis, if the p value was ≤
0.05 then a relationship existed and the null hypothesis was then
rejected. From the analysis, all the four null hypothseses were
rejected. With r = -0.6124 and p = 0.0256 < 0.05, H1 was
rejected and it was concluded that there was a significant
relationship between project cost and market performance of
housing projects. With r = -0.1979 and p = 0.0134 < 0.05, H3
was rejected and it was concluded that there was a significant
relationship between project environment and market
performance of housing projects. Finally, with r = -0.4872 and p
= 0.016 <0.05, H4 was rejected and it was concluded that there
was a significant relationship between project competitive
advantage and market performance of housing projects. It was
recommended that project developers should be aware of the
economic and political environment within which the project
exists as these two factors greatly influence the number of houses
sold and the project lead time. The project developer should also
invest in the level of technology used in a project as it would
influence the house prices.
Index Terms- Competetive Advantage, Project Environment,
Market Perfomance
I. INTRODUCTION
1.1 Background of the Study
rojects are authorized as a result of market demand and as
such, their market performance is key to the success of the
project (PMBOK, 2008). Market performance is thus a common
and contemporary goal of many development projects in various
countries (Chang & Lee, 2008). Numerous housing projects are
developed worldwide as housing projects have gone beyond
simply providing shelter and protection and moved to the
consideration of comfort (Schoenauer, 2000). The development
of housing sector necessitates knowledge on urban factors that
could have an effect on the market performance of housing
schemes.
Since the economic crisis began in the United States and
Europe in 2008, the global economy has undergone a massive
change. According to Acharya et al. (2009) the United States real
estate market is facing its worst hit in two decades due to the
slowdown of housing sales. The most affected by this decline
were real estate investors and home developers who were
struggling to break-even financially on their investments. For
these project investors, it is of importance to evaluate the current
status of the market and predict its performance over the short-
term in order to make appropriate financial decisions
(Schoenauer, 2000).
Additionally, Acharya et al. (2009) found that after the
depression there was a decrease in the number of units sold as the
projects costs had gone up. As a result the market performance of
housing projects slowed down as lesser units were sold and they
were sold at a longer duration. Investors in the United States
were cautious in investing in the industry that was seemingly
collapsing as the housing projects were doing poorly in the
market which was not good for business. The decrease of prices
of housing units raised come concern as it was having a direct
effect on the market of housing projects. The study by Potepan
(1996) also concluded that house prices increase with project
costs which then lead to a sales drop of houses.
Late completion of housing projects will have a significant
effect on how the project will perform in the market because it
delays what was already planned. The time overrun will affect
the project since the developers or investors operate on a time-
line where they are supposed to deliver the completed projects to
certain stakeholders without delay. Okuwoga (1998) further adds
that any delay caused is likely to lead to the stakeholders losing
interest or the prices either moving up or down than it was earlier
estimated hence effecting how the housing projects will perform
at the time that they will be in the market.
For a project to perform well, it exhibits some aspects of
competitive advantage in comparison to other similar projects.
Porter (2008) concluded that fundamental basis of above-average P
International Journal of Scientific and Research Publications, Volume 5, Issue 4, April 2015 15
ISSN 2250-3153
www.ijsrp.org
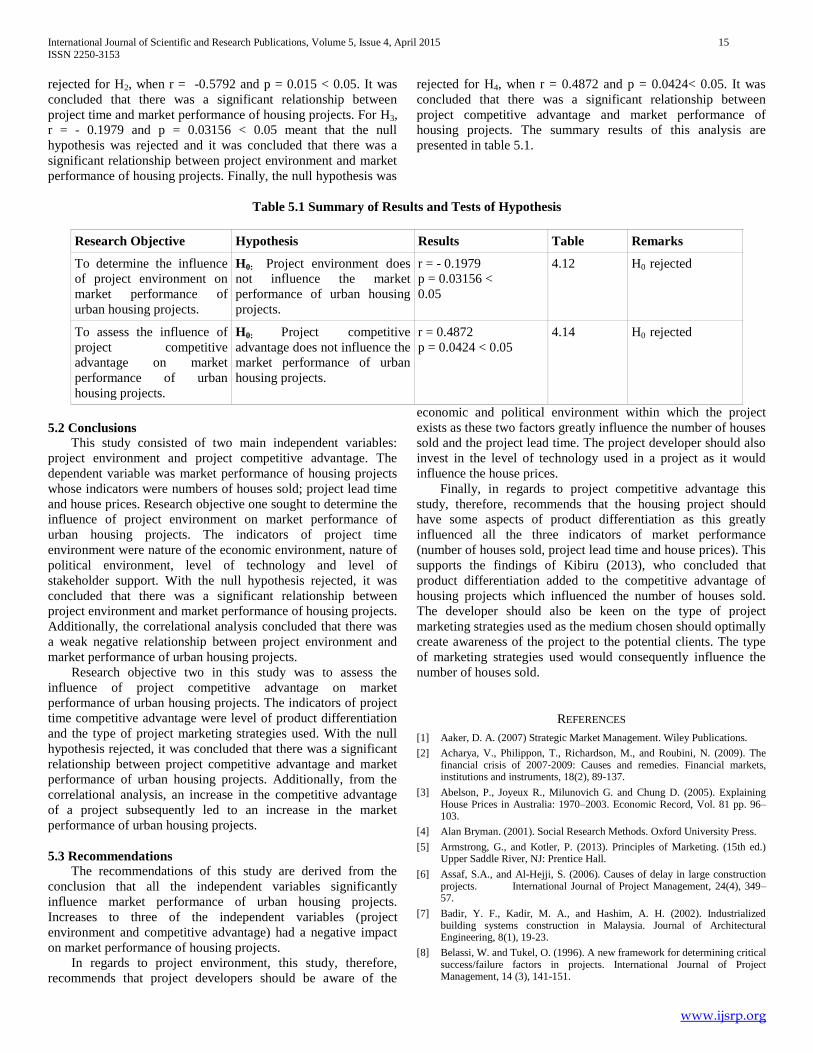
rejected for H2, when r = -0.5792 and p = 0.015 < 0.05. It was
concluded that there was a significant relationship between
project time and market performance of housing projects. For H3,
r = - 0.1979 and p = 0.03156 < 0.05 meant that the null
hypothesis was rejected and it was concluded that there was a
significant relationship between project environment and market
performance of housing projects. Finally, the null hypothesis was
rejected for H4, when r = 0.4872 and p = 0.0424< 0.05. It was
concluded that there was a significant relationship between
project competitive advantage and market performance of
housing projects. The summary results of this analysis are
presented in table 5.1.
Table 5.1 Summary of Results and Tests of Hypothesis
Research Objective Hypothesis Results Table Remarks
To determine the influence
of project environment on
market performance of
urban housing projects.
H0: Project environment does
not influence the market
performance of urban housing
projects.
r = - 0.1979
p = 0.03156 <
0.05
4.12 H0 rejected
To assess the influence of
project competitive
advantage on market
performance of urban
housing projects.
H0: Project competitive
advantage does not influence the
market performance of urban
housing projects.
r = 0.4872
p = 0.0424 < 0.05
4.14 H0 rejected
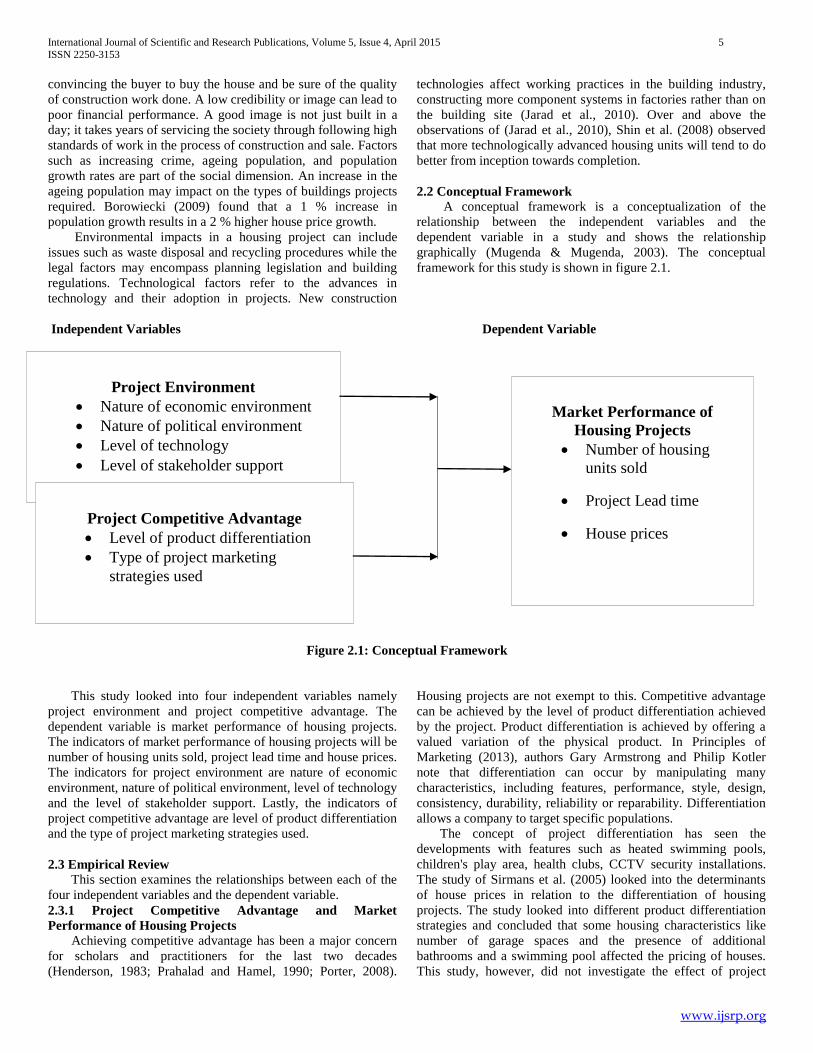
5.2 Conclusions
This study consisted of two main independent variables:
project environment and project competitive advantage. The
dependent variable was market performance of housing projects
whose indicators were numbers of houses sold; project lead time
and house prices. Research objective one sought to determine the
influence of project environment on market performance of
urban housing projects. The indicators of project time
environment were nature of the economic environment, nature of
political environment, level of technology and level of
stakeholder support. With the null hypothesis rejected, it was
concluded that there was a significant relationship between
project environment and market performance of housing projects.
Additionally, the correlational analysis concluded that there was
a weak negative relationship between project environment and
market performance of urban housing projects.
Research objective two in this study was to assess the
influence of project competitive advantage on market
performance of urban housing projects. The indicators of project
time competitive advantage were level of product differentiation
and the type of project marketing strategies used. With the null
hypothesis rejected, it was concluded that there was a significant
relationship between project competitive advantage and market
performance of urban housing projects. Additionally, from the
correlational analysis, an increase in the competitive advantage
of a project subsequently led to an increase in the market
performance of urban housing projects.
5.3 Recommendations
The recommendations of this study are derived from the
conclusion that all the independent variables significantly
influence market performance of urban housing projects.
Increases to three of the independent variables (project
environment and competitive advantage) had a negative impact
on market performance of housing projects.
In regards to project environment, this study, therefore,
recommends that project developers should be aware of the
economic and political environment within which the project
exists as these two factors greatly influence the number of houses
sold and the project lead time. The project developer should also
invest in the level of technology used in a project as it would
influence the house prices.
Finally, in regards to project competitive advantage this
study, therefore, recommends that the housing project should
have some aspects of product differentiation as this greatly
influenced all the three indicators of market performance
(number of houses sold, project lead time and house prices). This
supports the findings of Kibiru (2013), who concluded that
product differentiation added to the competitive advantage of
housing projects which influenced the number of houses sold.
The developer should also be keen on the type of project
marketing strategies used as the medium chosen should optimally
create awareness of the project to the potential clients. The type
of marketing strategies used would consequently influence the
number of houses sold.
REFERENCES
[1] Aaker, D. A. (2007) Strategic Market Management. Wiley Publications.
[2] Acharya, V., Philippon, T., Richardson, M., and Roubini, N. (2009). The financial crisis of 2007‐2009: Causes and remedies. Financial markets, institutions and instruments, 18(2), 89-137.
[3] Abelson, P., Joyeux R., Milunovich G. and Chung D. (2005). Explaining House Prices in Australia: 1970–2003. Economic Record, Vol. 81 pp. 96–103.
[4] Alan Bryman. (2001). Social Research Methods. Oxford University Press.
[5] Armstrong, G., and Kotler, P. (2013). Principles of Marketing. (15th ed.) Upper Saddle River, NJ: Prentice Hall.
[6] Assaf, S.A., and Al-Hejji, S. (2006). Causes of delay in large construction projects. International Journal of Project Management, 24(4), 349–57.
[7] Badir, Y. F., Kadir, M. A., and Hashim, A. H. (2002). Industrialized building systems construction in Malaysia. Journal of Architectural Engineering, 8(1), 19-23.
[8] Belassi, W. and Tukel, O. (1996). A new framework for determining critical success/failure factors in projects. International Journal of Project Management, 14 (3), 141-151.
International Journal of Scientific and Research Publications, Volume 5, Issue 4, April 2015 16
ISSN 2250-3153
www.ijsrp.org
[9] Bitner, M. J. (1990) Evaluating Service Encounters: The Effects of Physical Surroundings and Employee Responses. The Journal of Marketing, 54 (2) p. 69-82.
[10] Blackley, D. M. and J. R. Follain. (1991). “An Econometric Model of the Metropolitan
[11] Booms, B. and Bitner, J. (1981) Marketing strategies and organizational structures for service firms. In Donnelly, J. and George, W. Marketing of services. American Marketing Association.
[12] Borowiecki K. J. (2009). The Determinants of House Prices and Construction: An Empirical Investigation of the Swiss Housing Economy. International Real Estate Review Journal Vol.12 No.3: pp. 193 – 220
[13] Carifio, J. and Rocco J. P. (2007). Ten Common Misunderstandings, Misconceptions,Persistent Myths and Urban Legends about Likert Scales and Likert Response Formats and their Antidotes. Journal of Social Sciences 3 (3): 106-116
[14] Centre for Affordable Housing in Africa (2011), Year-book 2011: Housing Finance in Africa – a Review of Some of housing markets of African’s Housing Finance Markets, Finmark Trust.
[15] Chaffey, D. (2006). Internet Marketing: Strategy, Implementation and Practice: 3rd Edition. Prentice Hall.
[16] Chang, E.H.W. and Lee, G.K.L., (2008). A Sustainability Evaluation of Government-led Urban Renewal Projects. Journal of Facilities, Emerald Group Publishing Limited, Vol. 26 No.13.
[17] Chi-Cheng Wu, Ying-Ju Chen, Chih-Jen Wang, (2010). Strategic Roles of Advertising in Distribution Channels. 2010 Informs Marketing Science Conference, Cologne, Germany
[18] Cooper, D. and Schindler, P (2003): Business Research Methods, New York: McGraw-Hill
[19] Covington, K., Freeman, L., and Stoll, M. (2011). The suburbanization of housing choice voucher recipients. Washington: Brookings Institution.
[20] Dikmen, I., Birgonul, M.T. and Kiziltas, S. (2005). Strategic use of the quality function deployment (QFD) in the construction industry. Building and Environment, Vol. 40, pp.245−255.
[21] Egert, B. and Mihaljek, D. (2007). Determinants of House Prices in Central and Eastern Europe. CESIFO Working Paper Series, 2152 (6), 1-31
[22] Goldratt, E.M. (1992). The Goal. 2nd Revised Ed. Great Barrington, MA: The North River Press.
[23] Gorard, S. (2004). Quantitative Methods in Social Science, London: Continuum Books.
[24] Global Property Guide (2013). Egypt: House price rises continue in Q2 2013, but future is now uncertain. Retrieved 10th November 2014, from http://www.globalpropertyguide.com/ Middle-East/Egypt/Price-History
[25] Grundy, T. (2006). Rethinking and reinventing Michael Porter's five forces model. Chichester: Wiley Publications, Strategic Change Journal 15 (5) pp.213-229
[26] Hass Consult (2013). Property Market Hesitates in Election Run up. 2013 Quarter one Report.
[27] Henderson, J. V. and Ioannides, Y. 1983: A model of housing tenure choice. American Economic Review, 73, 98–113.
[28] Hull A, Cooke G and Dolphin, (2011). Building now or Pay Later, Funding New Housing Supply. Institute For Public Policy Research, UK
[29] Jarad, I. A., Yusof, N. A., and Shafiei, M. W. M. (2010). The organizational performance of housing developers in Peninsular Malaysia. International Journal of Housing Markets and Analysis, 3(2), 146-162.
[30] Jobber, D. and Fahy, J.,(2006). Foundations of Marketing, 2nd ed. Berkshire. McGraw-Hill Education.
[31] Kagochi, J. M., and Kiambigi, M. (2012). Remittances' Influence on Housing Construction Demand in Sub‐Saharan Africa: The Case of Kenya. African Development Review, 24(3), 255-265.
[32] Kibiru, C. R. (2013). Determinants of Competitive Advantage in the Real Estate Industry in Kenya: A Case of Thika Greens Golf Estate in Muranga County. Unpublished MA thesis. University of Nairobi, Kenya.
[33] Knight Frank & Citi Private Bank (2012). The Wealth Report 2011. Retrieved on 8th Dec 2014 from http://www.knightfrank.com/resources/pdf-documents/2011thewealthreport.pdf
[34] Koontz, C. (2004). The Marketing Mix: The 4-P Recipe for Customer Satisfaction. Marketing Library Services, Vol. 18, No. 1, pp. 3-6.
[35] Kothari C.R. (2004). Research Methodology Methods and Techniques. (2nd ed). New Delhi: New Age International Publisher.
[36] Mac F. (2014). Mortgage Rates in U.S. Decline to Lowest Since May 2013. Retrieved on 8th December 2014 from: http://www.bloomberg.com/news/2014-12-04/mortgage-rates-in- u- s-decline-to-lowest-since-may-2013.html
[37] Mansfield, N.R., Ugwu, O.O. and Doran, T. (1994). Causes of delay and cost overruns in Nigerian construction projects. International Journal of Project Management, 12(4), 254-260.
[38] Marnat, G.G. (2009). Handbook of Psychological Assessment. Wiley Publications. Hoboken, New Jersey
[39] McCarthy E. J. (1960) Basic Marketing: A Managerial Approach. Irwin.
[40] McElroy, B. and Mills, C. (2007). Managing Stakeholders. In J. Turner, Gower Handbook of Project Management, Aldershot: Gower Publishing.
[41] Memon, H.A, (2010). Factors Affecting Construction Cost in Mara Large Construction Project: Perspective of Project Management Consultant. International Journal of Sustainable Construction Engineering & Technology Vol 1, No 2
[42] Menicou, M., Vassiliou, V., Charalambides, M. and Christou, P. (2012). Quality evaluation of residential houses: The development of a real-time quality assessment tool. International Journal of Quality and Innovation, Vol. 2, No. 1, pp.80–104.
[43] Motwani, J. and Vogelsang, K. (1996). The theory of constraints in practice. Managing service quality 6(6), 43-47
[44] Mugenda, M. and Mugenda, G. (2003): Research Methods, Quantitative and Qualitative Approaches. Nairobi: African Centre for Technology Studies.
[45] Mwangi, I. K. (2002): The nature of Rental Housing in Kenya, Environment and Urbanization Journal of Real Estate Literature (9) pp. 91-116.
[46] Nagle, T. and Holden, R. (2001) The Strategy and Tactics of Pricing: A Guide to Profitable Decision Making: 3rd Edition. Prentice Hall.
[47] Nahinga D. (2014). Taxes and real estate in Kenya. Retrieved on 8th December 2014 from http://ujenzibora.com/2012/02/02/taxes-and-real-estate-in-kenya-part-1/
[48] Nellis, J. G., and Longbottom, J. A. (1981). An empirical analysis of the determination of housing prices in the United Kingdom. Urban Studies, (18), 9-21.
[49] Nistorescu, T. and Ploscaru, C. (2010). Impact of economic and financial crisis in the construction industry. Management and Marketing Journal, Vol. 2, No. 3, pp.25−36.
[50] Noppen, A. V. (2012). The ABCs of affordable housing in Kenya. Acumen Organization Report. Retrieved on 1 December 2014 from http://acumen.org/content/uploads/2013/03/ABCs-of-Affordable-Housing-in-Kenya.pdf
[51] Norris, M. and Shiels, P. (2004): Regular National Report on Housing Developments in European countries. The Housing Unit. Ireland
[52] Nunnally, J. C. (1970). Introduction to psychological measurement. New York: McGraw-Hill.
[53] Okuwoga, A. A. (1998). Cost-time performance of public sector housing projects in Nigeria. Habitat Int., 22(4): 389-395.
[54] Olander, S., and Landin, A. (2005). Evaluation of stakeholder influence in the implementation of construction projects. International journal of project management, 23(4), 321-328.
[55] Olusegun, E. A., (2012). Stakeholders' perception of the causes and effects of construction delays on project delivery. KICEM Journal of Construction Engineering and Project Management 2 (4), 25-31.
[56] Porter, M. E. (2008). On Competition. Updated and Expanded Ed. Boston: Harvard Business School Publishing.
[57] Porter, S., Carter, D.E. (2000). Common terms and concepts in research. In Cormack, D. (Ed.) The Research Process in Nursing (4th Ed.). Oxford, Blackwell Science (pp. 17-28)
[58] Potepan, M. J. (1996). Explaining intermetropolitan variation in housing prices, rents and land prices. Real Estate Economics Journal, 24.
[59] Prahalad, C. K., and Hamel, G. (1990): The core competence of the corporation. Harvard Business Review, 68(3), 79 91
[60] Project Management Body of Knowledge (2008). Project Management Institute. Newtown Square, Pennsylvania USA
International Journal of Scientific and Research Publications, Volume 5, Issue 4, April 2015 17
ISSN 2250-3153
www.ijsrp.org
[61] Rafiq, M., and Ahmed, P. K. (1995). Using the 7Ps as a generic marketing mix: an exploratory survey of UK and European marketing academics. Marketing Intelligence and Planning, 13(9), 4-15.
[62] Richardson, C. (2007). Fundamentals. Business Review Weekly, 29 (32).
[63] Robinson, S. (2002). Research methodology. Washington D.C. National Academies Press
[64] Saunders, M., Lewis, P. and Thornhill, A. (2009). Research Methods for Business Students. 5th Ed. Harlow: Pearson Education Limited
[65] Schoenauer, N (2000): 6,000 years of housing. New York/London: W.W. Norton and Company, Inc.
[66] Sekaran, U. (2003). Research Methods for Business – A Skill Building Approach (4th ed). New York: John Wiley & Sons.
[68] Shield, P. and Rangarjan, N. (2013). A Playbook for Research Methods: Integrating Conceptual Frameworks and Project Management. Stillwater, OK: New Forums Press.
[69] Shin, Hung, Ku, Yi-Cheng; and Chien, (2008). Re-examining factors influencing information technology acceptance by individual professionals. PACIS 2008 Proceedings. Paper 169.
[70] Shirley D., Stanley W., Daniel C. (2005). Statistics for Research. 3rd Edition.John Wiley & Sons Publisher, Inc.
[71] Sirmans, G. S., Macpherson, D. A., & Zietz, E. N. (2005). The composition of hedonic pricing models. Journal of Real Estate Literature, 13 (1). 3–46
[72] Situma, E. (2014). Is the City's Property Bubble Finally Bursting? Corporate News. Business Daily. Nairobi. Retrieved on 10 November 2014 from http://www.businessdailyafrica.com/Is-the-city-s-property-bubble-finallybursting/-/1248928/2370762/-/8akmol/-/index.html
[73] Steyn, H. (2001). Project management applications of the theory of constraints beyond critical chain scheduling. International Journal of Project Management 20 (4)
[75] Taylor, J. B. (2009). The financial crisis and the policy responses: An empirical analysis of what went wrong: National Bureau of Economic Research.
[76] TMC and Hass Consult (2013). Expensive mortgages act as clamp on home ownership growth.2013 Quarter Three Report.
[77] Tulasi, C.H.L., Rao, A.R., and Tirupati, A.P (2012). Review on theory of constraints. International Journal of Advances in engineering and technology 6 (2)
[78] UN-HABITAT (2011). Affordable Land and Housing in Africa, Nairobi.
[79] Yannis, A. (2013). African Housing Dynamics: Lessons from the Kenyan Market, African Development Bank,
AUTHORS
First Author – Keritu Angela Mukami, Master of Science in
Project Management student, Jomo Kenyatta University of
Agriculture and Technology
Second Author – Dr. Kinyanjui Nganga, University Supervisor,
Jomo Kenyatta University of Agriculture and Technology