C0rms = standard deviation of concentration fluctuationf = focus length, mmH = step height, mmHe = heliumJ = jet to crossflow momentum flux ratioM = Mach numberP = static pressure, atmPoj = stagnation injection pressure, atmPs = static pressure at the entrance of isolator, atmS = intensity signalx = streamwise directiony = transverse directionz = spanwise direction
I. Introduction
T HE short residence time in practical supersonic combustionsystems, typically of the order of a few milliseconds, imposes
severe requirement for mixing (and vaporization if liquid fuels areused) to ensure efficient heat release and positive net thrustgeneration [1]. The issue of mixing enhancement is therefore ofparticular interest for these devices.
Various types of fuel injection configurations and injector shapeshave been studied for mixing enhancement mostly focused onchanging the flowfield within the combustor [2,3]. Straight or sweptramps that produce near parallel injection have shown reasonable far-field mixing [4–6], although their near-field mixing performancefalls below transverse injection alternatives. The ramp vortex
shedding provides a means to lift the fuel from a low injection angleand promotes penetration into the core airstream. Because physicalinflow ramps require cooling, especially in localized hot spots suchas in recirculation regions, the aerodynamic ramp [7,8], or an angle-injection solution [9,10] from a flush wall have been suggested asnoncooled injection configurations.
A solution that takes advantage of the high penetration oftransverse injectors without the penalty of high pressure losses arethe pylon-based injectors suggested by Vinogradov and Prudnikov[11]. It involves thin, swept pylons with the fuel injected transverselyin the separated region behind them. The results showed that thepenetration increase with these pylons was substantial. Livingstonet al. [12] showed that thin pylons can be used with minimal pressurelosses and applied this type of injection in an inlet, upstream of theisolator to provide additional mixing length. Hence, it is possible toachieve considerable penetration with relatively low dynamicpressure ratios, even less than unity, using this type of pylons. This issignificant in particular when considering that in most cases normalinjection from the wall requires dynamic pressure ratios of the orderof 10–15 [13]. A review of thin pylons applications is given byVinogradov et al. [14].
To increase the residence time and achieve a higher degree ofmixing in the combustion chamber it may be useful to inject part ofthe fuel upstream, in the isolator, in the inlet or further upstream onthe vehicle body. In this case a complex but more flexible system isobtained; the optimization of this system could result in multipleadvantages including 1) mixing enhancement; 2) shorter isolator andcombustor and, consequently, reducedweight and cooling loads; 3) amore flexible fuel control system, due to the possibility of distrib-uting the fuel between the preinjection region and the combustor; and4) the possibility of injecting combinations of liquid and gaseousfuels in different regions [1,15].
When the fuel is injected upstream, there is a danger of flashbackdue to fuel remaining in the boundary layer potentially causingupstream flame propagation. With the pylons described herepenetration increases and the residual fuel in the boundary layer isavoided. Owens et al. [15], Shikhman et al. [16], Vinogradov et al.[17], andGuoskov et al. [18] showed in combustion experiments thatfuel injection upstream of the combustion chamber was possiblewithout flashback. The same is true for liquid-fuel injection, asshown by the experiments by Livingston et al. [12] where, in an inletoperating at M� 3:5, the pylon helped to remove the fuel entirelyaway from the wall. Most significantly, from the mixing enhance-ment point of view, the jet experienced an abrupt breakup and wascarried into the inlet core airflow at the pylon height. Hence, thepylon’s presence helped placing the fuel in a favorable mixingregion.
More recently, Gruber et al. [19] confirmed these resultsevaluating pylon-aided fuel injection with three pylon geometries. Inall cases the presence of the pylon resulted in improved fuel
penetration without leading to significant total-pressure-loss charac-teristics. Computationally, Pohlman and Greendyke [20] obtainedsimilar results using five triangular pylons.
In the study described here, light (helium) and heavy (argon) gaseswere injected transversely through a circular injector in the base ofthe pylon located 10 steps (10H) upstream of the flameholdingregion in the isolator. Several dynamic pressure ratios were applied.The isolator entrance Mach number was 1.6. Penetration, spreading,and mixing were measured via acetone planar laser-induced fluo-rescence (PLIF) at three axial locations in the test section, beginningwith the recirculation region. The results were then compared withthe corresponding no-pylon cases. Considerable improvements inmixing have been observed when the pylons were present.
II. Experiment Facility and Technique
A. Facility
The facility used here has been described in detail elsewhere [21].This continuously operatingwind tunnel, shown in Fig. 1, is based ona vitiated heater electronically controlled by a hybrid fuzzy logiccontroller. The nozzles are interchangeable to provide a range ofisolator’s entrance Mach numbers from 1.6 to 3.6. All the experi-ments presented here were conducted at Mach 1.6 and stagnationtemperature 300K.The facility’s stagnation pressurewasmaintainedat 4.8 atm.
Both isolator and the test section have quartz glass windows foroptical access. The isolator has a constant cross-sectional area of25 � 25 mm2. The combustion chamber has a rearward-facing stepwith height H � 12:5 mm acting as a quasi-two-dimensionalflameholder.
B. Pylon Injector and Experimental Conditions
Gaseous helium (He) and argon (Ar) were used as injectants tosimulate a light fuel (hydrogen) and a heavy fuel, e.g., propane, toevidence the effect of molecular weight. The fuel was transverselyinjected into the supersonic crossflow from a 1-mm-diam orificelocated at 10H upstream of the step, in the isolator, as shown inFig. 2. Two different stagnation injection pressures were applied:2.4 and 5.1 atm. Both pylon and nonpylon configurations wereevaluated. The pylon was designed, as shown in Fig. 2, tominimize the aerodynamic drag; hence, the thickness was selectedas 2.3 times the injector diameter with swept leading edge andtriangular cross section based on previous design recommend-ation [11].
C. Acetone PLIF
Figure 3 schematically illustrates the acetone PLIF systemused formeasurements. The fourth harmonic from a Spectra-Physics Nd:YAG laser (GCR-150) was used with a wavelength of 266 nm andoutput energy of 0.75 W at 10 Hz. The beam was expanded into atwo-dimensional sheet of 50mmwide and 0.5mm thick. The opticalpath included three mirrors, two cylindrical convex lenses off� 100 mm and 500 mm, and one cylindrical concave lensf��100 mm, so that the flowfield could be probed with a verticallaser sheet. The fluorescence images were recorded using anintensified digital charge-coupled device camerawith a 1024 � 1280array and a Sigma 50-mm f2:8 camera lens. The camera gate was setto 10 ns to collect the acetone fluorescence’s life time of 4 ns. Thedevices were synchronized by a pulse generator. A bandpass filter(335–610 nm) and a short-pass filter (�500 nm) were placed in frontof the camera to eliminate elastic light reflections. The spatialresolution of the camera was 62.5, 104.2, and 63:3 �m=pixel forplanes 1, 2, and 3, respectively. The injectant density change due toacetone seeding was estimated to be less than 1.4%, assumingsaturated condition at the injector. Therefore, this level of acetoneseeding caused a negligible influence on the injectant density.
The intensity of laser-induced fluorescence from the acetonemolecule depends on the local temperature, pressure, and molefraction, and the coexisting species and the intensity of the signal Swas translated into the acetone molar concentration Cacetone
(mol=m3) [22]. The error was estimated to be 6.5%when assuming alinear relationship by the method described in [23]. Figure 4 showsthe step and the location of three laser sheet planes. The injectionwasat 10H upstream of the step and the laser sheet planes were at 0:5H,2H, and 10H downstream of the step, hence in the recirculationregion close to the step, toward the end of the recirculation region(since the reattachment was at 2:7H) and further downstream in thefar field.
Fig. 1 Supersonic combustion facility.
Fig. 2 Isolator and combustion chamber schematic and pylon geometry. The fuel was transversely injected into the supersonic crossflow from a 1-mm-
diam orifice located at 10H upstream of the step, i.e., in the isolator. The pylon is 7.5mmhigh and 2.3mmwide at the base.Windows allow flow access for
PLIF and visualization in the isolator and the test section.
TAKAHASHI, TU, AND SEGAL 1093
Dow
nloa
ded
by M
ON
ASH
UN
IVE
RSI
TY
on
May
15,
201
3 | h
ttp://
arc.
aiaa
.org
| D
OI:
10.
2514
/1.4
8393
III. Results and Discussions
A. Schlieren Photograph and Pressure Distributions
Figure 5 is a schlieren photograph of the airflow before fuelinjection showing the isolator and the combustion chamber. Thereare weak Mach waves in the isolator due to a slight misalignment ofthe nozzle and isolator interface. In the combustor the airflowexpands around the step and reattaches at 2:7H [24]. The recircul-ation region formed behind the step receives different amounts offuel, depending on the presence of fuel injection in the isolator in thiscase, or downstream as done in other configurations. The resultingcomposition has a critical effect in the flameholding ability [25].
The test sectionwall pressure distributions shown in Fig. 6a for Heand Fig. 6b for Ar indicate that there is a pressure increase of 0.2 atmimmediately behind the pylon and no difference downstream of thestep. It should be noted that the isolator pressure rise is local, behindand aligned axially with the pylon, without effect on the rest of the
flow [15], indicating that the presence of the pylon causes essentiallyno pressure loss.
B. PLIF Results
Instantaneous and ensemble-averaged images described belowprovide details of the flow structure, emphasizing the details ofpenetration and spreading, which are the two main factors influ-encing fuel–air mixing.
1. Instantaneous Structures
Figure 7 presents representative instantaneous PLIF images takenat the selected three planes for four cases, which correspond tox=H� 0:5, 2, and 10 downstream of the step; hence, the first twoplanes are in the recirculation region and the third is furtherdownstream. In each image, the main flow direction is out of thepaper plane, and the axes are normalized by the step height H. Theorigin is placed at the center of the duct in the y direction and atthe step in the axial direction, x. The injection location is in theisolator at z=H� 0, x=H��10, and y=H��1. The LIFintensities are normalized by the maximum intensity in each plane.The highlighted white solid line shows the step. Because ofsymmetry, only half of the duct is shown in Fig. 7.
The instantaneous images show, to a certain extent, the turbulentstructures, which include both the vortical structures and the flowturbulence effects. In the near field a compressibility effect is noteddue to molecular weight differences creating a difference in thestructure size. But in the far field the compressibility effect seems toweaken, because almost no difference in structure sizes is noted.
Without the pylon the fuel penetrates rapidly in the recirculationregion through the shear layer, but remains confined to a smallregion. With the pylon the instantaneous structure is larger and itstretches in vertical direction while in nonpylon cases the plumeoccupies a smaller region, indicating less penetration and spreading.The structure due to the shear [26,27] effect is seen at the periphery ofthe jet plume. In some cases part of the plume is removed from therest, as shown in plane 3 in Fig. 7c. Moreover, the jet plume oftenreaches the opposite wall for pylon-assisted cases. For the higher-molecular-weight injectant, i.e., argon, most of the injectant remainsclose to the injection wall, which is an effect of lower diffusion.
The instantaneous image results reveal the complex nature of theinjectant/air interaction, which is principally responsible for mixing;they also indicate that highly intermittent and dynamic features stillexist in the far field. The main effect of the pylon is to create the low-pressure region behind it, leading to increased penetration; however,as a secondary effect, weak vortical structures induced by the pylonhelp enhance spreading and mixing.
2. Ensemble-Averaged Structures
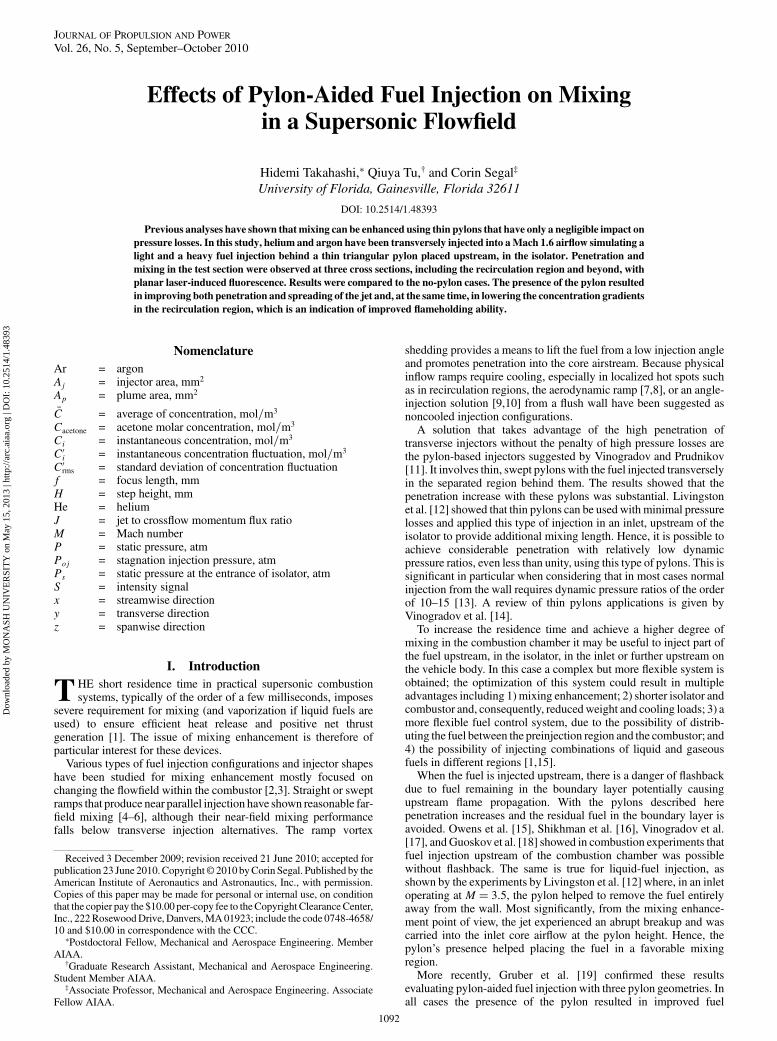
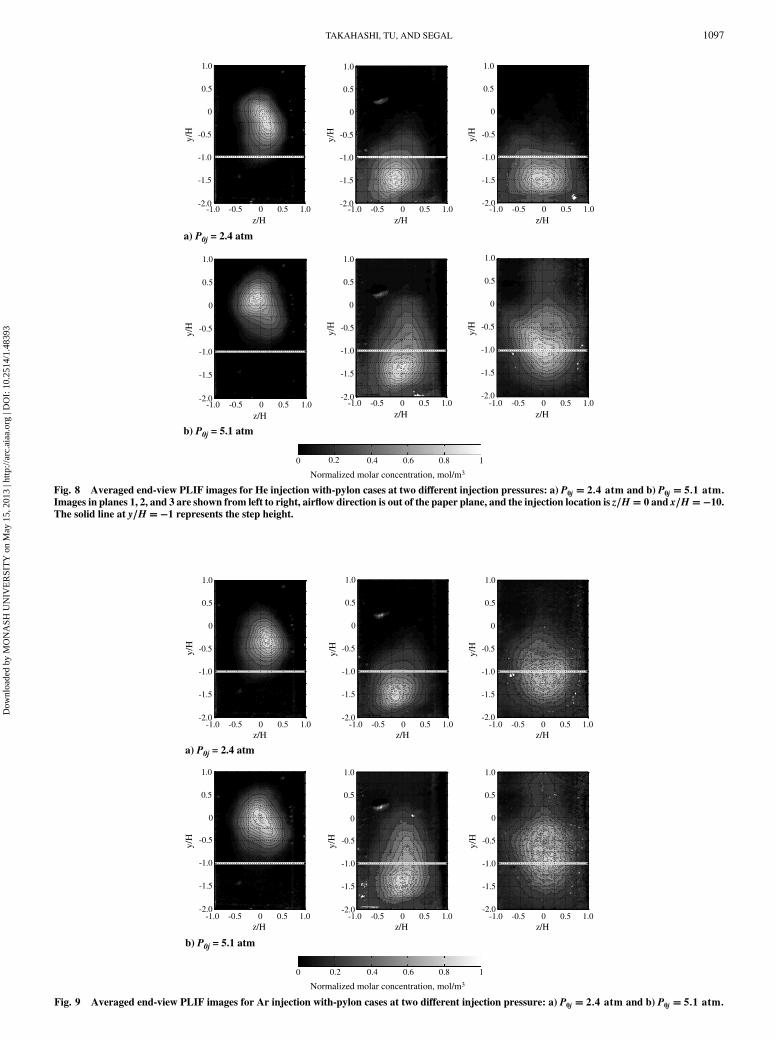
Figures 8–11 show ensemble-averaged PLIF images for eachinjectant and injection pressure, with plane 1, plane 2, and plane 3shown from left to right. For each image 300 single-shot frames wereused for averaging planes 1 and 2 and 600 frames were used forplane 3, since the latter showed weak intensities. The effects ofinjection pressure and molecular weight are described below.
a. Effect of Injection Pressure. Figure 8 shows the Heinjection with the pylon. At lower injection pressure, shown inFig. 8a, for each plane the core of the plume is closer to the injectionwall and the penetration is shorter than those in Fig. 8b, in which thepressure was higher. In planes 2 to 3 the spreading dominates, with
Fig. 3 Schematic of acetone PLIF measurement system. The laser
beam was expanded into a two-dimensional sheet of 50 mm wide and
0.5 mm thick at three heights along the vertically oriented test section.
Fig. 4 Location of the selected flow planes. The injection was at 10H
upstreamof the step and the laser sheet planeswere at 0:5H, 2H, and 10H
downstream of the step. The x, y, and z axes correspond to the
streamwise, transverse, and spanwise directions. The three planesinvestigated are in the recirculation region close the step, toward the end
of the recirculation region (since the reattachment was at 2:7Hdownstream from the step) and further downstream in the far field.
Fig. 5 Schlieren photograph of the airflow without injection or pylon
[24]. The black lines indicate the positions of the laser sheet for
subsequent PLIF.
1094 TAKAHASHI, TU, AND SEGAL
Dow
nloa
ded
by M
ON
ASH
UN
IVE
RSI
TY
on
May
15,
201
3 | h
ttp://
arc.
aiaa
.org
| D
OI:
10.
2514
/1.4
8393
little increase of penetration as the injection pressure is increased. Inplane 1 the core of the jet approaches the chamber centerline, aty=H� 0. In plane 2 the core of the triangular-shaped plume with awider spread is pushed toward the wall by the airflow expansionaround the step and increases again after the reattachment point. Asshown in plane 3, a characteristic shape with top central partpenetrates far into the core flow with an even wider spread, almostreaching the sidewalls. The plume development for Ar injectedbehind the pylon, shown in Fig. 9, shows a similar trend asHe: higherinjection pressure enhances penetration with the plume shapechanged from triangular in plane 2 to the widely spread shape inplane 3.
Without the pylon, at higher injection pressure He injection,Fig. 10 shows an elongated shape in plane 1 and becomes almostround further downstream. It is lifted from the injection wall withsome increase of penetration to the step height and spreading, whileat lower injection pressure a triangular-shaped plume appears inplane 1 and at the end of recirculation region. Further downstream itremains close to the injection wall, but it spreads more, reaching thesidewalls. Figure 11 shows the plume images of Ar without pylon,with a similar development as He; at higher injection pressure thespreading is narrower, but penetration is higher.
Penetration scales with the fuel-to-air momentum flux ratio [28] J;hence, higher injection pressure increases the penetration regardlessof the presence of pylon. Although previous studies have shown thatthe presence of pylons reduces spreading [19], both penetration andspreading are increased here, and furthermore, penetration is in-creased at higher injection pressure. The additional effect onspreading is likely due to the presence of 3-D flow structurefollowing expansion around the 2-D step as a result of the vorticalmotion induced by the presence of sidewalls.
b. Effect of Molecular Weight. When the pylon is present thejet plume axial development is similar for He and Ar with severalnotable differences. In plane 1 close to the stepAr penetrates less thanHewhereas in the far field, at plane 3, the penetration is much higherat lower injection pressure, as shown in Figs. 8 and 9. Without thepylon there is no penetration difference between the two injectants,as shown in Figs. 10 and 11, butAr has awider spreading and a largerplume area thanHe in every corresponding case. Thus, it appears thatthemolecular weight has only a small effect on the plume penetrationin agreement with the observations of Portz and Segal [29] andBurger et al. [30], although the heavier injectant can enhancespreading even without the aid of the pylon.
3. Geometrical Features of Jet Plume
Figures 12–14 show certain salient features of the ensemble-averaged images including the plume area, penetration, and lateralspreading. The 10% contour of the maximum intensity was taken asthe jet plume boundary. The plume penetration y was determinedfrom the peak location of this contour, and the lateral spread�zwasdetermined from thewidest extend of it; both were normalized by thestep height. To avoid any noise in the data, the pixels inside the 30%
contour were counted as the plume area normalized by the injectorarea.
In each case the plume area gradually became larger except for Hefrom plane 2 to plane 3 at 2.4 atm with pylon and at 5.1 atm withoutpylon, as shown in Fig. 12. In the far field, at 20H, helium spreadingis considerable after the high penetration induced by the pylonpresence, considerably more than Ar given the lower molecularweight. Much of the material has reached the walls that confine thefurther spreading of the injectant. Since the PLIF method has lessaccuracy close to the walls and the data in Fig. 12 are an average of alarge number of images, the results indicate a trend different from thatin the other curves; however, mixing is high in this case.
At higher injection pressure the plume area increased regardlessof the pylon’s presence, but with the pylon the increase was larger.The increase is most significant at higher injection pressure withpylon from plane 1 to plane 2. Figure 13 shows the plume pen-etration. For Ar the penetration was higher at higher injectionpressure and the presence of pylon enhanced it. For He, except in thecase with pylon, at higher injection pressure the penetration showedthe same trend as Ar, while in other cases the penetration decreasedfrom plane 2 to plane 3. This is due to the presence of the sidewalls atplane 3 that limit the plume spreading in the far field. For bothinjectants, with the pylon present the spreading was narrower thanwithout the pylon. Helium penetration is very high when assisted bythe pylon at both pressures. Further downstream, this very highplume penetration of He cannot be sustained when the injectionpressure is low.
4. Statistical Analysis
Since the fluorescence signal represents the jet molar con-centration, the spatial correlation of the PLIF signal fluctuationsexpresses the spatial extent of the turbulent scalar field. The single-time two-point spatial correlation analysis is useful to clarify thebehavior of the turbulent structure [27,31]. The correlationcoefficient r��y;�z� based on the concentration fluctuation iscomputed from Eq. (1):
�C�y; z� � 1
N
XNi�1
Ci�y; z�; C0i�y; z� � Ci�y; z� � �C�y; z�;
C0rms�y; z� �
������������������������������1
N
XNi�1
C02i �y; z�
vuut ; i� 1; 2; � � � ; N
r��y;�z� �1N
PNi�1�C0i�y; z� � C0i�y�y; z�z�
C0rms�y; z� � C0rms�y�y; z�z�
(1)
where point �y; z� is the reference used for features correlation [32],Ci�y; z� is the instantaneous concentration, C0i�y; z� is its
fluctuation, �C�y; z� is the average of concentration, C0rms�y; z� isthe standard deviation of concentration fluctuation, and �y and �zare the spatial differences in y and z directions, respectively. In the
Fig. 6 Normalized pressure distribution at two different stagnation injection pressures. There is a slight pressure increase of 0.2 atm behind the pylonand no difference downstream of the step in the combustion chamber. This indicates that the presence of pylon causes no significant pressure loss.
TAKAHASHI, TU, AND SEGAL 1095
Dow
nloa
ded
by M
ON
ASH
UN
IVE
RSI
TY
on
May
15,
201
3 | h
ttp://
arc.
aiaa
.org
| D
OI:
10.
2514
/1.4
8393
present study, the significantly correlated region with a sample sizeN of 300 was chosen, where the absolute value of the correlationcoefficient jrj � 0:16, as determined by statistical testing. In Fig. 15each correlation map is depicted with the contour levels varying inincrements of 0.1 in 0:2 � jrj � 1:0. The line of r� 0:16, whichindicates the boundary of the highly significantly correlated regions,
is highlighted with a black solid line. The contours of 0.1 and 0.5 inaveraged plume intensities are plotted as well, for reference. Thereference points for calculating the correlation maps are the bottomedge of the 0.5 contour, since the concentration fluctuation isthe most intensive on the 50% contour [31]. For correlation anal-ysis of this end-view image, 300 single-shot images were used.
z/H-1.0 -0.5 0 0.5 1.0
z/H-1.0 -0.5 0 0.5 1.0
z/H-1.0 -0.5 0 0.5 1.0
z/H
y/H
-1.0 -0.5 0 0.5 1.0
1.0
0.5
0
-0.5
-1.0
-1.5
-2.0
y/H
1.0
0.5
0
-0.5
-1.0
-1.5
-2.0
y/H
1.0
0.5
0
-0.5
-1.0
-1.5
-2.0
z/H-1.0 -0.5 0 0.5 1.0
z/H-1.0 -0.5 0 0.5 1.0
c) Ar injection with pylon
z/H
y/H
-1.0 -0.5 0 0.5 1.0
1.0
0.5
0
-0.5
-1.0
-1.5
-2.0
y/H
1.0
0.5
0
-0.5
-1.0
-1.5
-2.0
y/H
1.0
0.5
0
-0.5
-1.0
-1.5
-2.0
z/H-1.0 -0.5 0 0.5 1.0
z/H-1.0 -0.5 0 0.5 1.0
d) Ar injection without pylon
z/H
y/H
-1.0 -0.5 0 0.5 1.0
1.0
0.5
0
-0.5
-1.0
-1.5
-2.0
y/H
1.0
0.5
0
-0.5
-1.0
-1.5
-2.0
y/H
1.0
0.5
0
-0.5
-1.0
-1.5
-2.0
y/H
1.0
0.5
0
-0.5
-1.0
-1.5
-2.0
y/H
1.0
0.5
0
-0.5
-1.0
-1.5
-2.0
y/H
1.0
0.5
0
-0.5
-1.0
-1.5
-2.0
z/H-1.0 -0.5 0 0.5 1.0
z/H-1.0 -0.5 0 0.5 1.0
a) He injection with pylon
b) He injection without pylon
Normalized molar concentration, mol/m3
0 0.2 0.4 0.6 0.8 1
Fig. 7 Instantaneous end-view PLIF images in three measurement planes for four different injection cases: plane 1 (left), plane 2 (center), and plane 3(right). Airflow direction is out of the paper plane, and the injection location is z=H � 0 and x=H ��10. The white solid line at y=H ��1 represents thestep height.
1096 TAKAHASHI, TU, AND SEGAL
Dow
nloa
ded
by M
ON
ASH
UN
IVE
RSI
TY
on
May
15,
201
3 | h
ttp://
arc.
aiaa
.org
| D
OI:
10.
2514
/1.4
8393
z/H
y/H
-1.0 -0.5 0 0.5 1.0
1.0
0.5
0
-0.5
-1.0
-1.5
-2.0
z/H
y/H
-1.0 -0.5 0 0.5 1.0
1.0
0.5
0
-0.5
-1.0
-1.5
-2.0
z/H
y/H
-1.0 -0.5 0 0.5 1.0
1.0
0.5
0
-0.5
-1.0
-1.5
-2.0
z/H
y/H
-1.0 -0.5 0 0.5 1.0
1.0
0.5
0
-0.5
-1.0
-1.5
-2.0
z/H
y/H
-1.0 -0.5 0 0.5 1.0
1.0
0.5
0
-0.5
-1.0
-1.5
-2.0
z/H
y/H
-1.0 -0.5 0 0.5 1.0
1.0
0.5
0
-0.5
-1.0
-1.5
-2.0
Normalized molar concentration, mol/m3
0 0.2 0.4 0.6 0.8 1
b) P0j = 5.1 atm
a) P0j = 2.4 atm
Fig. 8 Averaged end-view PLIF images for He injection with-pylon cases at two different injection pressures: a) P0j � 2:4 atm and b) P0j � 5:1 atm.
Images in planes 1, 2, and 3 are shown from left to right, airflow direction is out of the paper plane, and the injection location is z=H� 0 and x=H��10.The solid line at y=H��1 represents the step height.
z/H
y/H
-1.0 -0.5 0 0.5 1.0
1.0
0.5
0
-0.5
-1.0
-1.5
-2.0
z/H
y/H
-1.0 -0.5 0 0.5 1.0
1.0
0.5
0
-0.5
-1.0
-1.5
-2.0
z/H
y/H
-1.0 -0.5 0 0.5 1.0
1.0
0.5
0
-0.5
-1.0
-1.5
-2.0
z/H
y/H
-1.0 -0.5 0 0.5 1.0
1.0
0.5
0
-0.5
-1.0
-1.5
-2.0
z/H
y/H
-1.0 -0.5 0 0.5 1.0
1.0
0.5
0
-0.5
-1.0
-1.5
-2.0
z/H
y/H
-1.0 -0.5 0 0.5 1.0
1.0
0.5
0
-0.5
-1.0
-1.5
-2.0
Normalized molar concentration, mol/m3
0 0.2 0.4 0.6 0.8 1
a) P0j = 2.4 atm
b) P0j = 5.1 atm
Fig. 9 Averaged end-view PLIF images for Ar injection with-pylon cases at two different injection pressure: a) P0j � 2:4 atm and b) P0j � 5:1 atm.
TAKAHASHI, TU, AND SEGAL 1097
Dow
nloa
ded
by M
ON
ASH
UN
IVE
RSI
TY
on
May
15,
201
3 | h
ttp://
arc.
aiaa
.org
| D
OI:
10.
2514
/1.4
8393
z/H
y/H
-1.0 -0.5 0 0.5 1.0z/H
-1.0 -0.5 0 0.5 1.0z/H
-1.0 -0.5 0 0.5 1.0
z/H-1.0 -0.5 0 0.5 1.0
z/H-1.0 -0.5 0 0.5 1.0
z/H-1.0 -0.5 0 0.5 1.0
1.0
0.5
0
-0.5
-1.0
-1.5
-2.0
y/H
1.0
0.5
0
-0.5
-1.0
-1.5
-2.0
y/H
1.0
0.5
0
-0.5
-1.0
-1.5
-2.0
y/H
1.0
0.5
0
-0.5
-1.0
-1.5
-2.0
y/H
1.0
0.5
0
-0.5
-1.0
-1.5
-2.0
y/H
1.0
0.5
0
-0.5
-1.0
-1.5
-2.0
a) P0j = 2.4 atm
b) P0j = 5.1 atm
Normalized molar concentration, mol/m3
0 0.2 0.4 0.6 0.8 1
Fig. 10 Averaged end-view PLIF images for He injection without-pylon cases at two different injection pressure: a) P0j � 2:4 atm andb) P0j � 5:1 atm.
The computed domain was 340 pixels high by 510 pixels wide forplane 1 and 432 pixels high by 648 pixels wide for plane 3,corresponding to �2:0 � y=H � 1:0 and �1:0 � z=H � 1:0. Thespacing used for this correlation covered five pixels, correspondingto 0:029H or 0:0046D for plane 1 and 0:023H or 0:0036D forplane 3. This spacing is small enough to resolve the turbulentstructure [31].
Figure 15 shows correlation maps for He-injection cases inplane 1. Clearly, the highly correlated region is seen around thereference point. The high correlation region is found around thereference point. For all cases, the negative correlation region, shownin Fig. 15 with gray shades, appears symmetrically to the correlatedregion, shown with white shades, around the plume center. Thisindicates that the fluid in the negative region decreases while the fluidaround the reference point increases in the given cross section. Since
the averaged plume shape suggests the entrainment of the fluid intothe step base, this behavior indicates that the fluid in the upper part ofthe plume displayed as the negative correlation enters into the stepbase region.
In general, in the pylon cases the highly correlated region iscompact and well-organized regardless of the injection pressure.Without the pylon the correlated region is not well organized andexpands to the lower region of the duct. These results indicate thatthere exists a relatively large-scale turbulent structure in this planeand an expectation of enhanced mixing in the step base.
At plane 3 Fig. 16 shows a different trend. In every case the highlycorrelated region is small. The negatively correlated region thatimplies the entrainment of fluid in a downward direction is no longerseen, similar to the results in [31]. The region where the large-scalestructure is absent has a small correlation region. Therefore, in the
Fig. 12 Plumearea comparison for eachof four cases along the streamwise direction for a)He andb)Ar.To obtain the area, thepixelswithin the contour
of 30% value of the maximum intensity in each ensemble-averaged image were counted.
Fig. 13 Plume penetration comparison for each case along the streamwise direction for a) He and b) Ar). The plume penetration was determined by the
peak location of the 10% contour of the jet plume.
Fig. 14 Plume spreading comparison for each four cases along the streamwise direction for a) He and b) Ar. The lateral spread�z=H was determined
from the widest extend of the 10% contour of the jet plume.
TAKAHASHI, TU, AND SEGAL 1099
Dow
nloa
ded
by M
ON
ASH
UN
IVE
RSI
TY
on
May
15,
201
3 | h
ttp://
arc.
aiaa
.org
| D
OI:
10.
2514
/1.4
8393
lower-pressure case both with and without the pylon, no large-scalestructure seems to exist. In the higher-pressure cases a correlationregion appears, but it is considerably smaller than the one met atplane 1.
These observations indicate that at plane 1 the flow is dominatedby relatively large-scale turbulent stirring and at plane 3 shear-induced structures are prevalent.
IV. Conclusions
Upstream pylon-aided injection into a Mach 1.6 airstream hasbeen studied using PLIF with data recorded at three planes in achamber behind a two-dimensional step. Injection pressures and
injectants molecular weight were examined with emphasis on pene-tration, spreading, and shape of the jet plume. The results showed thefollowing:
1) The presence of thin pylon causes essentially no pressure loss.2)With the pylon all of the jet is lifted from the injection wall with
both penetration and spreading increasing. Penetration is increasedmore at higher injection pressurewhile spreading dominates at lowerinjection pressure.
3) Without the pylon the injectant penetration relies only on theinjection pressure, but the injectants remain close to the wall, withconsiderably increased spreading at the lower injection pressure.
4) The injectant molecular weight has little effect on the jetpenetration, but the heavier injectant shows increased spreadingwhen the pylon is absent.
5) In the near field the presence of the pylon leads to increasedpenetration and reduced spreading; however, in the far fieldspreading is improved by other factors: notably, by the large vorticalstructures induced by the presence of sidewalls.
6) Statistical analysis conducted for He injection indicated anenhanced dynamic behavior of the flow structure in the near field,represented here by the plane closer to the step.
7) The negative correlation region that appeared symmetricallyrelative to the plume center indicated that the fluid present in theupper part of the injectant cross section is pushed into the step baseregion.
8)With the pylon the highly correlated region is compact andwell-organized,whereaswithout the pylon the region is notwell organizedand expands into the step base.
9) In the far-field plane the highly correlated region is small forevery case; this indicates that the large-scale turbulent structure is nolonger prevalent in this plane, due to improved mixing in the ductsection upstream of the investigated plane.
Acknowledgments
This work has been supported by the U.S. Office of NavalResearch. The authorswould like to express their gratitude toGabrielRoy, the Program Manager. Hidemi Takahashi’s work has beensupported by a Research Fellowship granted by the Japan Society forthe Promotion of Science for Young Scientists through grant20086092. The authors would also like to acknowledge the contri-butions of Goro Masuya of the Tohoku University in Japan for hissupport in facilitating the cooperation between the TohokuUniversity and the University of Florida.
References
[1] Segal, C., The Scramjet Engine: Processes and Characteristics,Cambridge Univ. Press, Cambridge, England, U.K., 2009.
[2] Seiner, J. M., Dash, S. M., and Kenzakovich, D. C., “Historical Surveyon Enhanced Mixing in Scramjet Engines,” Journal of Propulsion andPower, Vol. 17, No. 6, 2001, pp. 1273–1286.doi:10.2514/2.5876
[3] Schetz, J. A., Maddalena, L., Throckmorton, R., and Neel, R.,“ComplexWall Injector Array for High-SpeedCombustors,” Journal ofPropulsion and Power, Vol. 24, No. 4, 2008, pp. 673–680.doi:10.2514/1.36660
[4] Northam, G. B., Greenberg, I., Byington, C. S., and Capriotti, D. P.,“Evaluation of Parallel Injector Configurations for Mach 2Combustion,” Journal of Propulsion and Power, Vol. 8, No. 2, 1992,pp. 491–499.doi:10.2514/3.23503
[5] Hartfield, R. J., Hollo, S. D., and McDaniel, J. C., “ExperimentalInvestigation of Swept Ramp Injector Using Laser-Induced IodineFluorescence,” Journal of Propulsion and Power, Vol. 10, No. 1, 1994,pp. 129–135.doi:10.2514/3.23721
[6] Riggins, D. W., McClinton, C. R., Rogers, R. C., and Bittner, R. D.,“Investigation of Scramjet Strategies for High Mach Number Flows,”Journal of Propulsion and Power, Vol. 11, No. 3, 1995, pp. 409–418.doi:10.2514/3.23859
[7] Cox, S. K., Fuller, R. P., Schetz, J. A., and Walters, R. W., “VorticalInteraction Generated by an Injector Array to Enhance Mixing inSupersonic Flow,” AIAA Paper 94-0708, Jan. 1994.
z/H
y/H
Cor
rela
tion
coe
ffic
ient
-1.0 -0.5 0 0.5 1.0
1.0
0.5
0
-0.5
-1.0
-1.5
-2.0 -1
-0.5
0
0.5
1Plane 1
z/H
y/H
Cor
rela
tion
coef
fici
ent
-1.0 -0.5 0 0.5 1.0
1.0
0.5
0
-0.5
-1.0
-1.5
-2.0 -1
-0.5
0
0.5
1Plane 1
z/H
y/H
Cor
rela
tion
coe
ffic
ient
-1.0 -0.5 0 0.5 1.0
1.0
0.5
0
-0.5
-1.0
-1.5
-2.0 -1
-0.5
0
0.5
1Plane 1
z/H
y/H
Cor
rela
tion
coef
fici
ent
-1.0 -0.5 0 0.5 1.0
1.0
0.5
0
-0.5
-1.0
-1.5
-2.0 -1
-0.5
0
0.5
1Plane 1
Fig. 15 Correlation maps in plane 1 for He-injection cases: P0j �2:4 atm with pylon (top left), P0j � 2:4 atm without pylon (top right),
[8] Fuller, R. P., Wu, P.-K., Nejad, A. S., and Schetz, J. A., “Fuel-VoetrxInteraction for EnhancedMixing in Supersonic Flow,”AIAA Paper 96-2661, July 1996.
[9] Bowersox, R. D. W., “Turbulent Flow Structure Characterization ofAngled Injection into a Supersonic Crossflow,” Journal of Propulsionand Power, Vol. 34, No. 2, 1997, pp. 205–213.
[10] Thomas, R. H., Schetz, J. A., and Fuller, E. J., “Effects of Yaw on LowAngle Injection into a Supersonic Flow,” AIAA Paper 1991-14, 1991.
[11] Vinogradov, V. A., and Prudnikov, A. G., “Injection of Liquid into theStrut Shadow at Supersonic Velocities,” SAE Aerospace AtlanticConference, Society of Automotive Engineers, Paper SAE-931455,1993.
[12] Livingston, T., Segal, C., Schindler, M., and Vingogradov, V. A.,“Penetration and Spreading of Liquid Jets in an External-InternalCompression Inlet,” Journal of Propulsion and Power, Vol. 38, No. 6,2000, pp. 989–994.
[13] Schetz, J. A., “Injection and Mixing in Turbulent Flow,” Progress in
Astronautics and Aeronautics, edited by M. Summerfield, Vol. 68,AIAA, New York, 1980.
[14] Vinogradov, V. A., Shikhman, Yu.M., and Segal, C., “AReview of FuelPre-Injection in Supersonic, Chemically Reacting, Flows,” Applied
Mechanics Reviews, Vol. 60, No. 4, 2007, pp. 139–148.doi:10.1115/1.2750346
[15] Owens, M., Mullagiri, S., Segal, C., and Vinogradov, V. A., “Effects ofFuel Preinjection on Mixing in Mach 1.6 Airflow,” Journal of
Propulsion and Power, Vol. 17, No. 3, 2001, pp. 605–610.doi:10.2514/2.5784
[16] Shikhman, Yu. M., Vinogradov, V. A., Yanovskiy, L. S., Stepanov,V. A., Shlyakotin, V. E., and Penkov, S. N., “The Demonstration ofTechnologies-Endothermic Hydrocarbon Fueled dualMode Scramjet,”AIAA Paper 2001-1787, 2001.
[17] Vinogradov, V. A., Grachev, V., Petrov, M., and Sheechman, J.,“Experimental Investigation of 2-DdualMode ScramjetwithHydrogenFuel at Mach 4–6,” AIAA Paper 90-5269, 1990.
[18] Guoskov, O. V., Kopchenov, V. I., Lomkov, K. E., Vinogradov, V. A.,andWaltrup, P. J., “Numerical Research ofGaseous Fuel Preinjection inHypersonic Three Dimensional Inlet,” Journal of Propulsion and
Power, Vol. 17, No. 6, 2001, pp. 1162–1169.doi:10.2514/2.5890
[19] Gruber, M. R., Carter, C. D., Montes, D. R., Haubelt, L. C., King, P. I.,and Hsu, K.-Y., “Experimental Studies of Pylon-Aided Injection into aSupersonic Crossflow,” Journal of Propulsion and Power, Vol. 24,No. 3, May–June 2008, pp. 460–470.doi:10.2514/1.32231
[20] Pohlman,M. R., and Greendyke, R. B., “Critical Design Parameters forPylon-Aided Gaseous Fuel Injection,” AIAA Paper 2009-1422,Jan. 2009.
[21] Segal, C., and Young, C. D., “Development of an ExperimentallyFlexible Facility for Mixing-Combustion Interactions in SupersonicFlow,” Journal of Energy Resources Technology, Vol. 118, June 1996,pp. 152–158.
[22] Takahashi, H., “Experimental Study of Scalar Structure in a SupersonicTurbulent Mixing Flowfield Using Acetone PLIF,” Ph.D. Dissertation,Aerospace Engineering Department, Tohoku Univ., Sendai, Japan,Mar. 2009.
[23] Thurber, M. C., “Acetone Laser-Induced Fluorescence for Temperatureand Multiparameter Imaging in Gaseous Flows,” Ph.D. Dissertation,Mechanical Engineering Department, Stanford Univ., Stanford, CA,Mar. 1999.
[24] Tu, Q., and Segal, C., “Isolator/Combustion Chamber InteractionsDuring Supersonic Combustion,” AIAA Paper 2009-4845, Aug. 2009.
[25] Thakur, A., and Segal, C., “Concentration Distribution in a SupersonicFlowRecirculation Region,” Journal of Propulsion and Power, Vol. 24,No. 1, Jan. 2008, pp. 64–73.doi:10.2514/1.25396
[26] Ben-Yakar,A.,Mungal,M.G., andHanson,R.K., “TimeEvolution andMixing Characteristics of Hydrogen and Ethylene Transverse Jets inSupersonic Crossflows,” Physics of Fluids, Vol. 18, 2006,Paper 026101.doi:10.1063/1.2139684
[27] Smith, K. M., and Dutton, J. C., “Investigation of Large-ScaleStructures in Supersonic Planar Base Flows,” AIAA Journal, Vol. 34,No. 6, June 1996, pp. 1146–1152.doi:10.2514/3.13205
[28] Schetz, J. A. and Billig, F. S., “Penetration of Gas Jets Injected into aSupersonic Stream,” AIAA Journal, Vol. 3, No. 11, Nov. 1966,pp. 1658–1665.
[29] Portz, R., and Segal, C., “Penetration of Gaseous Jets in SupersonicFlows,” AIAA Journal, Vol. 44, No. 10, Oct. 2006, pp. 2426–2429.doi:10.2514/1.23541
[30] Burger, S. K., Schetz, J. A., and Ungewitter, R., “Effects of InjectantMolecular Weight on Transverse Injection Mixing Processes inSupersonic Flow,” AIAA Paper 2009-7315, 2009.
[31] Messersmith, N. L., andDutton, J. C., “Characteristic Features of LargeStructures in Compressible Mixing Layers,” AIAA Journal, Vol. 34,No. 9, Sept. 1996, pp. 1814–1821.doi:10.2514/3.13312
[32] Takahashi, H., Oso, H., Kouchi, T., Masuya, G., and Hirota,M., “ScalarSpatial Correlations in a Supersonic Mixing Flowfield,” AIAAPaper 2009-0023, 2009.