Full Terms & Conditions of access and use can be found at http://www.tandfonline.com/action/journalInformation?journalCode=uaqm20 Aquaculture Economics & Management ISSN: 1365-7305 (Print) 1551-8663 (Online) Journal homepage: http://www.tandfonline.com/loi/uaqm20 Effects of regulations on technical efficiency of U.S. baitfish and sportfish producers Jonathan Van Senten, Madan M. Dey & Carole R. Engle To cite this article: Jonathan Van Senten, Madan M. Dey & Carole R. Engle (2018): Effects of regulations on technical efficiency of U.S. baitfish and sportfish producers, Aquaculture Economics & Management To link to this article: https://doi.org/10.1080/13657305.2018.1454539 Published online: 20 Jun 2018. Submit your article to this journal View related articles View Crossmark data
Transcript
Full Terms & Conditions of access and use can be found athttp://www.tandfonline.com/action/journalInformation?journalCode=uaqm20
Effects of regulations on technical efficiency of U.S.baitfish and sportfish producers
Jonathan Van Senten, Madan M. Dey & Carole R. Engle
To cite this article: Jonathan Van Senten, Madan M. Dey & Carole R. Engle (2018): Effects ofregulations on technical efficiency of U.S. baitfish and sportfish producers, Aquaculture Economics& Management
To link to this article: https://doi.org/10.1080/13657305.2018.1454539
Effects of regulations on technical efficiency ofU.S. baitfish and sportfish producers
Jonathan Van Sentena , Madan M. Deyb, and Carole R. Englec
aVirginia Seafood AREC, Virginia Polytechnic Institute and State University, Hampton, VA, USA;bDepartment of Agriculture, Texas State University, San Marcos, Texas, USA; cEngle-StoneAquatic $LLC, Strasburg, VA, USA
ABSTRACTThe stringency of the regulatory environment has been shownto negatively affect the growth of aquaculture. A technical effi-ciency analysis of baitfish/sportfish production in the UnitedStates was performed using a stochastic production frontiermodel and a jointly estimated maximum-likelihood procedure(Frontier 4.1). Determinants of inefficiency were assessed fortheir relationship to farm efficiency. Mean technical efficiencyfor U.S. baitfish and sportfish producers was found to be 77%.Several regulatory variables were found to be significant inexplaining the variation in levels of efficiency, including thenumber of annual renewals of permits and licenses and theamount of manpower required to comply with regulations.Results support the hypothesis that the current regulatoryenvironment in the United States has reduced efficiency andeconomic competitiveness of baitfish and sportfish producers.
KEYWORDSPolicy analysis; productioneconomics; United States
Introduction
Over the last decade, aquaculture in the United States has experienced anoverall decline, driven by rising feed prices, increased pressure from imports,and a complex regulatory environment (Engle and Stone, 2013). A growingbody of literature has provided evidence that the regulatory environment canresult in excessive costs to aquaculture producers (Abate Nielsen, & Tveterås,2016; Dresdner & Estay, 2016). More specifically, a recent survey of baitfishand sportfish producers in the United States found that the average annualcost of regulations was $150,000 per farm that represented costs of $7400 perha and 25% of total annual costs (van Senten & Engle, 2017). National indus-trywide regulatory cost for baitfish and sportfish was estimated to be inexcess of $12 million per year. Moreover, substantial restrictions in access tomarkets were documented that were attributed directly to the regulatory
CONTACT Jonathan van Senten [email protected] Virginia Seafood AREC, Virginia Polytechnic Instituteand State University, 102 S. King Street, Hampton, VA 23669, USA.� 2018 Taylor & Francis
environment; more than 60% of respondents from that study reported lost orforegone sales as a result of regulations or regulatory complexity.The U.S. baitfish and sportfish industry satisfies recreational demand for
anglers and pond owners by producing a variety of fish, including goldenshiners (Notemigonus crysoleucas), fathead minnows (Pimephales promelas),goldfish (Carassius auratus), largemouth bass (Micropterus salmoides), small-mouth bass (Micropterus dolomieu), crappie (Pomoxis sp.) and otherCentrarchid species (Stone & Thomforde, 2001; USDA, 2014). The 2013U.S.Census of Aquaculture reported 166 baitfish producers and 282 sportfishproducers, with sales in excess of $52 million (USDA, 2014). While farm sizeis highly variable across the sector, extensive pond production is the primarymethod of production. This means that climate and season are importantfactors for production and directly affect supply and demand of baitfish andsportfish in many regions of the United States. Interstate transport of livefish is a common practice within the industry, and necessary to reach whole-salers, retailers, and end users across the country. However, interstate trans-port requires compliance with various regulations, mostly focused on aquaticanimal health. The exact number of enforcement agencies regulating the per-mitting and licensure of baitfish and sportfish varies by state, as do the num-ber of permits and licenses, and the specific requirements of those permitsand licenses. Most states require a permit or license to propagate fish; insome cases, specific permits or licenses are required for specific species offish. In most cases, a certificate of health is required for fish to be shippedacross state lines, or in some cases between watersheds. The major cost ofthese permits and licenses is not the direct cost of the permits, but rather themanpower involved in maintaining compliance (van Senten & Engle, 2017).Manpower on the farm is tasked with identifying which regulations are rele-vant in each state, how to obtain those licenses or permits, completing com-pliance activities to be eligible for those licenses and permits, completingapplications for licenses and permits, and filing records of licenses and per-mits once obtained. Reporting requirements for permits and licenses alsovary by state, with some states requiring all parties involved in the process tomaintain a copy of the documentation on hand. The number of annual per-mit and license renewals for baitfish and sportfish producers average 13, asreported by van Senten and Engle (2017); however, individual farms reportedas many as 203.Beyond simply increasing costs for producers, there is reason to suspect
that the current regulatory environment may be affecting the efficiency ofbaitfish and sportfish producers. The study by van Senten and Engle (2017)demonstrated that regulations primarily increased annual fixed costs butbecause the regulatory environment also restricted access to markets, farm-ers were not able to increase the scale of their operation to spread the
2 J. V. SENTEN ET AL.
increased fixed costs over greater volumes of production. Asche and Roll(2013), using a stochastic frontier approach, found that improvements ingovernmental regulations resulted in more permanent improvements inefficiency of Norwegian salmon producers. These recent studies contrastwith work completed more than 23 years ago (Thunberg Adams, & Cichra,1994) that concluded that financial and marketing barriers were more prob-lematic in the state of Florida than were regulatory barriers. Thunberg et al.(1994) did not consider baitfish and sportfish in their analysis; however,reports show that the regulatory burden in the United States has increasedover time (Crews, 2017). However, no quantitative analysis has been foundin the literature to quantitatively test whether the regulatory environmentdoes affect technical efficiency on aquaculture farms or which types ofregulatory metrics have significant effects.A number of factors have been identified that affect technical efficiency of
agriculture in general. For example, the greater scale and scope of farms in theU.S. Corn Belt were found to increase farm efficiencies and decrease competi-tiveness of small family farms (Paul, Nehring, Banker, & Somwaru, 2004;Fengxia, Hennessy, Jensen, & Volpe, 2016). Education and outmigration(Sauer, Gorton, & Davidova, 2015) have also been found to reduce technicalefficiency, while efficiency-enhancing investments (Mekonnen, Spielman,Fonsah, & Dorfman, 2015) have been found to increase technical efficiency.More specific to aquaculture, age, experience and education have fre-
quently been found to significantly affect the technical efficiency of aqua-culture farms, although whether the effect is positive or negative variedamong reviewed studies (Iliyasu et al., 2014). A variety of other variables,such as farm size appear as significant in some studies (Arita & Leung,2014) but were not significant in others (Iliyasu et al., 2014). In morerecent studies, Sandvold (2016) found that older producers were somewhatmore efficient at producing salmon smolts in Norway, and water use wasfound to affect efficiency of catfish and red tilapia production in tanks inMalaysia (Iliyasu & Mohammad, 2015).A high level of technical efficiency, producing the maximum output for a
given level of inputs, is important for farms to be both competitive and prof-itable (Murova & Chidmi, 2013; Lakner, Brenes-Mu~noz, & Br€ummer, 2017).Recent research has suggested that the regulatory environment may reducefarm-level competitiveness of aquaculture. For example, based on an analysisof 95 developed and developing countries, Abate et al. (2016) showed thatthe stringency of environmental regulations was negatively associated withthe rate of growth of aquaculture. A number of studies have concluded thatthe fragmented nature of regulations for aquaculture and the resulting redun-dancies need to be addressed in developed countries (Engle & Stone, 2013;Kite-Powell, Rubino, & Morehead, 2013; Abate et al., 2016; Engle, 2016;
AQUACULTURE ECONOMICS & MANAGEMENT 3
Knapp & Rubino, 2016). On the other hand, Rahman, Hatha, Selvam, &Thomas (2016) discussed the importance of increasing the stringency andenforcement of regulations in developing countries. For example, numerousstudies have shown that weak enforcement systems in countries such asChina and Vietnam contribute to continued widespread use of antibioticsthat are banned from use in livestock feeds in the U.S. (Broughton &Walker, 2010; Rico et al., 2012, 2013).It should be noted that concerns related to the regulatory environment in
the U.S. and the European Union (EU) do not stem from a desire to elim-inate all regulations. Regulations are necessary to internalize productionexternalities to maximize social welfare. However, there is increasingevidence of inefficiencies in the regulatory environment specifically relatedto aquaculture that result from redundancy, unnecessary duplication,and overlap (van Senten & Engle, 2017; Osmundsen, Almklov, &Tveterås, 2017).The effect of regulations on technical efficiency in agriculture generally is
not well defined. For example, neither Paul, Johnston, and Frengley (2000)or Yang, Hsiao and Yu (2008) found significant effects from regulations ontechnical efficiency of sheep and beef farms in New Zealand and swinefarms in Taiwan, respectively. On the other hand, van der Vlist, Withagenand Folmer (2007) reported results confirming Porter’s hypothesis (1995)that stricter environmental policy resulted in more technically efficientDutch horticulture farms.This study contributes to previous technical efficiency studies by estimat-
ing the technical efficiency of U.S. baitfish and sportfish producers, withspecific attention to whether variables that reflected regulatory complianceon farms had significant effects on baitfish/sportfish production. Specificobjectives include: (1) to estimate technical efficiency on U.S. baitfish andsportfish farms; (2) to identify whether there are regulatory variables thatcontribute significantly to farm efficiencies; and (3) to estimate potentialeffects on farm efficiencies of streamlined regulatory processes.This paper proceeds by first describing the survey used to collect data
and the variables of interest and then presenting the production and ineffi-ciency functions of the stochastic frontier model used. The empirical speci-fication and sensitivity analysis are then described, followed by results,discussion, and conclusions.
Materials and methods
Data and variables
A survey was conducted in 2015 to capture data on farm production, costs,and the type, nature, and compliance costs of the total set of regulations that
4 J. V. SENTEN ET AL.
affect U.S. baitfish and sportfish producers (van Senten & Engle, 2017). Thesurvey targeted the 13 major baitfish and sportfish producing states in theU.S.; budget limitations precluded a national survey. This targeted populationcomposed 81% of the total volume of production (USDA, 2014). The surveywas conducted as a census; thus, the data reported are population and notsampling data. The survey was designed to capture line-item quantities andcosts of farm inputs, farm production volumes and sales, general farm char-acteristics, and regulatory compliance activities and costs.Survey reliability was evaluated through the test-retest method and valid-
ity through consultations with experts and pre-testing of the survey instru-ment (Litwin, 1995). The survey responses covered 74% of the nationalproduction volume with responses from 34% of the baitfish/sportfish farms.Detailed information on regulations that affected U.S. baitfish/sportfishfarms can be found in van Senten and Engle (2017). Survey data werecoded and entered into a spreadsheet (Microsoft ExcelVR ) prior to trans-formation for efficiency analysis using Frontier 4.1 (Coelli, 2011).Since the baitfish/sportfish industry is composed of a variety of spe-
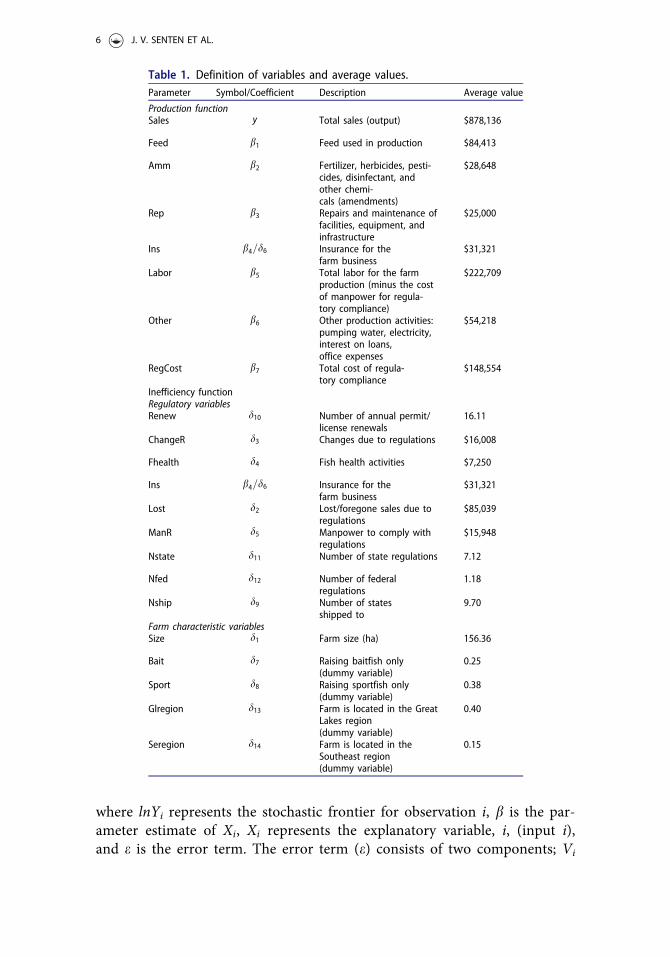
cies, production systems, and marketing strategies, production data (bothinputs and outputs) were recorded in U.S. dollar values. As an exampleof the variation in the way various baitfish/sportfish farms measured out-put, some farms measured production by weight (pounds) while othersused inches or “head” of fish (individual units). While it is customaryfor production functions to be expressed in terms of quantities, it ispossible to utilize values as a proxy for quantities (Grieco, Li, & Zhang2016). In this case inputs were sourced from a competitive market wherebaitfish and sportfish producers are price takers and subject to the sameprices for given inputs (Grieco et al., 2016). Thus, value is a proxy forquantity in this analysis. A description of the variables used and theirmean values are presented in Table 1.There were a total of 60 observations (farms) in the dataset, with over
20 production input categories. All data (output and inputs) were trans-formed to a per-hectare (ha) value and the natural log taken. Stata 11(StataCorp, 2009) was used to test for homoscedasticity (RV plot andBreusch-Pagan test), multicollinearity (VIF test), model specification(Lowess test), and normality (Kdensity, Pnorm, Qnorm, andShapiro–Wilk test).
Stochastic Frontier Model
The stochastic frontier production model (Aigner, Lovell, & Schmidt, 1977)can be expressed as:
lnYi ¼ f b;Xið Þ þ e (1)
AQUACULTURE ECONOMICS & MANAGEMENT 5
where lnYi represents the stochastic frontier for observation i, b is the par-ameter estimate of Xi, Xi represents the explanatory variable, i, (input i),and e is the error term. The error term (e) consists of two components; Vi
Table 1. Definition of variables and average values.Parameter Symbol/Coefficient Description Average value
Production functionSales y Total sales (output) $878,136
Glregion d13 Farm is located in the GreatLakes region(dummy variable)
0.40
Seregion d14 Farm is located in theSoutheast region(dummy variable)
0.15
6 J. V. SENTEN ET AL.
a firm specific white-noise stochastic error and Ui the firm specific ineffi-ciency (Asche & Roll, 2013). The frontier production function representsthe case where there is no inefficiency in the model (Ui ¼ 0) (Coelli, Rao,O’Donnell, & Battese, 2005). The gap between the stochastic frontier and afirm’s observed production output, then, represents that specific firm’s inef-ficiency. Technical efficiency is commonly represented as a ratio (Coelliet al., 2005), where 1 represents complete efficiency and 0 complete ineffi-ciency. Expressed in terms of inputs Xi and firm specific output Yi as(Murova & Chidmi, 2013); technical efficiency is:
TE ¼ Yi
f ðbXiÞ ¼f ðbXi � UiÞ
f ðbXiÞ (2)
Assuming a half-normal distribution of the error term allows for a moresimplified approach to the determinants of inefficiency (Asche & Roll,2013). A separate function represents the inefficiency of each firm (r2), as afunction of explanatory variables Zi, which may be the same as Xi from thestochastic frontier function (Asche & Roll, 2013):
r2i ¼ expðZi;WÞ (3)
where W is a vector of those same explanatory variables (Zi).Battese and Coelli (1995) argued that two-stage estimation of efficiency
was inconsistent in its assumption of the independence of inefficiencyeffects. Therefore, they developed a model to perform a joint estimation ofthe firm-level efficiencies and regress those predicted efficiencies over firm-specific variables (Coelli, 2011):
where Yit is the dependent variable, Xit the explanatory variable, b is the param-eter estimate of Xit explanatory variable, Vit are random variables assumed to beindependent and identically distributed N(0, rv
2), and Uit are non-negative ran-dom variables assumed to account for technical inefficiency (Coelli, 2011). TheBattese and Coelli specification also assumes that Uit is independently distrib-uted as truncations at zero of N(mit, ru
2), where (Coelli, 2011):
mit ¼ zitd (5)
where Zit is a vector of the variables influencing inefficiency and d is a vectorof the parameters to be estimated (Coelli, 2011). Through replacing rv
2 andru
2:
r2 ¼ r2V þ r2U and c ¼ r2U=ðr2V þ r2UÞ (6)
this model can be estimated through a maximum-likelihood procedure(Coelli, 2011). The Frontier 4.1 program utilizes a three-step estimation
AQUACULTURE ECONOMICS & MANAGEMENT 7
procedure to obtain maximum likelihood estimates of the parameters in thestochastic frontier production function as follows (Coelli, 2011):
1. an ordinary least squares (OLS) estimate of the function is performedwhere, with the exception of the intercept, all parameter estimates (b)are unbiased;
2. a grid search of c with parameters (b) set to the OLS estimates; and3. an iterative maximization procedure using first-order partial derivatives
to obtain final maximum likelihood estimates (Davidon–Fletcher–PowellQuasi-Newton method).
Empirical specification
A number of production variables were consolidated to correct for issues ofmulticollinearity. For example, fertilizer, herbicides, disinfectants, andchemicals were grouped into a variable named “amendments.” Similarly,on-farm energy inputs (electricity and pumping water), fuel inputs, andother miscellaneous inputs were grouped into an “other” variable. The finalstochastic frontier production model was:
where bi is the parameter estimate of explanatory variables of feed(lnFeedi), amendments (lnAmmi), repairs and maintenance (lnRepi), insur-ance (lnInsi), labor (lbLabori), other miscellaneous inputs (lnOtheri), andregulatory costs (lnRegCosti) expressed as natural logs. Vi are random varia-bles assumed to be independent and identically distributed N(0, rv
2), andUi are non-negative random variables assumed to account for technicalinefficiency (Coelli, 2011). A likelihood ratio test value of 59 exceeded theupper bound Wald criteria for joint testing of the equality and inequalityrestrictions at the 5% level (Kodde & Palm, 1986), and therefore the nullhypothesis of a trans-log model over a Cobb-Douglas model was rejected;the Cobb-Douglas specification was used for the analysis.The inefficiency function focused on descriptive and regulatory cost vari-
ables obtained from the survey. These regulatory variables were selectedbased on findings from van Senten and Engle (2017) who identified man-power to comply with regulations, fish health testing, changes due to regu-lations, and lost and foregone sales as substantial elements of the regulatorycompliance cost on farms. Lost and foregone sales contributed the largestportion of regulatory cost (57%), followed by changes due to regulations(22%), manpower to comply with regulations (11%), and fish health testingcosts (5%). It should be noted that the costs of farm-level changes due to
8 J. V. SENTEN ET AL.
regulations did not include permit/license renewals or manpower; only thecosts of implementing the change, to avoid double counting regulatory-induced costs. While the direct cost of permits and licenses may only haveaccounted for 1% of total regulatory costs on average, the relationshipbetween the number of annual license and permit renewals (in excess of 100in some cases) and the manpower compliance costs of producers was alsonoted. Hence, these regulatory variables were believed to be likely contribu-tors to inefficiency on farms and were included in the inefficiency function.In addition to these variables, dummy variables for the type of fish raised onfarms and the region in which farms were located were added to the func-tion. The function as entered into Frontier 4.1 was specified as:
þ d11NStatei þ d12NFedi þ d13GlRegioni þ d14SeRegioni þ ei
(8)
where mi is the mean of the non-negative random variables (Ui) assumedto account for technical inefficiency, di is the parameter estimate of farmsize (Sizei), lost/foregone sales (Losti), changes due to regulation (ChangeRi),fish health activities (FHealthi), manpower cost of compliance (ManRi),insurance for the farm (Insi), dummy variable for raising baitfish only(Baiti), dummy variable for raising sportfish only (Sporti), number of statesshipped to (NShipi), number of annual permit/license renewals (Renewi),number of state regulations (NStatei), number of federal regulations(NFedi), dummy variable for the Great Lakes region (GlRegioni), dummyvariable for the Southeast region (SeRegioni), and ei is the error term. Thebase scenario modelled was for a farm raising both baitfish and sportfish inthe South Central region. The technical efficiency of the ith sample farmðTEiÞ is obtained as TEi ¼ expð�UiÞ:
Hypothesis testing
Three hypotheses related to the validity of the estimates developed weretested with a generalized likelihood ratio test (Hassan & Ahmad, 2005)
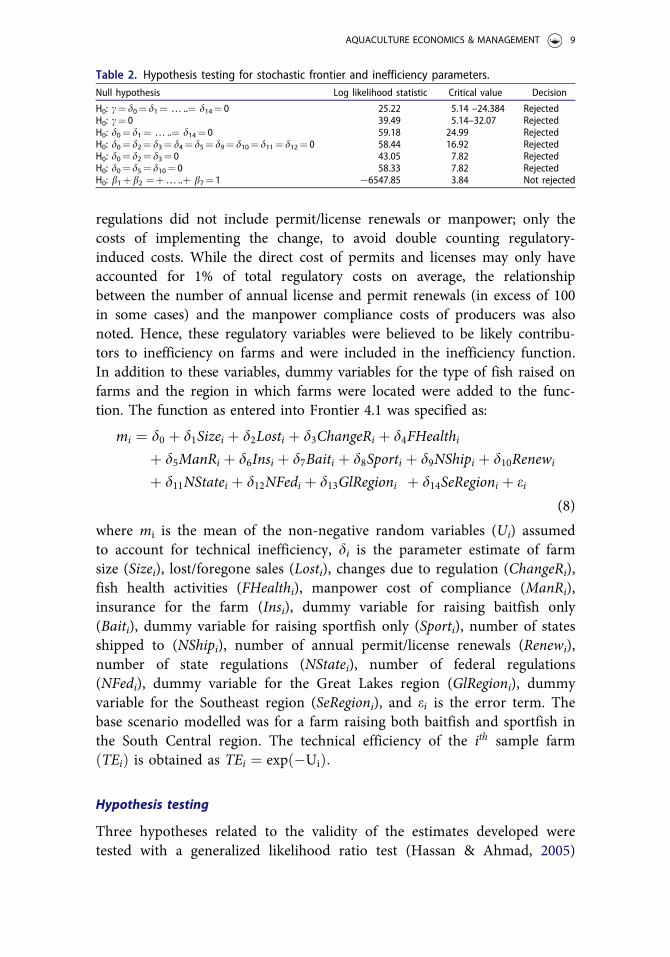
Table 2. Hypothesis testing for stochastic frontier and inefficiency parameters.Null hypothesis Log likelihood statistic Critical value Decision
(Table 2). The first tested for the absence of inefficiency effects from themodel as follows:H0: c¼ d0¼ d1¼ d2¼ d3¼ d4¼ d5¼ d6¼ d7¼ d8¼ d9¼ d10 ¼ d11¼ d12
¼ d13¼ d14¼ 0.Secondly, the inefficiency effects of the model were tested for not being
stochastic as follows:H0: c¼ 0.The third hypothesis tested was to determine if the 14 variables used in
the inefficiency equation (11), had a significant effect on the inefficiency,with the following null hypothesis:H0: d0¼ d1¼ d2¼ d3 ¼ d4¼ d5¼ d6¼ d7¼ d8¼ d9¼ d10¼ d11¼ d12
¼ d13¼ d14¼ 0.A hypothesis of whether regulatory variables in the inefficiency function
contributed to technical efficiency of the model was tested with the follow-ing null hypothesis:H0: d0¼ d2 ¼ d3 ¼ d4 ¼ d5 ¼ d9 ¼ d10 ¼ d11 ¼ d12 ¼ 0.Separate hypothesis tests were performed on the effect of the regulatory
variables that were significant on technical efficiency with the followingnull hypotheses:H0: d0¼ d5 ¼ d10 ¼ 0.Positive coefficients (number of annual permit/license renewals and man-
power to comply with regulations)H0: d0¼ d2 ¼ d3 ¼ 0.Negative coefficients (changes due to regulations and lost/foregone sales)Constant returns to scale were tested with the following hypothesis:H0: b1þ b2þ b3 þ b4þ b5 þb 6þ b7 ¼ 1.
Results
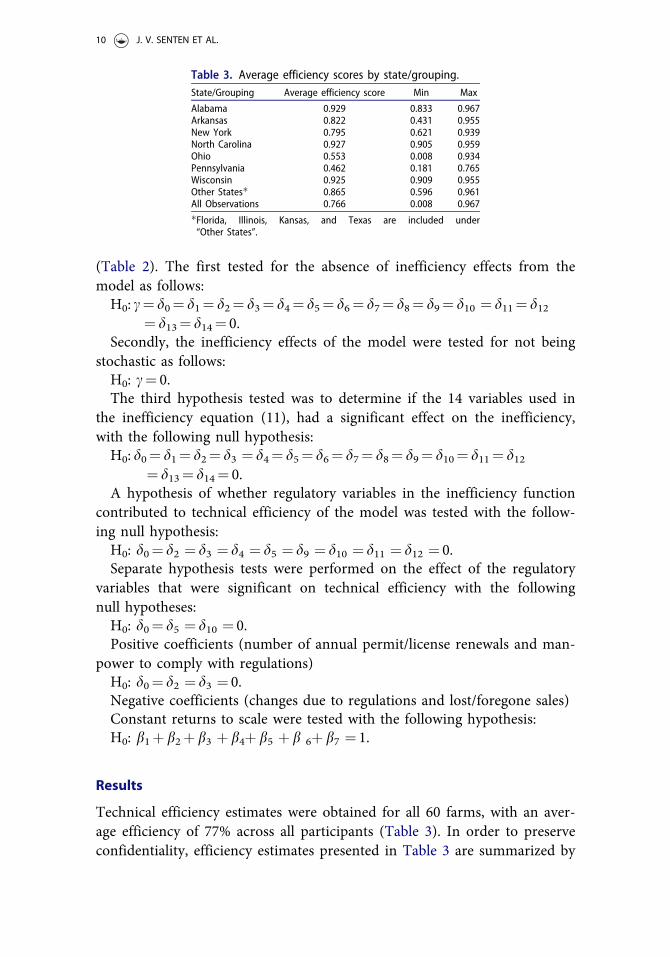
Technical efficiency estimates were obtained for all 60 farms, with an aver-age efficiency of 77% across all participants (Table 3). In order to preserveconfidentiality, efficiency estimates presented in Table 3 are summarized by
Table 3. Average efficiency scores by state/grouping.State/Grouping Average efficiency score Min Max
Alabama 0.929 0.833 0.967Arkansas 0.822 0.431 0.955New York 0.795 0.621 0.939North Carolina 0.927 0.905 0.959Ohio 0.553 0.008 0.934Pennsylvania 0.462 0.181 0.765Wisconsin 0.925 0.909 0.955Other States� 0.865 0.596 0.961All Observations 0.766 0.008 0.967�Florida, Illinois, Kansas, and Texas are included under“Other States”.
10 J. V. SENTEN ET AL.
state (with Florida, Illinois, Kansas, and Texas included under“Other States”).The null hypothesis for the first hypothesis test related to the validity
of the estimates developed (H0: c¼ d0¼ d1¼ d2¼ d3¼ d4¼ d5¼ d6¼ d7¼ d8¼ d9¼ d10¼ d11¼ d12¼ d13¼ d14¼ 0) was rejected (test statistic of 25.22;critical value range of 5.14 to 24.38), indicating that the model containsinefficiency effects. The null hypothesis for the second null hypothesisrelated to the validity of estimates developed (H0: c¼ 0) was also rejected(test statistic of 39.49 exceeding the critical value range of 5.14 to 32.07).Therefore, the technical inefficiency effects of the model are understood tobe random (Hassan & Ahmad, 2005). The third hypothesis tested related tothe validity of the estimates developed (H0: d0¼ d1¼ d2¼ d3¼ d4¼ d5¼ d6¼ d7¼ d8¼ d9¼ d10¼ d11¼ d12¼ d13¼ d14¼ 0) was rejected (exceededthe critical value of 24.99). Thus, the 14 variables specified were found tohave an effect on technical inefficiency.The parameter estimates for each variable from the maximum-likelihood
estimation procedure are listed in Table 4. In the stochastic productionfunction (8) estimated, the b coefficients reveal that “amendments”, “repairsand maintenance”, “labor”, and “other” (included costs to pump water,electricity, and interest expenses on loans), variables were significant(asymptotic absolute value t-ratio>1.96). The negative coefficient for the
Table 4. Parameter estimates for jointly estimated stochastic frontier model.Parameter Coefficient estimate Standard error T-ratio Significant (p<0.05)
Production functionIntercept (b0) 3.166 0.719 4.403Amendments �0.126 0.061 �2.048 �Repairs and maintenance 0.333 0.086 3.893 �Labor 0.211 0.088 2.406 �Feed 0.174 0.140 1.245Insurance 0.178 0.102 1.756Regulatory cost 0.018 0.060 0.296Other 0.153 0.043 3.547 �Inefficiency functionIntercept (d0) �3.216 0.856 �3.756Regulatory variablesAnnual renewals of permits/licenses 0.007 0.003 2.339 �Changes due to regulation �0.187 0.057 �3.289 �Fish health regulations �0.093 0.066 �1.414Insurance 0.640 0.176 3.635 �Lost/foregone sales �0.099 0.046 �2.178 �Manpower to comply with regulations 0.220 0.082 2.669 �Number of federal regulations �0.061 0.095 �0.643Number of state regulations �0.043 0.032 �1.334Number of states shipped to �0.005 0.017 �0.281Farm characteristic variablesFarm size 0.002 0.001 1.918Baitfish only (dummy) �0.109 0.557 �0.196Sportfish only (dummy) �0.753 0.382 �1.969 �Great Lakes region �0.121 0.515 �0.235Southeast region �1.658 0.924 �1.795r2 0.255 0.070 3.647c 0.365 0.189 1.930
AQUACULTURE ECONOMICS & MANAGEMENT 11
“amendments” variable indicated that production output decreased asamendment usage increased. Variables denoting feed, insurance, and regula-tory costs were not significant.In the inefficiency function, the following variables were significant
(asymptotic absolute value t-ratio>1.96): “permit/license renewals”,“changes due to regulations”, “insurance”, “lost/foregone sales”, and“manpower to comply with regulations”. Of the farm characteristic varia-bles, only the dummy variable for “Sportfish” was significant.The hypothesis of whether regulatory variables in the inefficiency func-
tion contributed to technical efficiency of the model was rejected (test stat-istic of 58.44 exceeded the critical value of 16.92), and the regulatoryvariables specified were found to contribute to technical inefficiency in themodel. Both null hypotheses tested on the effect of the regulatory variablesthat were significant on technical efficiency were rejected, suggesting thatthese respective variables (positive coefficients and negative coefficients) didhave an effect on technical inefficiency of baitfish and sportfish producers.The null hypothesis for constant returns to scale was not rejected (test stat-istic of �6,547.85, lower than the critical value of 3.84), indicating that themodel as specified exhibited constant returns to scale.
Discussion
Production function
The base scenario modelled by the estimation was for a farm raising bothbaitfish and sportfish in the U.S. South Central region; with dummy varia-bles accounting for farms that raised only baitfish or only sportfish, andfarms located in the Great Lakes region and Southeast region. Results ofthe stochastic production frontier estimation for U.S. baitfish/sportfishdemonstrated that feed was not a significant input for baitfish and sportfishproducers in this study in contrast with foodfish production (Lacewell,Nichols, & Jambers, 1973; Nerrie, Engle, Hatch, & Smitherman, 1990;Losinger, Dasgupta, Engle, & Wagner, 2007; Engle, 2010). Baitfish andsportfish producers more commonly use fertilizers to promote algal bloomsand natural food with supplemental, rather than intensive feeding of com-mercial diets. In some instances, producers rearing both baitfish and sport-fish have used surplus baitfish as forage to supplement feeding of sportfish.Indeed, the “amendments” variable that included fertilizer, was significant.The negative coefficient on this variable may reflect the need to fertilize athigher rates in ponds with water with high calcium hardness (Brunson,Hargreaves, & Stone, 2000), typical of the quality of water found on manybaitfish/sportfish farms in Arkansas, where the greatest amount of baitfish/sportfish are raised in the U.S. The increasing difficulty of controlling
12 J. V. SENTEN ET AL.
problematic aquatic vegetation in older ponds, such as those used for bait-fish and sportfish production may result in weedy ponds that tend to haveless phytoplankton and zooplankton for baitfish and sportfish to feed on(Jones et al., 2016).The variables “repairs and maintenance”, “labor”, and “other” inputs of
production were also significant in the production function, with positivecoefficients. Thus, as the value of repairs and maintenance and laborincreased, so did production output. This result aligns well with commonknowledge of the management of many aquaculture businesses, in whichlabor, fuel, and costs to pump water, among others are important costs ofaquaculture businesses. Given the relatively high level of fixed costs as apercentage of total annual costs in baitfish and sportfish production, repairand maintenance costs would be expected to be relatively higher to main-tain intermediate and long-term assets such as equipment, buildings, andpond infrastructure. Labor is a major cost of production in baitfish/sport-fish (Stone, Kelly, & Roy, 2016) as is the combined costs of pumping, elec-tricity, and interest costs included in the “other” category.The regulatory cost variable was not found to be significant in the pro-
duction function, signifying that the cost of regulations did not significantlyexplain the quantity of baitfish and sportfish produced. While the overallcost of compliance was found to be a major economic burden on pro-ducers, van Senten and Engle (2017) demonstrated that 60% of the totalregulatory cost was the opportunity cost of lost or foregone sales. The dir-ect cost of regulations, as measured in the survey, is composed of the directcosts and fees of the permits and licenses. The costs of the permits andlicenses required for U.S. baitfish/sportfish was found to compose only 1%of the total regulatory cost. A similar finding, that the cost of permits andlicenses composed only a very small part of the total farm-level cost of reg-ulations, was previously reported by Hurley and Noel (2006) for Californiaagricultural producers.
Inefficiency function
In the inefficiency function, several regulatory variables significantly con-tributed to farm inefficiency, including: (1) the number of permit/licenserenewals each year; (2) manpower to comply with regulations; (3) changesdue to regulations; and (4) lost/foregone sales. The insurance variable,although not a regulatory variable, was also significant. Other regulatoryvariables such as the numbers of state and federal regulations, the numberof states shipped to, farm size, and fish health regulations were not foundto contribute significantly to farm efficiency.
AQUACULTURE ECONOMICS & MANAGEMENT 13
The positive coefficient for the “number of annual permit and licenserenewals” in the inefficiency equation, was significant. Survey respondentsreported a high number of annual renewals of permits and licenses. One-third of respondents reported between 10 and 203 annual renewals a year.While the majority of these permits and licenses (90%) were obtained fromstate agencies, approximately 33% of the state regulations had been developedto enforce federal statutes. Respondents reported being required to annuallyrenew multiple permits from multiple agencies, sometimes within the samestates, that request the same information. The significance of the number ofannual renewals indicates the complexity of the regulatory environment.Manpower spent to comply with regulations was also found to be a sig-
nificant determinant of inefficiency on farms. Thus, as more manpower wasused to comply with regulations, the technical efficiency of the farm wasreduced. This is likely a reflection of the fact that diverting manpowertowards regulatory compliance activities reduces the time available forproductivity-enhancing innovations or to develop new markets and resultsin a reduction in production output.Other studies have reported negative effects on U.S. aquaculture farms
that result from the time and manpower required to comply with the com-plexity created by the total set of regulations with which aquaculture busi-nesses contend (Engle & Stone, 2013; Kite-Powell et al., 2013). Often, it isthe farm owner or manager who must spend time to ensure that the busi-ness is fully compliant with provisions, monitoring, and compliance withall required permits and licenses. The overlapping and redundant nature ofmany of the state regulations faced by baitfish/sportfish producers in theU.S., who ship most of their product to other states, has been cited in exist-ing literature as a major part of the regulatory burden on aquaculture busi-nesses in the U.S. (Engle & Stone, 2013; Kite-Powell et al., 2013). Asrevealed by the data in this study, significant manpower is required at thefarm level to attend to these overlapping and redundant regulatory require-ments, which very often have different reporting formats and deadlines. Inother types of agriculture, labor productivity was found to be a significantdeterminant of technical efficiency, for example, in the Greek food and bev-erage market (Rezitis & Kalantzi, 2016). Hurley (2004) reported a 40%increase in manpower time spent by agricultural producers in California onregulatory compliance, with the manpower costs constituting the greatestcost of regulatory compliance. In the data used for the present baitfish andsportfish study, the cost of manpower to comply with regulations was only11% of the total regulatory cost (van Senten & Engle, 2017); but it wasnoted that this value was likely underestimated. Producer respondents inthe survey did not keep records of the time spent on every telephone callor contact to request application forms, to identify changes in regulations
14 J. V. SENTEN ET AL.
from the previous year, or in a number of cases, to identify the appropriateindividual in charge of the permit for that year.The variable “insurance” was also found to be a significant determinant
of inefficiency. The survey results documented relatively high costs associ-ated with a variety of insurance products on baitfish and sportfish farms,which is why insurance was included as a variable in the analysis eventhough it was not a regulatory cost, nor a requirement for producers.Insurance is a management option to reduce various types of financial risksin a farm business. The significance of insurance in the model likely reflectsattempts by farmers to manage the risk associated with baitfish and sport-fish businesses and may reflect a greater degree of risk associated with bait-fish/sportfish production as compared to foodfish production.Lost or foregone sales were significant but with a negative sign on the
coefficient. While a literal interpretation would indicate that lost salesincreased farm efficiency, the data show that a number of respondentsreported few or no foregone sales; moreover, farms reporting higher quanti-ties of foregone sales, were more efficient on average. It appears that farmsthat operated at high levels of technical efficiency also had better records,including those of sales that had been lost due to regulatory changes orincreased complexities. The importance of foregone sales as an unintendedconsequence of regulatory compliance requirements was also identified byDresdner and Estay (2016) in their assessment of potential effects on theChilean salmon industry of various biosecurity measures proposed inresponse to disease outbreaks. To avoid substantial foregone sales that wouldhave been based on production limits to Chilean salmon farms, Dresdnerand Estay (2016) proposed an approach that would result in estimates ofoptimal levels of biosecurity regulation, given both the need for disease con-trol and the need to avoid excessively costly levels of production limits thatwould restrict sales of salmon.The cost of changes on the farm due to regulations also had a negative
coefficient, implying that increased costs of the changes improved farm effi-ciencies. Farms that reported the highest costs for changes due to regulationswere also those that scored very high on estimated technical efficiency. Thosewere likely also the farms with more comprehensive records, and were thosethat were able to remain in business because they incurred the expense tocomply with regulatory changes. Those farms had a better understanding ofhow regulatory changes had resulted in infrastructure and managementchanges in their business and how this added additional costs. Managementchanges reported to comply with regulations tended to include hiring add-itional personnel for record-keeping and hiring additional drivers for morenumerous, smaller, but more expensive trucks. Such changes all increasedcosts, but larger farms that have stayed in business were those that made the
AQUACULTURE ECONOMICS & MANAGEMENT 15
changes. Smaller farms unable to make such changes likely exited the indus-try. van Senten and Engle (2017) showed that 23% of the total farm costs ofregulations were due to changes made to be in compliance.Farm size was not found to be significant in the inefficiency equation. In
other studies of the technical efficiency of aquaculture, farm size generallywas not found to explain economic efficiencies (Iliyasu et al., 2014). This wasalso true in analysis across counties in a specific country (Tan et al., 2011) oracross countries (Dey, Paraguas et al., 2005; Dey, Rab et al., 2005), althoughresults are variable. In U.S. baitfish/sportfish production, 29% of small-sizedfarms exited the industry between 2005 and 2013 (USDA, 2014). van Sentenand Engle (2017) attributed this decrease in part to the substantially greatercosts/ha imposed by regulations on smaller, as compared to larger, farms.Quantitative identification of regulatory variables that were significant
determinants of inefficiency, confirms that suggested by the descriptive datadiscussed by van Senten and Engle (2017) in their summary of regulatorycosts on U.S. producers of baitfish and sportfish. Nearly, one-third (30%) ofsurvey respondents indicated that their top challenges (first or second) wererelated to issues related to regulatory compliance. The current study affirmsthat several components of regulatory compliance have increased farm-levelinefficiencies for U.S. baitfish and sportfish producers.The problem that has emerged over the years is not necessarily the laws
and regulations themselves, but how the permits are written and enforced.Osmundsen et al., (2017) referred to the dynamic nature of aquaculturetechnologies that poses problems for regulators who frequently have littleformal training in aquaculture nor the means to remain current with itsrapidly evolving technologies and management practices. Osmundsen et al.,(2017) called for a more adaptive regulatory system that would avoidrestricting new productivity-enhancing technologies on aquaculture farms.Abate, Nielsen and Nielsen (2018) discussed the effects of inter-agencyrivalry, ideological perspectives of regulatory personnel, and the subsequenteffects on the regulatory environment for industries such as aquaculture.Further analysis investigating effects of regulatory variables on technical
efficiency revealed that decreasing the number of permits/licenses wouldresult in an increase in efficiency on farms (Table 5). Similarly, a decreasein the cost of manpower for compliance would result in increased effi-ciency, providing further evidence for the idea that the diversion of man-power to compliance tasks has a negative effect on production.
Conclusions
Regulatory variables in the inefficiency function were found to be signifi-cant determinants of farm inefficiency on U.S. baitfish/sportfish farms,
16 J. V. SENTEN ET AL.
affirming that the U.S. regulatory environment has affected the competitive-ness of baitfish and sportfish producers by reducing farm-level efficiency.The significant effect of variables such as the number of annual permit/license renewals and manpower to comply with regulations demonstratesthat the time farmers spend attempting to navigate a complex and convo-luted business environment takes time away from productivity-enhancinginnovations and new market development. The farmers who participated inthe study did not argue that there should be no regulations; in fact, severalpointed out the need for regulations to maintain and protect the socialquality of life they desire and the natural systems they not only rely on, butpersonally value and enjoy. However, this study, combined with thedescriptive results reported by van Senten and Engle (2017) point to a regu-latory environment that is characterized by redundancy across agencies andin reporting of compliance. The determinants of inefficiency identified inthis analysis demonstrate the excessive time burden on family businesseswhose owners are attempting to comply with the law, and, as a result, areoperating less efficiently than possible.There clearly is a strong need to identify effective and practical ways to
streamline monitoring and compliance reporting activities across local,state, and federal agencies to reduce the time burden and inefficiencies thatare introduced at the farm level and for prompt notification to farmers ofdeadlines for renewals and of changes in the regulatory requirements. Thisstudy demonstrates that the time burden resulting from compliance activ-ities for producers is significant and that poor communication between andfrom agencies results in additional, sometimes unexpected, costs at thefarm level. Specifically, it identifies areas of indirect regulatory cost thathave had a negative effect on farm technical efficiency. Study findings sug-gest that reducing the time burden at the farm level, resulting from
Table 5. Sensitivity of technical efficiency score to the changes in number of per-mits and manpower costs.Variable (X) X level Decrease in X U TE
�Represents reduction in absolute values of manpower cost.
AQUACULTURE ECONOMICS & MANAGEMENT 17
frequent permit and license renewals and duplicative reporting require-ments, as well as reducing unexpected changes at the farm level, resultingfrom poor communication and poorly accessible information, couldimprove farm efficiency. One possible solution would be for policy makersto work closely with industry to understand how some regulations result inunintended consequences at the farm level. Improved communication andinformation sharing between agencies may also help to reduce the man-power required for reporting compliance at the farm level. Likewise, devel-opment of uniform reporting standards and forms, and easily accessibleinformation regarding regulations and compliance requirements could alsoaid in reducing the time burden for producers. In the end, both regulatorsand producers share the common goal of achieving compliance; workingtogether to identify solutions that are feasible, satisfy both sets of needs,and reduce complexity benefits all parties involved.
Acknowledgements
The authors thank all those who contributed to the planning, implementation, and comple-tion of this project; especially to the producers of baitfish and sportfish who participatedand trusted us to maintain the confidentiality of their data. We would also like to thank allof the extension specialists, state aquaculture coordinators, and state agencies who contrib-uted in developing the lists of baitfish and sportfish farms for the 13 study states.
Funding
This study was funded, in part by USDA, APHIS [Cooperative Agreement Award No.14-9200-0403-CA].
ORCID
Jonathan Van Senten http://orcid.org/0000-0002-3513-7600
References
Abate, T. G., Nielsen, R., & Tveterås, R. (2016). Stringency of environmental regulation andaquaculture growth: A cross-country analysis. Aquaculture Economics and Management,20, 201–221. doi:10.1080/13657305.2016.1156191
Abate, T., Nielsen, R., & Nielsen, M. (2018). Agency rivalry in a shared regulatory space andits impact on social welfare: the case of aquaculture regulation. Aquaculture Economicsand Management, 22, 27–48. http://dx.doi.org/10.1080/13657305.2017.1334243.
Aigner, D. J., Lovell, C. A. K., & Schmidt, P. (1977). and estimation of stochastic frontierproduction function models. Journal of Econometrics, 6, 21–38. doi:10.1016/0304-4076(77)90052-5
Arita, S., & Leung, P.-S. (2014). A technical efficiency analysis of Hawaii’s aquacultureindustry. Journal of the World Aquaculture Society, 45, 312–321. doi:10.1111/jwas.12124
Asche, F., & Roll, K. (2013). Determinants of inefficiency in Norwegian salmon aquaculture.Aquaculture Economics & Management, 17, 300–321. doi:10.1080/13657305.2013.812154
Battese, G. E., & Coelli, T. J. (1995). A model for technical efficiency effects in a stochasticfrontier production function for panel data. Empirical Economics, 20, 325–332.doi:10.1007/BF01205442
Broughton, E. I., & Walker, D. G. (2010). Policies and practices for aquaculture food safetyin China. Food Policy, 35, 471–478. http://www.sciencedirect.com/science/article/pii/S0306919210000606.
Brunson, M., Hargreaves, J., & Stone, N. (2000). Fertilization of fish ponds. In R. R.Stickney (Ed.), Encyclopedia of Aquaculture (pp. 360–363). Chichester, UK: John Wiley &Sons, Inc.
Coelli, T., Rao, D. S. P., O’Donnell, C. J., & Battese, G. E. (2005). An introduction to effi-ciency and productivity analysis. New York: Springer-Verlag.
Coelli, T. J. (2011). A guide to FRONTIER Version 4.1: a computer program for stochasticfrontier production and cost function estimation. Centre for Efficiency and ProductivityAnalysis Working Papers. No. 7/96. Armidale, Australia: The University of New England.
Crews, C. W. (2017). Ten thousand commandments: An annual snapshot of the federal regu-latory state. Washington, DC: Competitive Enterprise Institute.
Dey, M. M., Paraguas, F. J., Srichantuk, N., Xinhua, Y., Bhatta, R., & Thi, C. D. L. (2005).Technical efficiency of freshwater pond polyculture production in selected Asian coun-tries: Estimation and implication. Aquaculture Economics and Management, 9, 39–63.doi:10.1080/13657300590961528
Dey, M. M., Rab, M., Paraguas, F. J., Piumsombun, S., Bhatta, R., Alam, M. F., …Ahmed, M. (2005). Status and economics of freshwater aquaculture in selected countriesin Asia. Aquaculture Economics and Management, 9, 11–38. doi:10.1080/13657300590961609
Dresdner, J., & Estay, M. (2016). Biosecurity versus profits: a multiobjective model for theaquaculture industry. Journal of the World Aquaculture Society, 47, 61–73. doi:10.1111/jwas.12256
Engle, C. R. (2010). Aquaculture Economics and Financing: Management and Analysis.Ames, Iowa: Blackwell Scientific.
Engle, C. R. (2016). Sustainable growth of aquaculture: the need for research to evaluate theimpacts of regulatory frameworks. Journal of the World Aquaculture Society, 47, 461–463.doi:10.1111/jwas.12340
Engle, C. R., & Stone, N. (2013). Competitiveness of U.S. aquaculture within the currentU.S. regulatory framework. Aquaculture Economics and Management, 17, 251–280.doi:10.1080/13657305.2013.812158
Fengxia, D., Hennessy, D. A., Jensen, H. H., & Volpe, R. J. (2016). Technical efficiency, herdsize, and exit intentions in U.S. dairy farms. Agricultural Economics: The Journal of theInternational Association of Agricultural Economists, 47, 533–545. doi:10.1111/agec.12253
Grieco, P. L. E., Li, S., & Zhang, H. (2016). Production function estimation with unobservedinput price dispersion. International Economic Review. 57, (2), 665–690. Retrieved fromhttps://onlinelibrary.wiley.com/doi/abs/10.1111/iere.12172, May, 2016.
Hassan, S., & Ahmad, B. (2005). Stochastic frontier production function, application andhypothesis testing. International Journal of Agriculture and Biology, 7 (3), 427–430.
Hurley, S. P. (2004). A cross comparison between California and its domestic and inter-national competitors with respect to key labor issues. (Report). San Luis Obispo,California: California Polytechnic State University, Retrieved from http://digitalcommons.calpoly.edu/cgi/viewcontent.cgi?article=1061&context=agb_fac, January, 2016.
Hurley, S. P., & Noel, J. (2006). An estimation of the regulatory cost on California agricul-tural producers. (Report). Long Beach, California: American Agricultural EconomicsAssociation. Retrieved from http://digitalcommons.calpoly.edu/cgi/viewcontent.cgi?arti-cle=1045&context=agb_fac, January, 2016.
Iliyasu, A., Mohamed, Z. A., Ismail, M. M., Abdullah, A. M., Kamarudin, S. M., & Mazuki,H. (2014). A review of production frontier research in aquaculture (2001–2011).Aquaculture Economics & Management, 18, 221–247. doi:10.1080/13657305.2014.926464
Iliyasu, A., & Mohamed, Z. A. (2015). Technical efficiency of tank culture systems in penin-sular Malaysia: an application of data envelopment analysis. Aquaculture Economics andManagement, 19, 372–386. doi:10.1080/13657305.2015.1082118
Jones, S., Stone, N., Kelly, A., Selden, G., Timmons, B., Whisenhunt, J., & Oliver, M.(2016). Farm pond management for recreational fishing. MP360, Cooperative ExtensionProgram, University of Arkansas at Pine Bluff, Pine Bluff, Arkansas.
Kite-Powell, H., Rubino, M. C., & Morehead, B. (2013). The future of US seafood supply.Aquaculture Economics and Management, 17, 228–250. doi:10.1080/13657305.2013.812691
Knapp, G., & Rubino, M. C. (2016). The political economics of marine aquaculture in theUnited States. Reviews in Fisheries Science and Aquaculture, 24, 213–229. doi:10.1080/23308249.2015.1121202
Kodde, D. A., & Palm, F. C. (1986). Wald criteria for jointly testing equality and inequalityrestrictions. Econometrica, 54, 1243–1248. doi:10.2307/1912331
Lacewell, R. D., Nichols, J. P., & Jambers, T. H. Jr. (1973). An analysis of pond raised cat-fish production in Texas. Southern Journal of Agricultural Economics, 5, 141–145.doi:10.1017/S0081305200010943
Lakner, S., Brenes-Mu~noz, T., & Br€ummer, B. (2017). Technical efficiency in Chileanagribusiness industry: a meta-frontier approach. Agribusiness: An International Journal,33, (3), 302–323. doi:10.1002/agr.21493.
Litwin, M. S. (1995). How to measure survey reliability and validity. Thousand Oaks,California: Sage.
Losinger, W., Dasgupta, S., Engle, C., & Wagner, B. (2007). Economic interactions betweenfeeding rates and stocking densities in intensive catfish Ictalurus punctatus production.Journal of the World Aquaculture Society, 31, 491–502. doi:10.1111/j.1749-7345.2000.tb00901.x
Mekonnen, D. K., Spielman, D. J., Fonsah, E. G., & Dorfman, J. H. (2015). Innovation sys-tems and technical efficiency in developing-country agriculture. Agricultural Economics:The Journal of the International Association of Agricultural Economists, 46, 689–702.doi:10.1111/agec.12164
Mujeeb Rahiman, K. M., Mohamed Hatha, A. A., Gnana Selvam, A. D., & Thomas, A. P.(2016). Relative prevalence of antibiotic resistance among heterotrophic bacteriafrom natural and culture environments of freshwater prawn, MacrobrachiumRosenbergii. Journal of the World Aquaculture Society, 47, 470–463. doi:10.1111/jwas.12287.
Murova, O., & Chidmi, B. (2013). Technical efficiency of US dairy farms and federal gov-ernment programs. Applied Economics, 45, 839–847. doi:10.1080/00036846.2011.613772
Nerrie, B. L., Hatch, L. U., Engle, C. R., & Smitherman, R. O. (1990). The economics ofintensifying catfish production: a production function analysis. Journal of the WorldAquaculture Society, 21, 216–224. doi:10.1111/j.1749-7345.1990.tb01026.x
Osmundsen, T. C., Almklov, P., & Tveterås, R. (2017). Fish farmers and regulators copingwith the wickedness of aquaculture. Aquaculture Economics and Management, 21,163–183. doi:10.1080/13657305.2017.1262476
Paul, C. J. M., Johnston, W. E., & Frengley, G. A. G. (2000). Efficiency in New Zealandsheep and beef farming: the impacts of regulatory reform. The Review of Economics andStatistics, 82, 325–337. doi:10.1162/003465300558713
Paul, C., Nehring, R., Banker, D., & Somwaru, A. (2004). Scale economies and efficiency inU.S. agriculture: are traditional farms history? Journal of Productivity Analysis, 22,185–205. doi:10.1007/s11123-004-7573-1
Porter, M. E., & van der Linde, C. (1995). Green and competitive. Harvard Business Review.September–October 1995, 120–134. Retrieved from https://hbr.org/1995/09/green-and-competitive-ending-the-stalemate
Rahman, K. M. M., Hatha, A. A. M., Selvam, A. D. G. & Thomas, A. P. (2016). Relativeprevalence of antibiotic resistance among heterotrophic bacteria from natural and cultureenvironments of freshwater prawn, Macrobrachium Rosenbergii. Journal of the WorldAquaculture Society, 47, 470–480.
Rezitis, A. N., & Kalantzi, M. A. (2016). Investigating technical efficiency and its determi-nants by data envelopment analysis: an application in the Greek food and beveragesmanufacturing industry. Agribusiness: An International Journal, 32, 254–271. doi:10.1002/agr.21432
Rico, A., Satapornvanit, K., Haque, M. M., Min, J., Nguyen, P. T., Telfer, T. C., &van den Brink, P. J. (2012). Use of chemicals and biological products in Asian aquacul-ture and their potential environmental risks: a critical review. Reviews in Aquaculture, 4,75–93. doi:10.1111/j.1753-5131.2012.01062.x
Rico, A., Phu, T. M., Satapornvanit, K., Min, J., Shahabuddin, A. M., Henriksson, P. J. G.,… Van den Brink, P. U. (2013). Use of veterinary medicines, feed additives and probiot-ics in four major internationally traded aquaculture species farmed in Asia. Aquaculture,412–413, 231–243. doi:10.1016/j.aquaculture.2013.07.028
Sandvold, H. N. (2016). Technical inefficiency, cost frontiers and learning-by-doing inNorwegian farming of juvenile salmonids. Aquaculture Economics and Management, 20,382–398. doi:10.1080/13657305.2016.1224659
Sauer, J., Gorton, M., & Davidova, S. (2015). Migration and farm technical efficiency: evi-dence from Kosovo. Agricultural Economics: The Journal of the International Associationof Agricultural Economists, 46, 629–641. doi:10.1111/agec.12159
StataCorp (2009). Stata Statistical Software: Release 11. College Station, TX: StataCorp. LP.Stone, N. M., Kelly, A. M., & Roy, L. A. (2016). A fish of weedy waters: Golden shiner biol-
ogy and culture. Journal of the World Aquaculture Society, 47, 152–2000. doi: 10.1111/jwas.12269.
Stone, N. M., & Thomforde, H. (2001). Common farm-raised baitfish. Southern RegionalAquaculture Center. SRAC 120. Retrieved from http://www.srac.tamu/edu/serveFactSheet/7
Tan, R. I., Garcia, Y. T., Dator, M. L., Tan, I. M. A., & Permsl, D. E. (2011). Technical effi-ciency of Genetically Improved Farmed Tilapia (GIFT) cage culture operations in thelakes of Laguna and Batangas, Philippines. Journal of the International Society ofSoutheast Asian Agricultural Sciences, 17 (1), 194–207.
Thunberg, E. M., Adams, C. M., & Cichra, C. E. (1994). Economic, regulatory, and techno-logical barriers to entry into the Florida aquaculture industry. Journal of AppliedAquaculture, 4, 3–14. doi:10.1300/J028v04n02_02
USDA (2014). Census of Aquaculture (2012). Retrieved from https://www.agcensus.usda.gov/Publications/2012/Online_Resources/Aquaculture/aquacen.pdf, December, 2015.
van der Vlist, A. J., Withagen, C., & Folmer, H. (2007). Technical efficiency under alterna-tive environmental regulatory regimes: the case of Dutch horticulture. EcologicalEconomics, 63, 165–173. doi:10.1016/j.ecolecon.2006.10.013
van Senten, J., & Engle, C. R. (2017). The cost of regulations on U.S. baitfish and sportfishproducers. Journal of the World Aquaculture Society, 48, 503. doi:10.1111/jwas.12416.
Yang, C. C., Hsiao, C. K., & Yu, M. M. (2008). Technical efficiency and impact of environ-mental regulations in farrow-to-finish swine production in Taiwan. AgriculturalEconomics: The Journal of the International Association of Agricultural Economists, 39,51–61. doi:10.1111/j.1574-0862.2008.00314.x