Effects of relative hardness and moisture on tool wear in soil excavation operations Mohsen Mosleh a,* , Ehsan A. Gharahbagh b , Jamal Rostami b a Howard University, Washington, DC 20059, United States b Pennsylvania State University, University Park, PA 16802, United States article info Article history: Received 16 August 2012 Received in revised form 25 October 2012 Accepted 10 November 2012 Available online 7 December 2012 Keywords: Tool wear Soil excavation Moisture content Hardness ratio abstract This paper presents an experimental study of tool wear using a laboratory tester which simulates the operating conditions of cutting tools in soil excavation operations. The testing is performed in a test chamber that allows high contact stress between soil and cutting tools. The test conditions mimic the condition of pressurized face shield machines used in soft ground tunneling, where the impact of wear is costly and crucial. Various tool to soil hardness ratios were obtained by changing both the tool material and the percentage of soil’s constituent minerals, i.e. quartzetic and limestone grains. In dry soil conditions, when the tool wear is plotted against the relative hardness, an inverted S band bounded by curves of highest and lowest tool hardness is formed. As hardness of cutting tools in actual soil excavation applications, including soft ground tunneling, lies in a narrow range, the expected S band becomes thinner which better helps in the design and selection of the cutting tools and materials used for inner components of these machines which come to contact with soil during the operation. The results of testing on this tester also show that as the moisture content of the soil increases to 10%, the tool wear drastically increases. The trend is reversed as the moisture content further increases and reaches full stauration of soil where the tool wear is smaller than that experinced in the dry soil. & 2012 Elsevier B.V. All rights reserved. 1. Introduction Developing a predictive model for tool wear for earth works and excavation of soil, and in particular in soft ground tunneling where replacement of tools and various machine components impacts the cost and schedule of the project, is essential. Such a model can be used during the planning and operation phases of excavation to provide a realistic estimate of the wear on the equipment. The issues of soil abrasivity and wear of the cutting tools as well as the secondary wear on the other components of machines have gained much attention in recent years due to large scale of the tunneling projects where machines with diameters up to 20 m are used for tunneling in soil. These large machines operate under static groundwater pressures of up to 0.8 MPa and there- fore the change of cutting tools or repair to the machine structure within the cutting chamber has to be done under compressed air. The repair works are referred to as hyperbaric interventions and are time consuming, costly, and dangerous procedures. During these interventions, divers access the face of the tunnels through a man lock and can work for only limited working hours under high pressure where they are exposed to the partially supported ground. Thus, it is very important for the tunneling industry to evaluate the abrasiveness of the soil in advance, estimate the tool life and thus predict the number of required interventions. Soil excavation is a common task in many civil, mining and agricultural activities and the tool wear is a part of the daily operation. Therefore, it is beneficial to understand the wear mechanism and means of reducing wear and extending the tool life. The evaluation of soil abrasion has typically been limited to study of soil mineralogy and Moh’s hardness. This approach falls short of providing a reasonable basis for evaluation of soil abrasivity and tool wear since it fails to account for many of the parameters that reflect the real life application of excavation tools such as moisture content in soil, grain size distribution, grain shape, and material properties. While there are well established, widely accepted test meth- ods such as the Cerchar, NTNU Abrasion Value (AV and AVS) and LCPC tests [1–4] to assess the abrasiveness of rock which correlates to the tool wear in rock excavation, the study of abrasiveness of soil or soft ground and its effect on tool wear models is relatively new. A recently developed method is the Soil Abrasivity Test (SAT) which utilizes sieved soil samples in a pin- on-disc type setup for measuring the weight loss of selected steel pins [4]. The dried, sieved soil sample is poured on the track that leads to the contact between a cylindrical pin and the rotating Contents lists available at SciVerse ScienceDirect journal homepage: www.elsevier.com/locate/wear Wear 0043-1648/$ - see front matter & 2012 Elsevier B.V. All rights reserved. http://dx.doi.org/10.1016/j.wear.2012.11.041 n Corresponding author. Tel.: þ 202 806 6622; fax: þ 202 453 1396. E-mail address: [email protected] (M. Mosleh). Wear 302 (2013) 1555–1559
Transcript
Wear 302 (2013) 1555–1559
Contents lists available at SciVerse ScienceDirect
Wear
0043-16
http://d
n Corr
E-m
journal homepage: www.elsevier.com/locate/wear
Effects of relative hardness and moisture on tool wear in soilexcavation operations
Mohsen Mosleh a,*, Ehsan A. Gharahbagh b, Jamal Rostami b
a Howard University, Washington, DC 20059, United Statesb Pennsylvania State University, University Park, PA 16802, United States
a r t i c l e i n f o
Article history:
Received 16 August 2012
Received in revised form
25 October 2012
Accepted 10 November 2012Available online 7 December 2012
This paper presents an experimental study of tool wear using a laboratory tester which simulates the
operating conditions of cutting tools in soil excavation operations. The testing is performed in a test
chamber that allows high contact stress between soil and cutting tools. The test conditions mimic the
condition of pressurized face shield machines used in soft ground tunneling, where the impact of wear
is costly and crucial. Various tool to soil hardness ratios were obtained by changing both the tool
material and the percentage of soil’s constituent minerals, i.e. quartzetic and limestone grains. In dry
soil conditions, when the tool wear is plotted against the relative hardness, an inverted S band bounded
by curves of highest and lowest tool hardness is formed. As hardness of cutting tools in actual soil
excavation applications, including soft ground tunneling, lies in a narrow range, the expected S band
becomes thinner which better helps in the design and selection of the cutting tools and materials used
for inner components of these machines which come to contact with soil during the operation.
The results of testing on this tester also show that as the moisture content of the soil increases to 10%,
the tool wear drastically increases. The trend is reversed as the moisture content further increases
and reaches full stauration of soil where the tool wear is smaller than that experinced in the dry soil.
& 2012 Elsevier B.V. All rights reserved.
1. Introduction
Developing a predictive model for tool wear for earth worksand excavation of soil, and in particular in soft ground tunnelingwhere replacement of tools and various machine componentsimpacts the cost and schedule of the project, is essential. Such amodel can be used during the planning and operation phases ofexcavation to provide a realistic estimate of the wear on theequipment.
The issues of soil abrasivity and wear of the cutting tools aswell as the secondary wear on the other components of machineshave gained much attention in recent years due to large scale ofthe tunneling projects where machines with diameters up to20 m are used for tunneling in soil. These large machines operateunder static groundwater pressures of up to 0.8 MPa and there-fore the change of cutting tools or repair to the machine structurewithin the cutting chamber has to be done under compressed air.The repair works are referred to as hyperbaric interventions andare time consuming, costly, and dangerous procedures. Duringthese interventions, divers access the face of the tunnels througha man lock and can work for only limited working hours under
ll rights reserved.
þ 202 453 1396.
h).
high pressure where they are exposed to the partially supportedground. Thus, it is very important for the tunneling industry toevaluate the abrasiveness of the soil in advance, estimate the toollife and thus predict the number of required interventions.
Soil excavation is a common task in many civil, mining andagricultural activities and the tool wear is a part of the dailyoperation. Therefore, it is beneficial to understand the wearmechanism and means of reducing wear and extending the toollife. The evaluation of soil abrasion has typically been limited tostudy of soil mineralogy and Moh’s hardness. This approach fallsshort of providing a reasonable basis for evaluation of soilabrasivity and tool wear since it fails to account for many of theparameters that reflect the real life application of excavation toolssuch as moisture content in soil, grain size distribution, grainshape, and material properties.
While there are well established, widely accepted test meth-ods such as the Cerchar, NTNU Abrasion Value (AV and AVS) andLCPC tests [1–4] to assess the abrasiveness of rock whichcorrelates to the tool wear in rock excavation, the study ofabrasiveness of soil or soft ground and its effect on tool wearmodels is relatively new. A recently developed method is the SoilAbrasivity Test (SAT) which utilizes sieved soil samples in a pin-on-disc type setup for measuring the weight loss of selected steelpins [4]. The dried, sieved soil sample is poured on the track thatleads to the contact between a cylindrical pin and the rotating
steel disc. The wear mass of selected pin materials after 100revolutions is a measure of the abrasivity of the soil. The test doesnot consider the moisture and grain size effects because the soilsamples are dried and grains larger than 4 mm are sieved out ofthe test mixture.
A shortcoming of the SAT method is that the tool wearmechanism according to the test is three-body abrasion. Due tothe nature of the pin-on-disk setup which creates unconstrainedcontact geometry, the abrasive grains in soil entering the contactcan roll or slide against the pin or the disk and exit the contactarea. It is only sliding against the pin that will induce wear on thetool. On the other hand, the actual tool wear mechanism duringthe soft ground tunneling is a combination of two-body andthree-body abrasion wear. Since the typical wear rate in two-body abrasion is much higher than that of three-body abrasion[5], the SAT method is expected to underestimate the tool wear insoft ground tunneling. In order to create a closer to in-situconditions in soft ground tunneling, a procedure for determiningthe Soil Abrasivity Index (SAI) method has been proposed [6]. Themethod utilized a contact geometry in which a thick layer of soilis entrapped and compacted under the tool and therefore createsa two-body abrasion wear mechanism on the tool. The dimen-sionless SAI value was then calculated by normalizing themeasured wear mass of the tool against the test parameters suchas load and sliding distance and material properties such ashardness so that it lies within an arbitrary range.
In this paper, the SAI procedure is followed to study the effectof tool to soil mixture hardness ratio and the influence ofmoisture content of the soil on the tool wear. However, only thewear data directly measured in testing is presented without therequired normalization for obtaining the SAI values. The overallmechanical properties, including the hardness of mixtures andcomposites with homogeneously distributed particles, have beenrelated to their constituents’ properties through different models,including self-consistent variation method, shear-lag theory,finite element method (FEM), and self-consistent variation meth-ods [7–9]. A simple and intuitive method for estimation of theeffective hardness in terms of constituents is the rule of mixtures(ROM). In utilizing the ROM approach, both the equal strain (iso-strain) and the equal stress (iso-stress) assumptions have beenwidely considered. However, for mixtures with a high volumefraction of the hard particle, it has been suggested that the iso-strain assumption which predicts an upper bound for the hard-ness value yields more accurate results [10].
2. Material and methods
2.1. Soil abrasivity tester
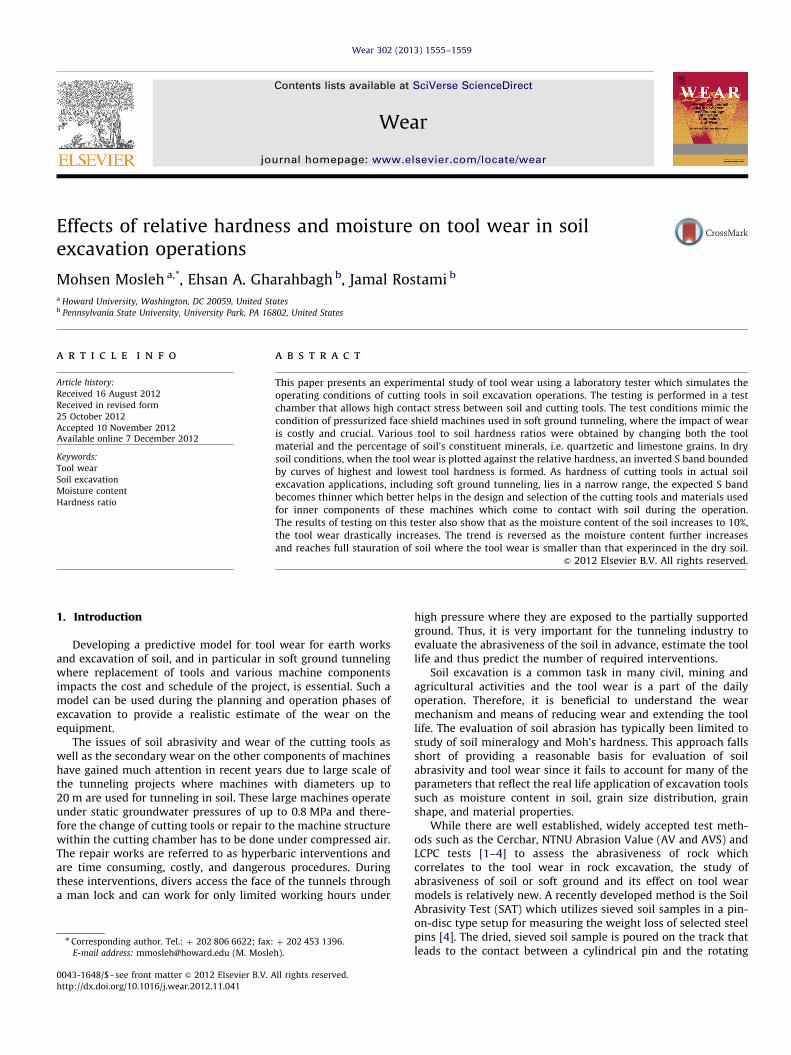
The main part of the abrasivity tester is a cylindrical chamber,shown in Fig. 1a, where the soil can be loaded without anymodification or changes to its nature and grain size distribution.The diameter and length of the chamber are 350 mm and450 mm, respectively. The unit is mounted on a 5-hp drill press(Fig. 1b) which delivers the rotational torque at a rotational speedof 60–180 rpm to the drive unit which in turn transfers themotion to the propeller through a solid shaft. The chamber ispartially filled with soil samples to the height of 300 mm and apropeller with three blades is lowered into the chamber. The finalposition of the propeller during the test is approximately in themiddle of the soil column with 150 mm soil above and below thepropeller blades. The wear specimen is a cover that is mounted oneach blade as shown in Fig. 1c and d. The terms ‘‘blade cover’’ and‘‘tool’’ are interchangeably used in the paper. Different pitchangles of the blades were examined in pilot tests, but blade
covers with a pitch angle of 101 exhibited large enough wear massfor accurate measurement [6]. A power transducer was calibratedto measure the supplied torque using the motor performanceinput voltage and amperage draw at any given moment. Theestimated torque is based on motor power–amp charts andconversion of the rpm, considering a reasonable mechanicalefficiency factor for the gearbox.
2.2. Materials and specimens
Soil samples tested consisted of predetermined mixtures oflimestone and quartzetic sand at various proportions whoseproperties are given in Table 1. The grain size distributions ofthe samples were obtained by sieve analysis, and the mineralcomposition was determined by X-ray diffraction (XRD). Thefriction angles were determined according to ASTM D 3080–04standard. The blade covers were made of AISI 4130 steel alloy(17 HRC) whose hardness was changed by gas carburization to 31,43, 51, and 60 HRC.
2.3. Test method
The soil samples were tested either in the dry state or atpredetermined moisture content levels. The mixtures were initi-ally dried in air and then either placed in the chamber for drytests or brought to the selected water content by mixing thor-oughly with the proper amount of water to reach desiredmoisture content prior to the test.
The blade covers were weighed before and after each testusing a precision balance and the weight loss was calculated. Thepropeller which is attached to the bearing assembly, the maindrive shaft and lid is then lowered within the soil sample byreverse rotation (CCW) until the blades reached the level of150 mm above the bottom of the chamber and the lid touchesthe upper flange. The upper lid is then bolted on the flange to sealthe chamber using a set of 12 bolts. In order to assess whether thegrain size of soil mixtures changes as a result of the tests, thegrain size distribution and sphericity of selected mixtures weremeasured. It was found that the maximum changes in grain sizeand sphericity in our tests were bounded by 20% and 10%,respectively. Therefore, the tests did not change the abrasivenature of the soil samples. The test was conducted at certain timeintervals for a total duration of 1 h for dry and saturated soilsamples and 10 min in wet sand due to aggressive wear of thecover plates and exposure of the propeller structure. The spindle’srotational speed was 60 rpm.
3. Results
The supplied torque to the propeller was 0.2 kN -m and0.15 kN -m in dry and wet tests, respectively. In situations wherethe supplied torque to overcome the friction between the bladeand the soil mixture was slightly different, the wear data wasnormalized relative to the measured torque. The variation in thetorque was less than 20% in abrasion tests.
The hardness of soil mixtures was calculated based on theVickers Hardness numbers of the constituent mineral grains givenin Table 1. The mixtures’ hardness was then converted to theRockwell C (HRC) scale. The hardness ratios were obtained bydividing the measured hardness of the cover by the HRC of thesoil mixture.
Fig. 1. Schematic of the soil abrasivity test chamber (a), PennState Soil Abrasion Testing Device (b), propeller with covers (c), and the installation arrangement for the cover
on the propeller (d).
M. Mosleh et al. / Wear 302 (2013) 1555–1559 1557
3.1. Tool wear and hardness ratio
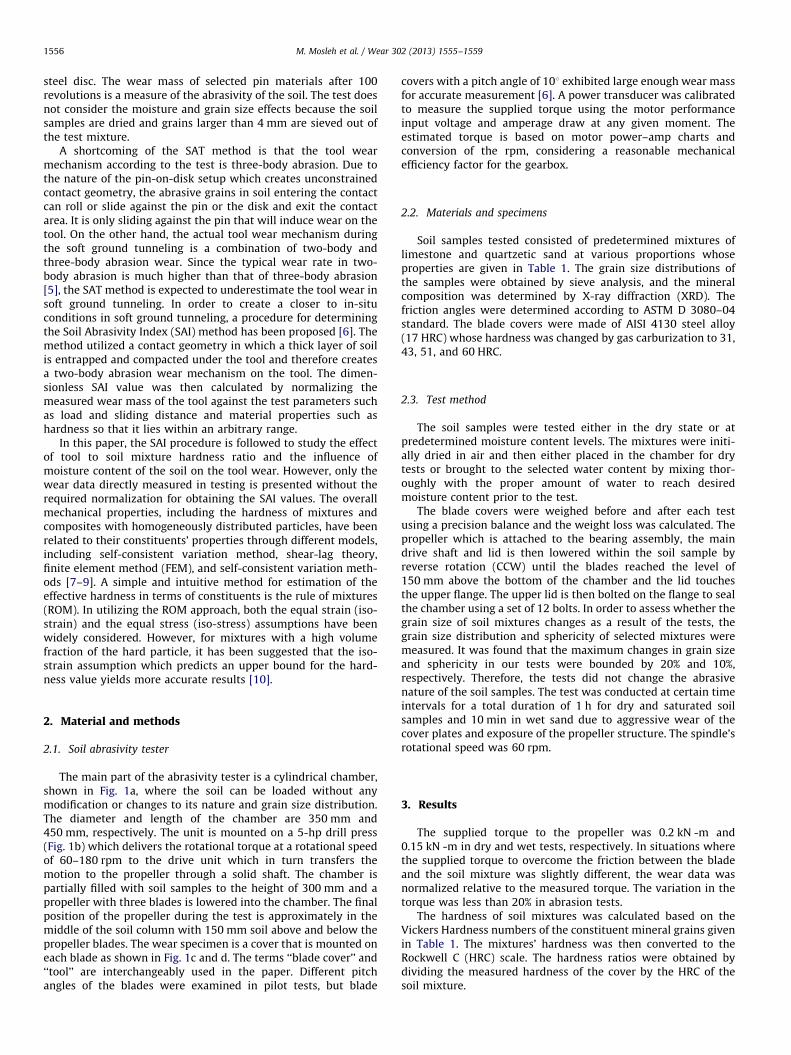
Different tool to soil hardness ratios ranging from 0.2 to 2.5 wereobtained by both changing the percentages of soil constituents, i.e.quartzetic and limestone sand, and by utilizing blade covers ofdifferent hardnesses. The wear mass data shown in Fig. 2 forms an
inverted S band bounded by curves of highest and lowest toolharnesses. As the tool hardness increases, the wear curve shifts lowerand to the right. This is consistent with the fact that a harder tool canbe abraded by a harder soil mixture. Also, the transition from a highto a low tool wear rate occurs at higher hardness ratios forharder tools.
Fig. 2. Wear of blade covers of different hardnesses against the hardness ratio.
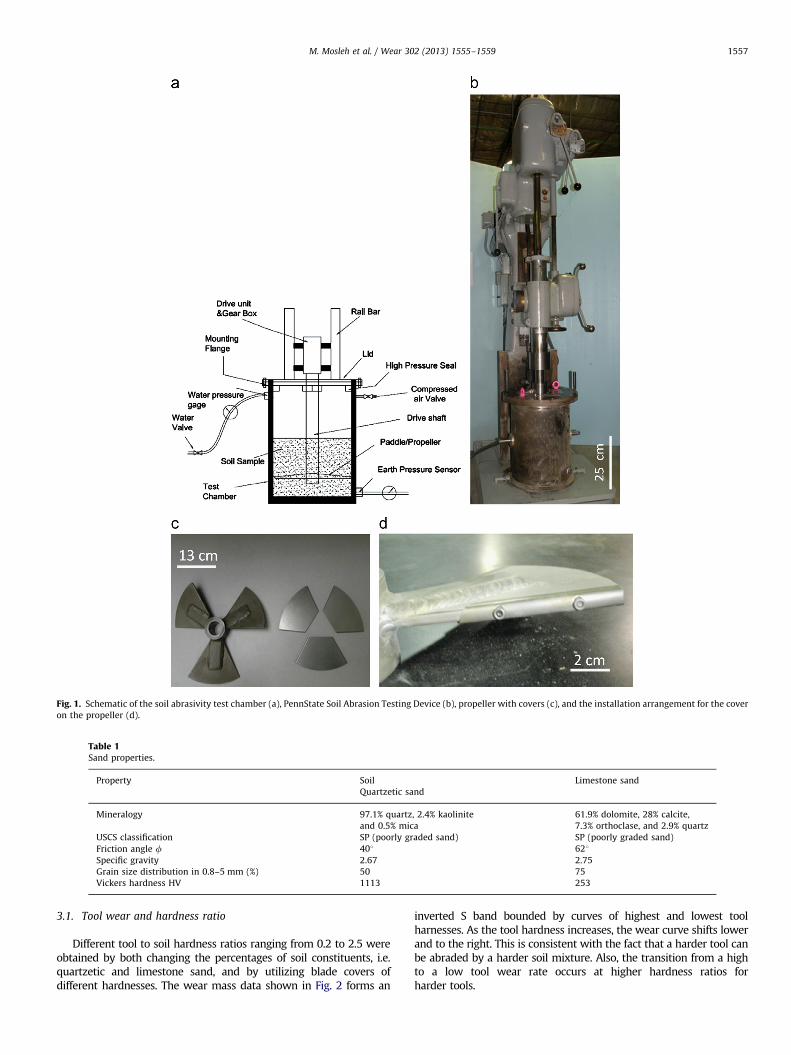
Fig. 3. Tool wear against water content of the quartzetic sand after 5 min of
abrasion testing.
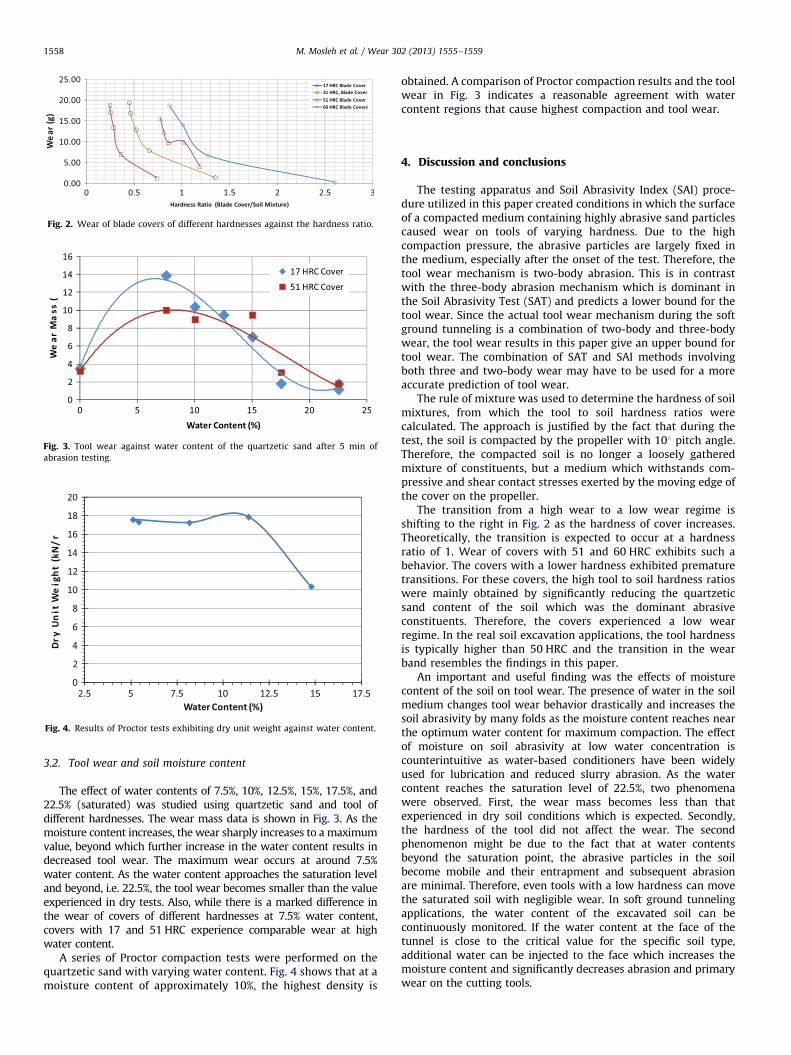
Fig. 4. Results of Proctor tests exhibiting dry unit weight against water content.
M. Mosleh et al. / Wear 302 (2013) 1555–15591558
3.2. Tool wear and soil moisture content
The effect of water contents of 7.5%, 10%, 12.5%, 15%, 17.5%, and22.5% (saturated) was studied using quartzetic sand and tool ofdifferent hardnesses. The wear mass data is shown in Fig. 3. As themoisture content increases, the wear sharply increases to a maximumvalue, beyond which further increase in the water content results indecreased tool wear. The maximum wear occurs at around 7.5%water content. As the water content approaches the saturation leveland beyond, i.e. 22.5%, the tool wear becomes smaller than the valueexperienced in dry tests. Also, while there is a marked difference inthe wear of covers of different hardnesses at 7.5% water content,covers with 17 and 51 HRC experience comparable wear at highwater content.
A series of Proctor compaction tests were performed on thequartzetic sand with varying water content. Fig. 4 shows that at amoisture content of approximately 10%, the highest density is
obtained. A comparison of Proctor compaction results and the toolwear in Fig. 3 indicates a reasonable agreement with watercontent regions that cause highest compaction and tool wear.
4. Discussion and conclusions
The testing apparatus and Soil Abrasivity Index (SAI) proce-dure utilized in this paper created conditions in which the surfaceof a compacted medium containing highly abrasive sand particlescaused wear on tools of varying hardness. Due to the highcompaction pressure, the abrasive particles are largely fixed inthe medium, especially after the onset of the test. Therefore, thetool wear mechanism is two-body abrasion. This is in contrastwith the three-body abrasion mechanism which is dominant inthe Soil Abrasivity Test (SAT) and predicts a lower bound for thetool wear. Since the actual tool wear mechanism during the softground tunneling is a combination of two-body and three-bodywear, the tool wear results in this paper give an upper bound fortool wear. The combination of SAT and SAI methods involvingboth three and two-body wear may have to be used for a moreaccurate prediction of tool wear.
The rule of mixture was used to determine the hardness of soilmixtures, from which the tool to soil hardness ratios werecalculated. The approach is justified by the fact that during thetest, the soil is compacted by the propeller with 101 pitch angle.Therefore, the compacted soil is no longer a loosely gatheredmixture of constituents, but a medium which withstands com-pressive and shear contact stresses exerted by the moving edge ofthe cover on the propeller.
The transition from a high wear to a low wear regime isshifting to the right in Fig. 2 as the hardness of cover increases.Theoretically, the transition is expected to occur at a hardnessratio of 1. Wear of covers with 51 and 60 HRC exhibits such abehavior. The covers with a lower hardness exhibited prematuretransitions. For these covers, the high tool to soil hardness ratioswere mainly obtained by significantly reducing the quartzeticsand content of the soil which was the dominant abrasiveconstituents. Therefore, the covers experienced a low wearregime. In the real soil excavation applications, the tool hardnessis typically higher than 50 HRC and the transition in the wearband resembles the findings in this paper.
An important and useful finding was the effects of moisturecontent of the soil on tool wear. The presence of water in the soilmedium changes tool wear behavior drastically and increases thesoil abrasivity by many folds as the moisture content reaches nearthe optimum water content for maximum compaction. The effectof moisture on soil abrasivity at low water concentration iscounterintuitive as water-based conditioners have been widelyused for lubrication and reduced slurry abrasion. As the watercontent reaches the saturation level of 22.5%, two phenomenawere observed. First, the wear mass becomes less than thatexperienced in dry soil conditions which is expected. Secondly,the hardness of the tool did not affect the wear. The secondphenomenon might be due to the fact that at water contentsbeyond the saturation point, the abrasive particles in the soilbecome mobile and their entrapment and subsequent abrasionare minimal. Therefore, even tools with a low hardness can movethe saturated soil with negligible wear. In soft ground tunnelingapplications, the water content of the excavated soil can becontinuously monitored. If the water content at the face of thetunnel is close to the critical value for the specific soil type,additional water can be injected to the face which increases themoisture content and significantly decreases abrasion and primarywear on the cutting tools.
M. Mosleh et al. / Wear 302 (2013) 1555–1559 1559
Acknowledgments
The financial support of this work by the National ScienceFoundation under Award #0928757 is acknowledged. The authorsare grateful for the help from the machine shop technicians at theCollege of Earth and Mineral Sciences of Pennsylvania StateUniversity. Also, the participation by Dr. Angelica Palomino andTong Qiu is much appreciated.
References
[1] M. Suana, T.J. Peters, The cerchar abrasivity index and its relation to rockmineralogy and petrography, Rock Mechanics and Rock Engineering 15/1(1982) 1–8.
[2] H. Kasling, K. Thuro, Determining abrasivity of rock and soil in the laboratory,in: A.L. Williams, G.M. Pinches, C.Y. Chin, C.I. Massey (Eds.), GeologicallyActive, Taylor & Francis Group, London, 2010, pp. 1973–1980.
[3] E. Buchi, J.F. Mathier, Ch. Wyss, Rock abrasivity—a significant cost factor formechanical tunneling in loose and hard rock, Tunnel 5/95 (1995) 38–44.
[4] B. Nilsen, F. Dahl, J. Holzhauser, J. Raleigh, Abrasivity testing for rock and
soils, in: Proceedings of the Tunnels and Tunneling International 2006pp. 47–49.
[5] A.P. Harsha, U.S. Tewari, Two-body and three-body abrasive wear behavior ofpolyaryletherketone composites, Polymer Testing 22 (2003) 403–418.
[6] J. Rostami, E.A. Gharahbagh, A.M. Palomino, M. Mosleh, Development of soilabrasivity testing for soft ground tunneling using shield machines, Tunnelingand Underground Space Technology 28 (2012) 245–256.
[7] P. Lesle, M. Dong, E. Soppa, S. Schmauder, Simulation of interpenetratingmicrostructures by self consistent matricity models, Scripta Materialia 38/9
(1998) 1327–1332.[8] V.C. Nardone, K.M. Prewo, On the strength of discontinuous silicon carbide
reinforced aluminium composites, Scripta Metallurgica 20/1 (1986) 43–48.[9] M. Dong, S. Schmauder, Modeling of metal matrix composites by a self-
consistent embedded cell model, Acta Materialia 44/6 (1996) 2465–2478.[10] H.S. Kim, On the rule of mixtures for the hardness of particle reinforced
composites, Materials Science and Engineering A 289 (2000) 30–33.