This file is part of the following reference: Morgan, Terence Ernest (2003) Effects of ripeners on early season sugar production in sugar cane. Masters (Research) thesis, James Cook University. Access to this file is available from: http://eprints.jcu.edu.au/2139
Transcript
This file is part of the following reference:
Morgan, Terence Ernest (2003) Effects of ripeners on early season sugar production in sugar cane.
Thesis submitted for the research Degree of Masters of Science
in Tropical Plant Sciences
within the School of Tropical Biology
at James Cook University
STATEMENT OF ACCESS
I, the undersigned author of this work, understand that James Cook University will make this
thesis available for use within the University Library and, via the Australian Digital Theses
network, for use elsewhere.
I understand that, as an unpublished work, a thesis has significant protection under the
Copyright Act and;
I do not wish to place any further restriction on access to this work Or I wish this work to be embargoed until 27/10/2005 Or I wish the following restrictions to be placed on this work: _____________________________________ ______________ Signature Date
Abstract
Ripening in sugar cane refers to an increase in sugar content on a fresh weight basis prior to
commercial harvest. Certain chemicals are applied to cane in commercial fields in some
countries to accelerate ripening and improve profitability of sugar production. However,
responses have usually been reported to be variety and environment specific. We examined
changes in the sucrose content in the juice extracted from 43 Australian sugar cane
(Saccharum spp. hybrid) varieties in response to four chemicals in the Burdekin region in
north Queensland over two years. The four chemicals used were ethephon (as Ethrel®) +
fluazifop-P butyl (as Fusilade®), glyphosate (as Weedmaster® Duo) and haloxyfop-R
methyl (as Verdict®). These chemicals were applied in March/April each year. Of
particular interest was to determine if economic responses are possible for Australian
varieties harvested in the May and June period when sugar content in cane is usually low.
Increases in sucrose (measured by pol) levels in cane juice were observed after combined
application of Ethrel® + Fusilade® (E+F) and after application of glyphosate. These results
suggest opportunities exist in the Australian industry to improve the profitability of early-
harvested sugar cane crops, but further research is required to quantify effects on cane yield
and responses in diverse environments.
A second component of this study looked at physiological traits associated with
responsiveness of varieties to be chemically ripened. Three highly responsive (Q113, Q135
and TellusA) and 3 non-responsive varieties (Q167A, Q179A and Q186A) were selected from
42 varieties tested to glyphosate in April 2000. These varieties were treated again in April
2001 and changes in brix, pol, fibre and dry matter were monitored in bottom, middle and
top stem sections at T0 (time of application), T4 and T8 weeks after application. Fresh
weight pol results show that both response-type groups responded similarly to glyphosate at
T4 weeks but at T8 weeks the responsive group had significant higher pol (P≤0.01) relative
to the non-responsive group. A pooled analysis of variance for all varieties showed
glyphosate had not significantly affected either dry or fresh stalk weights by T8 weeks.
Differences between the response-type groups were then examined at T0 and it was found
that the responsive type group had higher fibre (P≤0.01) and less pol (P≤0.05) in the bottom
stem sections compared to the non-responsive group. It is speculated that the pol/DM ratio
in the bottom stem sections is a useful measure for prioritising which early-harvested crops
are suited to chemical ripening. It is suggested that potential to chemically ripen early
ii
harvested crops diminishes as this ratio increases in the bottom stem section. In this study,
the pol/DM ratios in the bottom stem sections were 3.7 % higher in the non-responsive
group at T0. The responsive group also had on average more then eight green leaves at T0.
This confirms South African recommendations on the usefulness of this trait to predict the
potential of early harvested crops for ripening.
Future research is required to confirm these results, particularly with other types of ripeners
since glyphosate is known to adversely affect the yields of some varieties in the following
ratoon crops.
iii
Acknowledgements
The completion of this study would not have been possible without the cooperation and
enthusiasm of many people from different organisations.
This work was funded by the Sugar Research Development Corporation, CRC for
Sustainable Sugar Production and CSR Ltd. I also acknowledge the support received from
Dr Andrew Wood and Mr John Baird from CSR Ltd. to undertake this study.
My supervisors Dr Philip Jackson, CSIRO Plant Industries and Dr Joseph Holtum, Tropical
Plant Sciences, James Cook University for the help and advice you have both given me
during the last four years. Many thanks.
Technical assistance from the Technical Field Department was received from Jeff Olsen,
Steve Elliott, Trevor Pollard, Rick Revelon, Michael Curtis, Andrew Brittain, Vallis Nixon,
Leigh Chappel, Franco Zanni, Sharon Newton and Robert Valenti. Technical assistance
from Bill Messer and John Foreman of CSIRO Plant Industries is also acknowledged. I
acknowledge the tremendous help all these people gave me with the always arduous and
sometimes difficult fieldwork between 1999 and 2001.
Metrological data was kindly provided by Steve Attard and Geoff Bamber from CSIRO
Sustainable Ecosystems.
Helpful suggestions and advice were also received from Dr Geoff Bamber, Dr Lisa
MacDonald and Dr Graham Bonnet.
Finally, to my family, Christine, Thomas and Robert, for patience and understanding whilst
I was completing this work.
iv
Contents
Statement of access ................................................................................... i
Abstract......................................................................................................... ii
Acknowledgements ................................................................................... iv
Contents ........................................................................................................ v
Figures ........................................................................................................... viii
Tables............................................................................................................. x
Statement of sources declaration ......................................................... xii
1 General Introduction................................................................... 1
1.1 The need for chemical ripeners ........................................ 1
1.2 Knowledge gap constraints to the adoption of ripener technology in Australia ................................................... 2
1.3 Hypothesises and objectives............................................. 3
2 A review of chemical ripening in sugar cane ...................... 4
3 The responsiveness of early-harvested Australian sugar cane varieties to chemical ripeners ......................................................... 47
4.3.1 Selection of ripener type ............................ 75
4.3.2 The selection of responsive and non-responsive Varieties from small mill data obtained in 2000 76
4.3.3 Small-mill, whole stalk, pol responses seen in 2001 compared to 2000............................ 76
4.3.4 A comparison of the small mill and carver press date obtained in 2001 ................................ 77
4.3.5 Plant growth responses to glyphosate..... 78
4.3.5(a) Stalk length differences between treatments ................................. 79
4.3.5(b) Effect of ripener application on stalk length ........................... 80
4.3.5(c) Fresh and dry weight differences between treatments.................... 81
4.3.5(d) Stalk fresh and dry weight differences between response-type groups ... 83
4.3.6 Whole stalk pol differences between populations for different response-type groups 84 4.3.7 Were the pol increases in June a sugar accumulation or desiccation effect? ....... 86 4.3.8 The spatial contribution of different stem sections
to the pol responses seen for each response-type group ....................................................... 86
4.3.9 Traits associated with response-type groups at application time in April ......................... 89
4.3.10 Other traits and glyphosate response...... 90
Figures Figure 2.1: The inverse relationship between juice purity at the time of
application and the observed response in sugar yield for NCo376 .................. 15
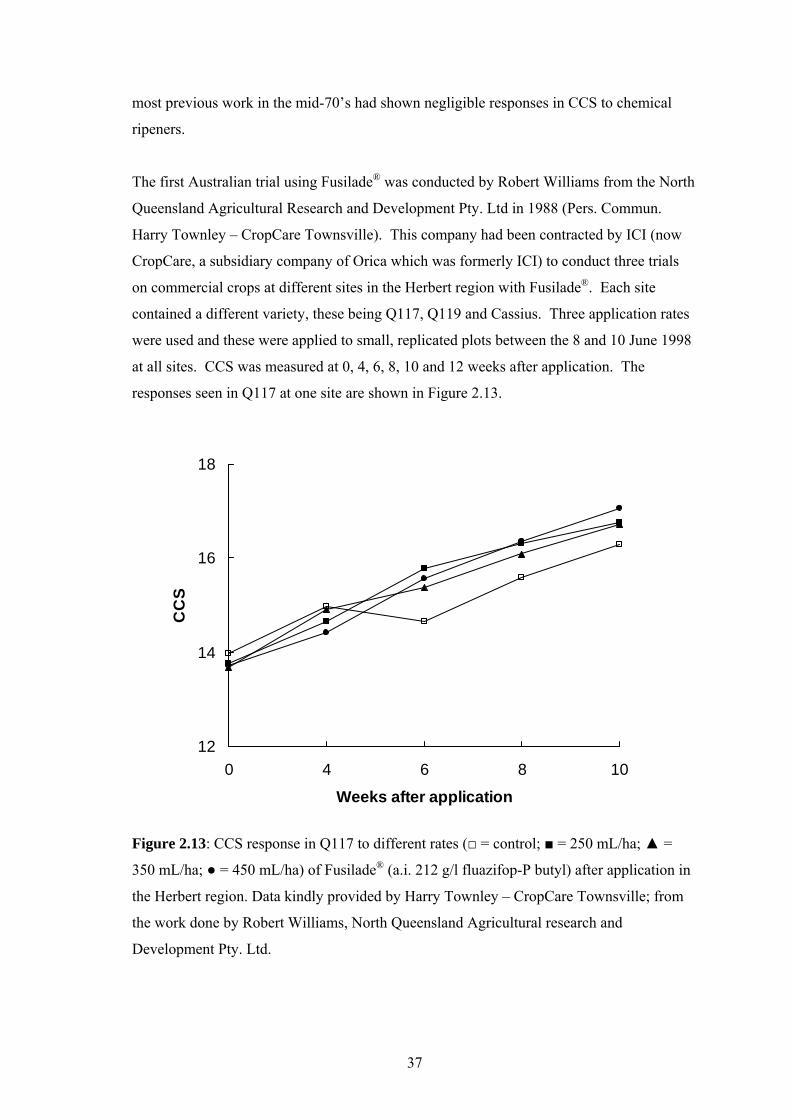
Figure 2.2: Long term effects on the estimated recoverable sugar percent fresh mass (ERS%) to multiple rates of Ethrel® in NCo376 in Natal, South Africa. 16 Figure 2.3: Long term effects on the sucrose percent cane dry mass to multiple rates of Ethrel® in NCo376 in Natal, South Africa ........................ 17 Figure 2.4: The effect of Ethrel® rates on sucrose per cent fresh weight cane for different varieties 12 weeks after application..................................... 18 Figure 2.5: The effects of Roundup® on sucrose % fresh weight cane in NCo376 subjected to different nitrogen and irrigation treatments ............... 20 Figure 2.6: Changes in sucrose % cane fresh weight from control after applying glyphosate (bottom) to each of the 20 trials ...................................... 21 Figure 2.7: The effects of Ethrel® on sucrose % cane and stalk mass............ 21 Figure 2.8: Changes in percentage estimated recoverable sugar (ERS % cane) with time ................................................................................... 23 Figure 2.9: The relationship between sugar yield response (ters/ha) and initial cane dry matter percentage.................................................................... 24 Figure 2.10: Commercial ripening responses in mainly NCo376 to different types of ripeners................................................................................. 25 Figure 2.11: Sucrose/ha/month (kg) vs age of cane at harvest (months) ....... 27 Figure 2.12: Changes in the sucrose, glucose and fructose % dry mass in stalk segments of Fusilade® treated, unstressed cane................................... 28 Figure 2.13: CCS response in Q117 to Fusilade® after application in the Herbert region................................................................................................... 31 Figure 3.1: Weather data for 2000 and 2001.................................................. 53 Figure 3.2: Effects of combined Ethrel® and Fusilade® treatment relative to the control plots averaged across years (2000 and 2001)................ 58 Figure 3.3: Effects of glyphosate application in 2000 and 2001 on brix, pol and purity, averaged across all varieties and across the May and June samplings.......................................................................................................... 60
viii
Figure 3.4: Pol % for Ethrel® + Fusilade® treatment averaged for May and June 2000........................................................................................... 61 Figure 3.5: . Pol % in glyphosate treatment averaged for May and June 2000 62 Figure 3.6: Varietal pol % responses for E + F treated varieties averaged for May and June in 2000 compared to those for glyphosate ................................ 63 Figure 3.7: Pol % responses of varieties to E + F treatment averaged across May and June in 2000 and in May and June 2001 ........................................... 64 Figure 3.8: Average varietal pol % responses to glyphosate treatment for May and June in 2000 compared to the responses seen in 2001 ................ 65 Figure 3.9: Mean shoot and stalk numbers for varieties in the glyphosate and control treatment............................................................................................... 67 Figure 3.10: The effect of glyphosate applied in 2000 on the mean pol for samplings in March, April, May and June 2001 compared to the control treatment............................................................................................... 68 Figure 4.1: Pol % for glyphosate treated varieties averaged for May and June 2000........................................................................................... 76 Figure 4.2: A comparison between years of the small mill pol responses for whole stalk samples of the selected responsive and non-responsive varieties . 77 Figure 4.3: Process comparison of the average whole stalk pol % for all varieties in the control and glyphosate-treated plots ........................................ 78 Figure 4.4: Stalk length differences between the untreated plots and glyphosate treated plots for all varieties following application in April .......... 80 Figure 4.5 Stalk length differences between the untreated and glyphosate treated plots for the non-responsive group and responsive group following glyphosate application in April ........................................................................ 81 Figure 4.6 Stalk fresh weight differences between the untreated plots and glyphosate treated plots .................................................................................... 82 Figure 4.7: Stalk dry weight differences between the untreated plots and glyphosate treated plots .................................................................................... 82 Figure 4.8: Stalk fresh weight responses between the untreated and glyphosate treated plots for the non-responsive group and responsive group.. 83 Figure 4.9: Stalk dry weight responses between the untreated and glyphosate treated plots for the non-responsive group and responsive group.. 84 Figure 4.10: Pol % changes with time for the response type groups following an application of glyphosate in April ............................................................... 85
ix
Figure 4.11: Partitioning data showing the change for the control in pol % for each section of the response type groups.................................................... 88 Figure 4.12: Pol differences in the top stem section between the control and Treatments for the individual varieties............................................................. 89 Figure 4.13: Small-mill data form 2000 comparing the initial pol at application time in April with the average pol response seen in May and June 91 Figure 4.14: Small-mill data form 2001 comparing the initial pol at application time in April with the average pol response seen in May and June ................. 91 Figure 4.15: Stem elongations before the application of glyphosate compared to the average pol response in May and June ................................................... 92 Figure 4.16: Stem elongations after the application of glyphosate compared to the average pol response seen in May and June ........................................... 92
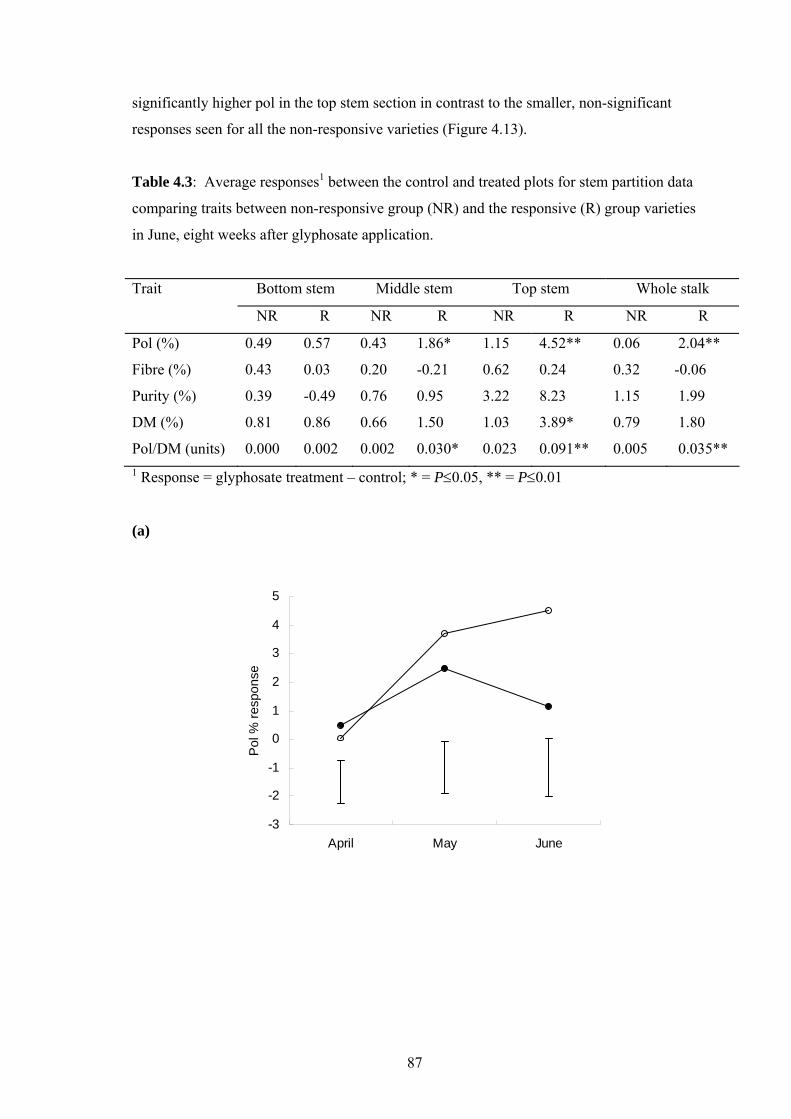
Tables Table 2.1: The composition of sugar cane...................................................... 5 Table 2.2: A comparison of two crops with equivalent sugar yields and the value to and Australian grower......................................................................... 6 Table 2.3: Responses and standard errors (SE±) of yield characteristics, number of treatments (n) and probability (prob) of recovering costs after eliminating factors which influence response to Fusilade® Super.................... 31 Table 2.4: A summary of CCS responses to Ethrel®........................................................... 36 Table 2.5: Varietal responses to Ethrel® ........................................................................................ 39 Table 2.6: CCS levels for each treatment at four dates after spraying ........... 40 Table 2.7: Plot yield and CCS for each treatment and $ return to grower after deducting $7/t harvest cost with sugar at $330/t .............................................. 40 Table 2.8: Commercial application rates and treatment harvest intervals for various countries ........................................................................................................... 42 Table 2.9: Some expected responses and cost/benefit ratios for different ripeners for some of research that has been conducted overseas...................... 43 Table 3.1: List of varieties examined and their parentage.............................. 49 Table 3.2: Details of treatments imposed ....................................................... 50 Table 3.3: Details of ripeners and rates used.................................................. 50 Table 3.4: Mean pol (%) and purity (%) across all varieties in the control treatment in 2000 and 2001 .............................................................................. 55
x
Table 3.5: Analyses for significance for various ripener treatments (R), variety (V), date (D) and year (Y) interactions ................................................ 56 Table 3.6: Analyses for significance for ripener treatment (R), variety (V) and date (D) interactions to the carry-over effects of glyphosate .. 67 Table 3.7: Estimated cost: benefit ratios found for the top 5 responsive varieties in 2000 and 2001 to ripener treatments.............................................. 70 Table 4.1: Mean square estimates for pol in April, May and June 2001........ 79 Table 4.2: Mean squares for whole stalk responses between treatments for pol, dry matter (DM) and pol/DM in June 2001............................................... 86 Table 4.3: Average responses between the control and treated plots for stem partition data comparing traits between non-responsive groups (NR) and the responsive (R) group varieties in June, eight weeks after glyphosate application 87 Table 4.4: Stem partitioning data comparing traits between non-responsive group (NR) and the responsive (R) group varieties in April at the time glyphosate application ...................................................................................... 90 Table 4.5: Node count data showing least square means between the non- responsive group (NR) and the responsive (R) group varieties in April at the time glyphosate................................................................................................. 90
xi
Statement of Sources Declaration
I declare that this thesis is my own work and has not been submitted in any form for another
degree or diploma at any university or other institution of tertiary education. Information
derived from the published or unpublished work of others has been acknowledged in the
text and a list of references is given.
________________________ _______________
xii
1. General Introduction 1.1 The need for chemical ripeners Sugar is an important industry. It is Australia’s fifth largest rural industry and Australian
exports contributed to 14.4% of total global free sugar trade. Queensland was the largest
world exporter of raw sugar for the first time in 1994-5 (Canegrowers 1997). The adoption
of modern technology by growers has played an important role in achieving this. However
there is increasing competition from other exporters overseas. Competitors like Thailand
and Brazil are continually seeking ways through R&D to improve productivity and
introduce product differentiation so that their sugar exports are more desirable to customers.
These gains, plus relative values of currency are eroding the competitive advantage the
Australian industry has enjoyed and the Brazilian sugar industry now produces sugar more
cost-effectively then Australia. There is a need for the Australian sugar industry to conduct
R&D in areas that will enable it to regain its market position.
The Centre for International Economics (2002) states the Australian sugar industry requires
a 37% increase in productivity to restore profitability to the levels achieved in 1996/7.
Growers are unlikely to see any short or medium term increase in the world sugar price so
therefore future farm viability will depend mainly on productivity improvements made in
the area of on-farm yields. The centre predicts most cane growing regions in Australia
would not be viable producers by 2006-7 if no productivity gains are achieved and the
world price remains static. This scenario would have a catastrophic impact on many coastal
regional communities that have been founded on sugar.
Any large, future increases in productivity however will create some additional problems.
Most Australian mills currently crush within a 21-22 week season that capitalises on the
seasonal ripening of cane leading around the spring months. Additional cane from
productivity increases will require either access to additional crushing capacity or an
extended crushing season. Increasing crushing capacity is an uneconomic option for most
mills in the current downturn. Frawley (1997) estimated that every one tonne per hour
increase in milling capacity requires $350,000 of investment capital. However, extending
the current crushing season by initiating the crush earlier involves harvesting cane that is
relatively immature and consequently of reduced sugar content and profitability. The
impact of reduced sugar content could be reduced if ways could be found increase the
maturity and profitability of any cane destined for early harvesting.
1
Chemical ripeners are one strategy that the industry may be able to use to improve its
competitive advantage. The use of ripeners can provide gains in sucrose quality above
those achieved by natural ripening (Rostron 1996, Eastwood and Davis 1998, Donaldson
1999, Resende et al. 2000; Millhollon and Legendre 2000). These gains can bring potential
benefits to the primary (i.e., growers), secondary (i.e., millers) and tertiary (i.e., storage and
marketing) industries involved with sugar. If the sugar content of sugar cane could be
improved following the application of chemical ripeners the dollar return to growers could
be increased. Transportation costs from the farm gate to the mill would also be reduced for
the miller.
The successful introduction of ripener technology may facilitate the harvest of cane earlier
in the season when it relatively immature. Early harvesting would also benefit millers by
improving their returns on capital investment in milling infrastructure, by the use of existing
milling capacity to process larger crops. Substantial savings are associated the avoidance of
this opportunity cost on capital. The storage and marketing components of the industry
might also benefit. If production was spread over a longer period, the demand for
investment in storage facilities would be reduced and the industry could supply customers
over a longer period of time. The costs savings and benefits for this last factor alone have
been estimated to be worth just under US$30 tonne (Mahony et al. 1997).
1.2 Knowledge gap constraints to the adoption of ripener technology in Australia
Although ripeners are currently used extensively overseas, this is not the case in Australia.
Ripener research in Australia faltered after the late 1970’s when a number of trials gave
variable and inconsistent results. Ethrel® was registered in 1993 (Rhône-Poulenc 1996), but
is not regarded by the sugar industry as a reliable ripening product under Australian
conditions. Overseas research has now identified many of the factors required to obtain
beneficial responses from ripeners. There are opportunities for the Australian industry to
now take advantage of these observations. However, it is important to understand the
extent of genotypic variation to chemical ripening before further study is undertaken to
quantify environmental and management factors that are also known to affect the response.
An understanding of genotypic variation in conjunction with better knowledge on how to
predict which crops might respond to ripeners will contribute towards the eventual adoption
of this technology by industry and growers.
2
1.3 Hypothesises and objectives The original hypothesises for this study are that:
1. There is genetic variation in response to chemical ripeners among
Australian varieties and that some varieties can show an economic response
to chemical ripeners; and
2. The prediction of response in responsive varieties can be improved by
measuring both purity and growth rate at the time of ripener application.
The objectives are therefore to:
1. Identify cultivars that are responsive and non-responsive to various ripeners
including combination treatments of ripeners; and
2. Identify physiological differences between the two genotype groups that
might enable better response prediction to chemical ripening among
different varieties in an immature, erect crop.
3
Chapter 2
A review of chemical ripening in sugar cane
2.1 Introduction This review examines the present state of knowledge regarding the use of chemical ripeners
in sugar cane. The first part provides some definitions, concepts and terminology. The
second part focuses on key research that has been undertaken in South Africa, which has
been at the forefront of ripener research for the last 30 years, and Australia where research
stalled after initial results in the 1970’s proved inconclusive. This approach allows one to
understand the research strategies that have evolved over time as knowledge about chemical
ripening in sugar cane has increased. Comments are made occasionally about the quality of
the work conducted and how it is related to work that was done elsewhere. Important tables
and figures from studies that added to important areas of our present knowledge base are
also presented. The concluding section summarises what are the current knowledge gaps
and how the proposed study will contribute to the existing knowledge base.
2.2 Concepts, Definitions and Terminology 2.2.1 The sugar cane crop
Sugar cane and sugar beet are the two crops that are used to commercially produce sucrose.
World production of sugar in 1989/90 was 109 M tonnes, about 63% of which was
produced from sugar cane (Cooke and Scott 1993). Sugar cane was one of the first tropical
crops to be adapted to large-scale farming and it underpins the economies of many regions
and in some cases, whole countries (Humbert 1983).
2.2.2 The composition of cane
On a weight basis, about three quarters of a sugar cane stem is water (Table 2.1).
4
Table 2.1: The composition of sugar cane in Louisiana (Source: Spencer and Meade 1948).
showed some promise in early trials (Bieske 1970, Yates 1971). This compound was
granted a temporary experimental permit in USA in 1972 and later trademarked under the
name “Polaris”. Early field trials in USA showed Polaris increased the sucrose percentage
on average by 10 % if applied 4 to 10 weeks before harvest (Sellick et al.1974). Similar
promising results were also observed in other countries (Pan and Lee 1974, Rostron 1974).
Glyphosine was phased out in USA during the 1985-86. It was replaced by the compound
phosphonomethyl glyphosate (syn. glyphosate), which was marketed under the brand name
“Polardo®” (syn. Mon 8000). Glyphosate proved to be more active than glyphosine when
applied over a range of environments and varieties (Eastwood and Davis 1997). The
increased activity associated with glyphosate also proved detrimental to the ratoon crops in
8
some situations when compared to Glyphosine (Rice et al. 1984). In the USA the use of
glyphosate is now recommended with crops that not being ratooned (i.e. ploughed out).
Another compound that showed promise in the late sixties and early seventies was the
ethylene- producing compound (2-chloro-ethyl) phosphonic acid (syn. ethephon). This was
marketed under the name “Ethrel®” and it proved to be successful on the variety NCo376
during early trials in South Africa (Rostron 1973). Rostron reported in 1975 that Ethrel®
was the best chemical ripener for South African conditions (Rostron 1975), however, this
has not been consistently observed overseas where glyphosate has proven to be more
effective (Eastwood and Davis 1997).
The grass herbicide fluazifop-p-butyl (trade mark = Fusilade®) is the only other compound
that has been registered for use as sugar cane ripener since glyphosate. In 1983 and 1984
Rostron (1985) reported that the effects of Fusilade® were similar to or better than those of
Polardo® or Ethrel®. Fusilade® did not appear to harm the ratoons at the rates tested
providing the crop was actively growing at the time of application.
The use of chemical ripeners in Australia has not been adopted as commercial practice.
Research by the Bureau of Sugar Experiment Stations (BSES) in 1977 showed that, on
average, the response to either Polaris® or Ethrel® was insignificant when applied in
May/June for early season crops or October for late harvested crops (Kingston et al. 1978).
The poor responses could be partly explained by the fact the sugar cane was already close to
maturity at the time of application. High cost of application and low sugar prices also
contributed to this work being deleted from BSES research plans. Later research
demonstrated that larger gains with Ethrel® could be achieved when applied to relatively
immature cane (Kingston 1988). In 1993, Ethrel® became the only chemical ripener
registered for use in Australia.
Glyphosate, Ethrel® and Fusilade® are currently used widely as ripeners on commercial
crops in South Africa (Donaldson 1999), Swaziland (Rostron 1996), Florida (Dusky et al.
1986), Hawaii (Bartholomew and Silva 2001), Mauritius (Soopaya and Naramuth 2001) and
Guyana (Eastwood and Davis 1998). The South African industry has also registered
another ripener (haloxyfop-R methyl ester) for commercial use (Donaldson 1999).
9
2.3 The types of ripeners The following categories for grouping chemical ripeners used on sugar cane are shown
below (Vlitos and Lawrie 1965). These include:
1. Defoliants
2. Desiccants
3. Plant growth regulators
4. Enzyme inhibitors
As mentioned in the last section, Ethrel®, glyphosate and Fusilade® are the only three
ripeners registered for use in sugar cane at present.
1. Defoliants
These result in the abscission of leaves.
2. Desiccants
These compounds cause rapid drying of leaves and include chemicals like paraquat and
diquat. Both increases and decreases in sucrose content have been observed following the
application of these compounds. Arvier (1965) reported decreases in sucrose content with
paraquat. However, recent research by the BSES in the Burdekin showed CCS increases in
cane strips that were treated with paraquat to reduce their attractiveness to greyback beetle
(Cocco 1999).
3. Plant Growth Regulators
This group includes compounds that affect hormone-regulated growth processes in the
plant, particularly auxin-regulated processes. The most commonly used growth regulator is
the herbicide 2,4 D.
Vlitos and Lawrie (1965) observed variable responses (to mixtures of 2,3, 6-
trichlorobenzoic acid and 2-methyl-4-chlorophenoxyacetic acid (“Pesco 1815”) and
reported that researchers at the David North Plant Research Centre had encountered similar
variable responses between glasshouse and field trials with the same mixture.
Ethylene is a plant growth regulator. Its effects on plant development and fruit ripening
have been known for a long time. The Chinese noted that burning incense increased fruit
10
ripening and, in 1864, leaky gas lights in street lamps stunted nearby plants (Saupe 2002).
Most plants make ethylene with the shoot apex and senescing tissues producing the highest
concentrations. Ethylene causes a broad range of responses in a plant that include
promoting fruit ripening, abscission, epinasty, thigmomorphogenesis, stimulation of
germination and inhibition of flower senescence.
A commercial product, called “Ethrel®”, produces ethylene within the sugar cane tissue.
The mechanism by which ethylene causes ripening in sugar cane is not known. Recent work
has shown that ethylene reduced the activity of extracellular invertase in Chenopodium
rubum suspension culture cells (Roitsch et al. 1999). It is possible that ethylene also reduces
the activity of extracellular invertase in sugar cane and therefore reduces the amount of
sucrose that is catabolised in sink tissues.
A recently developed plant growth regulator that shows excellent potential for ripening
sugar cane is trinexapac-ethyl (Primo® 250 EC. Syngenta, PO Box 249, Wentworthville
NSW 2145). It appears to suppress, but not inhibit, growth in grasses by interfering with
the biosynthesis of gibberellic acid (Bywater 2001). Researchers in Brazil reported that it
increased the sucrose content of the 25 most important cane varieties by about 10% on
average (Resende et al. 2001).
4. Enzyme Inhibitors
The herbicidal activities of glyphosate and Fusilade® are associated with enzyme inhibition.
Glyphosate inhibits 5-enolpyruvylshikimate 3-phosphate synthase (EPSP synthase). This
inhibits the synthesis of EPSP from shikimate 3-phosphate and phosphoenolpyruvate and
therefore affects the plant by inferring with aromatic amino acid biosynthesis (Su et al.
1992).
Fusilade® inhibits acetyl coenzyme-A carboxylase, an enzyme involved in the conversion of
acetyl-CoA to malonyl-CoA. Fatty acid synthesis is thus disrupted and the formation of
cellular membranes inhibited (Donaldson and Van Staden 1995).
11
2.4 The physiological responses of sugar cane to chemical ripeners 2.4.1 Natural ripening and sucrose accumulation - what is really happening?
Growers apply ripeners to sugar cane so that the percentage sucrose is increased above what
would be achieved through natural processes at harvest. The physiological processes
responsible for the accumulation of sucrose are poorly understood. This lack of
mechanistic understanding and thus of how agronomic practice and environment actually
influences the mechanism is consistent with the observation that a large number of trials
report little or no response following an application of a ripener. Assuming correct
application has occurred, researchers speculatively attribute many of these observations to
various varietal, environmental, crop or management factors.
Does a ripening phase or phenomena occur? In sugar beet it was believed that a specific
ripening phase or “sugaring-up” occurred. This ripening phase was triggered by falling
night temperatures (Ulrich 1955). Later it was shown that sugar beet in England
accumulates sugar to total root dry matter at relatively unchanged rate of 0.70 –0.75 % after
mid-August (Milford and Thorne 1973). However, the sucrose concentration in sugar beet
on a fresh weight basis steadily increases from June to November. In contrast, to the sugar
to root dry matter ratio, the maximum concentration reached on a fresh weight basis varies
widely with season and location and is also affected by moisture availability and rainfall.
There are similarities between sugar beet and sugar cane ripening. Recent work by Inman-
Bamber et al. (2002) suggests that maturation of a cane stalk could be defined by two
phases that are similar to the pre and post mid-August phases given for sugar beet above.
The first phase is associated with the sucrose content (on a stalk dry weight basis) of the
basal internodes increasing. The second phase is associated with the basal internodes being
fully ripened. The basal internodes reach maximum sucrose content of around 0.55 g/g of
dry matter in the variety NCo376 when the total stalk dry weight approached 150 g. This
data was obtained from a field experiment conducted in 1988 in South Africa. Work
reported by Muchow et al. (1997) suggests that sucrose accumulation in sugar cane is a
continuous process directly related to stalk growth, a process that is not triggered by low
temperatures, water deficit or nitrogen stress. They found that in 3rd and 4th ratoons Q117
grown in fully irrigated conditions at Ayr, increased in stalk sucrose (g/g DW) to maximum
of 0.48 to 0.50. These levels were maintained over the crushing season from July to
12
November. However, this did not apply for sucrose (g/g FW), which steadily increased in
both crops over the same period. This work suggests that:
1. The ratio of sucrose to dry matter in the stem does not change for mature cane over the
crushing season.
2. The ratio of sucrose to total fresh weight does increase as sugar cane matures through the
crushing season.
3. There is no ripening phase in mature sugar cane.
4. Natural maturation of sugar cane is directly associated with desiccation of the stalk.
The main conclusions from the partitioning work done in South Africa and Australia are
similar and support the theory that sucrose content on a dry matter basis plateaus after a
certain crop size has been achieved.
2.4.2 Chemical ripening and sucrose accumulation
The reasons why glyphosate or Fusilade® increase sucrose accumulation in the stalk when
applied as a sub-lethal dose, appear to be complex and not fully understood.
Hawaiian researchers showed that glyphosate resulted in an increase in sucrose content in
the stalk just five days after application (Su et al. 1992). A significant reduction in acid
invertase activity was observed (about 80%) but they concluded glyphosate also affected
sugar cane in other ways to account for the increase in sucrose content observed. One
explanation suggested was glyphosate depressed auxin activity that in turn decreased acid
invertase and shoot growth activity (i.e. there is also a glyphosate/auxin interaction).
Osgood et al. (1981) showed glyphosate increased dry matter partitioning towards sucrose
at the expense of fibre. It is possible that many of the physiological responses associated
with sucrose accumulation following glyphosate application would be similar to those seen
for Fusilade®. Although these ripeners have different modes of action, both result in the
cessation of growth at the apical meristem. The removal of this important sink will
therefore have similar physiological consequences regardless of the ripener used.
13
2.5 A review of chemical ripening research in South Africa 2.5.1 The early 1970’s
The first information published on chemical ripeners in South Africa was in 1973 by Harry
Rostron, a researcher with the South African Sugar Association Experiment Station
(Rostron 1973). Rostron presented data from seven trials that were conducted in 1971 and
1972 in South Africa and Swaziland. NCo376 was the variety in all the trials except one,
which contained N55/805. Four trials involved applications between the 21 March and the
29 April. The other three were applied to late harvested crops between the 20 September
and the 30 December. A control and up to seven treatments were applied with various
ripeners including Ethrel® and Polaris®. Rostron reported that Ethrel® and Polaris®
produced a consistent improvement in sucrose content in NCo376. However, there was
considerable variation in the responses seen in this variety. Polaris® reduced cane yield in
some trials to an extent where improvements in ERS did not result in an improvement in
TSH. Significant improvements in sugar yields were observed in trials using Ethrel® and
Polaris® where the cane was immature at the time of application and which subsequently
had good growing conditions until harvest. These same responses were not as pronounced
in trials that contained cane that was more mature and had a higher purity. Rostron
concluded that further work was required to determine the conditions that favoured the use
of these ripeners. This first series of trials identified two important issues relating to the
success of ripeners:
1. The use of ripeners on immature crops that are harvested early in the season.
2. Maintaining good growing conditions after the application of ripeners.
These two issues would be confirmed repeatedly over the next 30 years.
Rostron repeated field and pot trials in 1973 to confirm the conclusions of the previous
experiments (Rostron 1974). It was demonstrated that both Polaris® and Ethrel® applied to
NCo376 improved purity, sucrose concentration and sugar yield. These improvements
occurred at 4 to 6 weeks and were maintained for up to 12 weeks after application. Other
measurements showed that both chemicals reduced the uptake of CO2 at high light
intensities. Cane dry matter content was also significantly increased in the upper parts of
the stalk. It appears that both ripeners induced water stress within the plant and modified
the translocation and storage of dry matter within the plant. Rostron noted that the quality
and yield gains seen in NCo376 contradicted the observations made with other varieties in
14
his previous work and that of others (Rostron 1973, Alexander and Montalvo-Zapata 1973).
He also suggested that where good growing conditions were maintained after application, a
second application of ripener could be beneficial one month after the first, especially where
the juice purity was still low. This idea was tested with Ethrel® in later work (Rostron
1977b) and is now the basis of commercial practice in South Africa.
A review of the research (Rostron 1975) conducted over the previous six years concluded
that:
1. Ethrel® and Polaris® will ripen cane under certain conditions in South Africa and
Swaziland;
2. Ripening increases % sucrose and sugar yields per hectare;
3. Millers can benefit from increased sucrose recovery at times of the year when cane
quality is low;
4. Ripeners applied to early-harvested crops gave better gains compared to late-harvested
crops;
5. Observed response to ripeners is dependent upon the ability of the crop to grow after it
has been sprayed, particularly in relation to the amount of plant-available soil moisture;
6. There is an inverse relationship between the observed response and the juice purity at the
time of ripener application (Figure 2.1).
Figure 2.1: The inverse relationship between juice purity at the time of application and the
observed response in sugar yield for NCo376 (Rostron 1975)
The potential of six chemical ripeners including Ethrel® and Embark® (mefluidide) was
examined in seven experiments in 1975 and 1976 (Rostron 1977c). Only Embark® and one
15
other compound produced ripening effects to warrant further testing. The results from
various trials suggested that:
1. High early sugar varieties do not seem to respond as well as varieties with lower sucrose
contents;
2. Spraying earlier in February is more effective than in April;
3. The observed response is more dependent on the physiological state of the crop at the
time of spraying than the month it is sprayed;
4. Previous observations of an inverse relationship between the observed response and the
juice purity at the time of Ethrel® application are correct.
So far, research in South Africa had reported no adverse effects of Ethrel® on cane yield.
Trials conducted in 1976 investigated the effects of large, multiple rates of Ethrel® on the
cane yield and quality of irrigated NCo376 (Rostron 1977b). The results of this work are
shown in Figures 2.2: & 2.3.
Figure 2.2: Long term effects on the estimated recoverable sugar percent fresh mass (ERS %) to
multiple rates of Ethrel® in NCo376 in Natal, South Africa (Rostron 1977b).
16
Figure 2.3: Long term effects on the sucrose percent cane dry mass to multiple rates of Ethrel® in
NCo376 in Natal, South Africa (Rostron 1977b).
Rostron reported that:
1. Ethrel® did not affect cane yield in multiple applications despite a reduction in foliage
mass. This was observed over six months of sampling using up to 6 L/ha of Ethrel®;
2. The optimum time for a single application appeared to be 6 to 12 weeks but further
applications could extend and further improve the magnitude of the response;
3. Multiple applications did not result in additive improvements in cane quality; there were
diminishing gains with each application;
4. Treatments with multiple applications coped with later drought better than the untreated
control.
A detailed review of chemical ripening with Ethrel® in Southern Africa gives an excellent
overview of the research conducted over a five-year period (Rostron 1977a). Rostron
points out that:
1. All varieties appear to be responsive to Ethrel® when applied to early harvested crops;
2. Some varieties were adversely affected when Ethrel® was applied to late harvested
crops;
17
3. Some varieties (e.g. L76) are more responsive at lower rates (Figure 2.4)
Figure 2.4: The effect of Ethrel® rates on sucrose per cent fresh weight cane for different
varieties 12 weeks after application (Rostron 1977a).
Rostron states that:
“…any adverse effect of Ethrel® on quality would therefore appear to be related
more to the physiological state of the plant at the time of spraying and the rate of
chemical applied than to the variety per se” (Rostron 1977a)
This statement possibly suggests that in previous studies in which response differences
following application of the ripener were attributed to genetic variation of the cane, the
responses were in fact more attributable to genetic variation determining the physiological
state of the cane plant at the time of application (assuming all environmental factors are
equal). If so, there is a need to measure the environmental and physiological variables at the
time of application to understand what determines responsiveness to chemical ripeners.
Knowing this, we may then predict that in certain environments or certain physiological
points, some varieties will respond better or worse than others to the application of chemical
ripeners.
18
2.5.2 The late 1970’s
The first trials using Roundup® (glyphosate-isopropylammonium) were reported in 1978
(Clowes 1978). Clowes compared the responses of Roundup® with Ethrel®, Embark® and
Mon 8000 on five early harvested and three late harvested crops. In the early harvested
crops, Roundup® and Mon 8000 significantly improved sucrose content even when juice
purities were higher than 84% at the time of application. This did not occur for Ethrel® and
Embark® where little response occurred when purities were above 80% at the time of
application. Ethrel® and Embark® did not appear to reduce stalk mass but Roundup® and
Mon 8000 did, particularly when applied to immature crops that were actively growing.
However, Clowes stated that the significant improvements in juice quality more than offset
adverse effects on cane yield.
In the late harvested crops, Roundup® and Mon 8000 significantly improved sucrose
content at three and six weeks after application but this did not occur following application
of Ethrel® or Embark®. The latter two ripeners were associated with small insignificant
improvements in sucrose content although Ethrel® caused some increases in cane yield in
some of the trials. This study reconfirmed that Ethrel® is best suited to application in
actively growing immature crops that are harvested early in the season. It also suggested
that there is a role for Roundup® in more mature crops that have high purities at the time of
application. Roundup® did produce some chlorosis in the young ratoons up to three months
of age but stunting only occurred at rates above 0.9 kg a.i./ha.
Clowes and Inman-Bamber (1980) investigated the ripening response to glyphosate when
applied to various varieties, nitrogen fertiliser treatments and soil moisture regimes. A total
of 30 trials were performed. The study showed that soil moisture levels had an important
effect on the ripening response. Consistent, beneficial responses only occurred when
adequate soil moisture was available before and after application up to the time of harvest.
Glyphosate-treated cane that was not moisture stressed had similar sucrose contents but
greater sugar yields compared to an untreated control that was ripened by moisture stress
(Figure 2.5). Cane yields increased in the glyphosate-treated cane because moisture was
available for growth up to the time of harvest. Soil nitrogen levels had little effect on
ripening responses but significant differences in cane quality and yield associated with
nitrogen levels were observed.
19
Figure 2.5: The effects of Roundup® on sucrose % fresh weight cane in NCo376 subjected
to different nitrogen and irrigation treatments (Clowes and Inman-Bamber 1980).
In twenty rain-fed trials that were part of the above work, Clowes and Inman-Bamber
(1980) observed that ripening responses to glyphosate were very dependent upon moisture
availability and temperature (Figure 2.6). They stated that these two factors alone
"overshadowed the effects of varying soil types, crop age and other management factors".
These conclusions are very similar to those made the same year by a researcher
investigating the efficacy of Roundup® as a herbicide for killing sugar cane (Turner 1980).
Although many factors can affect the herbicidal ability of Roundup® in sugar cane, it is
critical that cane is actively growing at the time of application because Roundup® inhibits
the synthesis of amino acids that are incorporated during protein synthesis. Turner stated
that winter applications were "definitely inferior" to summer spraying when temperatures
and moisture availability are higher
Observations on the large-scale use of glyphosate to ripen commercial cane were made in
1978 and 1979 (Mills 1980). Commercial data suggested a substantial improvement in cane
quality when glyphosate was applied at either ends of the milling season. The interval
between application and harvest was six to ten weeks in early harvested crops and
decreased to three to six weeks in late harvested crops. Mills (1980) states that these
intervals generally coincide with the rate of side shoot emergence, which in turn is ruled by
the amount of growth occurring. Other benefits included better burns, fewer tops and trash
in the cane delivered and increased bin weights.
20
Figure 2.6: Changes in sucrose % cane fresh weight from control after applying glyphosate (bottom) to each of the 20 trials (Clowes and Inman-Bamber 1980).
Figure 2.7: The effects of Ethrel® on sucrose % cane and stalk mass on mature cane
(purity>80% at application) for five South African varieties. An asterisk indicates that the
difference was significant (P=0.05) (Clowes 1980).
Previous studies (Rostron 1977a, Kingston et al. 1978) showed that inconsistent and often
adverse responses occurred when Ethrel® was applied to mature cane that was harvested
late. Clowes (1980) conducted six trials that looked at the ripening responses in different
21
varieties that had Ethrel® applied to them when mature (i.e. juice purity of more than 80).
Following an application of Ethrel®, five of these trials showed significant adverse effects
on cane quality whilst there were apparent gains in cane yield (Figure 2.7). No adverse
effects were observed however in NCo376.
Concerns that ratoon stunting occurred following glyphosate applications had been
expressed in early studies (Clowes 1978, Mills 1980). A review of data from trials of
ratoon crops that were used to assess the ripening responses to glyphosate concluded that
there was little effect of glyphosate on ratoon yields when glyphosate was applied to
actively growing cane that had suffered no moisture stress before, at or after the application
(Donaldson and Inman-Bamber 1982). However, ratoon yields were affected by glyphosate
if the crop was not actively growing because of water stress. It was suggested that the same
effect could occur if the cane was subjected to other stresses (e.g. water logging, disease or
low temperatures). The conclusions suggested that glyphosate may only have a role as a
ripener in plough-out crops where there is a significant chance of crop stress occurring just
before, at or after the time of application.
2.5.3 The 1980’s
Fusilade® (fluazifop-P butyl) was first registered for commercial release as a grass-specific
herbicide in 1980 by ISK Biosciences (Agranova 2001). In eleven field experiments
conducted in 1983 and 1984, the ripening responses of Fusilade® were compared with those
of the standard ripeners Ethrel® and Polardo® (Rostron 1985). The trials demonstrated that
Fusilade® produced consistent improvements in cane quality when applied to actively
growing cane. Ripening responses to Fusilade® showed a mean sugar yield gain of 1.1
tonnes/ha. No adverse effects were observed in the subsequent ratoons at rates of up to 97 g
a.i./ha. The optimum rates were found to occur between 38 and 50 g a.i./ha Fusilade® was
an efficient ripener when compared on a weight for weight basis with other ripeners. Up to
8 and 14 times the amount of active ingredient was required for the optimum responses
from Polardo® and Ethrel® respectively. This is an important factor when the cost of aerial
application per hectare for ripeners is often more than the cost of the chemical. Rostron’s
report also contained the first data showing the beneficial responses obtained from "piggy
back" applications of Ethrel® and Fusilade®. These involved spraying Ethrel® on the cane
one month prior to the application of Fusilade® or Polardo®. Both these combination
treatments significantly increased the sucrose content (as measured by ERS) 10 weeks after
spraying, compared to the Ethrel treatment alone (Figure 2.8).
trials were also conducted in 1988 with Q96, Q107, Q115, Q117, Q122, Q123, Q128,
Cassius and CP44-101. These strip trials were performed throughout Queensland. All of
above trials were sprayed between mid-March and mid-April at 1.5 L/ha Ethrel® and some
varieties were found more likely to respond than others (Table 2.5).
Table 2.5: Probability of varietal responses to Ethrel® in the first six weeks of the harvest
season (Kingston et al. 1991).
Variety Probability of achieving
a response of >= 0.5 units CCS
Q115 100
Q119 100
Q137 91
H56-752 84
CP44-101 56
Q96 & Q124 50
Q117 37
The poor response seen in Q117 may have been due to high purities that were never below
75% at the time of spraying. The above work showed that there was a 70% probability of a
CCS response of 0.5 units of greater following the application of Ethrel®. There was a 20
% probability that the CCS response would be less that 0.25 units with a negative dollar
return on investment. Probabilities could be improved if the cane had purities less than
75% at the time of application and that subsequent growth occurred in non-stressed
conditions.
Willcox et al. (1999) conducted a trial that investigated the effect of three crop ripeners on
CCS and yields of Q124 at Mackay in 1998. Ethrel®, glyphosate and Fusilade® were
applied on 10/3/98 to replicated small plots that were sampled 8, 10 and 12 weeks after
application. The harvest of the trial occurred 15 weeks after application. Significant
39
increases were observed in CCS for all ripeners (Table 2.6). However, significant decreases
in cane yield occurred for the Fusilade® and glyphosate treatments (Table 2.7). No
significant reduction in cane yield was observed with Ethrel®. Stalk elongation stopped one
week after the application of Fusilade® and never resumed. The application rate used for
Fusilade® was 450 mL/ha (212 g/L fluazifop-P butyl). This was considered too high by
Williams and is above the rates used by the South Africans except for their less responsive
varieties like N14. However, the Fusilade® treatment still gave the best dollar return on
investment despite the high rate used and the adverse effects on cane yield.
Table 2.6: CCS levels for each treatment at four dates after spraying (Willcox et al. 1999).
Treatment 5 May 18 May 1 June 24 June
Control 8.8 8.2 9.3 12.7
Ethrel® 9.4 9.7 11.0 13.6
Roundup® 10.1 10.1 11.8 13.9
Fusilade® 12.5 13.5 14.4 16.2
l.s.d. (P≤0.05) 1.76 0.95 0.79 0.39
Table 2.7: Plot yield and CCS for each treatment and monetary return to grower after
deducting $7/t harvest cost with sugar at $330/t (Willcox et al. 1999).
Treatment Yield
(t cane/ha)
CCS Yield
(t sugar/ha)
Return to
grower ($/ha)
Control 95.8 12.71 12.17 1862
Ethrel® 87.2 13.64 11.88 1868
Roundup® 83.7 13.88 11.61 1881
Fusilade® 70.5 16.16 11.38 2031
l.s.d. (P≤0.05) 10.05 0.39 1.37
Australian research in the area of chemical ripeners has been hampered by:
1. A knowledge gap in understanding the reasons for the variable responses of cane
varieties to ripeners in early trials;
40
2. Low world prices at the time the time of investigation that indicated the probability of an
economic response would be low;
3. Grower attitudes to spraying technology in the 70’s and 80’s;
4. Environmental concerns and resistance to aerial spraying near residences;
5. Possibility of ratoons being affected by chemical ripeners;
6. Limited registration of chemicals for ripening sugar cane in Australia.
The Australian sugar industry has currently made very little use of this technology to improve cane quality in some of the crops sent to mills.
2.7 Current commercial practice The choice of ripener, rate and treatment harvest interval varies with country (Table 2.8).
South Africa differs from other countries in that it practices combination ripener treatments.
2.8 Other Issues The adoption of ripener technology by growers also needs to be considered in terms of
effects on the whole farming system. For an example, it important that growers ensure
adequate soil moisture or irrigation is available to chemically ripened crops if optimum
benefits are to be achieved. The use of ripeners can also reduce the flexibility of the grower
to manage the harvest sequence if unforseen circumstances occur just prior to harvest (eg.
flooding rains, uncontrolled burns, etc). A block that has been managed for ripeners is
probably less able to cope with harvesting machinery at harvesting if rainfall occurs as
opposed to a block that has been “dried-down”. However, ripeners can reduce the number
of green leaves and trash at harvest time thereby minimising the difficulties cane harvesters
have processing high yielding crops that are cut green.
41
Table 2.8: Commercial application rates and treatment harvest intervals for various
countries.
Country Ripener1 Rate THI2 (days)
Comments Reference
Mainland USA
G 0.14 - 0.33 kg ai/ha
21 - 35 last ratoons only, applied to crops harvested in Oct & Nov., higher rates used with smaller THI
Millhollon and Legendre 1996; Gilbert et al. 2002.
Guyana G 900 mL/ha of 480 g ai/l
28 Eastwood and Davis (1997, 1998)
Guyana F 425 mL/ha 42 higher rainfall areas “ ” Guyana T 700 mL/ha 28 “ ” Australia E 1.5 l/ha 56 - 70 Apply Mar/Apr Rhône- Poulenc
1996. South Africa
E 1.5 l/ha 42 - 84 certain varieties, less than 75% purity, sufficient soil moisture, harvest before July, smaller THI for fast growing cane
South African Sugar Association 2002b.
South Africa
F 300 - 440 mL/ha
35 to 70 rate varies with variety, purity less than 85%, sufficient moisture to maintain growth for 35 days after application, THI depends on rate of cane growth, can be used for early and late harvested crops.
South African Sugar Association 1998.
South Africa
E + F as for previous recommendations
77 - 84 (E) 42 - 49 (F)
only early harvested crops
South African Sugar Association 2002b.
1 G = glyphosate, T = Touchdown 4LC; F = Fusilade® Super, Ethrel®. 2 Treatment harvest interval.
2.9 Cost benefit analysis of using ripeners Cost/benefit ratios in the literature show returns from ripening responses that range
from $3.50 for every dollar spent to returns as high as $32 for every dollar spent (Table
2.9). The lowest returns were reported from Australia and these probably reflect the
variable and inconsistent responses obtained from ripener trials conducted there.
42
Table 2.9: Some expected responses and cost/benefit ratios for different ripeners for some
of research that has been conducted overseas.
Country Ripener1 Cost/Ha
(currency)
Expected
response
Cost/benefit
ratio
Reference
Swaziland E 80 (E) 0.75 t sucrose/ha 1:6 Rostron 1996
Swaziland F 35 (E) 0.75 t sucrose/ha 1:15.1 “”
Swaziland E & F 115 (E) 0.75 t sucrose/ha 1:5.5 “”
Guyana G or T or
F
11.50 (US) 0.35 - 0.75 t/ha 1:15 to 1:32 Eastwood
and Davis
1997
Guyana G or T or
F
11.95 (US) 1.04 % (w/w
cane)
1:15 to 1:32 Eastwood
and Davis
1998
Australia E 90 (A) Kingston et
al. 1978
Australia E 56 (A) 0.5 % CCS Rhône-
Poulenc
1996.
Australia E 70 (A) 0.8 % CCS 1:3.5 to 1:4.7 Kingston
1988
South
Africa
F 80 Rand 1.2 t sucrose/ha
for irrigated cane
and a 33% lower
response for dry
land cane
1:4 Donaldson
1996b
1 G = glyphosate, T = Touchdown 4LC; F = Fusilade® Super, Ethrel®.
2.10 Environmental and safety issues pertaining to chemical ripeners The use of ripeners can create potential problems with chemical residues in the harvested
crop. Despite the relatively short withholding period (i.e. the time between spraying and
harvesting) Donaldson (1990) states that residue problems are unlikely because:
43
1. Relatively low application rates are used for ripening compared with the recommended
herbicidal rates for the same chemical;
2. All the ripeners currently recommended for use in South Africa have extremely low
mammalian toxicity. All have LD50 ratings above 3000 mg/kg body weight;
3. The production process (crystallisation) tends to exclude nearly all impurities.
Aerial application of ripeners can also be managed so drift outside the crop area is
minimised. Unlike herbicides, it is not necessary to apply ripeners to all areas of the field.
Where necessary problems with spray drift from chemical ripeners can be minimised by
leaving an unsprayed margin on the outsides of the field. Fusilade®, for an example, is
toxic to aquatic life, however its entry into waterways and riparian areas can be avoided by
ensuring unsprayed margins are maintained between these areas to prevent entry into these
sensitive environments.
Residue testing for fluazifop-p butyl performed for preliminary trials conducted at Kalamia
in 1999 failed to detect any residues within the cane juice, four weeks after cane was treated
with 300 mL/ha for Fusilade® (212 g/L a.i).
2.11 Conclusion Chemical ripeners can increase the accumulation of sucrose in the sugar cane stem when
applied under the right conditions. The conditions required for successful application have
become clearer in recent years primarily through research in South Africa.
Much of the research undertaken shows that it is not easy to obtain meaningful results from
ripener trials. The errors associated with trials are often greater than the small differences
being tested for. It is particularly difficult to measure real differences in cane yields from
small plots following the application of ripeners (Julien 1977). Considerable care needs to
be taken with ripener trials to ensure that there adequate randomisation and replication
exists whilst ensuring that the environmental influences across treatments are as uniform as
possible. A great deal of past work has failed to achieve this.
Many knowledge gaps still exist despite a better understanding of the requirements for the
successful use of ripeners. For an example, much of the past South African work makes
reference to the importance of the physiological status of the sugar cane at the time of
44
application. An inverse relationship between purity at the time of application and the
observed response has been shown for Ethrel® but this less apparent for other ripeners.
Also, no work reports the correlation between growth rates before and after application with
the observed response. This should be investigated given the number of reports that state
this is an important determinant of the ripening response. Therefore, there is a need to
accurately measure such growth on small time scales around application time and also
correlate this with the observed response. The manufactures of ripeners that are also used
as plant growth inhibitors strongly emphasise that herbicidal success of these ripeners is
correlated with active growth at application. There are almost certainly linkages between
the successful use of these chemicals for herbicidal and ripening purposes and these should
be investigated.
Crop age and the time of application can determine the rate of growth when ripeners are
applied. There is a need to investigate the response to ripeners in crops of differing ages at
one application date. The effect of various application dates should also be investigated.
The observed responses should be correlated back to physiological growth at the time of
application as mentioned in the preceding paragraph.
Little is understood at a biochemical level about what signals are used by sugar cane to
determine how photosynthate is allocated either to sucrose or non-sucrose production. The
plant growth inhibitors (eg. glyphosate, fluazifop) inhibit all apical meristem activity and
the removal of these primary sinks affects the internal sink/source relationships so there is a
more favourable partitioning of photosynthate towards sucrose storage. However, it is
speculated that each of these inhibitors may affect the plant in many other ways, which also
increases the accumulation of sucrose. Further work needs to be done on investigating the
message mechanisms that determine how photosynthate is finally utilised in sugar cane and
where are these mechanisms located.
Another knowledge gap is the lack of information as to how important the genetic variation
in sugar cane is for the observed response to ripeners. One weakness of past research is that
it in most instances the gains from chemical ripening have not been fairly compared with a
control that has been dried off to maximise sugar yields. Drying off has been shown to
increase sugar accumulation and it is probably the most cost effective way for a grower to
ripen a crop where it is possible to do so. Most control treatments in past ripener trials have
been well irrigated because the ripener treatments require good growing conditions after
45
application to maximise yields. Growers require data that shows differences between what
they can currently attain with what is being investigated.
Before many of these knowledge gaps can be filled in, there is a need to first understand the
extent of varietal responses to the ripeners used. It has been suggested that the variation
may not be extensive but this needs to be verified by studies that assess the responses of
cane to ripeners under controlled environments. Confirmation that the differences due to
genetic variation are small would allow future research to focus more on understanding the
differences due to environmental factors. It would also allow future researchers to avoid
using varieties and varieties in certain environments that are known to be non-responsive to
ripeners. An understanding of these factors will add value to any future research
undertaken with this technology and avoid the pitfalls that plagued much of the past
research in this area.
46
Chapter 3
The responsiveness of Australian sugar
cane varieties to chemical ripeners early in
the year
3.1 Introduction Sugar content in cane on a fresh weight basis is an important determinant of the costs of
production of sugar and hence industry profitability. This is because major variable costs,
including harvesting, cane transport and some milling costs are strongly related to the
amount of cane involved. Normally cane is only harvested in that part of the year when
sugar content in cane is at its highest, and hence profitability is greatest. In Australia, sugar
content in cane is normally lowest from mid-summer to late autumn, and the harvesting
normally occurs between mid-winter and late spring (mid-June to November). There would
be potential economic advantages in beginning the harvesting period earlier to obtain
increased rates of return on harvesting and milling capital, but only if the sugar content in
the cane was sufficiently high.
Although researchers in Australia have examined chemical ripeners since the mid-1950’s
(Skinner 1956; Bieske 1970; Kingston et al. 1978), the adoption of this technology by
Australian industry has been limited. There are several reasons for limited adoption. First,
in most years, the bulk of the cane in Australia is harvested after maturing under cool, dry
conditions following May, and these conditions have been shown to be less conducive to
producing responses in the presence of chemical ripeners (How 1976). Second, many trials
conducted in the 1970’s (Chapman and Kingston 1977; Kingston et al. 1978) resulted in
responses that were variable and inconsistent, in part probably related to the timing of
application, but also due to other reasons not fully understood. Some of the factors that
affect response have since been identified including type of ripener or ripener combination
(Rostron 1985), time of application and crop maturity (Clowes 1978), application rate
(Donaldson 1989), and treatment harvest interval (Dusky and Alvarez 1986). A key factor
is also genotype (Dusky et al. 1986), but little knowledge exists of the responsiveness of
current Australian varieties to chemical ripeners
47
The aim of this study was to evaluate a large range of Australian sugar cane varieties for
responses to chemical ripeners. These varieties were tested at a single site where a number
of environmental and crop variables were managed to optimise the likelihood that the
observed responses were due to mainly to genotypic responses. This study represents a key
step towards understanding the interactions between ripener, variety and season, and to
determine if and how chemical ripeners could be used to improve the sucrose content and
profitability of early-harvested cane in the Australian industry.
3.2 Materials and Methods
3.2.1 Experimental design
The experimental design followed a split plot in space and time (Steel and Torrie 1980).
Five chemical ripener treatments were applied to whole plots allocated at random to each of
five blocks. Forty-three sugar cane cultivars were allocated at random to subplots within
each whole plot. The varieties included commercially-grown cultivars and selections from
advanced stage selection trials in breeding programs from the Northern, Burdekin and
Central cane growing regions of Queensland (Table 3.1) and represented 85.9 % of all cane
supplied to Australian mills in 2001 (Bureau of Sugar Experiment Stations 2002). The
experiment was planted on 11 Aug. 1999 at Kalamia Estate, Ayr (147.412759E, -
19.536277S). Each variety was planted into single row plots 4 m in length. There were 44
plots in each of the whole plot treatments, consisting of one plot of each variety and two
plots of variety Q124.
The Fusilade® and Verdict® treatments included the non-ionic wetting agent Agral 60® at
350 mL/ha and 200 mL/ha of spray solution respectively. The combination treatment (E+F)
involved the application of Ethrel® followed about four weeks later by an application of
Fusilade®. The Ethrel® application was applied on 8 March 2000 and all the other ripeners
were applied 30 days later on the 7 April 2000. All the ripeners were applied from the
ground as a 3 m swath by a liquid petroleum gas (LPG) powered, overhead-spray boom.
This operated at 100 kPa and the spray solution was applied at 100 L/ha. The average stem
height to the top visible dewlap of all the varieties in three of the five replicates was 2.67 m
on 23rd March 2000.
The ratoon crop was slashed to ground level on the 11 October 2000 to prevent lodging in
2001.
48
Table 3.1: List of varieties examined for their responses to chemical ripeners in 2000 and
Y = observed yield (ie. brix, pol, purity, etc) of the ith treatment for the jth variety in the
kth block in the mth year for the nth sampling date
μ = the overall mean
53
bk = effect of kth block, k=1…5
ti = effect of the ith ripener treatment, i=1…2
(bt)ik = effect of the kth block within the ith treatment (error one)
gj = effect of the jth variety, j=1…43
(tg)ij = interaction effect between treatment and variety,
(gb)ijk = interaction effect between the jth variety and the ith treatment within the kth
block (error 2)
cm = effect of the mth crop-year, m=1…2
dn = effect of the nth sampling-date, n=1…3 for E+F treatment, n=1…2 for glyphosate
treatment
(cd)mn = interaction effect between the mth year and the nth sampling-date
(cd)mnk = interaction effect between the mth year and the nth sampling date within the
kth block (error 3)
(tc)im = interaction effect between ith treatment and the mth year
(td)in = interaction effect between ith treatment and the nth sampling-date
(tcd)imn = interaction effect between ith treatment, the mth year and the nth sampling-
date
(cd)mnki = interaction effect between the mth year and the nth sampling date within the
kth block and ith treatment (error 4)
(gc)jm = interaction effect between jth variety and mth year
(gd)jn = interaction effect between jth variety and nth sampling date
(gdc)jnm = interaction effect between jth variety, the nth sampling date and the mth year
(gtc)jim = interaction effect between jth variety, the ith treatment and the mth year
(gtd)jin = interaction effect between jth variety, the ith treatment and the nth sampling
date
(gtdc)jinm = interaction effect between jth variety, the ith treatment, the nth sampling
54
date and the mth year
eijkmn = random subplot error (error 5)
Formulae for the calculation of standard errors between means were derived from Steel and
Torrie (1980) with modification of the divisor to account for time factors (i.e. sampling
date, year) where appropriate.
3.3 Results 3.3.1 Seasonal differences between 2000 and 2001 Seasonal conditions for ripening in 2001 were better than in 2000 with the pol and purity in
the control treatment both being higher in 2001 than in 2000 at all times of measurement
(Table 3.4).
Table 3.4: Mean pol (%) and purity (%) across all varieties in the control treatment in 2000
and 2001.
Attribute Year Month
March April May June
Pol (%) 2000 5.72 9.56 13.54 16.70
2001 8.67 11.75 17.05 19.84
SE 1.59 1.38 2.48 2.09
Purity (%) 2000 52.71 69.53 81.12 87.72
2001 65.31 72.77 85.35 91.53
SE 4.83 5.38 4.15 1.58
3.3.2 Main effects of ripeners
There were significant (P≤0.01) overall effects on brix, pol and purity from the E+ F
combination treatment and glyphosate treatment (Table 3.5). No significant effects of
Fusilade® alone or the Verdict® treatment were observed. Further discussion therefore
focuses on the results from the other treatments.
55
Table 3.5: Analyses for significance for various ripener treatment (R), variety (V), date (D)
and year (Y) interactions. Analysis is based on data collected for the E+F and glyphosate
treatments during the months of May and June for the years 2000 and 2001. May =
treatment harvest interval (THI) of 4 weeks, June = THI of 8 weeks.
Level of Significance1
Ethrel®+ Fusilade® Glyphosate
Source of
Variation
d.f. Brix
Pol
(%)
Purity
(%)
d.f. Brix Pol
(%)
Purity
(%)
Main Plots
Ripener
Treatment (R)
1
**
**
**
1
**
**
**
R x Year (Y) 1 ns ns ns 1 ** ** **
R x Date (D) 1 * * * 1 ns ns ns
R x Y x D 1 ns ns ns 1 ns ns ns
Sub Plots
Variety (V) 41 ** ** ** 42 ** ** **
V x R 41 ** ** ** 42 ns ns ns
V x R x Y 41 * ns * 42 * ** *
V x R x D 41 ns ns ns 42 ns ns ns
V x R x D x Y 41 ns ns ns 42 ns ns ns 1 ns = not significant, * = P≤0.05, ** = P≤0.01, P =0.0515
3.3.3 Main effects of Ethrel® + Fusilade® Averaged across all varieties and both years, the application of Ethrel® increased brix, pol
and purity four weeks after the application (Figure 3.2). The difference between the ripener
treatment and the control treatment increased further following the application of Fusilade®
in April. By early May, the response increases relative to the control treatment were 1.12 %
units for brix, 1.46 % units for pol and 2.78 % units for purity.
56
10
14
18
22
March April May JuneSampling Month
o Brix
(a)
6
10
14
18
March April May JuneSampling Month
Pol (%)
(b)
57
55
65
75
85
95
March April May JuneSampling Month
Purity(%)
(c)
Figure 3. 2: Effects of combined Ethrel® and Fusilade® treatment (⎯ ⎯) relative to the
control plots (⎯ ⎯) averaged across years (2000 and 2001) for (a) brix, (b) pol and (c)
purity. Capped vertical lines represent l.s.d. at P=0.05 for treatment comparisons within
each month.
There was no significant treatment x year interaction found in an analysis of the E + F and
control treatment plots for brix, pol or purity, despite the different weather and crop
maturity from March to May between years. An analysis of the data for the months of May
and June across years showed that significant treatment x date interaction (P≤0.05) occurred
for brix, pol and purity occurred (Table 3.5). The mean pol % response for all varieties in
May was 1.47 units (l.s.d. (P=0.05) = 0.30 pol %) compared to 0.95 units for June. It is not
known whether the increased response to the Ethrel® and Fusilade® treatment in May
compared with June was due to the Ethrel® effects alone or the result of an additional effect
of Fusilade® following its application.
3.3.4 Main effects of glyphosate Averaged across years and varieties for May and June, the mean brix, pol and purity of the
plots treated with glyphosate were 0.83, 0.93 and 1.14 % units higher respectively than the
control plots. There was no ripener treatment x date interaction identified from an analysis
of the glyphosate and control treatment plots for the months of May and June across both
years, indicating similar responses at four-weeks and eight weeks after glyphosate
58
application. Unlike the E + F treatment, there was a significant ripener x year effect (Table
3.5). Averaged across all varieties, pol in the glyphosate treated plots was 1.37 % units
higher than in the control plots in 2000 but in 2001 the gain in pol was only 0.52 % units
(Figure 3.3).
16
18
20
22
2000 2001Year
o Brix
(a)
14
16
18
20
2000 2001Year
Pol(%)
(b)
59
80
82
84
86
88
90
2000 2001Year
Purity(%)
(c)
Figure 3.3: Effects of glyphosate application (dotted columns) in 2000 and 2001 on (a)
brix, (b) pol and (c) purity, averaged across all varieties and across the May and June
samplings relative to the control (blank columns). Capped vertical lines represent l.s.d. at
P=0.05 for treatment comparisons within each year.
3.3.5 Variation among varieties for response to ripeners The analysis of variance results in Table 3.5 showed significant (P≤0.01) differences among
varieties for pol overall. The average control treatment pol % for May and June in 2000
and 2001 ranged from 14.63 for Q113 to 19.12 for Q176A.
There were significant (P≤<0.05) increases in pol for 31 of the 42 varieties tested to the
Ethrel® + Fusilade® treatment (Figure 3.4). Varieties that were very responsive to this
treatment included Q117 (2.31 pol % increase) and Q127 (2.01 pol % increase), the two
commercially most important varieties in the Burdekin region which both have high CCS
early in the harvesting season.
60
123
4
5
6
7
8
9
10
11
12
13
14
15
16
17
19
20
21
22
23
2425
26
27
28
29
30
31
3233
34
35
36
37
3839
40
41
42
43
14
15
16
17
18
19
20
14 15 16 17 18 19 20
Pol % for control treatment
Pol
% fo
r Eth
rel +
Fus
ilade
trea
tmen
t
Figure 3.4: Pol % for varieties in control treatment and the Ethrel® + Fusilade® treatment,
based on averages across May and June in 2000 and 2001. Numbers represent data points
for varieties (Table 3.1). Capped vertical lines represent l.s.d. at P=0.05 for treatment
comparisons between the variety data point and the corresponding point for the control
given on the 1:1 ratio line (⎯).
No variety x ripener treatment interaction was observed from an analysis of the glyphosate
and control treatment plots for May and June across years. However separate analysis for
results from 2000 alone showed a significant (P≤0.05) ripener x variety interaction.
Twenty-five varieties showed significant pol increases to glyphosate in 2000 (Figure 3.5).
No significant ripener x variety interaction for glyphosate occurred for the 42 varieties
tested in 2001.
61
No correlation was apparent between ripener response to E+F and the pol level for the
untreated plots (Figure 3.4), and similarly with respect to glyphosate (Figure 3.5). This
clearly suggests that in general, high pol varieties can respond equally as well as low pol
varieties to these ripener treatments.
1
23
4
5
6
7
8
9
10
11
12
13
14
15
16
17
18
19
20
21
2223
24
25
26
27
28
29
30
31
32
33
34
35
36 37
3839
40
41
4243
12
13
14
15
16
17
18
19
20
12 13 14 15 16 17 18 19 20
Pol % in control treatment
Pol
% in
gly
phos
ate
treat
men
t
Figure 3.5: Pol % for glyphosate treated varieties averaged for May and June 2000.
Numbers represent data points for varieties (Table 3.1). Solid line represents the 1:1 ratio.
Capped vertical lines represent l.s.d. at P=0.05.
62
1
2
3
45
6
7
8
9
10
11
12
13
14
15
16
17
19
20
21
22
23
24
25
2627
28
29
30
31
32
33
34
35
36
37
38
39
40
41
42
43y = 0.36x + 0.63
r2 = 0.15
-1
0
1
2
3
0 1 2 3 4 5
Average pol % response to glyphosate for May and June in 2000
Ave
rgag
e po
l % re
spon
se to
E+F
for M
ay a
nd J
une
in 2
000
Figure 3.6: Varietal pol % responses for E+F treated varieties averaged for May and June
in 2000 compared to those for glyphosate. Numbers represent data points for varieties
(Table 3.1). Capped vertical and horizontal lines represent l.s.d. at P=0.05.
No relationship was evident between the response of varieties to E+F for pol and responses
to glyphosate in 2000 (Figure 3.6). This suggests that the initial modes of action of the
ripeners are not the same.
No significant interaction effects for variety x ripener x sampling date and variety x ripener
x sampling date x year were observed for either E+F or glyphosate (Table 3.5).
63
3.3.6 Variation between years for relative response of varieties to ripeners There was significant treatment x variety x year effects for pol % from an analysis of the E
+ F and control plots (P≤0.05) and the glyphosate and control plots (P≤0.01) (Table 3.5).
The varieties Q162 and Q124 showed contrasting responses to the E+F treatment across
seasons with significantly better (P≤0.05) pol % responses in the drier 2001 season (Figure
3.7). However, most varieties performed reasonably consistently in response to the E+F
treatment across years, particularly Q120, Q117, Q166A, Q180A, Q181A, Q186A and TellusA.
The variety Q136 gave consistently poor pol % responses across years that were close to
zero or negative whilst Q117 gave consistently good responses that were greater than 2.0
pol %.
43
42
41
40
3938
37
36
3534
33
32
31
30
29
28
27
26
25 24
23
22
21
20
19
17
16
15
14 13
12
11
10
9
8
7
6
5
4
32
1
-1
0
1
2
3
-1 0 1 2 3
Pol % response to E+F for May and June in 2000
Pol
% re
spon
se to
E+F
for M
ay a
nd J
une
in 2
001
l.s.d. (P =0.05)
l.s.d. (P =0.05)
1:1 line
Figure 3.7: Pol % responses of varieties to E + F treatment averaged across May and June
in 2000 and in May and June 2001. Numbers represent data points for varieties (Table 3.1).
64
Most varieties responded less to glyphosate in 2001 compared with 2000 (Figure 3.8).
While varieties Q138, Q162, Q163A and Q186A responded similarly across years to
glyphosate, there were 13 varieties for which responses were significantly less (P≤0.05) in
the 2001 season, which was characterised by seasonal conditions favouring natural ripening.
The varieties Q96, Q141, Q166A, Q180A and TellusA all showed significantly reduced
responses (P≤0.01) of more then 2.0 pol % in the 2001 season. The variety Q163A gave
consistently low responses of 0.3 pol % across years whilst Q135 gave consistently high pol
% responses of 2.81 units in 2000 and 1.68 units in 2001.
43
42414039
38 37 36
35
34 3332
31
3029
28
27
26
25
24
23
22
21
20
19
1817
16
15
14 1312
11
10
9 87
6
5
432
1
-2
-1
0
1
2
3
4
5
0 1 2 3
Pol % response to glyphosate for May and June in 2000
Pol
% re
spon
se to
gly
phos
ate
for M
ay a
nd J
une
in 2
001
4
1:1 line
l.s.d. (P =0.05)
l.s.d.(P =0.05)
Figure 3.8: Average varietal pol % responses to glyphosate treatment for May and June in
2000 compared to the responses seen in 2001. Numbers represent data points for varieties
(Table 3.1).
65
3.3.7 The residual effect of glyphosate on the following ratoon crop Counts of shoot emergence on the 12 September 2000 and stalk density on the 6 March
2001 found on average, ripener treatments did not significantly affect shoot or stalk
numbers. However, there was a significant ripener treatment x variety interaction (P≤0.05)
for an analysis of glyphosate and control treatment plots, indicating that the extent of the
carry-over effects on the following ratoon crop was variety dependent (Figure 3.9).
Glyphosate applied in the plant crop reduced the mean shoot/stalk numbers for the variety
Q152 in the ratoon crop, but had no significant impact on Q158, Q135 or Q96. Stalk
numbers were less for the other varieties in the ratoon crop following application of
glyphosate but large variations with the stalk count data across replicates meant this
experiment lacked power to show statistically significant differences for moderate
differences in stalk numbers.
Stalk count data also showed a significant variety by treatment by date interaction (P≤0.05)
indicating that the effect of glyphosate on the rate of ratooning of different varieties was not
consistent across time. It was decided to monitor the residual effects from the 2000
glyphosate treatment in the 2001 season. Plots treated with glyphosate the previous year
were sampled in March, April, May and June 2001. The mean pol for all varieties (Q113
was omitted since it failed to emerge in some of the ratoon plots) in plots previously treated
with glyphosate was significantly reduced (P≤0.05) to 13.93 % compared to 14.34 pol % in
the control treatment. A highly significant (P≤0.01) variety x ripener treatment interaction
for brix, pol and purity indicated that some varieties were more adversely affected than
others by glyphosate applied in the previous season (Table 3.6). Adverse carry-over effects
on the pol of varieties like MidaA and TellusA were detected whilst similar effects were
negligible for varieties like Q141 and Q195A (Figure 3.10). This suggests it may be
possible to select varieties that can tolerate annual applications of glyphosate, provided that
the effects on population and pol are consistent within varieties. The variety x ripener
treatment x date interactions for brix and pol were non-significant but significant (P≤0.05)
for purity, suggesting that the carry-over effects on purity in some varieties varies with
time.
66
0
20
40
60
Q96 Q117 Q120 Q127 Q135 Q152 Q158
Variety
Num
ber s
hoot
s/st
alks
Figure 3. 9: Mean shoot and stalk numbers for varieties in the glyphosate (dotted columns)
and control (blank columns) treatment. Counts were done for a two-metre section of each
plot in the first ratoon crop on the 12 Sep. 2000 and 6 March 2001 for a subset of 7 varieties
(Q96, Q117, Q120, Q127, Q135, Q152 and Q158). Capped vertical lines represent l.s.d. at
P=0.05 for treatment comparisons within each variety.
Table 3.6: Analyses for significance for ripener treatment (R), variety (V) and date (D)
interactions related to the carry-over effects of glyphosate on the brix, pol and purity of
varieties in the following season. Analysis is based on data collected for the 2000
glyphosate treatment during the months of March, April, May and June for 2001.
Level of significance1 Glyphosate carry-over effect in 2001 Source of Variation d.f. Brix
Pol (%)
Purity (%)
Main Plots Ripener Treatment (R) 1 ns * ** R x Date (D) 3 ns ns ns Sub Plots Variety (V) 41 ** ** ** V x R 41 ** ** ** V x R x D 123 ns ns *
1 ns = not significant, * = P≤0.05, ** = P≤0.01
67
10
12
14
16
18
MIDA Q96 Q117 Q127 Q141 Q183 Q189 Q195 TELLUS
VARIETY
Pol(%)
Figure 3.10: The effect of glyphosate (dotted columns) applied in 2000 on the mean pol for
samplings in March, April, May and June 2001 compared to the control treatment (blank
columns). A highly significant (P≤0.01) variety by treatment interaction was identified and
some contrasting varietal responses are shown. Capped vertical lines represent l.s.d. at
P=0.05
3.4 Discussion The purpose of the research was to evaluate the responses of varieties to ripeners across
seasons and to examine the interactions between ripener, variety and season. Although the
literature highlights large variations in ripening responses across environments, this study
was deliberately designed to test varieties in environmental conditions and physiological
states that maximize the likelihood that the responses observed were due mainly to
genotypic differences. For this reason, multiple sites or environments were not considered
necessary. The study also focused mostly on the responses observed in the cane juice and
no attempt was made to measure concurrent effects on cane yield. The starting hypothesis
that some Australian sugar cane varieties are responsive to ripeners was clearly supported
by the results for two of the four ripener treatments tested. The results showed that either
E+F or glyphosate have potential to improve the quality of the cane juice in cane destined
for harvesting in May or June in many Australian sugar cane varieties. Variety, the type of
ripener, season and treatment-harvest interval were all found to have affected, either
individually or in interaction with each other, the responses seen for brix, pol and purity. In
68
most instances, the responses would generate financially attractive returns to Australian
growers, provided there were not large negative impacts on cane yield. The responses
suggest a potential commercial role for these ripeners in north Queensland and support
further research using any of a wide range of varieties to investigate the repeatability of the
effects on CCS, and effects on cane yield, across a range of environments.
The E+F treatment provided the most consistent responses in across years, but some
varieties responded better than others (Figure 3.4). Averaged across both years, 31 of the
42 sugar cane varieties tested showed responses in brix, pol and purity that were significant
(P≤0.05) and potentially economically important. The five most responsive varieties to this
treatment showed a mean pol increase for May and June across years of 2.04 % and
included two major Burdekin varieties, Q117 and Q127 (Table 3.7). Both these varieties
already have high CCS and are suited to early harvest. Table 3.6 also shows that the mean
cost benefit ratio for these five varieties to this ripener treatment was around 1:5.0,
indicating substantial opportunities are available for growers to increase the profitability of
some early harvested crops. These estimates assume that ripeners have no significant,
adverse effect on cane yield, a reasonable assumption that is supported by South African
findings providing the treatment-harvest is not excessively delayed.
The optimum treatment harvest interval for all varieties to E+F was about 4 weeks after the
application of the Fusilade® in April. The mean pol response in all varieties decreased if
harvesting was delayed to 8 weeks after application of Fusilade® (Figure 3.2(b)). Whilst
most varieties responded consistently to this ripener treatment, some did not. Q124 and
Q162 recorded significantly better (P≤0.05) responses in 2001 compared to 2000 (Figure
3.7). The reasons for the poor responses of these varieties in 2000 may be related to the
susceptibility of these varieties to orange rust disease (Puccinia kuehnii) and the high
incidence of the disease in 2000 when environmental conditions favoured this pathogen.
Q124 is highly susceptible to orange rust disease whilst Q162 is moderately susceptible.
Diseases have been reported to adversely affect ripener responses (Martin 1980;
Soopramanien et al. 1984).
Glyphosate gave similar overall responses in pol as the E+F treatment in 2000, but again
some varieties responded better then others. The results showed that across years however,
the mean overall response to glyphosate varied significantly (Figure 3.8), in contrast to the
more consistent overall responses to the E+F treatment (Figure 3.7). The overall glyphosate
69
responses were smaller in 2001 when the conditions better favoured natural ripening. The
responses of 13 varieties in 2001 were significantly less (P≤0.05) compared to those seen
for the same varieties the previous year. This suggests the usefulness of this ripener may be
limited to some varieties in some years. The overall mean pol response for the five most
responsive varieties in May and June across years was 1.79 % below that for the E+F
treatment (Table 3.7), but potentially still financially attractive (depending on cane yield
effects) to growers given that the application costs are nearly half that for the E+F
treatment. Unlike the E+F treatment, the mean responses of all varieties to glyphosate at 4
and 8 weeks after application were similar with no significant interaction between ripener
treatment and date (Table 3.5). This suggests an optimum treatment harvest interval does
not generally apply for glyphosate if the crop is to be harvested at either 4 or 8 weeks
following application in early April. It is possible that an optimum treatment harvest
interval exists between these two dates but we were unable to ascertain this.
Table 3. 7: Estimated cost: benefit ratios found for the top 5 responsive varieties in 2000
and 2001 to ripener treatments.
Treatment Variety Estimated
Cost/ha ($A)
Pol (%) CCS1 Net profit2
(A$/ha)
Cost: Benefit
ratio
E + F Q117 $100 +2.31 +2.12 572 1:5.7
“ Q173A “ +2.08 +1.92 518 1:5.2
“ Q127 “ +2.01 +1.81 489 1:4.9
“ Q135 “ +1.93 +1.79 483 1:4.8
“ Q195A “ +1.88 +1.68 453 1:4.5
” All varieties ” +1.21 +1.12 302 1:3.0
Glyphosate Q135 $40 +2.25 +2.08 561 1:14
“ TellusA “ +1.91 +1.65 446 1:11
“ Q117 “ +1.72 +1.53 413 1:10
“ Q113 “ +1.57 +1.37 370 1.9.2
“ CP74-2005 “ +1.52 +1.34 362 1:9.0
All varieties “ +0.96 +0.84 227 1:5.7 1 Commercial cane sugar, assuming a fibre value of 11% 2 Assumes sugar price to grower = A$250 tonne, harvesting costs = $6.00 tonne, assorted levies = $1.10 tonne,
crop yield is unaffected at 120 tonnes per hectare and the CCS of untreated cane is 12 units.
This study found glyphosate had an adverse carry-over effect on the pol and purity of
varieties in the 2001 ratoon crop following treatment in the 2000 plant crop. Negative
impacts on the stalk weights and populations of some varieties following the application of
70
glyphosate in the previous ratoon have also been reported in the USA (Millhollon and
Legendre 2000). However, unlike this study, they did not find any adverse carry-over
effects on sugar quality, possibly because of the small number of cultivars examined. The
USDA recommends that glyphosate be only used on crops that are not going to be ratooned
(Gilbert et al. 2002). Our study also showed that the negative carry-over effect of
glyphosate were variety specific, with some varieties not affected at all by the application of
glyphosate in the previous ratoon crop. Other researchers have also reported that the carry-
over effects of glyphosate were variety specific (Clowes and Inman-Bamber 1980;
Millhollon and Legendre 2000). Glyphosate could therefore be potentially recommended
for use on tolerant varieties in all crop classes or just on crops to be ploughed out in the case
of varieties that showed negative carry-over effects.
The results found in this study on Australian sugar cane varieties are generally consistent
with South African reports regarding E+F as being the best, consistent treatment
(Donaldson 1994) and USA work on the inconsistency of the responses seen to glyphosate
with season (Dusky et al. 1986; Legendre and Finger 1988). Research in Hawaii suggested
that maximum responses to glyphosate occurred when minimum temperatures were above
15.5˚C and 50 to 100 mm of rainfall occurred during the ripening period (How 1976). These
conditions occurred in April and May 2000 but not for the same period in 2001. Our study
indicates that decisions on the type of ripener to use could depend on the type of season
likely to occur during the two to three months before harvest. Climate prediction data using
cluster analysis of SOI data to predict the probability of rainfall in the March to May quarter
leading up to harvest is available from “The Long Paddock” website (DPI/DNR 2000) and
it would have been effective in predicting the best type of ripener to use in the Burdekin
during 2000 and 2001 seasons. For an example, the probability of exceeding the median
rainfall in the Burdekin region during the March to May quarter in 2000 was predicted at
60-80% whilst for the drier 2001 season, it was predicted to be around 50%. Whilst the SOI
predicts rainfall probabilities, it is unlikely rainfall is the driving factor affecting natural
ripening in the Burdekin in the March to May quarter since the crop is grown is grown
under irrigation. More likely, it is the associated temperature with rainfall (or lack of) that
determines the amount of natural ripening occurring. For an example, dry periods in the
March to May period in the Burdekin are often associated with cooler temperatures,
particularly at night. The converse is true for wetter seasons.
71
We were surprised not to find any significant increases in brix, pol or purity after Fusilade®
treatment in 2000 or 2001 given Fusilade® was applied at the rate of 200 mL/ha as
recommended by the South African Industry (South African Sugar Association 1998).
However, significant responses were obtained in an adjacent experiment that assessed the
responses of 20 varieties treated with Fusilade® in March 2000 at a higher rate of 300
mL/ha (McDonald et al. 2001). This finding suggests that the optimum rate of Fusilade®
alone on most Australian varieties will be higher then 200 mL/ha.
There were three limitations with the research reported in this chapter, which should be
addressed in future research. Firstly, the results reported are only for one location over two
years. It is possible that the responses recorded would not be repeated or be of different
magnitudes under different environmental conditions. However, under conditions
considered to be favourable for chemical ripener responses we were able to show that most
Australian varieties have a potential to respond to ripener application. Important
commercial varieties identified in this study as showing the biggest responses to ripeners
would be candidates for future research to evaluate the repeatability of responses across
different environments. Secondly, no measurements were made on the concurrent effects of
these ripeners on cane yield. This must be investigated in further work before
recommendations for commercial use could be considered. Overseas work however
suggests that adverse effects on cane yield are negligible and offset by the overall gains in
sugar yield in tonnes per hectare providing harvesting occurs within the optimum treatment-
harvest interval. Thirdly, this work was unable to discern between the responses to either
Ethrel® or Fusilade® in the E+F treatment. Future work should include an Ethrel® alone
treatment in addition to Fusilade® alone so the individual contributions of each ripener
could be ascertained.
72
Chapter 4
Physiological traits associated with ripening
4.1 Introduction Most previous work with chemical ripeners in sugar cane has not examined physiological
traits that could be useful predicting crop types that are likely to give a response. This is
surprising given the prevalence in the literature of marginal and inconsistent responses
associated with use of chemical ripeners. Studies in Australia in the 1970’s with glyphosate
and Ethrel® encountered such problems (Kingston et al. 1978). Consequently, the adoption
of this technology in Australia has been relatively small compared to other countries where
continued research has identified crop factors associated with chemical ripening responses.
Extensive South African research since the 1970’s identified a number of crop conditions
that adversely affect ripening responses (Donaldson 1996b). Factors such as crop age,
disease, and lodging have all been shown to affect responses. Other reports have also
shown linkages between purity at application and response (Rostron 1973, Kingston 1988).
Green leaf numbers at application have also been mentioned as another factor (South
African Sugar Association 2002a, James 1999) but no quantitative data has been found in
the literature to substantiate this claim.
The aim of this research presented in this chapter is to identify trait differences among
varieties that could predict their relative response to glyphosate.
73
4.2 Method 4.2.1 Experimental design The study described in this section was conducted between April and June 2001. The same
experimental trial was used as described in the previous chapter for 2001. Six varieties
were chosen, comprising three responsive and three non-responsive, selected on the basis of
data obtained in the 2000 plant crop to glyphosate. The three responsive varieties were
Q113, Q135 and TellusA. The non-responsive varieties were Q167A, Q179A and Q186A.
Common parentages were shared by Q113 and Q135 and also by Q167A and Q179A (Table
3.1).
4.2.2 Measurements Samples consisting of four stalks were taken from each plot of the control and glyphosate
treatments on the 2nd April 2001, just prior to the application of glyphosate. These, and
later samples, were in addition to those described in the previous chapter. Total dead leaf
and green leaf node numbers were counted for each stalk and an average count for four
stalks was obtained for each sample. Green leaf numbers were obtained by counting down
the stem from the spindle leaf (spindle leaf = leaf number 1; Clements and Ghotb 1969) to
the last visible green leaf. Dead leaf numbers were obtained by counting the total remaining
node numbers down to where the stem was cut at ground level. The leaf node ratio (LNR)
was calculated by dividing the green leaf node number by the dead leaf node number. Cane
stalks were then topped at the natural breaking point and then measured and an average
length for four stalks estimated. Each sample was then separated into bottom, middle and
top stem sections. The top and bottom stem sections consisted of 50 cm of cane taken from
each respective end. The middle stem section consisted of all stem material in between the
bottom and top stem sections. Each stem section sample was then measured for brix, pol,
fibre, dry matter and total weight. Data collected from the stem partition samples was used
to calculated weighted averages for whole stalk values. Dry matter was measured by taking
a 200 g sub-sample and drying it in an 850 mL aluminium tray in a forced draft oven for
one week at 60˚C. The same sampling procedure was applied again to the same plots in the
trial when the treatment harvest interval (THI) was four (10 May 2001) and eight (7 June
2001) weeks after application of the glyphosate.
The estimation of commercially extractable sucrose in cane juice involves measurement of
brix and pol is described in the previous chapter. Both were measured on a % juice basis.
Cane juice was obtained from cane stalk samples by processing the stem sections through a
The pol/DM ratio was calculated by dividing pol (% juice) by the dry matter %.
Stem elongation data measured in-situ in 2000 was collected by tagging two stalks in each
plot for all the treatments for 3 of the 5 replicates. Stalk length was then measured on the
23 March 2000, 7 April 2000 and 4 May 2000 to give a before and after application
estimate of stalk elongation for each variety.
4.2.3 Data analysis Data was analysed using the PROC GLM procedure in the SAS statistical package (SAS
ver. 8.00, SAS Institute Inc. Cary, NC 27513). The statistical model used for analysing
each trait followed that of a split plot in space and time (Steel and Torrie 1980).
Formulae for the calculation of standard errors between means were derived from Steel and
Torrie (1980 Table 16.2).
4.3 Results 4.3.1 The selection of ripener type Both glyphosate and the E+F treatment had significant variety by treatment effects for pol
in 2000 (c.f. chapter 3). In addition, varieties tested in 2000 showed a greater range of
responses to glyphosate compared to the E+F treatment (Figures 3.7 and 3.8). The mean
pol response for all varieties in May and June to glyphosate in 2000 was also slightly higher
at 1.39 % units compared to 1.17 % units for E+F treatment. On the basis of this
information, it was decided to use glyphosate in 2001 as a ripener to test two varietal
populations that had contrasting responses to this ripener in 2000.
75
4.3.2 The selection of responsive and non-responsive varieties from small mill data obtained in 2000. The responses for pol of the three varieties chosen to represent the responsive group,
(shown in red) and the three varieties chosen represent the non-responsive group (shown in
blue) to glyphosate in 2000 are indicated in Figure 4.1. The responsive varieties included
Q113 (8), Q135 (16) and TellusA (43) whilst the non-responsive varieties included
Q167A(27), Q179A(34) and Q186A(38).
43
16
8
42
41
40
3938
3736
35
34
33
32
31
30
29
28
27
26
25
2423
22
21
20
19
18
1715
14
13
12
11
10
9
7
6
5
4
3 2
1
12
14
16
18
20
12 14 16 18 20
Pol % in control treatment
Pol %
in g
lyph
osat
e tre
atm
ent
Figure 4.1: Pol % for glyphosate treated varieties averaged for May and June 2000 showing
the selected responsive varieties in red and the non-responsive varieties in blue. Numbers
represent data points for glyphosate treated varieties (Table 3.1). The solid line is the 1:1
ratio; Capped vertical line represents l.s.d. at P=0.05 for the varietal response to glyphosate.
4.3.3 Small-mill, whole stalk, pol responses seen in 2001 compared to 2000
The pol responses to glyphosate treatment in the cooler 2001 season were not as great as
they were the previous year. Each group ranked as expected based on the 2000 data, but the
only varieties in each of the response-type groups that differed significantly were Q167A
and Q135 (Figure 4.2).
76
Q167
Q179Q186Q113
Q135
TELLUS
-1
0
1
2
3
0 1 2 3 4
Pol % response in 2000
Pol %
resp
onse
in 2
001
Figure 4.2: A comparison between years of the small mill pol responses for whole stalk
samples of the selected responsive (red) and non-responsive (blue) varieties. Capped
vertical line represents l.s.d. at P=0.05 for treatment responses between varieties in 2001.
Capped horizontal line represents l.s.d. at P=0.05 for treatment responses between varieties
in 2000.
4.3.4 A comparison of the small mill and carver press data obtained in 2001 The small mill method was used to measure pol in the varieties tested for responsiveness to
glyphosate in 2000. This method is fast and economical compared to the Carver press
method so it was used to process the large number of samples involved (1150 per sampling
occasion) in 2000. The six responsive and non-responsive varieties were then identified
and tested in 2001 using the slower, more resource intensive Carver press method that
provides fibre and dry matter estimates in addition to pol. However, it was necessary to
confirm that the two techniques used had not confounded the data by significantly altering
the relative pol of the varieties measured.
An analysis of variance for values collected in April, May and June showed that pol
estimates using the small mill method were biased upwards compared to the Carver press
method (Figure 4.3). However, no significant variety by process interaction occurred
(Table 4.1). This means that the processes used had no significant effect on the relative
rankings of the varieties tested for pol and it suggests the small mill method used in 2000
77
was an appropriate process for screening varieties for further testing in 2001 using the
carver press method.
0
5
10
15
20
25
April May June
Who
lest
alk
pol %
Figure 4.3: Process comparison of hydraulic press (closed symbol) vs. small mill (open
symbol) of the average whole stalk pol % for all varieties in the control and glyphosate-
treated plots for April, May and June. Capped vertical lines represent l.s.d. at P=0.05 for
process comparisons within each month.
Data discussed below (with the exception of section 4.3.10 – “Other traits and glyphosate
response”) is associated with the research associated with or done via the Carver press
method.
4.3.5 Plant growth responses to glyphosate An analysis of all six varieties showed glyphosate did not affect either the average, whole
stalk fresh or dry weights compared to the untreated control. However, treatment
differences were seen for stalk length and stalk fresh weight when the data was analysed
according to the response type groups.
78
Table 4.1: Mean square estimates for pol in April, May and June 2001. Process refers to
either the small mill method or the Carver press method.
Mean squares
Treatment Source df April May June
Control Process 1 20.11 17.72* 41.48**
“ Process (block) 8 4.40** 2.16* 1.77
“ Variety 5 18.75** 12.05** 5.92**
“ Variety x Process 5 1.35 0.22 1.92
“ Error 2 40 1.26 0.73 1.27
Glyphosate Process 1 18.11 3.72 18.24**
“ Process (block) 8 3.88* 1.22 1.37*
“ Variety 5 16.93** 15.4** 11.97**
“ Variety x Process 5 0.84 1.11 0.83
“ Error 2 391 1.55 1.06 0.48 1 40 for the May sampling, * = P≤0.05, ** = P≤0.01
4.3.5 (a) Stalk length differences between treatments Average stalk length across all varieties in the glyphosate treated plots did not differ
significantly from the untreated plots (Figure 4.4). Both treatments made around 30 cm of
growth between April and May but stalk elongation ceased between May and June,
probably as a result of lower temperatures experienced (Figure 3.1).
79
180
200
220
240
260
April May June
Aver
age
stal
k le
ngth
(cm
)
Figure 4.4: Stalk length differences between the untreated plots (closed symbol) and
glyphosate treated plots (open symbol) for all varieties following application in April.
Capped vertical lines represent l.s.d. at P=0.05 for treatment comparisons within each
month.
4.3.5 (b) Effect of ripener application on stalk length By June, glyphosate had greatly reduced (P=0.05) the stalk length in the responsive group
of varieties compared to non-responsive varieties (Figure 4.5). The average difference in
stalk length between the control and glyphosate treated plots for the non- responsive group
was 22.4 cm greater then that for the responsive group.
80
-20
-10
0
10
20
April May June
Res
pons
e in
sta
lk le
ngth
bet
wee
n tre
atm
ents
(cm
)
Figure 4.5: Stalk length differences between the untreated and glyphosate treated plots for
the non-responsive group (closed symbol) and responsive group (open symbol) following
glyphosate application in April. Capped vertical lines represent l.s.d. at P=0.05 for
treatment comparisons within each month.
4.3.5(c) Fresh and dry weight differences between treatments Figures 4.6 and 4.7 show that growth rates for the glyphosate treated plots, as measured by
stalk fresh weight and stalk dry weight respectively, did not differ significantly from the
untreated plots. These Figures also show that stalk desiccation occurred between May and
June in both the treated and untreated plots. Analysis not presented shows increases in stalk
fresh weight for both treatments between April and May were significant but this was not
the case for April and June. However, stalk dry matters for June were significantly higher
compared to the April average.
81
800
900
1000
1100
1200
April May June
Milla
ble
fresh
wei
ght p
er s
talk
(g)
Figure 4.6: Stalk fresh weight of the untreated plots (closed symbol) and glyphosate treated
plots (open symbol) averaged across all varieties. Capped vertical lines represent l.s.d. at
P=0.05 for treatment comparisons within each month.
0
100
200
300
400
April May June
Milla
ble
stal
k dr
y w
eigh
t per
sta
lk (g
)
Figure 4.7: Stalk dry weights of the untreated plots (closed symbol) and glyphosate treated
plots (open symbol) averaged across all varieties. Capped vertical lines represent l.s.d. at
P=0.05 for treatment comparisons within each month.
82
4.3.5 (d) Stalk fresh and dry weight differences between response-type
groups
Glyphosate usually reduces growth so it was important to see, within the time frame
examined, whether the two response type groups differed in terms of their fresh and dry
weight responses to this treatment. Generally, no differences between the groups were seen
for either fresh weight (Figure 4.8) or dry weight (Figure 4.9) suggesting glyphosate
affected both groups similarly. However, there was one exception. Fresh weight responses
in April were found to differ (P≤0.05) between the two response type groups. The only
explanation that can be given for this difference, since no treatment had been imposed at
this point in time, is that errors were involved, either with the measurement or the sampling
of the plots in April. Similar trends were seen for stalk dry weights although the differences
in this instance were not significant.
-600
-400
-200
0
200
April May JuneMilla
ble
stal
k fre
sh w
eigh
t res
pons
e pe
r sta
lk b
etw
een
treat
men
ts (g
)
Figure 4.8: Stalk fresh weight responses between the untreated and glyphosate treated plots
(ie. response = glyphosate plot – control plot) for the non-responsive group (closed symbol)
and responsive group (open symbol) following glyphosate application in April. Capped
vertical lines represent l.s.d. at P=0.05 for treatment comparisons within each month.
83
-120
-80
-40
0
40
80
April May June
Milla
ble
who
le s
talk
dry
mat
ter r
espo
nse
per s
talk
be
twee
n tre
atm
ents
(g)
Figure 4.9: Stalk dry weight responses between the untreated and glyphosate treated plots
(ie. response = glyphosate plot – control plot) for the non-responsive group (closed symbol)
and responsive group (open symbol) following glyphosate application in April. Capped
vertical lines represent l.s.d. at P=0.05 for treatment comparisons within each month.
4.3.6 Whole stalk pol differences between treatments for different response-type groups Differences between the response-type groups did not become apparent until June, eight
weeks after the application of the glyphosate. Figures 4.10 and 4.11 show that glyphosate
had significantly improved the pol for both the responsive and non-responsive groups at the
four-week, treatment-harvest interval in May. Both groups also showed similar increases in
pol at May of around 1.1 units relative the control treatment for each population. However,
the sampling at the eight-week, treatment-harvest interval in June showed contrasting
differences between the responses seen for pol in each of the response type groups. By
June, the non-responsive group no longer showed a significant increase in pol for the
glyphosate treated plots above the control. The responsive group however, now showed
highly significant (P≤0.01) gains of 2.10 % units pol for the glyphosate treated plots above
the control.
84
(a)
5
7
9
11
13
15
17
19
April May June
Who
lest
alk
pol %
(b)
5
7
9
11
13
15
17
19
21
April May June
Who
lest
alk
pol %
Figure 4.10: Pol % changes with time for (a) the non-responsive group (Q167A ,Q179A and
Q186A) and; (b) the responsive group (Q113, Q135 and TellusA) following the application
of glyphosate in April. Glyphosate-treated plots (open symbol) are compared to untreated
plots (closed symbol). Capped vertical lines represent l.s.d. at P=0.05 for treatment
comparisons within each month.
85
Further analysis of the data now focuses on the data collected in June when contrasting
response differences in pol occurred between the two groups.
4.3.7 Were the pol increases in June a sugar accumulation or desiccation effect? Whole stalk responses in June for DM showed no significant differences between the two
response type groups following glyphosate application. However, Table 4.2 below
indicates that differences in the responses for pol/DM between the groups were highly
significant. On average, the responsive group had a greater (P≤0.01) whole stalk pol/DM
ratio by 3.5 % units compared to 0.5 % units for the non-responsive group (Table 4.3). This
suggests that if dry matter has remained relatively unaffected between treatments then no
desiccation effect has occurred and pol has increased as a result of increased sucrose
accumulation and not by desiccation.
Table 4.2: Mean squares for whole stalk responses between treatments for pol, dry matter
(DM) and pol/DM in June 2001.
Source Df Mean Squares
Pol DM Pol/DM
Block 4 3.47 5.57 0.0005
Group 1 14.88** 7.29 0.0062**
Variety(Group) 4 0.40 0.04 0.0005
Error 19 1.80 3.00 0.0007
* = P≤0.05, ** = P≤0.01
4.3.8 The spatial contribution of different stem sections to the pol responses seen for each response-type group The responsive group differed from the non-responsive group by the pol responses seen in
the top and middle stem sections for the June sampling, eight weeks after glyphosate was
applied in April (Figures 14.12a, b and c). Pol increases of 1.86 and 4.52 % units pol were
observed in the mid and top stem sections respectively for the responsive group in June
(Table 4.3). These increases were significant (P≤0.05) when compared to the increases
seen in the non-responsive group for the same sampling. No differences in pol responses
were seen between the two response-type groups for the bottom stem section in April, May
or June (Figures 14.12a, b and c). However, in June all the responsive varieties showed
86
significantly higher pol in the top stem section in contrast to the smaller, non-significant
responses seen for all the non-responsive varieties (Figure 4.13).
Table 4.3: Average responses1 between the control and treated plots for stem partition data
comparing traits between non-responsive group (NR) and the responsive (R) group varieties
in June, eight weeks after glyphosate application.
Trait Bottom stem Middle stem Top stem Whole stalk
NR R NR R NR R NR R
Pol (%) 0.49 0.57 0.43 1.86* 1.15 4.52** 0.06 2.04**
4.3.9 Traits associated with response-type groups at application time in April The results in the previous section showed that the response-type groups differed
significantly in response to glyphosate for pol in the mid and top stem sections in June.
Plant measurements made in April were further examined in attempt to characterise
differences between the two groups. The groups were found to differ in fibre and pol/DM
in the bottom stem section (Table 4.4) and green leaf numbers (Table 4.5). Similar trends
were seen for pol/DM and fibre in the middle stem section but pol/DM was the only trait for
this stem section that differed significantly (P≤0.05) between the two response type groups.
No differences in purity or dry matter for any of the stem sections were found between the
response-type groups.
89
Table 4.4: Least square means for stem partition data comparing traits between non-
responsive group (NR) and the responsive (R) group varieties in April at the time of
glyphosate application.
Trait Bottom stem Middle stem Top stem Whole stalk