Effects of Salt River Project’s Demand- Based Rate Change on the Rooftop Solar Market in Maricopa County, Arizona UW-Madison Energy Analysis & Policy Capstone Spring 2017 ANA DYRESON CHRIS HOFFMAN AARON PRICHARD AMANDA SCHIENEBECK
Transcript
Effects of Salt River Project’s Demand-Based Rate Change on the Rooftop Solar Market in Maricopa County, Arizona
UW-Madison Energy Analysis & Policy Capstone Spring 2017
ANA DYRESON
CHRIS HOFFMAN
AARON PRICHARD
AMANDA SCHIENEBECK
Contents I. INTRODUCTION ................................................................................................................................ 1
II. BROAD POLICY TRENDS IN ROOFTOP SOLAR .......................................................................... 1
III. 50 STATE ANALYSIS .................................................................................................................... 3
TRENDS IN LOW-LEVEL SOLAR ADOPTER SELECTED STATES ................................................ 4
TRENDS IN MID-LEVEL SOLAR ADOPTER SELECTED STATES ................................................. 6
TRENDS IN HIGH-LEVEL SOLAR ADOPTER SELECTED STATES ............................................... 8
IV. CASE STUDY: BACKGROUND .................................................................................................. 12
SALT RIVER PROJECT (SRP) AND ARIZONA PUBLIC SERVICE (APS) BACKGROUND ....... 12
RATIONALE FOR THE RATE CHANGE ........................................................................................... 13
THE RATE CHANGE ............................................................................................................................ 14
V. CASE STUDY: EFFECTS OF THE SRP RATE CHANGE ............................................................. 17
METHODS AND DATA ....................................................................................................................... 17
However, elimination or threats to state-level solar-friendly state policies, such as rebate programs
and performance-based incentives, have tempered adoption by offsetting these major reductions
in installation costs.
The electric industry is fundamentally changing from being a "one-way street" (utilities generate,
transmit, and distribute solar to end users) to more of an interconnected web of users and providers.
This shift has occurred so quickly that policymakers are struggling to keep pace, as current policy
is designed around the "one-way street" paradigm (NC Clean Energy Tech Center, Apr. 2016).
Questions over fair compensation to utilities and customers is at the heart of ongoing political
debates over rate structures (NC Clean Energy Tech Center, Oct. 2016). States all over the country
are taking a diverse approach to dealing with these questions, mainly focusing on net metering
rules, tariff structures, and fixed costs incurred by PV system users, with net metering being the
primary focus. This is important to the value of solar as the DOE estimates that elimination of net
metering at utilities in six states would extend the payback period for residential distributed PV
systems by between 1.4-8.9 years (Barbose et al., 2016). These policy debates between utilities
and solar providers have continually increased in recent years, with 47 states and Washington D.C.
taking some type of solar policy action in 2016; a total of 212 unique actions taken by states and
utilities across the nation. 2016 saw 73 actions in 28 states on net metering alone; this is up from
42 actions in 2015. In the first quarter of 2016 alone, the North Carolina Clean Energy Technology
Center catalogued 100 policy actions across the country, finding that 35 of those actions across 22
states related to policy changes in net metering. Beyond net metering, the first quarter of 2016
found that legislatures and public service commissions in nine states were considering changes to
Figure 1: National small solar month-to-month additions (data source: EIA form 826 solar PV estimates, residential)
3
the compensation schedule for real-time excess generation while seven states either ruled or were
debating changes to aggregate caps for net metering capacity (NC Clean Energy Tech Center, Oct.
2016).
III. 50 STATE ANALYSIS
For the analysis in this section, we utilize EIA form 826 data. EIA form 826 solar data is a sub-
sample of data collected from all US utilities. The data provides generation and capacity by market
sector for all small PV systems (<1 MW). We considered only the residential sector. EIA form
826 provides two useful sets of results: PV installation and net metering data. The net metering
data has a broader scope (not limited to small solar), provides utility-level totals, and spans a longer
time period. Generally, we found the two held the same trends at the state level. To make
comparisons between states more meaningful, we normalized each state's installed capacity by its
potential for rooftop PV capacity as per NREL 2016 (Gagnon et al. 2016). Hawaii was not
included in this rooftop PV potential study so we estimated its potential at 3.7 MW.
All US states and Washington D.C. were surveyed using the EIA form 826 data, excluding Alaska.
Regardless of the exact estimate of potential, Hawaii is in its own category for solar adoption,
hovering around 10% of potential. Figure 2 provides a rough measure of the market maturity by
dividing installed capacity in November 2016 EIA Form 826 by the estimated rooftop PV
potential. The highest adoption levels are clustered in the southwest and northeast.
We began by conducting a detailed policy analysis of a starting list of 11 states with known, recent,
policy changes. However, as potential ‘events’ were observed within the data, our investigations
naturally expanded to include additional states. While policy changes may coincide with a visual
change in a state’s technical potential capacity through Figures 3 – 6, this does not imply a
correlation. After a broad overview of policy trends and change in capacity within several states,
Section IV dives into more detailed analysis for the case study.
4
TRENDS IN LOW-LEVEL SOLAR ADOPTER SELECTED STATES WISCONSIN, MINNESOTA, NORTH CAROLINA, MONTANA
While it is always important to research the leaders in the solar market, it is also beneficial to keep
in mind that those states do not represent the majority at this point. Many of these states are not
considered particularly innovative with regard to net metering or other favorable solar incentives,
however, they represent the majority of U.S. states. This begs the question: how are the majority
of U.S. states responding towards solar policy? Are their policies differing and if so, how? The
states with low residential solar adoption are split into two figures: Figure 3 and Figure 4. Note
that these states have penetration levels of less than 0.5%.
While some states have passed pro-solar policy changes, other states’ policies have favored the
interests of utility companies. For example, North Carolina’s Duke Energy instituted a fixed charge
increase from $8 to $19 in 2016, an event that affected rates paid by solar participants in the NC
GreenPower performance-based incentive program. As of April 2016, that incentive program met
a cap for 100 kW and smaller systems. Duke Energy has shown interest in eliminating net metering
ever since its implementation in the state in 2005.
Wisconsin has also pursued an increase in charges, specifically through We Energies, which
imposed a fee on existing solar generation. The case was eventually challenged in court and
suspended in October 2015. We Energies’ actions are part of a larger trend. In 2015 the Wisconsin
Public Service Commission approved rate cases (including increases in fixed charges to
customers) for three of the largest utilities in the state: We Energies, Wisconsin Public Service
Corporation and Madison Gas & Electric. Moreover, the state changed how solar energy
Figure 2: Residential solar market maturity (residential capacity installed / estimated capacity potential) based on November 2016 solar capacities from EIA form 826.
5
production is counted on a customer’s utility bill: from annual to monthly true-ups. As a whole,
the state’s most significant limitation to distributed generation in Wisconsin is a 20 kW system
capacity limit for net metering programs.
As Wisconsin has continued to attempt to limit pro-solar policies within the state, Minnesota
represents the other end of the policy spectrum. The state first turned a corner on net metering
policy in 2013 with a round of legislation that increased the size limits of net metering policies for
both IOUs and other power producers. In April 2014, the state public utilities commission passed
a statewide value-of-solar formula as an optional alternative to net metering for utilities. This
formula was intended to reflect a more complete value of solar generation not offered by avoided
cost or retail rates. In September 2015, the final rules for the revised net metering policies were
adopted by the state. In March 2015, Minnesota’s PUC rejected Xcel Energy’s request to increase
residential monthly fixed charges from $8 to $9.25. Figure 3 demonstrates the results of these solar
supportive policy changes; Minnesota surpassed Wisconsin in the percentage of eligible residences
installing solar arrays.
There was an observed drop in PV capacity increase in the EIA data in January 2015 for Montana
that did not appear in other years. The research team did not observe any policy-related events that
would explain this phenomenon, but we observed several states experiencing the same trend at the
time, which is not apparent in the January 2016 data. We consider single month-to-month changes
like the one observed for Montana as anomalies.
Figure 3: Low solar adoption state trends from EIA form 826 small solar estimates, residential.
6
Figure 4: Very low solar adoption state trends from EIA form 826 small solar estimates, residential.
TRENDS IN MID-LEVEL SOLAR ADOPTER SELECTED STATES COLORADO, NEW YORK, NEW MEXICO, DELAWARE, CONNECTICUT
Mid-level solar adopter states have likewise witnessed a mixed bag of legislation and proposals in
recent years. Decisions and policy changes have both benefited and hindered the solar industry in
these states. The solar adoption trends are summarized for the mid-level solar adoption states in
Figure 5. On the positive side of the spectrum sits Colorado, which has been considered the “golden
child” of net metering by many industry experts. Their Solar Rewards program was first
established in 2005 and reapproved in 2015 after a year-long consideration by their Public Utilities
Commission. Figure 5 showcases a constant uptick in capacity, mirroring these policies.
New York has aggressively increased their policies favoring solar adoption, first in 2011 when
they adopted remote net metering within the state, and again in 2012 when then-Governor Cuomo
established the NY-Sun dynamic solar public-private partnership, committing $1 billion over 10
years beginning in 2014. The ultimate goal of this project is to add 3 GW of solar by 2023 through
the establishment of a variety of programs to encourage distributed solar systems. Beginning in
2014, the state’s capacity aggressively increased, surpassing other mid-level solar adopters.
7
Likewise, Connecticut has continued to focus on policies favoring solar; the Connecticut Public
Utilities Regulatory Authority (PURA) ruled in November 2016 that United Illuminating would
no longer cash out banked kWh's when customers switch suppliers. Suppliers will be required to
reimburse customers for banked kWh's at the wholesale rate once the annual net metering period
ends. Customers have the choice of two annual banking periods—April 1 and October 1, and
suppliers are not required to serve net metering customers. PURA will make a final decision on
this issue in August 2017.
A common trend across these states are attempts, both successful and unsuccessful, to introduce a
variety of fixed costs and fees on solar net metered systems. Even in Colorado, the “golden child,”
local IOU Xcel Energy proposed a new grid-use fee rate case in 2016. However, after public
backlash, Xcel agreed to withdraw its case in exchange for the allowance of time-of-use rates.
Much like Colorado, Delaware represents an ongoing battle of this nature. Regulators are currently
considering a decision to increase monthly fixed charges to residential customers; Delmarva Power
& Light requested an increase from $11.70 to $17.47 per month. Since Delaware state law
authorizes the public utility to implement temporary rate increases under specific conditions after
a seven-month filing period with the public service commission. The interim rate increase was
approved in December 2016, and a final ruling is still pending.
In recent years, New Mexico’s utility companies have also proposed several changes to solar
policies including interconnection fees, fixed charge increases, and increased charges for solar
customers per kWh compared to other residential customers. While no such changes have been
approved at this time, the state has seen an end in its tax credit program and much of its solar
Figure 5: Mid-level solar adoption trends from EIA form 826 small solar estimates, residential.
8
production payment program across the state. The former’s funding ran out as of mid-2016 while
the latter payments had decreased from 13 cents/kWh in 2009 down to 2.5 by the end of 2015.
While El Paso Electric chose to end this program in 2015, PNM was approved to extend the
program for three years starting January 1st, 2017; the extended program applies to new
interconnected systems only and will have a term of eight years with a purchase price of one
quarter of a cent per kWh of energy produced and consumed on site, representing a fraction of
what the program was 8 years prior. Figure 5 demonstrates a general leveling off of solar capacity
growth in 2016 which aligns with the end of the state tax credit program for solar.
Only Connecticut saw a decrease in residential fixed charges from $17.25 down to $9.64 for United
Illuminating after the utility had originally proposed an increase to $18.74. PURA plans to review
the customer charge for the next two years of the rate case as well, while also reviewing the state’s
net excess generation policies, when and how PV generated kWh’s are accrued, banked, used,
priced, and reimbursed, especially when customers change electric suppliers. Connecticut's
Legislature barred customers who received solar rebates from taking advantage of net metering
provisions in July 2014 in House Bill 5115 due to a transcription error. The decision was reversed
following a major uproar from customers and solar industry officials, and the EIA 826 data did not
show a related decrease in installations due to this error.
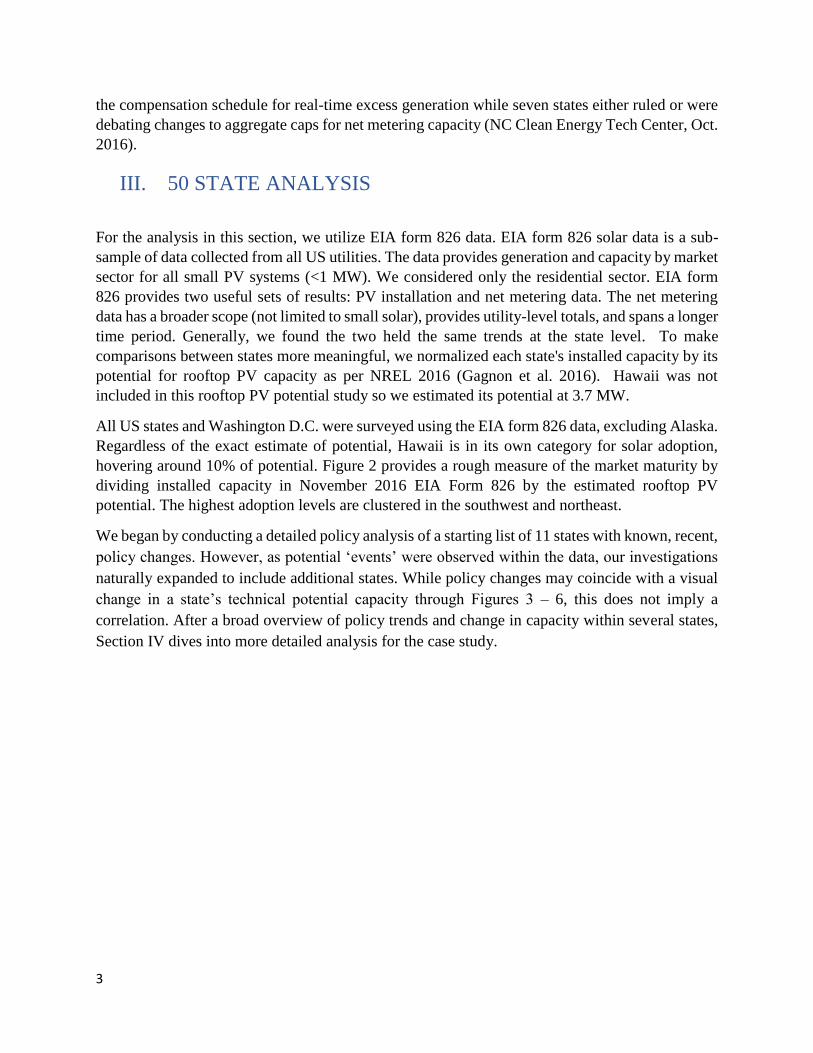
TRENDS IN HIGH-LEVEL SOLAR ADOPTER SELECTED STATES CALIFORNIA, HAWAII, ARIZONA, NEVADA, MASSACHUSETTS, D.C., MARYLAND
The solar adoption trends are reported as the percentage of residential technical capacity by month.
Figure 6 illustrates the 2014 – 2016 monthly data for the highest solar adopter states. Hawaii is not
shown but increases from 6% to 10% during the same period. Most states increase relatively
continuously while DC and Nevada are notable and are discussed further below.
Figure 6: High solar adopters PV installations from EIA form 826 small solar estimates, residential.
9
The unique issue for high solar adopters, not yet present for mid and low-level adopter states,
seems to be how to incorporate such a large rate of adoption into the grid without utilities feeling
that the remaining supply, infrastructure, and other costs associated with such a high rate of solar
adoption are inadvertently pushed onto non-solar customers. Hawaii and Nevada responded to this
by effectively ending their net metering policies, while Arizona took a more moderate approach.
The first to confront the situation was Hawaii; roughly 17% of the customers of Hawaiian Electric,
the state's dominant utility, have installed rooftop solar- the largest in the U.S. In 2015, the Hawaii
Public Utilities Commission ruled to close Hawaiian Electric’s net metering program for new
participants. As a temporary replacement, 'self supply' and 'grid supply' tariffs were approved for
newly integrating customers with the former using an expedited interconnection process while the
latter option amounts to net billing. By mid-2016 the grid-connected option filled up and little
interest has been shown in the 'self supply' option. Figure 7 shows the trends in monthly additions.
Installations peaked in late 2015 and showed a decline by mid-2016 in line with the most attractive
‘grid supply’ option tariff not remaining available. A few months after Hawaii’s action, Nevada
also saw the end of its net metering program; in December 2015, the Public Utilities Commission
of Nevada (PUCN) voted to end net metering within the state as commonly defined. Instead,
beginning January 1st, 2016 customers were compensated for excess generation at the wholesale
rate (net billing). Existing solar customers were scheduled to gradually phase into new tariffs
through 2028. Figure 8 shows the monthly capacity additions for Nevada. One year after the
Nevada decision, in December 2016, the Arizona Corporation Commission, which controls APS,
TEP, and Unisource, after an extensive study on the value of solar, acted to replace the net metering
that began in 2009 with compensation via an 'export rate' based on five-year averages of costs for
large scale PV plants. By some estimates this number would be roughly 30% less than traditional
retail rates, yet still a significant amount higher than net billing.
Both Nevada and Hawaii solar companies and advocates have fought these rulings. In Nevada,
after severe backlash, the State District Court for Carson City overturned both the reduction in net
metering compensation and increased fixed charges for existing rooftop solar customers,
upholding the original changes for new rooftop solar customers. In December of 2016, the PUCN
voted to restore net metering in NV Energy’s Sierra Pacific Power Company’s service territory for
Figure 7: Hawaii month-to-month solar additions from EIA form 826 small solar estimates, residential.
Figure 8: Nevada month-to-month solar additions from EIA form 826 small solar estimates, residential.
up to 6 megawatts of new rooftop solar (roughly 1,500 customers) beginning January 1, 2017. In
Hawaii, conversely, no changes have been made to the existing interim policy. Solar companies
have argued that they have been losing jobs and forced to downsize, citing a decrease in permitting
applications of nearly 30% since August 2015. The solar community is demanding both an increase
in the net billing caps as well as a permanent solution to the state's solar tariff program. The solar
community waits for a more permanent solution to their net metering issues.
Some states saw the end of net metering while others saw expansions and revisions to their state
policies. Washington D.C.’s Community Solar Renewable Energy Amendment Act of 2013
established a community net metering program which expanded the potential for net metering in
the district1. In May of 2015, the PUC proposed its final amended set of rules, which allows third
parties to own and operate community energy facilities up to 5 MW to be implemented 30 days
after publication in the D.C. Register. However, the credit per kWh community solar participants
would be receiving for excess generation was originally slated for 9 cents, compared to the 14
cents that rooftop solar customers receive. Solar advocates argued that this rate undervalued the
electricity generated from community solar projects, making it difficult for such projects to be
viable financially. In June 2016, the D.C. Council passed a bill restoring the price per kWh to 14
cents2. Massachusetts also took steps to expand its net metering program; the state’s net metering
caps were being reached through 2015-2016, there was a big push to increase allotment caps to
allow for continued growth in the market. State-level policy was slow to react, but in April 2016
the state responded by introducing new caps, which were only incrementally higher and will likely
reach their ceiling soon. An event study in Massachusetts might look like a series of mini-events,
both increasing and decreasing solar installations as the caps are hit, then increased, then hit again
in individual utility areas.
As D.C. and Massachusetts expanded their net metering programs, California saw the preservation
of much of the state’s net metering program after high profile proposals and debates throughout
much of 2014 and 2015. In January 2017, the CPUC voted to preserve retail rate net metering with
some alterations: a solar customers pay a one-time interconnection fee, pay non-bypassable
charges per kWh consumed from the grid, and enter into a time-of-use rate schedule once
established. Solar customers can be grandfathered into the tariff structure as it existed when they
interconnected (for up to 20 years), or they can opt into the new tariff structure. The California
Solar Energy Industries Association (CalSEIA) estimates that the aggregate financial increase due
to these changes will be approximately $10 per month when compared to the original policy.
Other common policy changes to the high-level solar adopters mainly consist of fixed charges. In
October 2014, Maryland’s Choptank Electric Cooperative filed a rate case application with the
PSC to increase its residential monthly fixed charges from $10 to $17 and this was approved in
March 2015. Also in December 2015, Nevada’s PUCN approved an increase in fixed charges for
solar customers above non-solar customers, from a $5.15 difference in 2016 to a $25.76 by 2028.
1 Maryland has taken similar steps to expand solar to low income communities; in April 2015, S.B 2010 was enacted which established a three
year community solar pilot project. The goal of the project is to provide renewable energy benefits for low and moderate income customers. The
project has not yet been enacted. 2 While Figure 5 shows a sudden increase in solar additions in March of 2016, this appears to be an anomaly; every other month from 2014-2016
had less than 0.5 MW of new installations, there were 3.5 MW in the month of March 2016.
11
In California, a minimum bill concept (up to $10) was approved as an alternative to utility requests
for fixed monthly charges. California’s CPUC also introduced a multi-year plan to incrementally
flatten the state’s four-tier utility rate structure to two by 2019.
Arizona policy has largely pursued utility-specific rate changes in recent years which allow
analysts to study comparisons within the state based on utility service area. In 2013, the Arizona
Public Service (APS) added a 70 cent charge per kW of solar system capacity effective November
2013. This equated to approximately $5 per month for an average system size. In December 2014,
Salt River Project (SRP)—a public utility that serves the Phoenix area—instituted a unique rate
for new solar customers. The utility intended for existing solar and residential customers to see
little to no change to their bills, while newly interconnected solar customers would witness a
significant jump in their bill through an added peak demand charge, a fixed charge, along with a
significant decrease (~60%) in energy rates. The projected change in price was an average of an
increase of $3 to $5 for existing solar and residential customers and a $50 average monthly increase
for new solar customers applying after December 8th, 2014. The Arizona case, SRP in particular,
is the focus of the next section of this project.
A drop in interconnection applications was immediately seen as illustrated by the On the Path to
Sunshot report, when summarized on a quarterly basis using a separate dataset (not EIA Form
826). As shown in Figure 9, SRP’s installation trend was different than the rest of the state. The
remainder of this report focuses on the effect of this rate change in SRP territory.
Figure 9: Salt River Project and other Arizona new PV capacity by month based on EIA 826 net metering data.
12
IV. CASE STUDY: BACKGROUND Salt River Project (SRP) created a unique rate plan, largely determined by demand-use fees and a
fixed monthly charge applicable only to new self-generating solar customers; these changes went
into effect during the April 2015 billing cycle. As the above section highlights, early numbers seem
to indicate that interconnection applications dropped almost immediately after the change went
into effect. It is important to note that the rate change itself was not approved until February of
2015. However, customers who applied for solar interconnection by December 8th 2014 were
grandfathered in to the previous rate as it existed prior to the change. SRP initially informed its
customers of this deadline by letter on November 29th, 2014 (personal communication, SRP Solar
Department, May 6th, 2017). Among other reasons to be expanded upon below, the relative
suddenness of this rate change makes this scenario a good candidate for a case study, even more
so because a neighboring utility—APS, serves as a useful benchmark for business-as-usual in
Phoenix during the same time period. This section describes both utilities and the SRP rate change.
SALT RIVER PROJECT (SRP) AND ARIZONA PUBLIC SERVICE (APS)
BACKGROUND
Salt River Project (SRP) is a water and electric district in central Arizona. It is a public utility that
delivers water and electricity within the district, which is mainly comprised of the Phoenix area.
In fact, SRP was founded a decade before Arizona itself became a state; it was founded as settlers
in the area realized they needed to work together to build and maintain water storage and delivery
systems to support the agricultural projects in the area. From those beginnings, it eventually
became a publicly-owned utility with governance conducted through an elected board in which
votes are cast by landowners in the utility service territory.
APS borders SRP primarily to the west and southwest, and services most of the remaining
customers in the Phoenix area (Figure
10). While SRP largely services the city
itself, APS serves a much larger part of
Arizona, both rural and urban. While
SRP is publicly-owned, APS is an
investor-owned utility and thus is
regulated by the Arizona Corporation
Commission along with other utilities
including the other major electric utility
of Tucson Electric Power (TEP). In
utilizing APS as a comparison for our
SRP case study, the research team
elected to focus exclusively on
Maricopa County, which essentially
includes all of metropolitan Phoenix.
Figure 10: APS service territory map for the Phoenix metro area. Non-APS service area is largely SRP's territory. From APS: https://www.aps.com/library/communications1/PHX_Map.pdf.
13
RATIONALE FOR THE RATE CHANGE
Under the standard residential plan (E-23), solar connected customers’ monthly bills are reduced
in proportion to their reduced energy usage (kWh); the average SRP rate customer was paying
$170 per month, while solar net metering customers were paying $70, saving an average of $100
each month. However, SRP argued that monthly bills should account for both energy use and
demand, pointing out that solar customers’ peak demand only decreased from 8.9kW to 8.5kW.
This is likely a result of natural limits of solar production; as sunlight and therefore, solar energy
generation, fades in the afternoon, causing typical solar customers to ease back onto grid energy.
However, because this transition occurs under peak energy demand hours, solar customers are still
utilizing the grid system during peak demand use. Their arguments have been represented in
Figures 11 and 12.
SRP argued that since solar customers’ demand did not decrease in proportion to their energy use,
and because those same customers continued to utilize the grid during peak demand, they must
therefore financially contribute more despite their decrease in energy use otherwise. In fact, over
70% of SRP’s own costs are fixed, and they argued that solar customers are not paying their fair
portion toward those costs, which include maintenance of system infrastructure, the size of which
is based on peak demand. Of the $100 savings that solar-connected customers reaped each month,
the actual amount of avoided costs seen by SRP represented only half of this savings ($50), leaving
a net revenue loss of $50 per solar customer. SRP argued in December 2014 that they were under-
collecting roughly $9 million from their solar connected customers, which they said would be
unfairly passed onto their non-solar customers if nothing was changed.
While SRP made arguments for why this rate change was necessary, it is important to note that to
date, more than a dozen states have conducted studies on the costs and benefits of distributed solar
and none have found any evidence of a net negative impact on non-solar customers. Yet, utilities
like SRP continue to advocate for rate changes to their distributed energy solar policies as adoption
continues to increase. In February 2016, the Arizona Public Commission released their own
updated state report on the costs and benefits of distributed solar.
However, while there are introduced demand charges and a higher fixed charge each month, newly
connected solar customers can benefit from a substantially reduced price for kWh of energy used
each month. As stated by SRP above, their average residential customer uses 1,545 kWh of energy
each month while the average solar customer uses 491 kWh. Utilizing these averages, under E-27,
the cost of energy rangers from $21 in winter months to $31 during summer peak months. In
contrast, under the traditional E-23 pricing plane, energy use would cost $123 in the winter months
and $179 during summer peak months. These numbers help to demonstrate that the E-27 pricing
plan is heavily focused on demand use during peak hours; in fact, most of the charges solar
customers see on their bills is a combination of these demand charges in conjunction with the fixed
monthly charge. Therefore, to truly reap the benefits of installing solar under SRP’s E-27 plan,
customer’s almost must take steps to modify their energy use behavior.
Table 3: Per kWh Energy Charges for SRP Customers on E-27 and E-23 Price Plans in Cents
Winter
(Nov-April)
Summer
(May-June & Sep-Oct)
Summer Peak
(July-Aug)
E-27 Off Peak 3.86 3.67 4.19
On Peak 4.26 4.82 6.29
E-23
First
700kWh
7.93 10.82 11.48
701-
2000kWh
7.93 11.01 11.60
2001kWh+ 7.93 12.96 13.11
17
V. CASE STUDY: EFFECTS OF THE SRP RATE CHANGE This section outlines how the Tracking the Sun (TSS) database, interviews, and System Advisor
Model (SAM) simulations were used to understand effects of the SRP rate change.
METHODS AND DATA
In an effort to better focus our event study, we sought to limit the data to ensure a fair analysis of
the policy on local solar installations. First, we sought to compare Arizona Public Service and the
Salt River Project service territories limiting the data search to Maricopa County i.e. the greater
Phoenix area (Figure 15). Next, we eliminated any data where the system size was smaller than 1
kW or larger than 15 kW in account for residential systems. Systems with an appraised were
eliminated for price analysis. In addition, if installation price was not listed (value of -9999), the
entry was eliminated for price analysis.
Figure 14 : Utility service territory for Maricopa County, Arizona. Source: Arizona Corporation Commission Utilities Division—Engineering Section/GIS Mapping.
Data analysis focused on projects installed in 2014 and 2015. There were 18,659 observations after
removing data that did not meet screening criteria. Of these, 12,565 were for APS and 6,094 were
for SRP for the 2014-2015 installations. This section provides summary information about the
data. Figure 15 shows the project breakdown based on ownership (third-party ownership or not)
and price flag (appraised or not). Overall system size and cost per kW were similar, making a case
for the comparison of these two markets (Figures 16 & 17). The SRP projects in this period tended
to be a bit smaller and their cost per kW was slightly higher.
18
Figure 15: The 2014-2015 dataset had a majority of projects from third-party-owned systems. Many of the third-party owned projects had appraised prices.
Figure 17: Comparison of Price per kW after removing unpriced, third-party, and appraised value systems. The
price per kW in the dataset was slightly higher in SRP ($3,912/kW) than APS ($3,588/kW). The difference was
significant with p=7e-11. A 95% confidence interval for the difference in means was $227-421 per kW.
Figure 16: Comparison of System Size: The system size in full the dataset was higher lower in SRP (8.2 kW) than APS (7.5
kW). The difference was significant with p=2e-16. A 95% confidence interval for the difference in means was 0.6 – 0.8
kW.
19
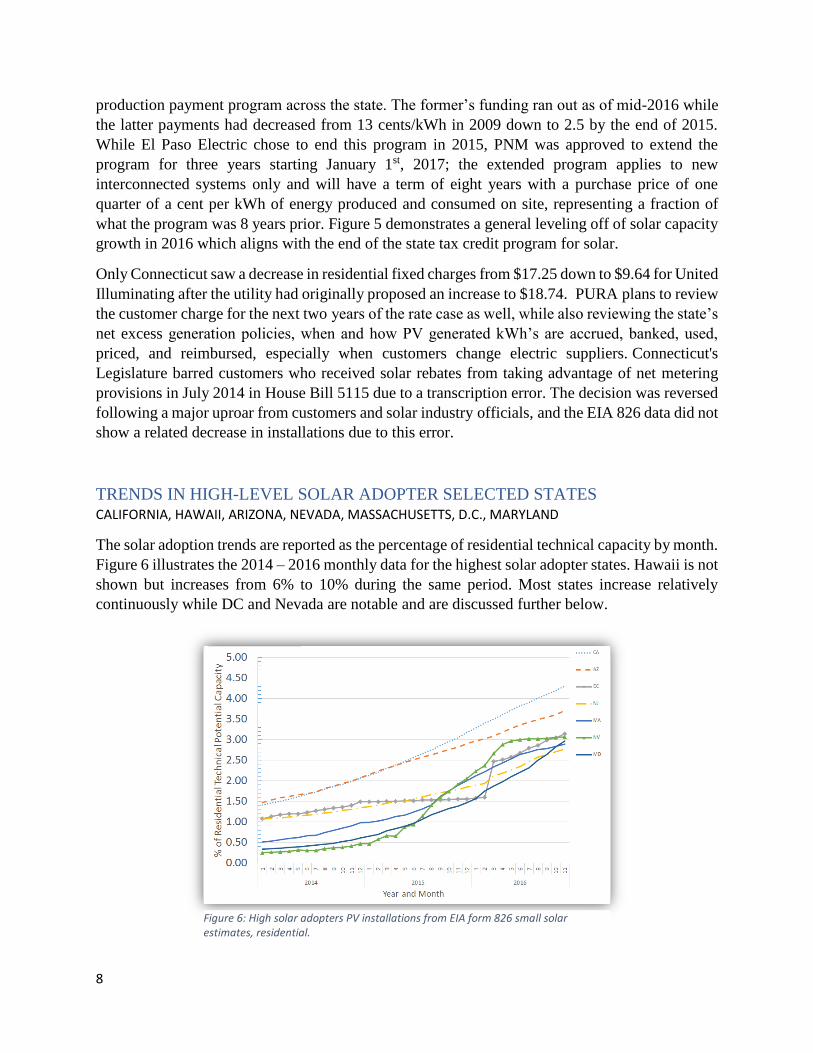
To study solar adoption trends over time and quantify the impact of the rate change, it was
important to distinguish between application date and installation date. These fields are reported
differently for each utility in the TTS dataset, but in comparing SRP & APS, the time from
application to installation in the two year data set was about the same (Table 4). There is some
temporal variation in the installation delay, especially around the SRP event as customers applying
in December 2014 on average delayed 175 days (Figure 18).
Table 4: Average time from application to installations.
SRP APS Both
112 days 92 days 98 days
Figure 18: Number of days from application to installation by month of installation.
BROAD MARKET CHANGES
Since the rate change has went into effect, there have been drastic market changes and attempts to
adapt (Personal Communication, American Roofing and Solar, April 2017)4. Joy Seitz, president
and CEO of American Solar and Roofing confirms this sentiment, stating that while the rate change
won’t end solar roofing in Arizona, this decision will require solar companies to make adaptions.
“This change sends a signal that future residential solar offerings will require complementary
technologies that maximize self-consumption, such as storage and load management [and] when
these technologies are implemented in conjunction with optimally sited solar, all ratepayers will
benefit from peak demand reduction.” (Pyper, 2016)
4 While we were unable to reach Solar City for comments, American Roofing and Solar was more than willing to discuss how the
rate change has, and continues to affect how they conduct business with customers in SRP territory. A multitude of phone
conversations took place with the company’s solar installers over the course of April – May 2017.
20
A representative installer of the company discussed specifically how the market has changed for
them since the start of 2015 (Personal Communications, American Roofing and Solar, May 2017).
First and foremost, they will almost only quote customers that are able to do a west facing roof.
This allows them to create energy until slightly later in the day to offset using the expensive energy
during peak demand time. This contrasts with the traditional notion of utilizing south-facing roofs
which will generate the maximum amount of energy throughout the year. However, searching
ways to ensure customers a savings financially, focusing on west facing roofs quickly became a
necessity.
Moreover, both they and their competitors have implanted different types of load controllers into
their systems. For example, some solar installers such as Sun Valley have chosen to install load
controllers into air conditioning units to monitor demand load at any given time and if the customer
is approaching a certain level of demand use, the load controller acts as a kill switch to prevent
this from occurring. American Solar and Roofing also utilizes load controllers; however, theirs do
not act as a kill switch but instead alert you when you are approaching a certain level of demand;
it becomes up to the customer themselves to actively turn off air conditioning, washers, driers,
dishwashers, etc. if they want to avoid increasing their demand fees. On their load controllers, Sun
Valley CEO Russ Patzer stated, “Our whole point is we want something the customer doesn’t have
to think about. They don’t have to have a comfort change or lifestyle change.” (Randazzo, 2016)
While load controllers are becoming almost mandatory in SRP territory, Patzer also said that they
don’t typically install as many panels on a home as they used to prior to the rate change. This is
because customers just aren’t rewarded as much for producing large quantities of excess energy.
The Tracking the Sun database confirms this, showing an average system size of 8.2 kW for
systems on the old rate. In contrast, of installations under the new pricing plan, the average system
size was 6.7 kW (Table 5).
Table 5: System Size for SRP under old and new rates.
Average system
size
Percentage of projects
third-party owned
Number of projects
(2014-2015)
E-23 (old rate) 8.2 82% 5,928
E-27 (new rate) 6.7 2% 166
While some solar installers are attempting to respond to the market changes caused by this rate
change, others are exiting the market entirely. For example, SRP’s manager of pricing design, John
Tucker, explained that prior to SRP’s rate change to E-27, 75% of solar installations in SRP
territory were through a solar leasing option, and confirmed that since the rate change went into
effect, this number has dropped to 25% (Randazzo, 2016). After the rate change, it has become
more difficult to promise any type of savings worthwhile for the customer (leasing or otherwise)
without dramatic behavioral changes (Personal Communications, American Solar and Roofing,
April 2017). SolarCity, the nation's largest leasing company, has largely left the area altogether
(Randazzo, 2016).
SolarCity has also found themselves in a legal battle with SRP over the rate change. They have
accused SRP of "anticompetitive and tortious conduct designed to eliminate solar competition."
The company's complaint against SRP stated that they believe that "SRP's penalty on solar
21
customers is harmful to consumers, and harmful to competition," adding that "competition is
eliminated, consumers are hurt, and the environment is harmed (SolarCity, 2015)."
The Tracking the Sun data confirmed that third-party owned projects are much less common under
the new rate. Figure 19 shows applications by third-party ownership (TPO) and utility. The
December 8th event impact on TPO projects in SRP is evident. Overall we found that 82% of SRP
customers on the old rate were third-party projects, while only 2% of projects on the new rate were
third-party owned through 2015 (Table 5). (As a point of comparison, 72% of the APS projects
were third-party owned.)
Figure 19: Applications by month for third party and non-third party owned projects for SRP and APS territories. Third party projects are eliminated in SRP territory shortly after the event; no such trend is visible in APS.
Changes in the installer market are also analyzed using the TTS dataset for 2014-2015. Figures
20-21 show that the market moves toward more, smaller installers. Under the new rate the market
is dominated by small installers who install less than 2% of all total projects, identified as "Others".
Figure 22 provides a monthly view of the SRP installer market. The number of projects per installer
decreases, while in Figure 23 the APS trend is steady or increasing.
22
Figure 20: Installers by number of projects under the old rate (application date in 2014).
Figure 21: Installers by number of projects under the new rate (application date in 2015).
23
Figure 22: (Left) SRP average number of projects per installer each month shows decline in activity. The number of projects installed each month is divided by the number of installers active that month (at least one project).
Figure 23: (Right) APS average number of projects per installer each month shows relatively steady to increasing activity.
SOLAR-PLUS-STORAGE & OTHER BEHAVIOR CHANGES
SRP argued from the onset that if customers were to change behavior on when they utilized
electricity from the grid and how they utilized it, they could reap benefits far beyond the $50 per
month under the new rate plan. SRP has campaigned heavily on the promotion of behavioral
changes to fully take advantage of the benefits of this pricing plan. A quick glance through their
website’s solar section showcases this in the form of text, infographics, and videos. Offering
suggestions, SRP Treasurer and Financial Services Director Steve Hulet stated that “the customer
can adopt new technology, whether it’s load controllers or smart thermostats or battery technology,
and change their behavior to respond to those price signals.” (Trabish, 2015)
One of the more common changes SRP suggested was the utilization of batteries, or solar-plus-
storage. In fact, the solar community agrees with this argument that demand charges will drive
solar plus storage technologies- despite the current economics of doing so. Ravi Manghani, GTM
Research energy storage analyst when interviewed, stated that, “Any kind of net energy metering
reform that reduces the value of solar works in favor of storage.” (Trabish, 2015) A recent GTM
research analysis found that a potential SRP residential customer with a demand charge hovering
around $32 with a 4kW system would result in solar plus storage being financially superior to solar
alone. As showcased above, without any behavioral changes, the average SRP solar customer
maintains a peak demand energy use of 8.5 kW, translating to a demand charge above the $32
benchmark, thus making solar-plus-storage a viable option under GTM’s analysis.
The Tracking the Sun (TTS) dataset listed nine battery systems installed in our case study area of
the 5,928 projects under the old rate plan. This shows that solar alone was the more financially
viable option under those conditions. After E-27 took effect, two battery solar systems were
reported by TTS of the 166 projects under the new rate. Thus the 2014-2015 data set does not show
strong adoption of storage.
Installers for American Solar and Roofing out of Phoenix confirmed that behavior changes and
add-ons are necessary after the rate change to ensure the financial savings associated with rooftop
panels (Personal Communication, American Roofing and Solar, April 2017). While installers have
heard some news of Tesla batteries in the area, American Solar and Roofing has yet to roll out
battery usage in their systems, hoping to get them out by the end of 2017 with new installations.
The company’s plan is to first kick out battery usage on west facing roofs with solar for use when
solar production largely diminishes (around 6:30 pm). The battery’s storage would then be used
during the remaining peak hours (6:30-8pm in the summer) to help minimize massive behavioral
changes in energy use by customers. Once peak hours end, the battery would use cheap grid energy
to recharge so the customer is able to avoid paying large demand costs. These battery systems
could also bring potential back to the installations of south facing panels, simply being used for a
longer time period during said peak hours: 5:30-8pm in the summer, for example.
American Roofing and Solar’s perspective coincides with the premises that the process of widely
rolling out batteries is a somewhat slower one, seeming to be slower changing, more long term
effect on the solar market. To note, Manghani also made the point that “SRP is only one utility out
of the 3,000 in the U.S. but it will not be the last utility to enforce a residential rate structure that
benefits solar-plus-storage (Trabish, 2015).” As more and more utilities continue to make changes
to their rate structures through demand charges, fixed charges, TOU rate structures, or reduced net
metering rates, solar-plus-storage will likely become more economical, and thus more widely
implemented in the years to come.
In fact, The Economics of Load Defection, published in early 2015 found that as energy prices
continue to rise, battery prices continue to fall, and technology costs continue to rapidly evolve,
solar-plus-storage options will become increasingly economically viable options for the average
solar residential consumer. The authors conclude that within 15 years, such systems will saturate
many important
markets within the
United States including
New York, California,
Hawaii, Kentucky, and
Texas (Bronski et al,
2015). It will be
important to look back
at the use of batteries on
SRP solar systems in
the years after 2015.
Figure 24: Battery price trends Credit: The Economics of Load Defection, 2015
25
SYSTEM ADVISOR MODEL (SAM) SNAPSHOT: 2014 VS. 2015 Using System Advisor Model, we chose to portray the average SRP customer under the old rate
plan with a rooftop solar system and then compare this to the average SRP customer that would
have installed rooftop solar after the rate E-27 went into effect. We went in wanting to change
many variables including system size, utility rate schedule, module, and inverter used. However,
both the most widely used inverter and module, according to TTS data, were the same both years.
Moreover, while the system size decreased from 8.2kW down to 6.7kW under the new rate plan,
we chose to keep this constant for better financial comparisons. In the 2015 scenario, we also did
input a change in azimuth angle as many installers were quick to point that they almost exclusively
will only install panels on west-facing roofs to assist in energy production later in the day. This
varies from prior to the rate change, where south facing roofs were ideal for total year-round energy
production. The general results of the simulation are listed in Table 6.
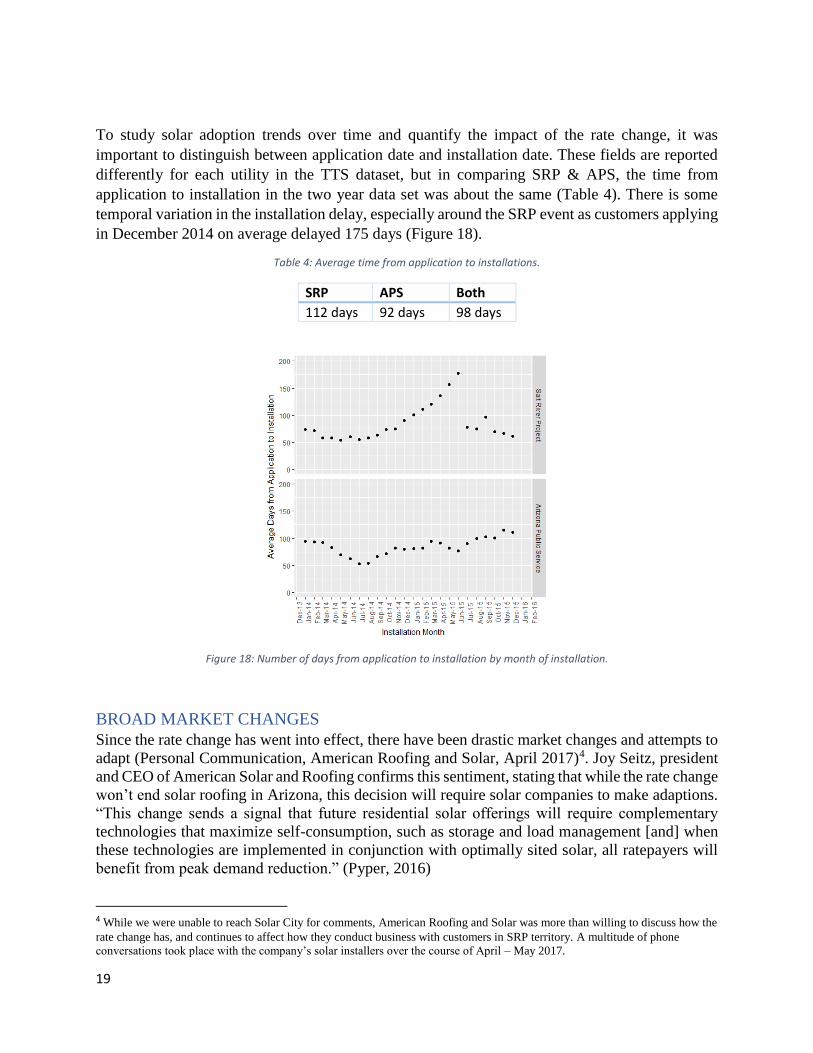
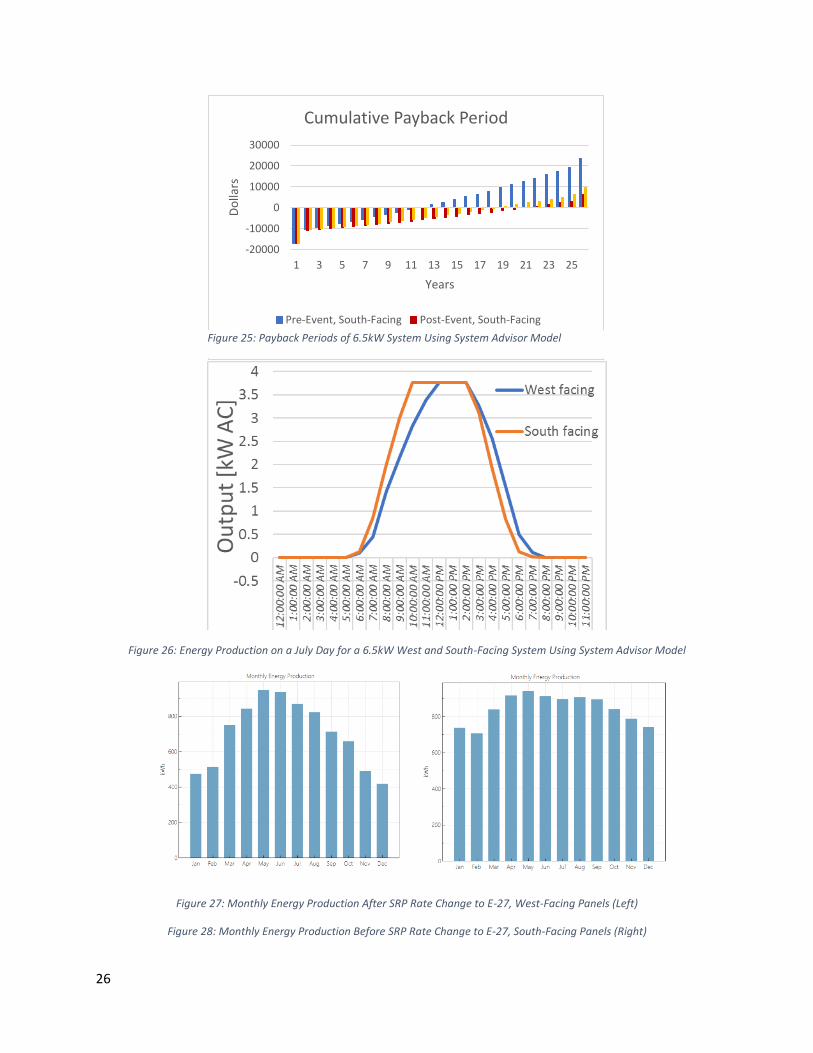
As shown in Figures 27 and 28, the energy production of these systems is drastically different, in
fact the annual production decreases by almost 2,000 kWh. However, by changing the azimuth
angle back to south facing even after the rate change, you can see why west-facing systems have
become almost a necessity. This is even further detailed in Figure 26 showing that while south-
facing systems will produce more energy during the day overall, west-facing systems will produce
energy slightly later in the day, which will help reduce demand charges during peak summer
periods under the new rate plan (E-27). This contrasts with maintaining the use of a south-facing
system even under the new rate plan. In this case, while the annual energy production is essentially
the same as a system prior to the rate change, the payback period jumps to 19.9 years and the net
present value to $-4,291. This is solely due to the costs of a higher demand charges during peak
energy use times instituted by E-27. In fact, if you assume that the rate change would cause a $50
per month increase in energy bills, over the lifetime of a rooftop solar system, this could mean a
net change in $50 by 12 months each year by 20 years, or a total difference of $12,000. These
payback period differences between, west and south facing systems pre and post event are also
further illustrated in Figure 25.
Table 6: System Advisor Model Results
SAM Variables Altered
2014
Pre-Event (E-23)
South Facing Panels
2015
Post Event (E-27)
West Facing Panels
2015
Post Event (E-27)
South Facing Panels
Annual Energy
Production (Year 1)
10,113 kWh 8,434 kWh 10,113kWh
Net Present Value $865 $-2,941 $-4,281
Payback Period 10.9 years 17.3 years 19.9 years
26
Figure 26: Energy Production on a July Day for a 6.5kW West and South-Facing System Using System Advisor Model
Figure 27: Monthly Energy Production After SRP Rate Change to E-27, West-Facing Panels (Left)
Figure 28: Monthly Energy Production Before SRP Rate Change to E-27, South-Facing Panels (Right)
-20000
-10000
0
10000
20000
30000
1 3 5 7 9 11 13 15 17 19 21 23 25
Do
llars
Years
Cumulative Payback Period
Pre-Event, South-Facing Post-Event, South-Facing
Post-Event, West-FacingFigure 25: Payback Periods of 6.5kW System Using System Advisor Model
27
SRP officials have done a preliminary review of newly installed solar customers installing solar
on the E-27 rate throughout 2015. They found that 14% of customers are saving money, while
others have essentially changed nothing of their energy use behaviors, ignoring those demand price
penalties established during peak demand hours and are thus, paying significantly higher bills. The
utility’s analysis included the June to January bills of the 190 customers who installed solar since
the demand based rate went into effect. Of those customers, the average bill was $181 prior to
solar installations, compared to $122 each month with solar installed on the E-27 rate. This new
pricing turns out to be only a $29 increase from what those customers would have paid under the
previous solar rate, less than the $50 prediction SRP had stated prior to the rate going into effect.
Table 7: SRP bills estimates (Source: SRP)
Average SRP Solar Customer Bills
per Month
Prior to Installing Solar $181
Under E-27 (New Solar) $122
Under Old Solar Rates $93
Those 14% of customers that saved money, likely did so due to a drastic change in energy use
behaviors. In fact, their average demand during peak periods was 5.8 kW, a number that rose to 8
kW after 8pm when the peak period ends. This would likely be due to delaying running appliances
like washers, driers, etc. until off-peak hours begin.
On the other end of the spectrum, SRP’s analysis found that 12% of customers (22 total) were
paying $50 or more each month than they would have under the previous solar rate. These
customers’ average peak demand use was 8 kW, with off peak demand of 8.9 kW. These customers
likely made little no changes in their energy use during peak periods.
This leaves a majority of newly connected SRP solar customers, 74% to be exactly, paying
somewhere between $0 - $50 more on their energy bills each month compared to what they would
have under the previous rate. President/CEO Joy Seitz of American Solar and Roofing suggests
that “Consumers have to have a better understanding of how they use their energy (Randazzo,
2016).”
28
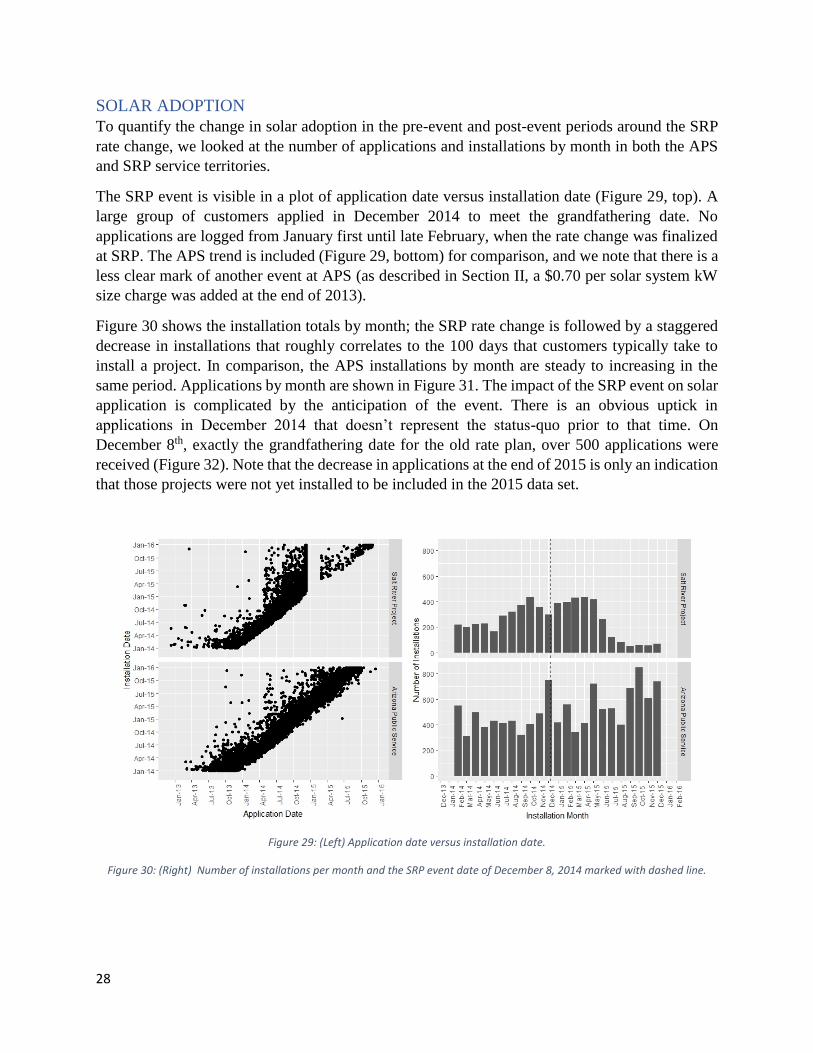
SOLAR ADOPTION To quantify the change in solar adoption in the pre-event and post-event periods around the SRP
rate change, we looked at the number of applications and installations by month in both the APS
and SRP service territories.
The SRP event is visible in a plot of application date versus installation date (Figure 29, top). A
large group of customers applied in December 2014 to meet the grandfathering date. No
applications are logged from January first until late February, when the rate change was finalized
at SRP. The APS trend is included (Figure 29, bottom) for comparison, and we note that there is a
less clear mark of another event at APS (as described in Section II, a $0.70 per solar system kW
size charge was added at the end of 2013).
Figure 30 shows the installation totals by month; the SRP rate change is followed by a staggered
decrease in installations that roughly correlates to the 100 days that customers typically take to
install a project. In comparison, the APS installations by month are steady to increasing in the
same period. Applications by month are shown in Figure 31. The impact of the SRP event on solar
application is complicated by the anticipation of the event. There is an obvious uptick in
applications in December 2014 that doesn’t represent the status-quo prior to that time. On
December 8th, exactly the grandfathering date for the old rate plan, over 500 applications were
received (Figure 32). Note that the decrease in applications at the end of 2015 is only an indication
that those projects were not yet installed to be included in the 2015 data set.
Figure 29: (Left) Application date versus installation date.
Figure 30: (Right) Number of installations per month and the SRP event date of December 8, 2014 marked with dashed line.
29
Figure 31: (Left) Number of applications per month and the SRP event date of December 8, 2014 marked with a dashed line.
Figure 32: (Right) Number of applications per day, November and December 2014, SRP.
To understand the impact of the utility rate change on solar adoption, we categorize projects by
their application date, and recognize the unusual period around December 8, 2014. We estimated
the event’s impact in three ways.
The event’s impact is highest if considered stricly on the basis of rate eligibility. Figure 33 shows
monthly installations grouped by rate eligibility. The monthly installation rate for projects eligible
under the old rate from Jan. 2014 to April 2015 is 311 (95% confidence interval [264-357]). Note
that projects applying in December 2014 were largely installed by that April 2015. For projects
eligible under the new rate, the monthly installation rate from May 2015 through the end of 2015
was 21 [17-25]. A t-test on the monthly installation rates under the old and new electricity rates
showed that the rates were significantly different with p=2e-9. However, this dramatic decrease
of 94% includes the unusually high period of December 2014.
A second way to interpret the event is to use the application period prior to December 2014 as the
baseline, consider the new demand for solar to be the period after January 1st, and ignore the
applications accepted during the month of December 2014 (Figure 34). For projects which applied
prior to the December 2014 rush, the monthly average installation was 287 [244-330] through
February 2015 (includes the 100 days period in which projects are typically installed after
application). For projects which applied after January 1st, the monthly average installations from
May to December was 21 [17-25]. (There were no installations on the new rate prior to May 1.) A
t-test on the average monthly installation rates for the pre-event compared to post-event groups
confirmed that the means are significantly different with p=1e-8. Clearly the timing of the events
is complex and how the applications are accounted for during the critical transition period will
impact how the affects are tallied. But this estimation method also says that monthly installation
rate went down by 93%.
30
A third way of estimating the impact is to consider the applications accepted during the month of
December as represent future demand; customers that likely would have waited longer but because
of the upcoming rate change decided to apply at that time (Figure 35). The baseline period is still
287 applications per month. Project applications from December 2014 through December 2015
show an average installation rate of 142 [68-215] per month. A t-test on the pre-event and
rush/post-event monthly installation rates showed that the rates were significantly different with
p=0.004. The rate of installations post-event decreased about only 51% by this estimate.
Figure 33 The number of SRP solar projects are grouped by the rate eligibility. Also shown are the average monthly installations under the old and new rates dashed lines (311 and 21).
Figure 34: (Left) Number of SRP projects grouped by application date. Pre-event and post-event averages in dashed lines. The categories are Pre-event (applied before Dec. 1, 2014), Application Rush (Dec. 2014), and post-event (applied after Dec 1, 2014).
Figure 35: (Right) Number of SRP solar projects grouped by application date. Averages in dashed lines. The categories are pre-event (applied before Dec. 1, 2014) and Application Rush combined with post-event (applied after Dec 1, 2014).
31
We also projected the impact on installed capacity through 2016 by using the range of missed
installations per month due to the rate change event. According to the monthly installation effects
described in this section, each month 145-290 projects were not installed because of the rate
change. If the typical project size is 8.25 kW (the pre-event average), each month 1.2-2.4 MW of
capacity is not installed due to the rate change. Returning to the EIA 826 net metering data, we
can apply this to the total installed residential PV capacity reported for SRP and compare to the
other two major utilities: Tucson Electric Power (TEP) and Arizona Public Service (Figure 36).
According to the EIA 826 data, SRP ended 2016 with 107 MW of installed residential PV capacity;
without the rate change another 29 to 58 MW might exist. An econometrics study that incorporates
the growth in APS and TEP markets could further isolate the event and its impacts.
Figure 36: EIA Form 826 Net Metered Data residential solar PV installations by month for three major Arizona Utilities and projections of SRP solar estimated without rate change.
32
SYSTEM PRICE DATA SET INFORMATION
The following charts convey information about the average monthly price per kilowatt, reported
annual PV generation, and system size of arrays in Maricopa County for the Arizona Public Service
and the Salt River Project. Data points reflecting appraised values for price were removed, along
with abnormal prices that reflected either data entry errors or outlier scenarios. The research team
looked at 2014 and 2015 data to study the effects of the December 2014 rate re-structuring at SRP,
and also noted the post-event effects of a 2013 change to solar demand charges for APS customers.
The market for residential PV systems changed dramatically in both utility service territories over
the course of the 2013 application period. Monthly averages of each variable were derived with
respect to installation date from January 2014 through December 2015. A system's installation date
reflects when the array was physically erected on a buyer's structure, which normally falls around
100 days after the application date.
Figure 37: Price per kW, 2014 (Left)
Figure 38: Price per kW, 2015 (Right)
Figure 37 depicts the average monthly price per unit of installed capacity for all systems installed
in 2014 for both utilities. Prices for APS trended upward during the first five months of the year
climbing from just above $3,500 in January to nearly $4,500 by May. Installations during this
period likely had application dates that occurred from October 2013 through February 2014. This
is notable because it coincides with a late-2013 ruling by the Arizona Corporation Commission
(ACC) in agreement with APS’ claim that solar customers were not paying their fair share of costs
to support maintenance and upkeep of grid infrastructure. The ACC ruled that APS may implement
modest demand charges of 70 cents per kW of installed capacity for solar customers in order to
recoup some of these costs. At the time of the ruling, average system size for APS solar customers
was 7 kW, so the new charges equated to roughly $5 more on monthly bills for solar customers. It
is possible that this jump in price is related to this event, though this finding is inconclusive. During
the latter half of 2014 and throughout 2015, prices for solar systems in APS territory appear to be
trending down over time as shown in Figure 38.
SRP prices in 2014 appear to move chaotically between roughly $3,350 per kW and $4,750 per
kW of installed capacity with no discernible pattern. The jump in price from a yearly low in
33
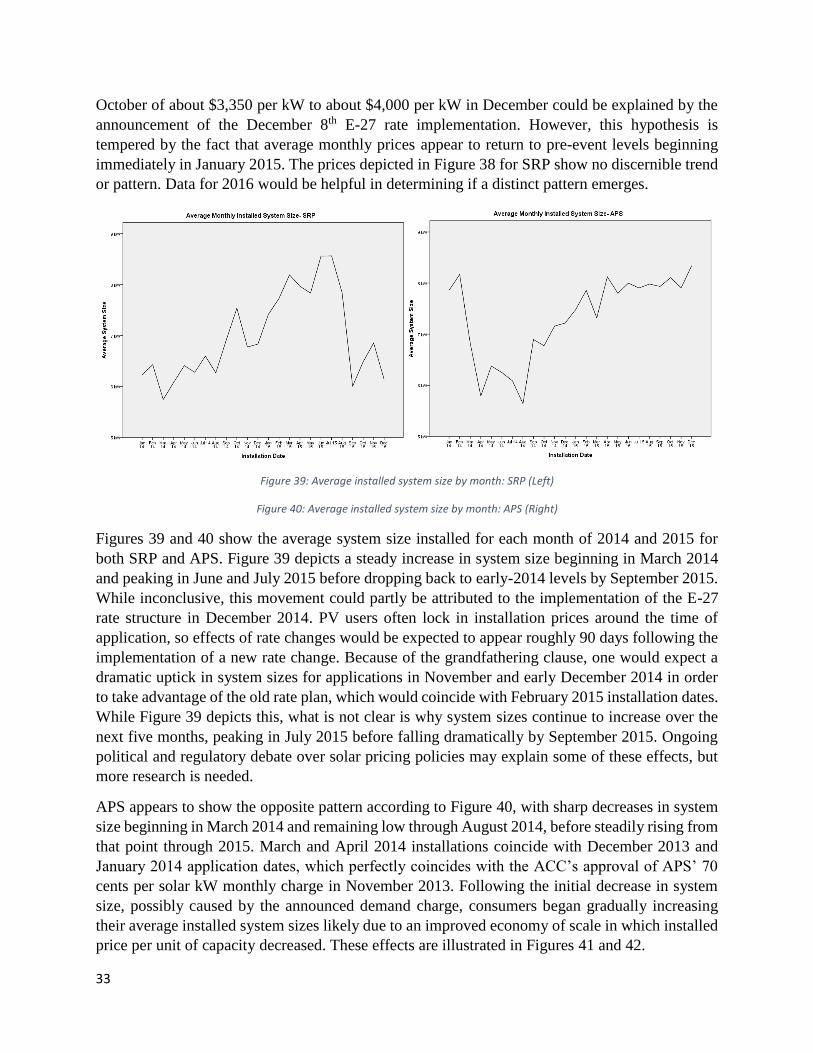
October of about $3,350 per kW to about $4,000 per kW in December could be explained by the
announcement of the December 8th E-27 rate implementation. However, this hypothesis is
tempered by the fact that average monthly prices appear to return to pre-event levels beginning
immediately in January 2015. The prices depicted in Figure 38 for SRP show no discernible trend
or pattern. Data for 2016 would be helpful in determining if a distinct pattern emerges.
Figure 39: Average installed system size by month: SRP (Left)
Figure 40: Average installed system size by month: APS (Right)
Figures 39 and 40 show the average system size installed for each month of 2014 and 2015 for
both SRP and APS. Figure 39 depicts a steady increase in system size beginning in March 2014
and peaking in June and July 2015 before dropping back to early-2014 levels by September 2015.
While inconclusive, this movement could partly be attributed to the implementation of the E-27
rate structure in December 2014. PV users often lock in installation prices around the time of
application, so effects of rate changes would be expected to appear roughly 90 days following the
implementation of a new rate change. Because of the grandfathering clause, one would expect a
dramatic uptick in system sizes for applications in November and early December 2014 in order
to take advantage of the old rate plan, which would coincide with February 2015 installation dates.
While Figure 39 depicts this, what is not clear is why system sizes continue to increase over the
next five months, peaking in July 2015 before falling dramatically by September 2015. Ongoing
political and regulatory debate over solar pricing policies may explain some of these effects, but
more research is needed.
APS appears to show the opposite pattern according to Figure 40, with sharp decreases in system
size beginning in March 2014 and remaining low through August 2014, before steadily rising from
that point through 2015. March and April 2014 installations coincide with December 2013 and
January 2014 application dates, which perfectly coincides with the ACC’s approval of APS’ 70
cents per solar kW monthly charge in November 2013. Following the initial decrease in system
size, possibly caused by the announced demand charge, consumers began gradually increasing
their average installed system sizes likely due to an improved economy of scale in which installed
price per unit of capacity decreased. These effects are illustrated in Figures 41 and 42.
34
Figure 41: $/kW v. Reported Annual Power Generation—SRP (Left)
Figure 42: $/kW v. Reported Annual Power Generation—APS (Right)
Figures 41 and 42 are scatter plots showing the price per kW of systems for SRP and APS in 2014
and 2015, along with their corresponding reported annual electricity generated in kWh. Given
reported annual electricity for systems installed in all 24 months, we can reliably predict these
systems’ price per kW. For both utilities, increases in electricity generation seem to predict
decreasing prices per kW of capacity. The correlation coefficient for SRP is 0.683, which is quite
strong, and the correlation coefficient for APS is 0.514—also strong. This could be explained by
increased competition in the installer market depressing prices, coupled with an economy of scale
in which costs of labor and other inputs hold steady for systems no matter the size so that total
installed price is roughly equal regardless of the size of the project.
35
VI. CONCLUSIONS Our analysis of solar installations in the Salt River Project territory around the time of the rate
change at the end of 2014 shows a decrease in distributed PV adoption coincident with the rate
change. Anticipation of the rate change resulted in a sudden increase in applications in December
2014, and those projects were installed through 2015. Because of this unusual installation pattern,
it is difficult to estimate the decrease in PV adoption exactly, but monthly installation rates
decreased 50 to 95%. As the market stabilizes after the rate change, we expect that more recent
data could help better understand to the long-term adoption trends (we used installations through
2015 only). Price trends related to the rate change were not clear.
In addition to decreasing adoption, we expect changes in the system characteristics and the
marketplace. Interviews suggest that new PV installations under the new electricity rate tend to be
west-facing and will likely begin to include more battery storage systems. These changes will
allow customers to maximize utility bill savings under the new peak demand rates. Interviews also
suggested a decrease in system size and this was confirmed with the dataset as systems under the
new rate were on average smaller than under the old rate. Interviews and media reports highlighted
the loss of installers that provide third-party ownership type projects in the SRP territory. The
dataset also confirmed this change.
Throughout our research, we uncovered additional areas of potential future studies. For example,
Arizona Public Service, also in metro Phoenix, is used for comparison. Examination of the same
2014-2015 period showed that this period is marked by the APS rate change at the end of 2013,
and itself would make for an interesting event study. Nevada and Hawaii underwent significant
state level policy changes which was illustrated in the EIA data and could be studied further. For
the SRP event, further econometric study on TTS variables could provide greater detail on price,
installer, or additional market impacts. An econometrics approach to the solar adoption data could
control for PV market influences such as module price and solar adoption in nearby markets of
Arizona Public Service and Tucson Electric Power.
As utilities continue to adapt to the distributed PV market, understanding rate events and their
impact on PV markets is important. Experience in this work showed that the exact timing of rate
changes as well as anticipation of those changes is key to quantifying the effect of such events.
36
WORKS CITED:
Ardani, Kristen, Chris McClurg, and David Labrador. (2017, Apr. 12). How Much Does a
Rooftop Solar System With Batteries Cost? Retrieved from