234 American Economic Journal: Applied Economics 2014, 6(3): 234–263 http://dx.doi.org/10.1257/app.6.3.234 Effects of School Quality on Student Achievement: Discontinuity Evidence from Kenya † By Adrienne M. Lucas and Isaac M. Mbiti * The most desirable Kenyan secondary schools are elite govern- ment schools that admit the best students from across the country. We exploit the random variation generated by the centralized school admissions process in a regression discontinuity design to obtain causal estimates of the effects of attending one of these elite public schools on student progression and test scores in secondary school. Despite their reputations, we find little evidence of positive impacts on learning outcomes for students who attended these schools, sug- gesting that their sterling reputations reflect the selection of students rather than their ability to generate value-added test score gains. (JEL H52, I21, I28, O15) E lite, prestigious, and highly selective government secondary schools are com- mon in education systems throughout the world. These schools admit a rela- tively small number of high achieving students each year, cost significantly more than other public school options, and are coveted by both students and their par- ents in part due to their students’ superior performance on nationwide assessments. Their alumni are luminaries in business, politics, and civil service and have a dis- proportionate influence on the economic progress of their countries as a result of their careers in the upper echelons of government and business. 1 While such schools are perceived to be academically superior, whether their reputations simply reflect selective admissions or value-added learning is unclear. Additionally, elite schools could focus resources and target the level of instruction toward a certain type of 1 Four Ghanaian presidents and two other African presidents, including Robert Mugabe, attended elite public secondary schools in Ghana. Alumni of similar schools in Kenya include former President Mwai Kibaki, two for- mer vice presidents, and numerous senior political leaders and CEOs. * Lucas: University of Delaware, 419 Purnell Hall, Newark, DE 19716 (e-mail: [email protected]); Mbiti: Southern Methodist University, 3300 Dyer St., Suite 301, Dallas, TX 75275, and J-PAL (e-mail: [email protected]). We are especially grateful to the Kenya National Examination Council, the Kenyan Ministry of Education, and the Teachers Service Commission for providing us with data. The contents of this paper do not reflect the opinions or policies of any of these agencies. The authors bear sole responsibility for the content of this paper. For useful comments and suggestions we thank Kehinde Ajayi, Josh Angrist, David Autor, Abhijit Banerjee, Kristin Butcher, Elizabeth Cascio, Damon Clark, Eric Edmonds, Scott Imberman, Michael Kremer, Kevin Lang, Daniel Millimet, Patrick McEwan, Muthoni Ngatia, Moses Ngware, Owen Ozier, Christian Pop-Eleches, Tavneet Suri, Shobhana Sosale, Miguel Urquiola, and numerous seminar and conference participants. We are grateful for Ronald Wendt for coordinating the secondary school survey data collection. Lucas acknowledges support from a Wellesley College faculty research grant. Mbiti undertook some of this research while a MLK Jr. Visiting Assistant Professor at MIT. Mbiti acknowledges support from a National Academy of Education/Spencer foundation post-doctoral fellow- ship, a SMU Research Grant, and the Brown University Population Studies and Training Center. We dedicate this paper to the memory of David Mbiti who was instrumental in our data collection and provided crucial support and insights. † Go to http://dx.doi.org/10.1257/app.6.3.234 to visit the article page for additional materials and author disclosure statement(s) or to comment in the online discussion forum.
Transcript
234
American Economic Journal: Applied Economics 2014, 6(3): 234–263 http://dx.doi.org/10.1257/app.6.3.234
Effects of School Quality on Student Achievement: Discontinuity Evidence from Kenya †
By Adrienne M. Lucas and Isaac M. Mbiti *
The most desirable Kenyan secondary schools are elite govern-ment schools that admit the best students from across the country. We exploit the random variation generated by the centralized school admissions process in a regression discontinuity design to obtain causal estimates of the effects of attending one of these elite public schools on student progression and test scores in secondary school. Despite their reputations, we find little evidence of positive impacts on learning outcomes for students who attended these schools, sug-gesting that their sterling reputations reflect the selection of students rather than their ability to generate value-added test score gains. (JEL H52, I21, I28, O15)
Elite, prestigious, and highly selective government secondary schools are com-mon in education systems throughout the world. These schools admit a rela-
tively small number of high achieving students each year, cost significantly more than other public school options, and are coveted by both students and their par-ents in part due to their students’ superior performance on nationwide assessments. Their alumni are luminaries in business, politics, and civil service and have a dis-proportionate influence on the economic progress of their countries as a result of their careers in the upper echelons of government and business.1 While such schools are perceived to be academically superior, whether their reputations simply reflect selective admissions or value-added learning is unclear. Additionally, elite schools could focus resources and target the level of instruction toward a certain type of
1 Four Ghanaian presidents and two other African presidents, including Robert Mugabe, attended elite public secondary schools in Ghana. Alumni of similar schools in Kenya include former President Mwai Kibaki, two for-mer vice presidents, and numerous senior political leaders and CEOs.
* Lucas: University of Delaware, 419 Purnell Hall, Newark, DE 19716 (e-mail: [email protected]); Mbiti: Southern Methodist University, 3300 Dyer St., Suite 301, Dallas, TX 75275, and J-PAL (e-mail: [email protected]). We are especially grateful to the Kenya National Examination Council, the Kenyan Ministry of Education, and the Teachers Service Commission for providing us with data. The contents of this paper do not reflect the opinions or policies of any of these agencies. The authors bear sole responsibility for the content of this paper. For useful comments and suggestions we thank Kehinde Ajayi, Josh Angrist, David Autor, Abhijit Banerjee, Kristin Butcher, Elizabeth Cascio, Damon Clark, Eric Edmonds, Scott Imberman, Michael Kremer, Kevin Lang, Daniel Millimet, Patrick McEwan, Muthoni Ngatia, Moses Ngware, Owen Ozier, Christian Pop-Eleches, Tavneet Suri, Shobhana Sosale, Miguel Urquiola, and numerous seminar and conference participants. We are grateful for Ronald Wendt for coordinating the secondary school survey data collection. Lucas acknowledges support from a Wellesley College faculty research grant. Mbiti undertook some of this research while a MLK Jr. Visiting Assistant Professor at MIT. Mbiti acknowledges support from a National Academy of Education/Spencer foundation post-doctoral fellow-ship, a SMU Research Grant, and the Brown University Population Studies and Training Center. We dedicate this paper to the memory of David Mbiti who was instrumental in our data collection and provided crucial support and insights.
† Go to http://dx.doi.org/10.1257/app.6.3.234 to visit the article page for additional materials and author disclosure statement(s) or to comment in the online discussion forum.
VoL. 6 No. 3 235lucas and mbiti: school quality and student achievement in kenya
student to bolster their public reputations and rankings relative to other schools. Therefore, if these schools deliver valued-added learning, the benefits might accrue heterogeneously to students depending on the characteristics of the student and the schooling environment.
In this paper, we employ a regression discontinuity design to estimate the impact of attending an elite secondary school in Kenya on student graduation and achieve-ment on the secondary school exit examination. The key conceptual difficulty in assessing the impact of attending an elite school on student outcomes is the endoge-nous selection of students into schools. To address this difficulty, we rely on Kenya’s secondary school admissions rule that creates discontinuities in the probability of national school admission. Specifically, students are admitted to a single government secondary school based on their scores on the national standardized primary school exit exam, district-specific quotas, and school preferences that students express prior to taking the exit exam. National schools, the most elite secondary schools in Kenya, admit the students with the top scores on the primary school exit exam from each district in the country, while students with lower scores are admitted to less renowned government secondary schools, and students with the lowest scores are denied admission to any government secondary school (Ozier 2011). By comparing the outcomes of students who were barely admitted to a national school to those who barely missed admission, we can credibly estimate the effect of national school admission on academic outcomes.
Especially salient to our empirical design are the multiple district-specific quo-tas within each national school. In order to promote national unity and ameliorate concerns over regional inequality, each national school has a quota of the number of students it admits from each district in the country. These district-specific quotas generate multiple admission test score thresholds within each school, such that the marginal student admitted from each district is not necessarily the student with the lowest test score in the elite school. In contrast, a typical regression discontinuity design relies on a single admission score threshold, where the marginally admitted students have the lowest scores in the school. If teachers target their instruction to students near the median, then the typical regression discontinuity design could yield zero or even negative estimates as the marginally admitted students in the regression discontinuity sample may be left behind by the level of instruction (Duflo, Dupas, and Kremer 2011). The existence of multiple thresholds in our setting allows us to circumvent this concern and further enables us to credibly examine the heterogenous effects of national schools by students’ baseline test scores and their percentile rank-ing within a national school. Thus we provide novel insights into the types of students who may benefit from attending these schools and also how schools might be targeting their instructional resources. Additionally, we are able to explore the heterogeneous impacts of national school attendance by the quality of the alternative schooling option since the quality of the non-national schools varies by a student’s home province. If students who are not admitted to national schools have good quality alternatives, then this could reduce the potential impact of attending the most prestigious schools (see Deming et al. 2011 for an example in Charlotte-Mecklenberg).
Despite the public perception that elite, selective secondary schools are academi-cally superior, previous studies using regression discontinuity designs have found
236 AmEricAN EcoNomic JourNAL: AppLiED EcoNomics JuLy 2014
surprisingly mixed evidence on the impacts of attending elite schools in various settings on students’ educational outcomes. Studies such as Jackson (2010), Park et al. (2010), and Pop-Eleches and Urquiola (2011) found that students who attended elite schools had improved test scores. In contrast, a number of other studies such as Abdulkadiroglu, Angrist, and Pathak (2011); Bui, Craig, and Imberman (2011); Clark (2010); de Hoop (2010); Dobbie and Fryer (2011); and Sekhri and Rubinstein (2010) did not find any evidence that these schools improved learning outcomes. These findings are corroborated by Cullen, Jacob, and Levitt (2006) and Zhang (2013) who exploit randomized school choice lotteries to show that elite (or high performing) schools did not improve student test scores in Chicago or a Chinese provincial capital, respectively.
Due to our unique empirical setting, we are able to build on these studies by more rigorously examining the heterogeneity in treatment effects by the quality of the nonelite options and students’ baseline characteristics, such as baseline test score and within-school percentile ranking. Coupled with supplementary survey data from a small sample of secondary schools, these analyses allow us to highlight the differences in instructional resource allocation employed by elite schools compared to lower tier schools. Since all primary school graduates automatically apply to secondary school, we further avoid concerns about selective application biasing our results as our data contain the universe of students who graduated from primary school in Kenya in 2004. This improves the external validity of our findings as our results are not only relevant for students who chose to apply to an elite school. Finally, by focusing on the best students in Kenya, our analysis provides insights into the institutions that nurture and develop future leaders who are likely to shape the economic and social progress of the country.
Our results show that attending a national school results in exposure to a higher quality and more diverse peer group in a better resourced schooling environment. We also find that national school admission does not result in a change in the prob-ability of timely progression through secondary school. We further find little evi-dence of positive impacts of national school graduation on test scores despite the superior peer quality and resources found in national schools. Our estimates are sufficiently precise that we can rule out moderately sized effects of approximately one-tenth of a standard deviation or larger in the composite test score, even though peers at national schools scored about one-half of a standard deviation higher on the baseline test relative to peers at alternative schools. We also do not find statistically significant heterogeneous test score effects based on a student’s baseline test score, quality of alternative schooling options, gender, or socioeconomic status. We find marginally significant heterogeneous effects by within-school percentile. While, on average, students completed the same number of subject exams across the admis-sions threshold, we do find evidence that the number of subject exams increased with baseline test scores and within-national school percentile rankings for those students who graduated from a national school. However, for students who gradu-ated from provincial schools we find the opposite relationship. Since the number of exams reflect the number of courses students took in their final year of secondary school, students who took fewer exams, and therefore fewer courses, could have devoted more time to each exam and course. Taken together, our heterogeneity
VoL. 6 No. 3 237lucas and mbiti: school quality and student achievement in kenya
results on the number of subjects completed and the suggestive patterns found in the test score results, combined with administrative reports on the prevalence of remedial support in national schools, suggest that these elite schools may have tried to improve the national exit exam performance of weaker students by limiting the number of courses they took and, perhaps, tailoring the level of instruction to them through additional remedial instruction. As all national schools admit students from the lowest performing districts in Kenya, we argue that these patterns may have been a rational response to the competitive environment in which national schools’ reputations and rankings depend on average test scores.
While we generally find little evidence of test score gains, we do, however, find a robust causal association between national school graduation and a higher Swahili subject test score. We posit three explanations, among which we are unable to distin-guish empirically. First, as national schools are the most ethnically diverse schools in the country, students could have used Swahili as a lingua franca in peer con-versation, increasing their proficiency. In contrast, non-national schools have more localized catchment areas that would enable students to converse in local, ethnic languages. Second, in accordance with their original mandates to increase national unity, some national schools allocated more instructional time to Swahili, thereby emphasizing the importance of Swahili as a national language. Third, non-national schools reported more difficulty hiring Swahili instructors.
Overall, we argue that the limited evidence of test score gains in national schools is meaningful due to our ability to rule out moderately sized effects. Moreover, the lack of significant results for students with the lowest quality alternative option and multiple discontinuities within each school, such that we are not relying on the stu-dent with the lowest test score in each national school for identification, enhance the credibility of our results. Our findings suggest that the recent $30 million govern-ment expansion of the national school system will do little to boost learning levels, yet promoting national unity and identity through a common language and exposure to diverse peers could be important justifications for a national school system in a country like Kenya that has a high degree of ethnic polarization.
I. Secondary Education in Kenya
A. Background
Kenya follows an 8- 4- 4 system of education, where primary school consists of eight years and secondary school and university are each four years. Both primary and secondary school conclude with nationwide standardized exams that are cen-trally graded and determine which students qualify for the next level of education. Upon completion of primary school, pupils take the Kenya Certificate of Primary Education (KCPE) exam. The KCPE comprises five compulsory subjects, is graded from 0 to 500 points, and is used in the secondary school admissions process. At the conclusion of secondary school, students take the Kenya Certificate of Secondary Education (KCSE) exam. For the KCSE, students take 7 to 9 subject exams out of the 30 possible examination subjects. English, Swahili, and mathematics are compulsory subjects as are at least two sciences, one humanity, and one practical
238 AmEricAN EcoNomic JourNAL: AppLiED EcoNomics JuLy 2014
subject.2 The maximum score on the KCSE is 12 points. Students may take up to nine subject exams with the KCSE score computed as the average of seven scores: the compulsory subjects, the highest two science scores, the highest humanities score, and the highest practical score. Students register for the KCSE exam near the start of their final year of secondary school. A student’s course load in their final year is then limited to the KCSE exam subjects for which they had registered. In addition to certifying secondary school completion, the KCSE score is used for admission to post-secondary institutions (i.e., universities and vocational and tech-nical training institutions) and as an employment qualification.
In 2004, almost 655,000 students graduated from the approximately 21,000 gov-ernment and private primary schools that administered the KCPE. Four years later in 2008, 35 percent of this cohort graduated from one of 5,158 secondary schools and took the KCSE. Across all secondary grades the 2004 gross enrollment rate was 48 percent, with a 40 percent net enrollment rate (World Bank 2004).
Each Kenyan government secondary school belongs to one of three tiers: national, provincial, or district. The national schools are the most elite government schools and the most prestigious secondary schools in the country. They are also among the oldest schools in the country, often modeled after British public schools.3 In 2004, these 18 single-sex boarding schools admitted approximately 3,000 of the top primary school candidates from across the nation, with places reserved for students from each district.4 The almost 1,000 provincial schools, the second tier, admitted the top remaining students from within a province. Students who could not gain admission to a national or provincial school could be admitted to one of approx-imately 3,000 district schools, the lowest quality government secondary schools. Students with the lowest scores were not admitted to government secondary schools. Almost 80,000 students graduated from provincial schools and over 115,000 stu-dents graduated from district schools in 2008. There were approximately 850 private secondary schools that admitted students from KCPE primary schools, followed the same curriculum, and utilized many of the same teaching materials as government secondary schools. Although some private schools were selective, on average, they were most similar to district schools based on incoming student KCPE scores and KCSE scores at graduation. In 2008 only 12 percent of secondary school graduates graduated from private schools, and our data include these students.5
National schools have better physical and human capital resources on a num-ber of margins. Relative to other schools, they have better facilities, offer a larger variety of courses, are staffed by teachers with more education and experience,
2 Sciences are biological science, biology, chemistry, physics, and physical science. Humanities are Christian religious education, geography, Hindu religious education, history, and Islamic religious education. Practical sub-jects are accounting, Arabic, art and design, aviation, construction, computer studies, commerce, drawing design, economics, electronics, French, German, home science, metalwork, music, and woodwork.
3 For example, Lenana School and Nairobi School were founded by the colonial administration as Duke of York School and Prince of Wales School. They originally admitted only white students, but were integrated following independence.
4 After gaining independence from the United Kingdom in 1963, the Kenya Commission on Education pro-moted the use of secondary schools as vehicles to promote national unity, resulting in the three-tiered system with admissions based on both merit and region (Gould 1974).
5 An additional small, international private school sector follows foreign (non-Kenyan) curricula. Students at such schools do not take the KCPE or KCSE and do not appear in our data.
VoL. 6 No. 3 239lucas and mbiti: school quality and student achievement in kenya
and provide a higher quality peer group. They have on average 1.5 times the land-holdings per student relative to other government schools, allowing for additional recreational and classroom space (Ministry of Education 2008). They generally have well-equipped computer labs, electricity, and modern buildings and toilets, while provincial schools and district schools are far less well-equipped, often lack-ing electricity and indoor plumbing (Nomadic Kenyan Children’s Educational Fund (NCKEF) 2004). For example, the Nairobi School, a national boys school in Nairobi, has a campus of over 200 acres that includes a swimming pool, ten-nis and basketball courts, and woodwork and metalwork facilities (Nairobi School 2012). Another national school, Mangu High, owns a small aircraft for use by its aviation students. Additionally, national schools offer a wider variety of subjects. While the full national curriculum contains 30 subjects, most schools offer fewer than 12 subjects due to the high cost of providing appropriate facilities and instruc-tors. In 2008, the national schools offered an average of 16 subjects, the average provincial school offered about 12 subjects, and district and private schools each offered on average about 11 subjects. Almost all national schools offered computer studies, French, and German while few provincial or district schools offered these courses. Two national schools were the only government schools that offered the aviation course in 2008. National schools have similar pupil-teacher ratios com-pared to other government secondary schools, but their teachers have more train-ing and experience. In national schools, 80 percent of teachers had degrees beyond secondary school, compared with 68 percent in other government secondary schools (Ministry of Education 2008). National school teachers were almost twice as likely to hold advanced degrees and had, on average, one additional year of teaching expe-rience relative to their provincial school counterparts (Ministry of Education 2008). Finally, the quality of peers, as measured by KCPE scores, is significantly higher in national schools relative to other schools in Kenya.
To provide these superior resources, national schools charged higher comprehen-sive fees. For the 2013 school year, national schools charged, on average, Ksh 90,942 (US$1,046), while provincial schools charged, on average, Ksh 42,423 (US$488).6 The average fees for national schools exceeded the Kenyan GDP per capita of approximately $900 (World Bank 2014). National schools received approximately the same amount of funding per student from the government as the other types of schools (Ksh 20,000 in 2006), but their total spending per pupil was greater because of the higher student fees (Onsomu et al. 2006).
B. selection into secondary schools
Government secondary school admissions are conducted centrally by the Ministry of Education using a computerized system. Each national school has a set of district quotas, the number of students to be admitted from each district, that are predetermined by the Ministry of Education. When students register for the KCPE
6 Based on the 2013 fee schedules of a sample of 6 national and 41 provincial schools with students in our regression discontinuity sample. Conversion to US dollars based on the January 2013 average exchange rate of Ksh 86.98 to US$1.
240 AmEricAN EcoNomic JourNAL: AppLiED EcoNomics JuLy 2014
they list two preferred national schools, two preferred provincial schools, and two preferred district schools. This registration, along with the associated school pref-erence listing, occurs prior to students taking the KCPE exam. These preferences, KCPE score, and district quotas determine to which secondary school a student is admitted. A student is admitted to at most one government secondary school.
The admissions process is conducted separately for boys and girls as national schools are gender-specific. After KCPE exams are centrally scored, students are ranked within each district and gender by descending KCPE score. The highest ranked student in a district (by gender) is placed in his first choice national school. Each subsequent student in the district is placed in his first choice national school, if the school still has an opening. If the district-specific quota of a student’s first choice school is already full, the placement algorithm considers the second choice school. The student is admitted to the second choice national school if that school’s district-specific quota has not been filled. If both preferred national schools are already full, then the student is admitted to a preferred provincial school following the same algorithm, even if other, nonpreferred, national schools have openings for students from the same district.
Therefore, under this admissions mechanism, two students with the same stated preferences and KCPE scores only separated by 1 point (out of 500) could be admit-ted to schools of different tiers. Students were notified of their school placement prior to the start of the school year in January. An unofficial second round occurred after the initial formal placements. Students who were unhappy with their placement could directly apply to an alternative school. They were admitted at the discretion of the school principal, provided that places were available due to an admitted student not matriculating at the start of the school year.7
II. Empirical Strategy
If students were placed randomly into schools, then we could estimate the treat-ment effect of attending a national school as follows:
(1) y i = α + β T i + ε i ,
where y is the outcome variable (i.e., secondary school test score or a binary indi-cator for timely graduation) for student i, T is a binary variable that indicates if the student was subject to the treatment, attending a national school for four years, and ε is the idiosyncratic error. As students are not randomly allocated to schools, students with higher ability and unobserved characteristics that are likely correlated with sec-ondary school outcomes may be more likely to attend national schools. This would cause T and ε to be correlated, and thus the OLS estimates of equation (1) would produce biased estimates of the treatment effect.
7 Admission to provincial and district schools occured in a similar two round manner. Lack of documentation and poor adherence to the rule based assignment prevented us from implementing our empirical strategy for these lower tiers.
VoL. 6 No. 3 241lucas and mbiti: school quality and student achievement in kenya
In Kenya, the Ministry of Education admissions algorithm provides exogenous variation in which students are admitted to national schools. We exploited this variation for identification through a regression discontinuity (RD) framework. First, we implemented the Ministry of Education admissions algorithm with the actual district quotas and student KCPE scores and stated preferences. This gener-ated the list of students admitted (and not admitted) to each national school. These lists created a number of discontinuities where students whose scores could be as close as one point apart were admitted to schools of different tiers. Second, we solved for the admissions threshold for each district-school pair. The KCPE score of the last student admitted from a district was the effective score cutoff, c sj , for school s for district j, i.e., the minimum score that a student from district j needed to attain in order to be admitted to school s. Third, we established for each student the relevant national school and its corresponding cutoff, c sj . We defined the relevant national school as the national school to which the student was admitted for students admitted to national schools or the national school in the student’s preference set with the lowest KCPE score cutoff for students not admitted to national schools.8 For notational simplicity, we henceforth denote s as the relevant national school. Since cutoffs vary by school and the applicant’s district we follow Pop-Eleches and Urquiola (2011) and define the running variable, r i , as the distance (in points) between student i ’s KCPE score, Kcp E i , and the relevant cutoff, c sj :
(2) r i = Kcp E i − c sj .
A student would have gained admission to a national school if Kcp E i ≥ c sj , while those students whose scores were below the cutoff, Kcp E i < c sj , were not admitted to any national school.
Adherence to the rule-based admission process was imperfect for two reasons. First, a student admitted to a national school might not have matriculated or could have dropped out prior to completion. Second, as discussed above, places in national schools that were not claimed by those initially admitted were allocated at the dis-cretion of the principal to direct applicants during the unofficial second round. Due to this imperfect compliance around the cutoff, we employ a “fuzzy” regression discontinuity design that we estimate with a two-stage least squares framework (Angrist and Lavy 1999; Hahn, Todd, and Van der Klaauw 2001; Lee and Lemieux 2010). We define treatment as graduating from a national school, which we interpret as attending a national school for four years, and use national school (rule based ini-tial) admission as an instrument for graduating from a national school as follows:9
(3) T i = δ1 { r i ≥ 0} + f ( r i ) + X i Γ + ν i ,
8 An alternative strategy is to treat the unit of observation as a student-choice instead of a student, allowing up to two observations per student. The empirical results using this alternative methodolgy are substantively similar.
9 An alternative specification of treatment could be the initial matriculation to a national school, but data limita-tions preclude this option. We prefer our specification for a number of reasons. First, a student who matriculated but dropped out is not fully treated by a national school. Second, almost all students who graduated from a national school attended that school for all four years. Third, transferring to a national school (after the second round of admissions) is extrememly rare and never occurs after the start of the third year. Nevertheless, a few students who we observe graduating from a provincial school might have initially matriculated to a national school, and are therefore partially treated, although this is also rare.
242 AmEricAN EcoNomic JourNAL: AppLiED EcoNomics JuLy 2014
where 1{ r i ≥ 0} is an indicator function that takes a value of 1 for students admit-ted to national schools, i.e., Kcp E i ≥ c sj , f ( r i ) is a smooth function of the running variable allowed to vary on either side of the discontinuity; X is a vector of control variables that includes a dummy variable for public primary school graduation, dis-trict fixed effects, a set of school choice 1 dummy variables, a set of school choice 2 dummy variables, and relevant national school choice by district interactions; while v i is an idiosyncratic error term assumed to be independent across districts but allowed to be correlated between students within the same district.10 A student’s KCPE score is absorbed in our specifications as it is a linear combination of our running variable (the difference between the KCPE score and the relevant cutoff ), the district fixed effects, and relevant school choice by district controls. Further, because school choices are mutually exclusive, completely exhaustive, and differ by gender, a variable controlling for gender is absorbed by other dummy variables. The relevant school choice by district interactions control for the relevant “risk set” (akin to lottery fixed effects) as students compete for national school places against students from their own district with the same relevant national school. In our base-line specification, f ( r i ) is a piecewise linear function that varies discontinuously at r i = 0, the effective admissions threshold. In robustness checks we include a third-degree polynomial that varies at r i = 0 as an alternative functional form of f ( r i ).
The second stage is then
(4) y i = α + β T i + f ( r i ) + X i θ + ε i ,
where we instrument for the treatment, T i , with equation (3). Other notation is as in previous equations.
As with all regression discontinuities, the identification assumption is that as the discontinuity threshold is approached from above or below, the individuals are essentially identical prior to treatment. Thus we would expect that in the absence of differential treatment, these students would have similar outcomes at the conclusion of secondary school.
We use this strategy to estimate student specific outcomes of timely completion and test scores as well as test for discontinuities in school characteristics, replacing y i with the appropriate outcome.
A number of features of our application of the RD design are particularly note-worthy. First, all students who took the KCPE effectively applied to all types of secondary schools, including national schools, in contrast to other school systems that require an additional application for selective schools. This feature enhances the external validity of our findings as we do not have to correct for selection in the application process. Second, we are not relying exclusively on the lowest scor-ing students in a national school for identification. A potential critique of the typi-cal regression discontinuity design in education settings is that the teachers in elite schools may not be targeting their instruction to students who were barely admitted, but rather to students who were closer to the median (Duflo, Dupas, and Kremer
10 An alternative approach to control for school preferences is to include a set of dummy variables for the inter-action between school choices 1 and 2. We include this specification as a robustness check in Section VI.
VoL. 6 No. 3 243lucas and mbiti: school quality and student achievement in kenya
2011). In most settings, students whose scores are close to the median of the elite school have scores far from the admissions threshold. In our setting, each school has multiple district-specific effective score cutoffs. Therefore, the test scores of the marginally admitted students from each district could have been quite different and not necessarily the lowest scores in the school. For example, for Alliance Boys High School the effective KCPE cutoff score was 459 (out of 500) for students from Mbeere district in the Eastern province, and 346 for students from Ijara district in the North Eastern province. The last boy admitted from Mbeere had a score above both the minimum and median scores of students admitted to Alliance School, yet he was a marginally admitted student in our RD sample. The range of district-specific cut-off scores within a national school averaged 142 points. Consequently, we are able to test for differential effects by both KCPE score and relative percentile within a national school. Third, the quality of the non-national school option for each student varies by home province. Girls in Nairobi province, for example, had higher quality provincial school options than girls from the North Eastern province. Therefore, we can also test for heterogeneity by the quality of the available non-national schools.
III. Data
For this study, we use administrative test scores and district quotas for students who graduated from primary school in 2004. Our test score data are the KCPE and KCSE administrative records from the Kenya National Examination Council (KNEC). The KCPE data contain secondary school preferences, KCPE scores, gender, district, and primary school type for the universe of students who took the KCPE in 2004. We match the 2004 KCPE data to the administrative examination records of all students who took the KCSE in 2008.11 The KCSE records contain each student’s composite and subject KCSE scores, and the school in which the stu-dent was enrolled at the time of the exam. Table 1 contains select summary statistics by school type. Not surprisingly, the average KCPE and KCSE scores of national school graduates were the highest.
We combine the KCPE score and student preferences data with the Ministry of Education’s district quotas for each national school. From these data, we generate the rule-based secondary school admission for each student. The effective cutoff for each district-school pair is the lowest KCPE score of an admitted student from a particular district. District-specific effective cutoffs for national schools ranged from 234 to 467 points with a mean of 419.
For most of our analysis we restrict our sample to those students whose KCPE scores are within one-half of a standard deviation, 34 points, of the relevant national school cutoff, | r i | ≤ 34. Figure 1 illustrates the KCPE and KCSE scores for all stu-dents and those in the RD sample of plus and minus 34 points of the threshold. The KCPE exam was scored on an integer scale from 0 to 500 (panels A and B). The KCSE was scored on an integer scale from 1 to 12 (panels C and D). As expected, students with KCPE scores within the RD sample had higher scores on both exams
11 Of the students who took the KCSE in 2008, we are able to match 97 percent of them to their KCPE scores.
244 AmEricAN EcoNomic JourNAL: AppLiED EcoNomics JuLy 2014
when comparing panel A to B and panel C to D. One potential concern is that test scores reflect incomplete information due to too many scores at the maximum or minimum. No students in our RD sample earned a 0 or a perfect 500 on the KCPE exam (panel B). Five percent of our sample earned a perfect 12 on the KCSE and 0.02 percent earned the minimum score of 1 (panel D). Given the few students with
Table 1—Summary Statistics
Primary Secondary school graduates (2008)school
graduates (2004) All
National school
Provincial school
District school
Private school
Disability school
Unknown type
Number of students 651,647 229,503 3,100 79,394 115,435 28,578 309 2,687
Number of schools 5,158 18 943 3,190 859 6 142
Average KCPE score 246.0 288.4 414.4 322.5 266.0 273.7 331.7 251.1 (out of 500) (67.8) (60.6) (33.2) (49.8) (50.5) (66.9) (85.0) (58.9)Average KCSE score 4.92 9.58 6.23 4.05 4.38 6.97 3.19 (out of 12) (2.4) (1.79) (2.3) (1.9) (2.6) (3.1) (1.9)Average number of 11.0 16.4 12.2 10.8 10.9 12.5 10.1 subject tests offered (1.3) (2.7) (1.3) (1.0) (1.4) (1.8) (1.4)Percent male 51.7 52.6 56.0 53.7 53.0 48.2 49.5 48.6Percent graduating from public primary schools
92.6 87.1 49.2 81.6 93.7 80.4 57.6 89.2
Note: Standard deviations appear in parentheses.
source: Calculations based on Kenya National Examination Council data.
0
1,000
2,000
3,000
4,000
Num
ber
of s
tude
nts
0 100 200 300 400 500
KCPE score
Panel A. All primary school graduates
0
100
200
300
Num
ber
of s
tude
nts
200 300 400 500
KCPE score
Panel B. Primary school graduates in RD sample
0
20,000
40,000
Num
ber
of s
tude
nts
1 2 3 4 5 6 7 8 9 10 11 12
KCSE score
Panel C. All secondary school graduates
0
1,000
2,000
3,000
Num
ber
of s
tude
nts
1 2 3 4 5 6 7 8 9 10 11 12
KCSE score
Panel D. Secondary school graduates in RD sample
Figure 1. KCPE and KCSE Distributions
Note: Panels B and D: sample limited to students within the +/− 34 KCPE point window of the relevant national school cutoff.
VoL. 6 No. 3 245lucas and mbiti: school quality and student achievement in kenya
perfect scores, and that they are evenly split between national and provincial schools, we do not expect top coding in test scores to significantly affect our findings.
IV. Results
A. Graduation from a National school
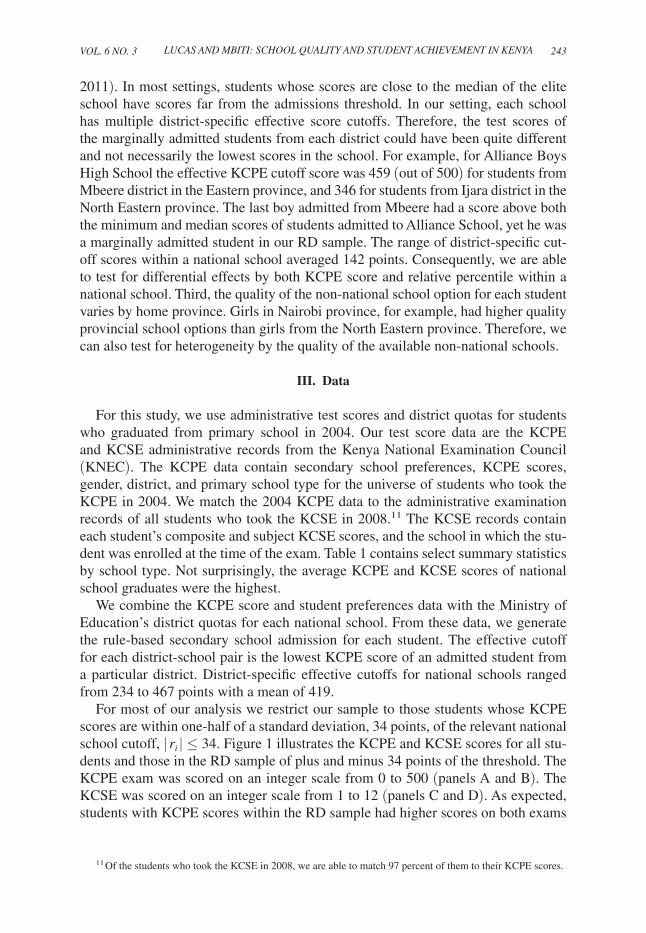
Figure 2 illustrates the first-stage relationship between national school graduation and our running variable, the difference between a student’s KCPE score, and their relevant national school cutoff. Students with scores above the cutoff were admitted to national schools in the first round and those with scores below the cutoff were not. For a given distance to the relevant national school cutoff, each circle represents the portion of students who graduated from a national school. The data are plotted using one point bins, the smallest possible bin size given the integer nature of the KCPE score. The solid lines are fitted values from a bivariate linear regression, estimated separately on either side of the threshold.
The figure shows that the admissions rule had substantial, but imperfect, adher-ence. Students with scores that met or exceed the threshold (i.e., r i ≥ 0) were sub-stantially more likely to graduate from a national school than students whose scores were one point below the threshold (i.e., r i = −1). The vertical distance between the solid lines at the threshold approximates δ in equation (3) without the additional X i covariates.
0
0.2
0.4
0.6
0.8
1
Pro
babi
lity
of n
atio
nal s
choo
l gra
duat
ion
−30 −20 −10 0 10 20 30
KCPE − cutoff
Figure 2. Probability of National School Graduation
Notes: “KCPE − cutoff” is the KCPE score minus the relevant national school cutoff score. See text for details on the calculation of the cutoff. Each point is the mean of the probability of graduation from a national school within nonoverlapping 1 point bins. The solid lines are fitted values from a linear specification, separately estimated on each side of the admissions thresh-old, i.e., KCPE − cutoff = 0.
246 AmEricAN EcoNomic JourNAL: AppLiED EcoNomics JuLy 2014
Table 2 contains an estimate of equation (3), confirming the statistical signifi-cance of the discontinuity seen in Figure 2. Students that met or exceeded their relevant national school admissions cutoffs were about 50 percentage points more likely to graduate from a national school than their counterparts who barely missed qualifying for admission. Therefore, the admissions rule was followed with strong, but imperfect, adherence, and we use a student’s rule-based admission as an instru-ment in our implementation of the fuzzy regression discontinuity below.
B. Differences in school characteristics
Before we present the effect of national schools on achievement, we explore the differences in school characteristics across the admissions threshold using the fuzzy regression discontinuity design. As outlined in Section IIA, national and non-national schools differed on a number of margins. Due to data constraints, we can only empirically test for discontinuities in a limited number of these characteris-tics. To implement this process we use various measures of school characteristics as outcomes in the two-stage least-squares specification defined by equations (3) and (4). Table 3 contains the results. In column 1 we use the number of KCSE subjects offered by a school as a proxy for school resources. All schools must offer at least seven subjects: mathematics, English, Swahili, two science subjects, one humani-ties subject, and one practical subject. The complete secondary curriculum contains 30 subjects, and the inclusion of subjects beyond the minimum is at each school’s discretion. While an admittedly coarse measure of school resources, offering more subjects requires additional specialized teachers, classrooms, and perhaps special equipment, such as aircraft.12 Table 3 column 1 shows that students who graduated from national schools had about 2.6 more subjects available to them, reflecting the higher level of resources in national schools.
12 Since the marginal cost of an additional subject might be cheaper for larger schools and national schools are larger than some provincial schools, we include the total size of the graduating cohort as an additional control vari-able. Our result is robust to the removal of this control.
Table 2—First Stage Relationship: Probability of National School Graduation
Graduate from national school
Admitted to a national school 0.492***(0.022)
Window +/− 34
Observations 14,439r2 0.54
Notes: Sample limited to students within indicated window of the relevant national school cut-off. Linear probability model. Controls: piecewise linear function of KCPE score minus cutoff; district, national school preferences, and public primary school dummy variables; and interac-tions between relevant national school and district dummy variables. Standard errors clustered at the district level appear in parentheses.
*** Significant at the 1 percent level. ** Significant at the 5 percent level. * Significant at the 10 percent level.
VoL. 6 No. 3 247lucas and mbiti: school quality and student achievement in kenya
We consider the mean and the dispersion of peer KCPE scores, two peer charac-teristics that other studies (e.g., Duflo, Dupas, and Kremer 2011) have shown to be important determinants of a student’s own achievement. We test for a discontinuity in mean peer quality (as measured by the standardized peer KCPE scores) and find that students in national schools were exposed to higher quality peers (column 2). The IV estimates indicate that the increase in mean peer quality was about one-half of a standard deviation in national schools. However, we do not find evidence of a change in the dispersion of peer scores (as measured by the coefficient of variation of peer KCPE scores) around the admissions threshold (column 3). Overall, the first three columns in Table 3 reinforce the conventional belief in Kenya that national schools provided a higher quality educational experience than other government schools.
National schools also differed from other government schools on a number of additional margins that do not have clear achievement implications. Given that eth-nic and district boundaries are closely related in Kenya, national schools should be more ethnically diverse than non-national schools because they draw students from the whole nation, rather than from a localized catchment area such as a district. In columns 4 and 5, we explicitly test for a discontinuity in within-school diversity. Due to data limitations we base our measure of diversity on students’ home districts, a reasonable proxy for differences in ethnicity and native language in Kenya. In column 4, we use an Herfindahl-Herschman index (HHI) of diversity of graduates’ home districts. A school in which all graduates came from the same district would have a value of 1, while a more diverse school would have an HHI closer to 0.
Table 3—Differences in School Characteristics at the National School Admissions Threshold
School resources School peers
Number of subjects
offered
Peer KCPE scores
KCPE coefficient of
variationEthnic HHI
Portion from other
districts(1) (2) (3) (4) (5)
Graduate from a 2.636*** 0.441*** 0.521 −0.305*** 0.280*** national school (0.174) (0.058) (0.328) (0.033) (0.045)Window +/− 34 +/− 34 +/− 34 +/− 34 +/− 34
Notes: Standard errors clustered at the district level appear in parentheses. All columns are instrumental variables regressions with admission to a national school as an instrument for graduation from a national school. Sample lim-ited to students who graduated from secondary school and have KCPE scores within stated window of the relevant national school cutoff. Controls: piecewise linear function of KCPE score minus cutoff; district, national school preferences, and public primary school dummy variables; and interactions between relevant national school and dis-trict dummy variables. Column 1: the dependent variable is the number of distinct subject exams completed by all peers. Includes the number of peers as an additional control. Column 2: the dependent variable is the standardized peer KCPE score. Column 3: the dependent variable is the coefficient of variation of peer KCPE scores. Column 4: the dependent variable is the HHI (max = 1) based on the home districts of students who graduated from the same secondary school. Column 5: the dependent variable is the portion (measured 0 –1) of students from districts other than the student’s home district.
*** Significant at the 1 percent level. ** Significant at the 5 percent level. * Significant at the 10 percent level.
248 AmEricAN EcoNomic JourNAL: AppLiED EcoNomics JuLy 2014
Each student is assigned his or her school-specific HHI measure. For students in our sample, the average value of the HHI is 0.3. Students who graduated from national schools were exposed to more diverse peers (lower HHI) as can be seen with the negative and statistically significant value of −0.305 in column 4. As an additional measure of the diversity of students, we calculate the portion of graduates from the secondary school that were not from the student’s home district. Consistent with the HHI findings, students who graduated from national schools have a 28 percentage point increase in the portion of students not from their home district (column 5). Overall these results indicate that national schools were succeeding in their mandate to bring together students from across the country. Previous studies have shown that social interactions in diverse schools can promote better interethnic or interracial relations (Boisjoly et al. 2006), however, the effect of increased ethnic diversity on achievement is unknown.
C. Timely progression and subject Exams
We examine the effect of national school attendance on timely progression through secondary school. A student who progresses through secondary school on schedule would complete it in four years. Figure 3 illustrates the relationship between the probability of graduating from secondary school four years after taking the KCPE and a student’s score relative to their relevant national school score cut-off. The circles are the portion of students at each score distance from the cutoff
0
0.2
0.4
0.6
0.8
1
Pro
babi
lity
of g
radu
atio
n in
four
yea
rs
−30 −20 −10 0 10 20 30
KCPE − cutoff
Figure 3. Timely Progression through Secondary School
Notes: “KCPE − cutoff” is the KCPE score minus the relevant national school cutoff score. See text for details on the calculation of the cutoff. Each point is the mean of the probability of graduation from any secondary school within four years of taking the KCPE within nonover-lapping 1 point bins. The solid lines are fitted values from a linear specification, separately esti-mated on each side of the admissions threshold, i.e., KCPE − cutoff = 0.
VoL. 6 No. 3 249lucas and mbiti: school quality and student achievement in kenya
that graduated from secondary school in exactly four years.13 The solid lines are the fitted values from linear specifications, estimated separately on either side of the admissions threshold, i.e., KCPE score − cutoff = 0. The visual inspection of these lines suggests no differential graduation probability on either side of the dis-continuity. The estimate of equation (3) with graduation from any secondary school as the dependent variable appears in column 1 of Table 4 and confirms the lack of a statistically significant break and small point estimate (0.001). Therefore, students admitted to national schools were not differentially likely to graduate on time.
We further examine the differences across the admissions discontinuity in the number of subject exams students completed. As discussed above, students must take at least seven subject exams and can take a maximum of nine subject exams. A student’s KCSE score is the average of the three compulsory, the highest two sci-ence, the highest humanities, and the highest practical scores. Students who took fewer exams also took fewer courses and could therefore focus their preparation on fewer subjects. Thus a potential concern is that national schools may push students to take more (or fewer) exams, thereby complicating our analysis of the test scores. Our results show a small point value and no statistically significant difference in the number of exams taken by students in national schools versus non-national schools (column 2). Overall, the estimates in Table 4 indicate that there is no differential selection into taking the KCSE exam or in the number of subject exams taken across the admissions discontinuity.
13 The increase in noise at higher values of the score distance reflects a smaller sample of students with such high scores.
Table 4—Effect of National Schools on Timely Progression and Exams Taken
Graduate from any secondary
school
Number of subject exams
taken(1) (2)
Admitted to a national school 0.001(0.009)
Graduate from a national school 0.052(0.051)
Window +/− 34 +/− 34
Observations 14,439 12,704r2 0.11 0.15
Notes: Sample limited to students with KCPE scores within indicated window of the rele-vant national school cutoff. Controls: piecewise linear function of KCPE score minus cutoff; district, national school preferences, and public primary school dummy variables; and inter-actions between relevant national school and district dummy variables. Column 1: linear prob-ability model. Column 2: IV estimate with admission to national school an instrument for graduation from a national school; sample limited to students who graduated from secondary school. Standard errors clustered at the district level appear in parentheses.
*** Significant at the 1 percent level. ** Significant at the 5 percent level. * Significant at the 10 percent level.
250 AmEricAN EcoNomic JourNAL: AppLiED EcoNomics JuLy 2014
D. Achievement
We examine the effect of national school graduation on KCSE scores using the instrumental variables approach outlined above. At the conclusion of second-ary school, all students take the KCSE exam. This score determines admission to postsecondary institutions such as polytechnics, colleges, and universities, and is used by some employers as a minimum qualification requirement. We examine the relationship between national school graduation and overall achievement as well as subject specific scores. We then explore potential heterogenous effects by various student attributes.
Figure 4 illustrates the reduced form relationship between being admitted to a national school and the standardized KCSE score at the conclusion of secondary school. Despite the substantial differences between national schools and other gov-ernment schools, we observe very small differences in the KCSE performance of students across the national school admissions threshold.14 Table 5 contains esti-mates that test the statistical significance of any effect. Columns 1 and 2 present a naïve OLS specification of equation (1), controlling for KCPE score; district, gender, public primary school, and national school choice dummy variables; and
14 As discussed in the previous section, we found that the probability of graduation from secondary school did not differ around the national school admissions threshold. This alleviates concerns about differential selection into taking the KCSE exam around the threshold.
−30 −20 −10 0 10 20 30
KCPE − cutoff
1
1.5
2
2.5
3
Sta
ndar
dize
d K
CS
E s
core
Figure 4. Student Achievement
Notes: “KCPE − cutoff ” is the KCPE score minus the relevant national school cutoff score. See text for details on the calculation of the cutoff. Each point is the mean of the standard-ized KCSE score within nonoverlapping 1 point bins. The solid lines are fitted values from a linear specification, separately estimated on each side of the admissions threshold, i.e., KCPE − cutoff = 0.
VoL. 6 No. 3 251lucas and mbiti: school quality and student achievement in kenya
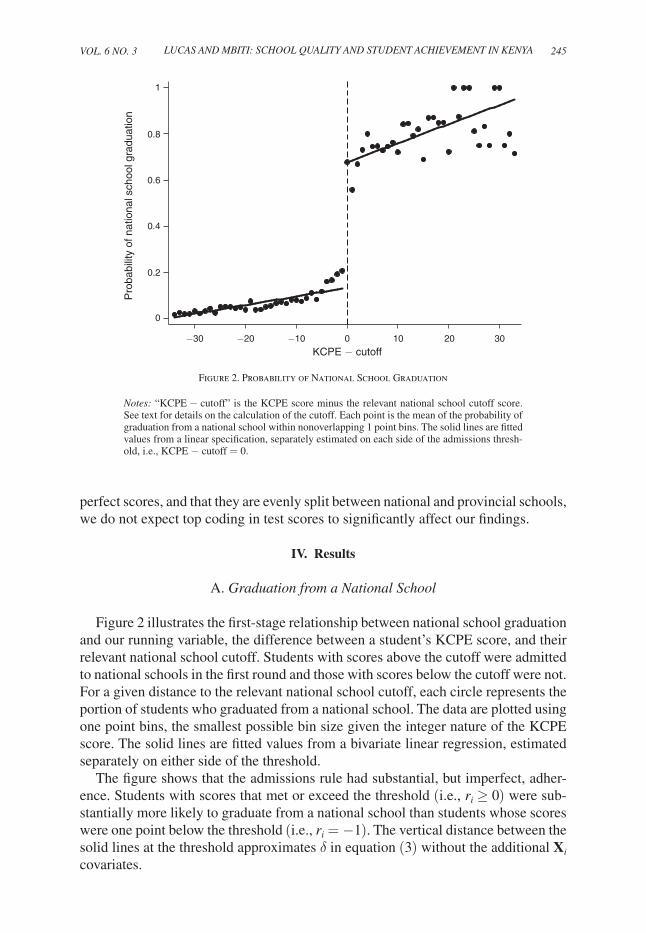
interactions between relevant national school and district dummy variables. When estimated over the full sample (column 1), graduating from a national school was associated with an increase in the KCSE score of 30 percent of a standard deviation. Once the sample is limited to similar students, the point estimate decreases substan-tially to less than 5 percent of a standard deviation (column 2). Column 3 presents the reduced form estimation of the effect of being admitted to a national school on a student’s KCSE score, the analogue to the solid line in Figure 4 with control variables included. The estimates show that there were no significant differences in the KCSE scores of students admitted to a national school compared to those who did not gain admission.15 Column 4 uses the instrumental variables approach specified in equations (3) and (4) to examine the effect of national school gradua-tion on KCSE scores. The results again show that national schools did not have a statistically significant effect on KCSE scores. Moreover, the standard errors are small enough that we can rule out moderate effect sizes of 0.12 standard deviations or larger. Therefore, despite superior resources, peers, and reputations, national schools did not generate superior KCSE test scores.
In columns 5–8, we estimate the effect of national school graduation on the aver-age of the required subjects exams (English, math, and Swahili), and each required subject score separately. We do not find a statistically significant effect of national schools on the required subject average or English score. National schools appear to have negatively affected mathematics scores, but this result is only marginally significant in this specification and is not robust to the alternative specifications
15 From Figure 4, one might expect a statistically signficant effect when those students who score at the cutoff are removed from the sample. The effect estimated over the redefined sample is similarly statistically insignificant.
Notes: Sample limited to students with KCPE scores within indicated window of national school cutoff. Controls: district, national school choices, and public primary school dummy variables and interactions between relevant national school and district dummy variables. Columns 1 and 2: KCPE score included as additional control vari-ables. Columns 3–8: piecewise linear function of KCPE score minus cutoff also included. Columns 4–8: instrumen-tal variables estimation with national school admission as the instrument. Column 5: required subjects are math, English, and Swahili. Standard errors clustered at the district level appear in parentheses.
*** Significant at the 1 percent level. ** Significant at the 5 percent level. * Significant at the 10 percent level.
252 AmEricAN EcoNomic JourNAL: AppLiED EcoNomics JuLy 2014
presented in Section V. National schools did have a large, statistically significant, positive effect of 0.244 standard deviations on Swahili scores (column 8).
Due to data limitations, we are not able empirically to ascertain why national schools had this effect on Swahili scores, but a number of hypotheses are consis-tent with these findings. In 2013 we conducted a small survey of administrators from 7 national schools and 51 provincial schools that had students in our regres-sion discontinuity window to augment our existing data and disentangle some of the potential hypotheses.16 First, our findings in Section VB showed that national schools were more diverse than other schools. According to our survey, students in provincial schools were almost 15 percentage points more likely to converse in local ethnic languages outside the classroom compared to students in national schools.17 This difference in language use is consistent with the more diverse language set in national schools and Swahili, one of two official languages in Kenya and often referred to as the national language, acting as the lingua franca for peer commu-nication in national schools, while in provincial schools a local language could be used.18 Second, we found that a greater emphasis was placed on Swahili according to the school timetables in which national schools, on average, devoted approxi-mately 20 additional minutes to Swahili instruction in the first two years of second-ary school with smaller differences in the final two years.19 Third, administrators in provincial schools were almost 20 percentage points more likely to report difficul-ties hiring Swahili instructors compared to their national school counterparts reflect-ing a relative scarcity of Swahili teachers.20 Although the survey responses provide suggestive evidence consistent with our hypotheses, we are unable to conclusively distinguish among these hypotheses due to data limitations.
Even though, on average, we did not find achievement effects on the compos-ite KCSE score, the benefits of attending a national school might accrue differen-tially by a student’s baseline test score and within-school ranking. As discussed in Section III, the admissions algorithm created multiple regression discontinui-ties within the same national school, resulting in substantial KCPE score variation within each national school. We can, therefore, test for heterogeneous effects by students’ KCPE scores and relative within-school score percentiles. We first exam-ine the extent to which national schools differentially affected students by their prior academic preparation by including an interaction between national school gradua-tion and standardized KCPE score.21 Using an instrumental variable approach, we do not find a statistically significant heterogeneous effects on achievement by base-line KCPE score (column 1 of Table 6), where the coefficient on the interaction
16 We attempted to survey all 18 national schools. Unfortunately, national school adminstrators were not always willing to respond to our queries.
17 This difference was not statistically significant due to our small sample size.18 English is the other official language of Kenya, but is less commonly used than Swahili in informal commu-
nications. For all schools the official language of instruction was English.19 Because of the small sample, the differences were not statistically significant.20 Once again this difference is not statistically significant due to the small sample size. We do not have this
information for other subjects; we cannot rule out that provincial schools are more likely to have general hiring difficulties.
21 Formally, we use admission to a national school × KCPE score as an additional exogenous regressor in our IV estimation, in which we treat graduation from a national school × KCPE score as an additional endogenous regressor. As discussed above, the KCPE score is absorbed by the set of control variables.
VoL. 6 No. 3 253lucas and mbiti: school quality and student achievement in kenya
between national school graduation and student’s KCPE score is negative but not statistically significant.22
In column 2 of Table 6, we examine whether the benefits of national school atten-dance vary by students’ within national school percentile. To calculate the percen-tile, students admitted to a national school receive their actual percentile in that school, while those not admitted receive a hypothetical percentile as if they had been admitted to their relevant national school along with the cohort actually admitted. Using our IV procedure, we find a negative and marginally (10 percent) significant coefficient on the interaction of within national school rank and national school graduation in column 2.23, 24
22 One concern with this analysis is the positive correlation between a student’s own KCPE score and the qual-ity of peers, as measured by KCPE score, in the available non-national school options. Students in our regression discontinuity window with higher KCPE scores are, on average, from provinces where students in the non-national school option have relatively high KCPE scores. District fixed effects implicitly control for non-national school quality differences between provinces and districts. As an additional check, we controlled for the interaction of pro-vincial quality (described in detail below) with national school admission in equation (3) and with national school graduation in equation (4). We continue to find insignificant results with the inclusion of this control (not shown).
23 Formally, we use admission to a national school × within-national school score percentile as an additional exogenous regressor in our IV estimation, in which we treat graduation from a national school × within-national school score percentile as an additional endogenous regressor. We include within-national school score percentile as an additional regressor.
24 As with the test for heterogeneity by KCPE score, one concern with this analysis is the positive correla-tion between national school percentile and peer quality, as measured by KCPE score, in the non-national school
Table 6—Heterogeneous Effects by Student Ability
Standardized KCSE score
Number of exams
Standardized modified KCSE score
(1) (2) (3) (4) (5) (6)
Graduate from national school 0.367 0.116 −0.264 −0.077 0.186 0.089(0.242) (0.077) (0.162) (0.065) (0.257) (0.090)
Graduate from national school −0.136 0.122** −0.059 × standardized KCPE score (0.088) (0.060) (0.093)Graduate from national school × within national school
−0.228*(0.131)
0.344**(0.131)
−0.104(0.156)
percentile
Within national school 0.007 −0.220** −0.066 percentile (0.116) (0.107) (0.132)Window +/− 34 +/− 34 +/− 34 +/− 34 +/− 34 +/− 34
Notes: All columns are instrumental variables regressions with admission to a national school as an instrument for graduating from a national school. Sample limited to students who graduated from secondary school with KCPE scores within the 34-point window of a relevant national school cutoff. Controls: piecewise linear function of KCPE score minus cutoff; district, national school preferences, and public primary school dummy variables; and interac-tions between school preference and district dummy variables. Columns 1, 3, and 5: admission to national school × standardized KCPE scores used as an additional instrument. Columns 2, 4, and 6: percentile determined by the cohort of students admitted to a student’s relevant national school. Admission to national school × national school percentile used as an additional instrument. Columns 5 and 6: dependent variable is a recalculated KCSE score that averages the scores of 9 subject exams, with minimum scores of 1 included for any “missing” subject exams. Standard errors clustered at the district level appear in parentheses.
*** Significant at the 1 percent level. ** Significant at the 5 percent level. * Significant at the 10 percent level.
254 AmEricAN EcoNomic JourNAL: AppLiED EcoNomics JuLy 2014
While we did not find any evidence that the average number of exams taken dif-fered across the threshold (see Table 4), the number of exams, and therefore courses completed, may vary by baseline test scores or within school rankings. We use the same methodology from columns 1 and 2 in columns 3 and 4 in Table 6, replacing the dependent variable with the number of exams completed by a student. Our results in column 3 of Table 6 show a positive and statistically significant coefficient on the interaction between baseline KCPE score and national school graduation. Students with baseline standardized KCPE scores of approximately 2.2 or below took fewer exams in provincial schools than in national schools. Further, our results in column 4 show that the higher a student’s within-national school percentile the more exams he or she took in a national school. Conversely, students with a higher (hypothetical) national school percentile who were on the non-national school side of the regres-sion discontinuity took fewer exams. Therefore, weaker students in national schools were focusing on fewer courses. This focus could result in the negative coefficients in columns 1 and 2 on the effect of the interaction terms between graduation from a national school and the level of baseline preparation. Alternatively, national schools could be focusing additional resources on these students.
To better understand the mechanism operating in columns 1 and 2, we examine whether the entire negative coefficient can be explained by the discontinuity in the number of completed exams found in columns 3 and 4. We calculate a student’s modified KCSE score as the simple average of the 9 completed exams, imputing exam scores of 1, the lowest score possible on the KCSE, for each exam fewer than 9, e.g., if a student completed 8 exams, we average those 8 scores along with a single score of 1. This modified score effectively grades all students as if they had taken nine exams, penalizing students who took fewer than nine with the lowest possible subject score for the “missing” exams. We then repeated the estimations in columns 1 and 2 with this modified score as the dependent variable. Since national school students with lower baseline preparation took fewer exams, by assigning the lowest possible scores to the “missing” tests, the results in column 5 and 6 penalize their composite scores more heavily than the students who took more exams and likely earned a real score well above 1. Therefore, our imputation procedure should move the point estimates in columns 1 and 2 toward 0, or even positive, i.e., a smaller or negative net benefit for the less prepared students. Indeed, while the point esti-mates become smaller in absolute magnitude, they remain negative and statistically insignificant suggesting that the negative point estimates in columns 1 and 2 are not exclusively the result of students in national schools with lower baseline preparation taking fewer exams. These estimates in column 5 and 6 can also be interpreted as the smallest test score gain a weaker student would be able to achieve in a national school relative to a provincial school.
Overall, this heterogeneity by baseline preparation highlights three potential strategies that schools may have employed to boost their reputations. First, we found in columns 3 and 4 that national schools encouraged students with lower baseline
option. As an additional check, we controlled for the interaction of provincial quality (described in detail below) with national school admission in equation (3) and with national school graduation in equation (4). We find similar results with this control (not shown).
VoL. 6 No. 3 255lucas and mbiti: school quality and student achievement in kenya
preparation to take fewer exams. Second, the negative coefficients in columns 5 and 6 suggest that national schools may have shifted instructional resources toward the students of lower baseline preparation. Third, provincial schools appear to have restricted the number of exams completed by their top students. To validate these patterns, we surveyed school administrators about remedial instruction and ability tracking. Administrators from all seven national schools in our survey reported that their schools offered remedial instruction outside of class time for students who were behind their peers. Further, none of these seven national schools reported any form of ability tracking during class time that might benefit top students, and most national schools stated that students were arbitrarily placed into streams or sections of courses without regard to their incoming KCPE scores. In contrast, ability track-ing was more prevalent in provincial schools. Approximately 12 percent of provin-cial schools in our sample reported reserving certain sections or entire courses, such as computer science, for their top students. While only suggestive, the empirical and survey patterns indicate that national schools might boost the performance of lower achieving students by limiting their courses and shifting resources toward remedial classes, while provincial schools might focus on boosting the performance of their top students by incorporating structures that cater to higher ability students and lim-iting the number of courses and exams of top students.
The observed patterns in exam taking and the suggestive evidence on targeted instruction described above may be driven by the different competitive environ-ments faced by national schools and provincial schools. Secondary schools in Kenya are ranked annually by their school-wide average KCSE scores. Each year the media disseminate the list of schools with the highest average KCSE scores and their corresponding scores. Additionally, the names, schools, and scores of students with the highest KCSE scores are similarly disseminated through the media. National schools compete, primarily with each other, to have the top aver-age score in the country. Since the quota system results in each national school admitting students from poor districts who are less academically prepared for sec-ondary school, a national school’s rational response to this competitive pressure could be to limit the course load and allocate instructional resources to students at the lower end of the performance distribution with the expectation that the KCSE score return would be greater than allocating similar resources to other more prepared students. In contrast, since provincial schools have fewer resources and admit students of relatively weaker academic ability, they may be better off limiting the number of subjects and allocating scarce resources to their top stu-dents in order to produce at least one student with the one of the highest KCSE scores in the nation. Thus the differential incentives of competition across the two school types could result in differential targeting of students, potentially explain-ing heterogeneity by ability in the number of exams taken and KCSE score and the findings from our school survey.
Table 7 contains additional tests of heterogeneity. In column 1 of Table 7, we explore the heterogeneous effects of national schools by the variation in the qual-ity of the provincial school option for students who were not admitted to a national school. Students not admitted to national schools were considered for admission to a province-specific school. Therefore, the quality of the non-national school option for
256 AmEricAN EcoNomic JourNAL: AppLiED EcoNomics JuLy 2014
each student is province and gender specific.25 For example, the top girls provincial school in Nairobi, Precious Blood, had a higher average incoming KCPE score than some of the girls’ national schools. In contrast, the top provincial school for girls from North Eastern province had an average incoming KCPE score one standard deviation below the average of the least selective national school. We approximated the quality of the non-national school option in three steps. First, we calculated for each provincial school the average baseline KCPE score of its graduates. Second, we aggregated to a single average for each province by gender, weighting each school average by the number of students in the regression discontinuity window who graduated from that school, effectively creating the average peer KCPE score of the non-national school option. For national schools, we calculated the average KCPE scores across all schools by gender. We then use the difference between the average provincial and national school KCPE scores as our approximation of the average difference in peer quality between national schools and the outside option. This score gap varies from −3.5 for girls from Nairobi to 186 for girls in North Eastern province with a median of 41.4. We use our IV methodology to test for a
25 Many of the most desired provincial schools are single gender. Further, even mixed gender schools maintain gender-specific admissions quotas.
Table 7—Heterogeneous Effects by Provincial Quality and Student Demographics
By provincial quality By gender By socioeconomic status(1) (2) (3)
Graduate from national school −0.045 0.029 0.022(0.076) (0.062) (0.058)
Graduate from national school × 0.0015 provincial school quality gap (0.0014)Graduate from national school × −0.031 female (0.053)Graduate from national school × −0.017 public primary school (0.048)Public primary school 0.140*** 0.140*** 0.143***
Notes: All columns are instrumental variables regressions with admission to a national school as an instrument for graduating from a national school. Sample limited to students who graduated from secondary school with KCPE scores within the 34 point window of a relevant national school cutoff. Controls: piecewise linear function of KCPE score minus cutoff; district, national school preferences, and public primary school dummy variables; and interactions between school preference and district dummy variables. Column 1: admission to national school × the provincial school quality gap as an additional instrument. See text for description of provincial school qual-ity gap. Column 2: admission to national school × female used as an additional instrument. Column 3: admission to national school × public primary school graduation as an additional instrument. Public primary school gradua-tion is a proxy for lower socioeconomic status. Standard errors clustered at the district level appear in parentheses.
*** Significant at the 1 percent level. ** Significant at the 5 percent level. * Significant at the 10 percent level.
VoL. 6 No. 3 257lucas and mbiti: school quality and student achievement in kenya
differential effect by this measure of provincial quality gap.26 The interaction term on our measure of provincial quality gap and graduation from a national school is small, positive, and statistically insignificant.27 The sign on the point estimate is consistent with prior studies such as Deming et al. (2011) that found that students with good local public school options benefited less from attending an oversub-scribed charter school.
Finally, we examine whether the effects differ by gender or our proxy measure of socioeconomic status. We do not find any differential effects by gender (Table 7, column 2). As a proxy for socioeconomic status, we use public primary school grad-uation. In Kenya, the likelihood of attending a public instead of private primary school is decreasing in socioeconomic status (Lucas and Mbiti 2012). We do not find a differential effect of national school graduation by the type of primary school (column 3).
V. Robustness Checks
One potential concern with any regression discontinuity is manipulation of the assignment around the threshold. Since we use the computerized assignment algo-rithm as an instrumental variable for national school graduation, such manipulation would not invalidate our empirical design, as can be seen in our strong first stage. In addition, manipulation around the cutoff is likely for a number of reasons. First, the effective threshold for each national school is district, school, and year specific; is not established until all exams have been graded; and depends on all of the exam scores and preferences within a district. Second, all exams are graded centrally and the graders do not know the students. Third, manipulation by graders would require knowledge about student preferences, and this information does not appear on the exams.
Figure 5 provides additional evidence about the validity of our regression discon-tinuity design. The first panel provides the number of students who scored in each one-point score bin. As expected there is no break in the distribution as the cutoff is approached from above or below. The number of students who scored exactly at the threshold is substantially larger than those who scored one point below or above. This spike is due to the design of the cutoff. By assigning the lowest student score in each district-school pair to serve as the threshold, all district-school pairs had a student exactly at the cutoff, but the next higher (or lower) student score in a district could have been multiple points away from the cutoff, thus the number of students in each point above and below the threshold was smaller than at the threshold.
Unfortunately, we only have limited demographic data on students to test for additional discontinuities at the threshold. Panel B displays the percent of students who graduated from a public primary school, an approximation of socioeconomic
26 Formally, we use admission to a national school × provincial school quality gap as an additional exogenous regressor in our IV estimation, in which we treat graduation from a national school × provincial school quality gap as an additional endogenous regressor. We cannot include provincial school quality gap as a separate regressor as it is absorbed by district and district times school choice fixed effects.
27 We cannot empirically reject that this measure of provincial quality is correlated with other provincial attri-butes that might cause students to perform better or worse in a national or provincial school environment.
258 AmEricAN EcoNomic JourNAL: AppLiED EcoNomics JuLy 2014
status since richer students are more likely to attend private primary schools. Panel C plots the average student age. Both measures become noisier for the scores that are more than 25 points above the threshold because of the smaller sample size for those scores. Neither demographic measure appears to be visually discontinuous at the admissions threshold. Table 8, columns 1 and 2, empirically tests for the statistical significance of any discontinuity and find neither to be statistically significant.
Unobserved student behavior could vary discontinuously at the threshold. For example, students admitted to a national school might rely on the prestige of their school and devote less effort to studying, whereas students in provincial schools may work diligently to overcome the “stigma” or lower prestige of provincial schools (MacLeod and Urquiola 2009). This would bias the results toward not finding an achievement effect for national schools. Unfortunately, we cannot empirically mea-sure student effort, but in Kenya the KCSE score is used for admission to universi-ties, without regard to secondary school name, partially mitigating this possibility.
Table 9 provides a number of specification checks. Each specification is a modi-fication of the baseline estimates, repeated in column 1, from earlier tables, to aid comparison. In column 2, we limit the controls to the piecewise linear function of the running variable, the KCPE score, and female and district dummy variables. In column 3, we include the interaction between choice 1 and choice 2 prefer-ences as additional controls in lieu of separate sets of school choice 1 and school choice 2 dummy variables. The inclusion of the more restrictive controls for student
KCPE − cutoff
KCPE − cutoff KCPE − cutoff
0
500
1,000
1,500
Num
ber
of s
tude
nts
−30 −20 −10 0 10 20 30
Panel A. Density of students
0
0.2
0.4
0.6
0.8
1
Per
cent
in p
ublic
pr
imar
y sc
hool
−30 −20 −10 0 10 20 30
Panel B. Public primary school graduation
16
16.5
17
17.5
18
Age
−30 −20 −10 0 10 20 30
Panel C. Student age
Figure 5. Validity of the Regression Discontinuity
Notes: “KCPE − cutoff” is the KCPE score minus the relevant national school cutoff score. See text for details on the calculation of the cutoff. Each point represents a nonoverlapping one point bin.
VoL. 6 No. 3 259lucas and mbiti: school quality and student achievement in kenya
Table 8—Balance in Observables
Public primary school graduation
Age at secondary school graduation
(1) (2)Admitted to a national school −0.010 −0.067
(0.015) (0.041)Window +/− 34 +/− 34
Observations 12,704 12,704r2 0.28 0.07
Notes: Standard errors clustered at the district level appear in parentheses. Sample limited to students with KCPE scores within indicated window of national school cutoff. Controls: district dummy variables and a piecewise linear function of KCPE score minus the cutoff. Column 1: Linear probability model.
*** Significant at the 1 percent level. ** Significant at the 5 percent level. * Significant at the 10 percent level.
Table 9—Additional Specification Checks
Dependent variables as indicated in each panel
BaselineLimited controls
Choice pair interactions
Third degree polynomial
+/− 17 point (IK ideal) window
Redefined cutoff score
(1) (2) (3) (4) (5) (6)panel A. Graduate from a national schoolAdmitted to a national school 0.492*** 0.533*** 0.491*** 0.371*** 0.399*** 0.474***
260 AmEricAN EcoNomic JourNAL: AppLiED EcoNomics JuLy 2014
preferences ameliorates concerns that our results may be significantly affected by students’ strategic behaviours when they select their preferred schools. In column 4, we replace the piecewise linear function of the running variable with a third-degree polynomial that we allow to vary discontinuously at the threshold. In column 5, we reestimate the results using the Imbens-Kalyanaraman (2012) (IK) optimal band-width for our data, a 17-point window (Imbens and Kalyanaraman 2012). Finally, in column 6, we redefine the score threshold as the midpoint between the KCPE score of the last student admitted to a given national school from a particular district and the KCPE score of the highest scoring nonadmitted student for the district-school pair. Overall, our results are robust to these specification checks with the exception of the mathematics subject score in panel E, heterogeneity by baseline
Dependent variables as indicated in each panel
BaselineLimited controls
Choice pair interactions
Third degree polynomial
+/− 17 point (IK ideal) window
Redefined cutoff score
(1) (2) (3) (4) (5) (6)
panel F. standardized swahili scoreGraduate from national school 0.244*** 0.209*** 0.248*** 0.224** 0.206** 0.243***
panel H. standardized KcpE score, heterogeneous effects by within national school percentileGraduate from national school 0.116 0.059 0.101 0.130 0.074 0.094
(0.077) (0.063) (0.080) (0.124) (0.122) (0.074)Graduate from national school × −0.228* −0.117 −0.185 −0.212 −0.209 −0.197 within national school percentile (0.131) (0.110) (0.138) (0.136) (0.205) (0.129)Within school percentile 0.007 −0.105 −0.022 −0.011 0.079 −0.034
panel i. standardized KcpE score, heterogeneous effects by quality of provincial schoolGraduate from national school −0.045 −0.041 −0.045 −0.024 −0.090 −0.046
(0.076) (0.064) (0.077) (0.107) (0.104) (0.073)Graduate from national school × 0.0015 0.0010 0.0015 0.0016 0.0020 0.0014 provincial school quality gap (0.0014) (0.0011) (0.0014) (0.0014) (0.0020) (0.0013)
VoL. 6 No. 3 261lucas and mbiti: school quality and student achievement in kenya
KCPE score in panel G, and heterogeneity by within national school percentile in panel H. For the mathematics score, panel E, the previously statistically signifi-cant math result is not robust to specifications with a third-degree polynomial (col-umn 4) or narrower sample (column 5). In fact, the point estimate becomes positive, but statistically insignificant, in the specification with the third-degree polynomial (column 4). For the heterogeneous effects by baseline KCPE score, panel G, the previously insignificant coefficient on the interaction term, is negative and statisti-cally significant in column 2 (limited controls). Finally, the marginally significant coefficient on the interaction with within national school percetile in panel H is statistically insignificant in all other specifications.
Dependent variables as indicated in each panel
BaselineLimited controls
Choice pair interactions
Third degree polynomial
+/− 17 point (IK ideal) window
Redefined cutoff score
(1) (2) (3) (4) (5) (6)
panel J. standardized KcpE score, heterogeneous effects by genderGraduate from national school 0.029 0.023 0.029 0.064 0.013 0.018
(0.062) (0.059) (0.068) (0.109) (0.097) (0.064)Graduate from national school × −0.031 −0.070 −0.029 −0.038 −0.055 −0.024 female (0.053) (0.044) (0.054) (0.054) (0.067) (0.050)
Notes: Standard errors clustered at the district level appear in parentheses. Panels B–K: results from instrumental variable specification with admission to a national school as an instrument for graduation from a national school and additional interacted instruments as in Tables 6 and 7. Column 1: panel A from Table 2, panel B from Table 5, pan-els G and H from Table 6, Panels I–K from Table 7. Column 2: controls limited to piecewise linear function of run-ning variable, KCPE score, and female and district dummy variables. Column 3: school choice 1 by school choice 2 interactions included in lieu of two sets of school choice dummy variables. Column 4: controls for third degree polynomial of the running variable that varies on either side of the national school threshold instead of piecewise linear function. Column 5: window narrowed to 17 points, the IK ideal bandwidth. Column 6: cutoff redefined to be the midpoint between the scores of the last student admitted and the first student not admitted.
*** Significant at the 1 percent level. ** Significant at the 5 percent level. * Significant at the 10 percent level.
262 AmEricAN EcoNomic JourNAL: AppLiED EcoNomics JuLy 2014
VI. Conclusions
This paper exploits the centralized system of Kenyan government secondary school admissions to estimate the effect of elite schools on student academic achievement. Using a regression discontinuity design we find that students who were admitted to national schools (the most elite schools in Kenya) were equally likely to graduate on time from secondary school as their peers who were not admitted. Further, we find no statistically significant difference between student composite scores on the secondary school exit exam for students in national versus other schools. The lack of an effect is similar across genders, socioeconomic status, and academic preparation. We find some evidence of heterogeneity by within-school score percentile. Further, we find that the national school graduates had higher Swahili scores, consistent with its use as a lingua franca in national schools and more time being devoted to Swahili in some national schools. While previous studies such as Pop-Eleches and Urquiola (2013) examined student and parental behavioral responses across the discontinuity thresholds of elite schools, our heterogeneity analysis highlights the importance of strategic instructional responses by schools across the discontinuity threshold. Students in national schools with lower baseline preparation, as measured by KCPE score or within-school percentile, appeared to have taken fewer courses, received additional remedial attention, and performed better on the exams they took. We argue that this is driven by the different competitive environment faced by the different types of schools with national schools competing on school-wide average scores, while provincial schools are more focused on the top individual scores.
Even though we find no average impact of national schools on achievement, par-ents, students, and the government highly value and expend substantial resources on these elite schools. One possibility is that national schools may deliver other benefits that we are not able to measure. For instance, national school graduation could act as a signal, alter occupational choice and earnings, and provide access to enhanced networking opportunities. Alternatively, stakeholders could be effectively running the OLS regression in which they see that students who graduate from national schools have the highest scores in the country at the conclusion of secondary school, not taking into account that these students also had the highest test scores at the start of secondary school. Future research will seek to disentangle these alternatives and provide additional insight into national schools, an institution often credited with developing the past and future leaders of Kenya.
REFERENCES
Abdulkadiroglu, Atila, Joshua D. Angrist, and Parag A. Pathak. 2011. “The Elite Illusion: Achieve-ment Effects at Boston and New York Schools.” National Bureau of Economic Research (NBER) Working Paper 17264.
Angrist, Joshua D., and Victor Lavy. 1999. “Using Maimonides’ Rule to Estimate the Effect of Class Size on Scholastic Achievement.” Quarterly Journal of Economics 114 (2): 533–75.
Boisjoly, Johanne, Greg J. Duncan, Michael Kremer, Dan M. Levy, and Jacque Eccles. 2006. “Empa-thy or Antipathy? The Impact of Diversity.” American Economic review 96 (5): 1890–1905.
VoL. 6 No. 3 263lucas and mbiti: school quality and student achievement in kenya
Bui, Sa A., Steven G. Craig, and Scott A. Imberman. 2011. “Is Gifted Education a Bright Idea? Assess-ing the Impact of Gifted and Talented Programs on Achievement.” National Bureau of Economic Research (NBER) Working Paper 17089.
Clark, Damon. 2010. “Selective Schools and Academic Achievement.” B. E. Journal of Economic Analysis and policy 10 (1): Article 4.
Cullen, Julie Berry, Brian A. Jacob, and Steven Levitt. 2006. “The Effect of School Choice on Partici-pants: Evidence from Randomized Lotteries.” Econometrica 74 (5): 1191–1230.
de Hoop, Jacobus. 2010. “Keeping Children in School: Why School Quality Matters in Sub-Saharan Africa.” http://www.csae.ox.ac.uk/conferences/2010-EDiA/papers/172-deHoop.pdf.
Deming, David J., Justine S. Hastings, Thomas Kane, and Douglas O. Staiger. 2011. “School Choice, School Quality and Postsecondary Attainment.” National Bureau of Economic Research (NBER) Working Paper 17438.
Dobbie, Will, and Roland Fryer, Jr. 2011. “Exam High Schools and Academic Achievement: Evidence from New York City.” National Bureau of Economic Research (NBER) Working Paper 17286.
Duflo, Esther, Pascaline Dupas, and Michael Kremer. 2011. “Peer Effects, Teacher Incentives, and the Impact of Tracking: Evidence from a Randomized Evaluation in Kenya.” American Economic review 101 (5): 1739–74.
Gould, W. T. S. 1974. “Secondary School Admissions Policies in Eastern Africa: Some Regional Issues.” comparitive Education review 18 (3): 374–87.
Hahn, Jinyong, Petra Todd, and Wilbert Van der Klaauw. 2001. “Identification and Estimation of Treatment Effects with Regression-Discontinuity Design.” Econometrica 69 (1): 201–09.
Imbens, Guido W., and Karthik Kalyanaraman. 2012. “Optimal Bandwidth Choice for the Regression Discontinuity Estimator.” review of Economic studies 79 (3): 933–59.
Jackson, C. Kirabo. 2010. “Do Students Benefit from Attending Better Schools? Evidence From Rule-based Student Assignments in Trinidad and Tobago.” Economic Journal 120 (549): 1399–1429.
Lee, David S., and Thomas Lemieux. 2010. “Regression Discontinuity Designs in Economics.” Journal of Economic Literature 48 (2): 281–355.
Lucas, Adrienne M., and Isaac M. Mbiti. 2012. “Access, Sorting, and Achievement: The Short-Run Effects of Free Primary Education in Kenya.” American Economic Journal: Applied Economics. 4 (4): 226–53.
Lucas, Adrienne M., and Isaac M. Mbiti. 2014. “Effects of School Quality on Student Achievement: Discontinuity Evidence from Kenya: Dataset.” American Economic Journal: Applied Economics. http://dx.doi.org/10.1257/app.6.3.234.
MacLeod, W. Bentley, and Miguel Urquiola. 2009. “Anti-Lemons: School Reputation and Educational Quality.” National Bureau of Economic Research (NBER) Working Paper 15112.
Ministry of Education. 2008. Education management information system database. CD-ROM. Nai-robi: Ministry of Education.
Nomadic Kenyan Children’s Education Fund. 2004. NcKEF News. Issue 6.Onsomu, Eldah N., D. Muthaka, M. Ngware, and G. Kosimbei. 2006. “Financing of secondary educa-
tion in Kenya: costs and options.” Kenya Institute for Public Policy Research Analysis (KIPPRA) Discussion Paper 55.
Ozier, Owen. 2011. “The Impact of Secondary Schooling in Kenya: A Regression Discontinuity Anal-ysis.” Unpublished.
Park, Albert, Xinzheng Shi, Chang tai Hsieh, and Xuehui An. 2010. “Does School Quality Matter?: Evidence from a Natural Experiment in Rural China.” Unpublished.
Pop-Eleches, Cristian, and Miguel Urquiola. 2013. “Going to a Better School: Effects and Behavioral Responses.” American Economic review 103 (4): 1289–1324.
Sekhri, Sheetal, and Yona Rubinstein. 2010. “Do Public Colleges in Developing Countries Provide Better Education than Private ones? Evidence from General Education Sector in India.” Unpub-lished.
World Bank. 2004. strengthening the Foundation of Education and Training in Kenya: opportuni-ties and challenges in primary and General secondary Education. World Bank Report 28064-KE. Washington, DC, March.
World Bank. 2014. http://data.worldbank.org/country/Kenya (accessed May 19, 2014).Zhang, Honglian. 2013. “The Mirage of Elite Schools: Evidence from Lottery-Based School Admis-
sions in China.” http://ihome.cuhk.edu.hk/~b121320/assetts/files/Zhang_EliteSchools_Sep2012.pdf.