Effects of shock-induced cracks on the ultrasonic velocity and attenuation in granite Huirong A. Ai 1 and Thomas J. Ahrens 1 Received 16 February 2006; revised 30 July 2006; accepted 19 September 2006; published 9 January 2007. [1] Measurements of the compressional wave velocity and the attenuation coefficients of 1-cm cubes were conducted. Samples were taken at various radii and depths beneath a 20 20 15 cm San Marcos granite block, impacted by a lead bullet at a velocity of 1200 m/s. The damage parameters of the cubes are calculated from the measured preimpact and postimpact P wave velocities, V p0 and V p , and the crack density is inverted from the measured P wave velocities. The anisotropic orientation of cracks is more obvious from the attenuation than crack density and damage parameters calculated from the ultrasonic velocity. P wave velocity and the normalized distance from the impact point follow an exponential decay relation. Other properties, such as the damage parameter, crack density, and attenuation coefficient, are expressed by a power law decay with distance. The damage parameter and attenuation coefficients are approximately linearly related. The slope of the linear fitting results in directions normal to the crack orientation is about twice the value in direction along the crack orientation. The attenuation coefficient is found to be a more useful parameter than elastic velocity in describing the anisotropic orientation of cracks. Citation: Ai, H. A., and T. J. Ahrens (2007), Effects of shock-induced cracks on the ultrasonic velocity and attenuation in granite, J. Geophys. Res., 112, B01201, doi:10.1029/2006JB004353. 1. Introduction [2] Shock-induced damage and cracking beneath impact craters has become a focus of attention to those who use craters to study solar system history. Previous studies were conducted on small-scale craters in the laboratory [e.g., Ahrens and Rubin, 1993; Polanskey and Ahrens, 1990], as well as for large craters in the field, including both the Earth and the Moon [Ackermann et al., 1975; Dvorak and Phillips, 1977; Simmons et al., 1973]. The large-scale compressional wave velocity reduction in rocks beneath these impact craters has been attributed to the existence of cracks. Cracking in rocks can induce significant reduction of the effective elastic moduli of a fractured body, which, in turn, reduces the effective elastic wave velocities, as has been discussed for decades by many researchers both theoretically [Eshelby , 1957; Nur, 1971] and experimentally [e.g., Ahrens and Rubin, 1993; Ai and Ahrens, 2004]. [3] The damage parameter (D) and crack density (e) are used to describe the intensity of fractures in the damaged body. Numerous theoretical models have been developed to relate the observed elastic velocity behavior to crack density of the cracked body. These models fall into two groups. One group of models assumes the volume concentration of inhomogeneities, such as cracks, cavities or inclusions with other properties in a homogeneous matrix, is small, such that the interaction between these inhomogeneities can be ignored [e.g., Anderson et al., 1974; Hudson, 1990; Kachanov , 1993; Nur, 1971]. Another group of models takes into account the interaction between the inhomogeneities when the volume concentration of inhomogeneities is large [e.g., Berge et al., 1993; O’Connell and Budiansky , 1974]. [4] The presence of cracks also affects the attenuation properties of the fractured body significantly. Attenuation mechanisms include friction, fluid flow and scattering, of which friction on thin cracks and grain boundaries is the dominant attenuation mechanism for consolidated rocks [Johnston et al., 1979]. At ultrasonic frequencies, when the wavelength is at the same scale as heterogeneities in the rocks, scattering also plays an important role [Tompkins and Christensen, 2001]. [5] Attenuation phenomena have not yet received much attention by the planetary cratering community because of the difficulty of carrying out systematic attenuation meas- urements beneath impact craters in the field. Liu and Ahrens [1997] did preliminary work on attenuation beneath impact craters in the laboratory. They studied shock-induced dam- age in a San Marcos gabbro block and related the measured attenuation to the crack density and damage in the rocks. However, their work only measured the attenuation of the rocks in one direction, and did not take the orientation of the cracks and the propagation direction into account. In reality, the cracks produced by an expanding spherical shockwave within a target block include both concentric/spherical and tensile/radial cracks [Polanskey and Ahrens, 1990]. The combined effect of the heterogeneity of cracks on the attenuation is of interest in this study. JOURNAL OF GEOPHYSICAL RESEARCH, VOL. 112, B01201, doi:10.1029/2006JB004353, 2007 Click Here for Full Articl e 1 Department of Geological and Planetary Science, California Institute of Technology, Pasadena, California, USA. Copyright 2007 by the American Geophysical Union. 0148-0227/07/2006JB004353$09.00 B01201 1 of 9
Transcript
Effects of shock-induced cracks on the ultrasonic
velocity and attenuation in granite
Huirong A. Ai1 and Thomas J. Ahrens1
Received 16 February 2006; revised 30 July 2006; accepted 19 September 2006; published 9 January 2007.
[1] Measurements of the compressional wave velocity and the attenuation coefficients of1-cm cubes were conducted. Samples were taken at various radii and depths beneath a20 � 20 � 15 cm San Marcos granite block, impacted by a lead bullet at a velocity of1200 m/s. The damage parameters of the cubes are calculated from the measuredpreimpact and postimpact P wave velocities, Vp0 and Vp, and the crack density is invertedfrom the measured P wave velocities. The anisotropic orientation of cracks is moreobvious from the attenuation than crack density and damage parameters calculated fromthe ultrasonic velocity. P wave velocity and the normalized distance from the impact pointfollow an exponential decay relation. Other properties, such as the damage parameter,crack density, and attenuation coefficient, are expressed by a power law decay withdistance. The damage parameter and attenuation coefficients are approximately linearlyrelated. The slope of the linear fitting results in directions normal to the crack orientation isabout twice the value in direction along the crack orientation. The attenuation coefficientis found to be a more useful parameter than elastic velocity in describing the anisotropicorientation of cracks.
Citation: Ai, H. A., and T. J. Ahrens (2007), Effects of shock-induced cracks on the ultrasonic velocity and attenuation in granite,
J. Geophys. Res., 112, B01201, doi:10.1029/2006JB004353.
1. Introduction
[2] Shock-induced damage and cracking beneath impactcraters has become a focus of attention to those who usecraters to study solar system history. Previous studies wereconducted on small-scale craters in the laboratory [e.g.,Ahrens and Rubin, 1993; Polanskey and Ahrens, 1990], aswell as for large craters in the field, including both the Earthand the Moon [Ackermann et al., 1975; Dvorak andPhillips, 1977; Simmons et al., 1973]. The large-scalecompressional wave velocity reduction in rocks beneaththese impact craters has been attributed to the existence ofcracks. Cracking in rocks can induce significant reductionof the effective elastic moduli of a fractured body, which, inturn, reduces the effective elastic wave velocities, as hasbeen discussed for decades by many researchers boththeoretically [Eshelby, 1957; Nur, 1971] and experimentally[e.g., Ahrens and Rubin, 1993; Ai and Ahrens, 2004].[3] The damage parameter (D) and crack density (e) are
used to describe the intensity of fractures in the damagedbody. Numerous theoretical models have been developed torelate the observed elastic velocity behavior to crack densityof the cracked body. These models fall into two groups. Onegroup of models assumes the volume concentration ofinhomogeneities, such as cracks, cavities or inclusions withother properties in a homogeneous matrix, is small, such that
the interaction between these inhomogeneities can be ignored[e.g., Anderson et al., 1974; Hudson, 1990; Kachanov, 1993;Nur, 1971]. Another group of models takes into account theinteraction between the inhomogeneities when the volumeconcentration of inhomogeneities is large [e.g., Berge et al.,1993; O’Connell and Budiansky, 1974].[4] The presence of cracks also affects the attenuation
properties of the fractured body significantly. Attenuationmechanisms include friction, fluid flow and scattering, ofwhich friction on thin cracks and grain boundaries is thedominant attenuation mechanism for consolidated rocks[Johnston et al., 1979]. At ultrasonic frequencies, whenthe wavelength is at the same scale as heterogeneities in therocks, scattering also plays an important role [Tompkins andChristensen, 2001].[5] Attenuation phenomena have not yet received much
attention by the planetary cratering community because ofthe difficulty of carrying out systematic attenuation meas-urements beneath impact craters in the field. Liu and Ahrens[1997] did preliminary work on attenuation beneath impactcraters in the laboratory. They studied shock-induced dam-age in a San Marcos gabbro block and related the measuredattenuation to the crack density and damage in the rocks.However, their work only measured the attenuation of therocks in one direction, and did not take the orientation of thecracks and the propagation direction into account. In reality,the cracks produced by an expanding spherical shockwavewithin a target block include both concentric/spherical andtensile/radial cracks [Polanskey and Ahrens, 1990]. Thecombined effect of the heterogeneity of cracks on theattenuation is of interest in this study.
JOURNAL OF GEOPHYSICAL RESEARCH, VOL. 112, B01201, doi:10.1029/2006JB004353, 2007ClickHere
for
FullArticle
1Department of Geological and Planetary Science, California Instituteof Technology, Pasadena, California, USA.
Copyright 2007 by the American Geophysical Union.0148-0227/07/2006JB004353$09.00
[6] In this work, the postimpact San Marcos granite targethas been cut into 1-cm cubes. Compressional velocity aswell as attenuation properties have been measured for thesecubes using ultrasonic transmission and pulse-echo methods,respectively, in three directions. Section 2 discusses theexperimental techniques, including the ultrasonic velocityand attenuation measurement methodology. Experimentalresults are presented in section 3, followed by the analysisand discussion of the experimental data. The measured stresswave velocities are used to calculate the damage parameterand crack density of the fractured rocks. The measuredattenuation parameters are related to the crack informationin the rocks.
2. Experimental Technique
[7] The San Marcos granite used in this study is fromEscondido, California. Table 1 summarizes the mineralog-ical mode as obtained by analytical scanning electronmicroscopy (SEM) of a thin section. The grain size ofquartz and plagioclase is 1 to 2 mm. These are intergrownwith amphibole, biotite and opaque phases. On a micro-scopic scale, the rock is essentially crack-free except formicrocracks along grain boundaries. The density of the SanMarcos granite is 2.657 g/cm3, the intrinsic compressionalwave velocity is 6.31 ± 0.1 km/s, and the shear wavevelocity is 3.65 ± 0.1 km/s, determined at 5 MHz.[8] The initial 20 � 20 � 15 cm rock target was impacted
by a lead bullet at a velocity of 1.2 km/s. The projectile hasa radius of 0.3 cm and mass of 3.2 g. A 1-cm-thick centerplane slice was cut from the recovered target, then 1-cmaliquots were cut from the plane. We assume that noadditional cracks are produced by the cutting procedures.The cube surfaces were polished until the thickness varia-tions of any two parallel surfaces reached ±0.005 mm. Theresidual water within the samples was largely removed byheating to 110�C for 24 hours within a vacuum furnace.[9] The pulse transmission method [Weidner, 1987] was
used for the ultrasonic velocity measurement. The PZTP wave transducers used were Model 1191, Panametrics,with a central frequency at 5 MHz. The signal was recordedwith an oscilloscope (Gould 6500). Panametrics couplantD-12 is used for P wave measurements and alcohol as thecouplant remover. The P wave velocity of the sample isgiven as
Vp ¼ L=tsample ð1aÞ
tsample ¼ tm � tini ð1bÞ
where L is the length of the sample, tm is the measuredtraveltime, and tini is the initial traveltime measured withoutthe sample between the two transducers. Uncertainty of the
traveltime measurement is ±0.02 ms. The calculated velocityhas an error of 2% as estimated by the accuracy of thetraveltime and length measurements.[10] The pulse-echo technique described by Winkler and
Plona [1982] was used to measure the attenuation coeffi-cient. The transducer/sample assembly is shown schemati-cally in Figure 1. The compressional wave transducer(Panametrics, Model V1191, central frequency 5 MHz)was placed inside a steel case so as to transmit thesurrounding stress. A Panametrics 5052 UA pulser/receiverwas used as the transducer’s driver. Two Lucite buffers areused for coupling with the sample. The Lucite buffer plateswere 1.3 cm in diameter, 0.6 cm in thickness for weakattenuation samples and 0.44 cm in thickness for strongerattenuation samples. The thickness of the buffer plates waschosen to avoid overlapping of the reflected waves fromdifferent surfaces. The Panametrics D-12 couplant was putbetween all the contact surfaces. A constant uniaxial stressload is applied through the position screw to the system toensure good contact between the transducer/buffer and thebuffer/sample surfaces. Stress waves reflected from surfaceA propagate in the first buffer plate only; waves reflectedfrom surface B propagate through both the first buffer plateand the sample. The ultrasonic signals were recorded usinga digital oscilloscope (Gould 6500). The signal was sampledat a period of 4 ns, and the amplitude resolution was 8 bits.Figures 2a and 2b are two typical signals showing the tworeflected waves from surfaces A and B for the 0.6 cm and0.44 cm thickness buffers, respectively. For the thin buffer,the first multiple from surface A is observed before thereflected wave from surface B (Figure 2b). Figures 2a and 2balso show the time windows for fast Fourier transform(FFT), �1 ms, or 250 data points for surface A reflection, and�0.7 ms, or 170 data points, for surface B reflection. Figure 3shows the typical calculated relative spectral amplitudes.[11] For a plane wave propagating in a solid medium, the
amplitude of stress is given by
A x; tð Þ ¼ A0e�axei kx�wtð Þ ð2Þ
where x is propagation distance, w is angular frequency, k iswave number, and t is time. The term of A0e
�ax represents
Table 1. Mineralogical Composition of San Marcos Granite
Figure 1. Sketch of attenuation measurement system(modified from Winkler and Plona [1982]).
B01201 AI AND AHRENS: VELOCITY AND ATTENUATION
2 of 9
B01201
the attenuation of the amplitude and a is the attenuationcoefficient. A possible correction of attenuation due to wavespreading was not considered. According to Winkler andPlona [1982], a is calculated as follows:
a fð Þ ¼ 8:686
2Lln
A fð ÞB fð Þ 1� R2
� �� �ð3Þ
where L is the sample length and A( f ) and B( f ) are thefrequency-dependent amplitudes of the pulse reflected fromsurfaces A and B of the sample, respectively. R is thereflection coefficient for the interface between the couplingbuffer and sample, defined as
R ¼ Cpr� CpcrcCprþ Cpcrc
ð4Þ
where Cp and r are the P wave velocity and the density ofthe samples, respectively. Subscript c means the values forthe Lucite buffers. In this study, Cpc is 2.68 ± 0.02 km/s andrc is 1.19 g/cm3.
3. Experimental Results
3.1. Compressional Wave Velocity Measurements
[12] The ultrasonic compressional velocity measurementsfor the granite cubes were measured in orthogonal direc-tions (Table 2 and Figure 4). Unlike the results for the SanMarcos gabbro from Ahrens and Rubin [1993], local seis-mic anisotropy associated to the major vertical fractures
Figure 2. Typical ultrasonic record for attenuation mea-surements and spectral amplitude of signals. (a) For 0.6 cmthick buffer. Reflected wave from surfaces A and B aremarked separately. T1 and T2 are time windows used forFFT analysis; and (b) for 0.44 cm thick buffer. Multiplereflection from surface A arrived before the first reflectedwave from surface B.
Figure 3. Calculated relative spectral amplitude ofsignals. Peak amplitude for surface A happens at frequency�4.5 MHz.
Table 2. Compressional Wave Velocity Beneath Impact Crater in
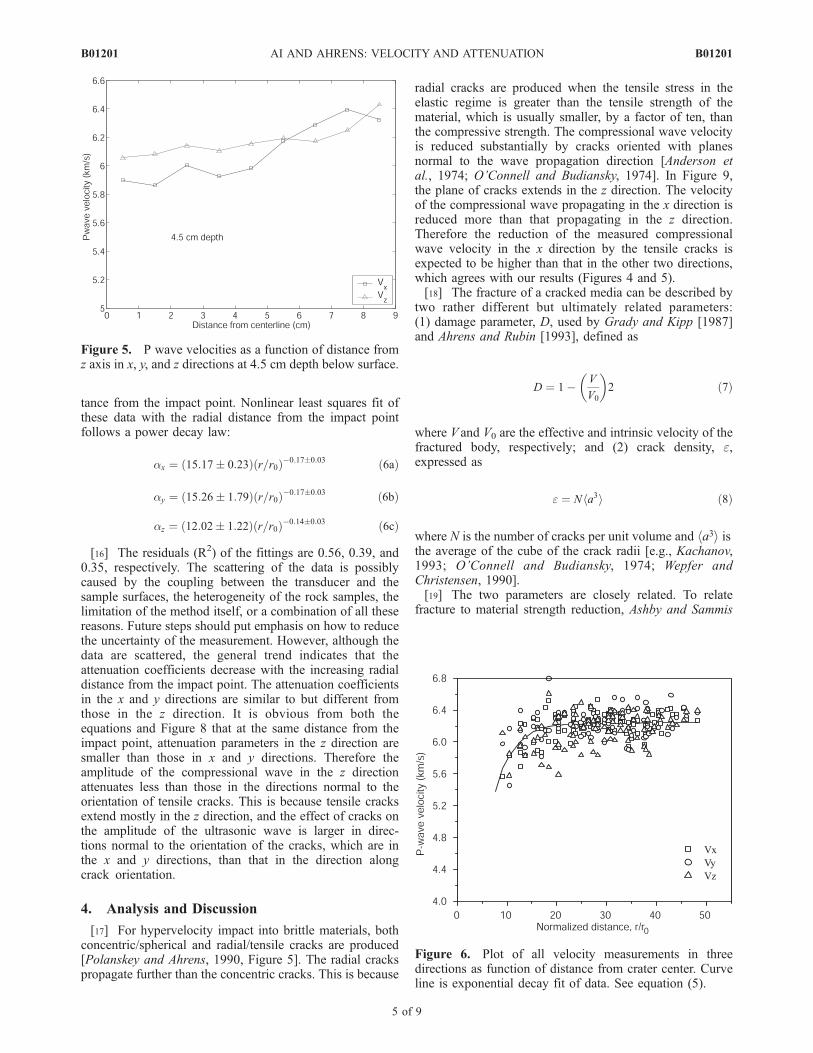
parallel with the specimen edge, or referred as ‘‘sidespallation fractures’’ by Fujiwara [1980], is not observed.This is because the impact velocity, 1.2 km/s in our study, ismuch less than that used in Ahrens and Rubin [1993] for thegabbro shot. The unshocked intrinsic ultrasonic velocityvalue far from the crater center section is 6.4 ± 0.2 km/s forall the three directions (Figure 4). Beneath the center of thecrater, the intrinsic velocity value is reached at a depth of6 cm in the x direction; whereas for the z direction, which isthe impact direction and contains the planar radial cracksbeneath the crater, the intrinsic velocity is reached at �4 cm.This phenomenon is more obvious in Figure 5. At a depth of4.5 cm in the sample, the P wave velocity in the x directionis consistently lower than that in the z direction within theregion near the crater center line. The P wave velocityapproaches unshocked values at �5.5 cm radial distancefrom the center line for all the three directions.[13] Figure 6 shows the velocity measurements in all the
three directions versus radial distance from the impact point,r (r =
and the radial distance, normalized by the radius of theprojectile, 0.3 cm for this shot, is found to follow anexponential decay relation:
Vp ¼ 6:24 1� e �0:260:01ð Þr=r0� �
ð5Þ
[14] The ultrasonic P wave velocity increase to itsunshocked value at r/r0 equals 20, or, the radial distance�6 cm. This is in good agreement with the observation ofthe limit of radial cracking that may be seen in the crosssection after cutting the target open (Figure 7).
3.2. Attenuation Measurements
[15] Compressional wave attenuation coefficients are allcalculated at a frequency of 4.5 MHz, the central peak of thereflected wave from surface A (Figure 3) using equations(3)–(4). The accuracy of calculating ap using this pulse-echo method is estimated to be ±0.05 dB/cm [Wepfer andChristensen, 1990]. Figure 8 shows the relation between theattenuation coefficients versus the normalized radial dis-
Figure 4. P wave velocities as a function of distance from z axis at indicated depths within sample inthe (a) x direction, (b) y direction, and (c) z direction.
B01201 AI AND AHRENS: VELOCITY AND ATTENUATION
4 of 9
B01201
tance from the impact point. Nonlinear least squares fit ofthese data with the radial distance from the impact pointfollows a power decay law:
ax ¼ 15:17 0:23ð Þ r=r0ð Þ�0:170:03 ð6aÞ
ay ¼ 15:26 1:79ð Þ r=r0ð Þ�0:170:03 ð6bÞ
az ¼ 12:02 1:22ð Þ r=r0ð Þ�0:140:03 ð6cÞ
[16] The residuals (R2) of the fittings are 0.56, 0.39, and0.35, respectively. The scattering of the data is possiblycaused by the coupling between the transducer and thesample surfaces, the heterogeneity of the rock samples, thelimitation of the method itself, or a combination of all thesereasons. Future steps should put emphasis on how to reducethe uncertainty of the measurement. However, although thedata are scattered, the general trend indicates that theattenuation coefficients decrease with the increasing radialdistance from the impact point. The attenuation coefficientsin the x and y directions are similar to but different fromthose in the z direction. It is obvious from both theequations and Figure 8 that at the same distance from theimpact point, attenuation parameters in the z direction aresmaller than those in x and y directions. Therefore theamplitude of the compressional wave in the z directionattenuates less than those in the directions normal to theorientation of tensile cracks. This is because tensile cracksextend mostly in the z direction, and the effect of cracks onthe amplitude of the ultrasonic wave is larger in direc-tions normal to the orientation of the cracks, which are inthe x and y directions, than that in the direction alongcrack orientation.
4. Analysis and Discussion
[17] For hypervelocity impact into brittle materials, bothconcentric/spherical and radial/tensile cracks are produced[Polanskey and Ahrens, 1990, Figure 5]. The radial crackspropagate further than the concentric cracks. This is because
radial cracks are produced when the tensile stress in theelastic regime is greater than the tensile strength of thematerial, which is usually smaller, by a factor of ten, thanthe compressive strength. The compressional wave velocityis reduced substantially by cracks oriented with planesnormal to the wave propagation direction [Anderson etal., 1974; O’Connell and Budiansky, 1974]. In Figure 9,the plane of cracks extends in the z direction. The velocityof the compressional wave propagating in the x direction isreduced more than that propagating in the z direction.Therefore the reduction of the measured compressionalwave velocity in the x direction by the tensile cracks isexpected to be higher than that in the other two directions,which agrees with our results (Figures 4 and 5).[18] The fracture of a cracked media can be described by
two rather different but ultimately related parameters:(1) damage parameter, D, used by Grady and Kipp [1987]and Ahrens and Rubin [1993], defined as
D ¼ 1� V
V0
� 2 ð7Þ
where V and V0 are the effective and intrinsic velocity of thefractured body, respectively; and (2) crack density, e,expressed as
e ¼ Nha3i ð8Þ
where N is the number of cracks per unit volume and ha3i isthe average of the cube of the crack radii [e.g., Kachanov,1993; O’Connell and Budiansky, 1974; Wepfer andChristensen, 1990].[19] The two parameters are closely related. To relate
fracture to material strength reduction, Ashby and Sammis
Figure 5. P wave velocities as a function of distance fromz axis in x, y, and z directions at 4.5 cm depth below surface.
Figure 6. Plot of all velocity measurements in threedirections as function of distance from crater center. Curveline is exponential decay fit of data. See equation (5).
B01201 AI AND AHRENS: VELOCITY AND ATTENUATION
5 of 9
B01201
[1990] give damage in a body with inclined cracks of length2a by
D ¼ 4
3p aað Þ3N ð9Þ
where a is a geometric constant. It is obvious that this is thesame concept as the crack density comparing equations (8)and (9). In this study, definition of damage parameter inequation (7) is used, since it is directly related to ourvelocity measurements.[20] From the measured compressional wave velocity of
the samples, Dp is calculated from equation (7). Figure 10shows the damage parameter versus the normalized radialdistance from the impact point for the three orthogonaldirections. The data are fitted by a power decay lawfunction:
Dx ¼ 0:95 0:25ð Þ r=r0ð Þ�0:530:08 ð10aÞ
Dy ¼ 0:99 0:22ð Þ r=r0ð Þ�0:540:06 ð10bÞ
Dz ¼ 1:04 0:29ð Þ r=r0ð Þ�0:50:08 ð10cÞ
[21] The residuals (R2) of the fittings are 0.58, 0.57 and0.44 respectively. The damage parameters in all the threedirections decay with distance from the impact point.Anisotropy is not very obvious from the damage parametercalculation.[22] As mentioned before, the observed elastic velocity
behavior of a rock is a function of the intrinsic elasticvelocity, the matrix and fluid properties, the crack density (e),the geometry of cracks and the interactions between them. Inother words, crack density can be inferred from the observedelastic velocity provided the rest of parameters are known.Next we will use the theory of O’Connell and Budiansky[1974] to calculate the crack density using the measured
compressional velocity. Usually the solution based on thistype of model often does not correspond to experimental datafor materials with a large contrast in component properties[Levin and Markvo, 2005]. Also, according to this model, theshear modulus becomes zero when the crack density is higherthan a certain value. However, unlike another type of model[e.g., Kachanov, 1993], the model of O’Connell andBudiansky [1974] takes into account the interaction betweencracks, which is important for rocks. Therefore the modelof O’Connell and Budiansky [1974] is preferred for ourstudy.[23] Figure 11 shows the calculated crack density by
using the model of O’Connell and Budiansky [1974] versusthe normalized radial distance from the impact point for thethree orthogonal directions. Similarly, the crack densitydecreases exponentially with the distance for all the threedirections:
ex ¼ 0:5 r=r0ð Þ�0:580:09 ð11aÞ
ey ¼ 0:5 r=r0ð Þ�0:60:07 ð11bÞ
ez ¼ 0:5 r=r0ð Þ�0:540:08 ð11cÞ
[24] Again, the scattering of these data is caused by thesame reason mentioned in section 3.2. Direct measurement ofthe crack damage using microscope will be carried out inthe near future. The measurement can be compared with thecalculated value here. This will be very useful to test thevalidity of the theocratical model ofO’Connell and Budiansky[1974].[25] Now we have both the damage parameter and the
attenuation coefficient for the samples, it is interesting toexplore the correlation between the two parameters.Figure 12 shows the dependence of attenuation coefficienton the damage parameter for the cubes measured in thethree directions. The attenuation coefficients increase with
Figure 7. Cross section of shot 117, recovered granite impacted by 3.2 g lead bullet at 1200 m/sshowing different types of cracks and damage depth. Cracks are highlighted by dye coolant.
B01201 AI AND AHRENS: VELOCITY AND ATTENUATION
6 of 9
B01201
the damage parameters consistently for the three situations.The data are fitted with
[26] Unit of a is decibels per centimeter. The intercepts ofthese equations represent the intrinsic values of the attenu-ation coefficients of the samples when there is no shock-induced damage (D equals zero). The values for the threedirections are very close (5.66 to 5.97). However, the slopeof the equation for the z direction is only about half of thevalues of the x and y directions. This means that for thesame damage parameter obtained from the measured P wavevelocity, the attenuation coefficient in the z direction issmaller than the values in x and y directions. The tensilecracks propagating in the impact direction have a larger effecton the attenuation coefficients in directions perpendicular toit. Therefore the attenuation coefficient is a more usefulparameter than thewave velocity in describing the anisotropicorientation of cracks.
5. Concluding Remarks
[27] The 1-cm cubes have been cut from a San Marcosgranite target block recovered from an impact crateringexperiment. Both compressional wave velocity and attenu-ation measurements were conducted on these cubes in threeorthogonal directions. The damage parameter has beencalculated from the measured P wave velocity. The theoryof O’Connell and Budiansky [1974] was used to calculatethe crack density of the cracked media from the measuredvelocity. The main conclusions obtained from this study areas follows:[28] 1. Anisotropy is observed from the ultrasonic veloc-
ity and attenuation measurement, but it is not very obviousfrom the calculated damage parameter and crack density.[29] 2. The measured P wave velocity and the normalized
radial distance from the impact point follow an exponentialdecay relation, shown in equation (5).[30] 3. The change of rock properties (D, e, a) beyond the
shock pressure regime 1 with the normalized radial distancefrom the impact point can be expressed by
D; e;að Þ ¼ a r=r0ð Þb ð13Þ
where a and b are fitted constants.
Figure 8. Attenuation coefficients as a function ofnormalized radial distance from impact point for threedirections. Lines are power decay fit of data in the (a) x; (b) y;and (c) z directions.
Figure 9. Schematic diagram showing effect of alignedcracks on elastic waves propagating at different directions.Compressional wave velocity in x direction is reduced morethan that in z direction.
B01201 AI AND AHRENS: VELOCITY AND ATTENUATION
7 of 9
B01201
Figure 10. Damage parameters as a function of normal-ized radial distance from impact point for three directions.Lines are power decay fit of data.
Figure 11. Crack densities inverted from measured P wavevelocity by using model of O’Connell and Budiansky[1974] as function of normalized radial distance fromimpact point for three directions. Lines are power decay fitof data in the (a) x, (b) y, and (c) z directions.
B01201 AI AND AHRENS: VELOCITY AND ATTENUATION
8 of 9
B01201
[31] 4. Attenuation coefficient is a more useful parameterthan elastic velocity in studying the anisotropic orientationof cracks. From equation (12), the slope of the linearrelation of attenuation coefficient versus damage parameter
in the x and y directions is about twice that of the value inz direction.
[32] Acknowledgments. This research was supported by NASAGoddard grant under award NNG04GI07G. We appreciate the technicalsupport of E. Gelle and M. Long. We thank G. Ravichandran for the use ofthe ultrasonic attenuation apparatus. We also thank Shiming Zhuang, TracyKidd, and Daoyuan Sun for their thoughtful suggestions and discussions.Division of Geological and Planetary Sciences, California Institute ofTechnology contribution 9128.
ReferencesAckermann, H. D., R. H. Godson, and J. S. Watkins (1975), A seismicrefraction technique used for subsurface investigations at Meteor Crater,Arizona, J. Geophys. Res., 80, 765–775.
Ahrens, T. J., and A. M. Rubin (1993), Impact-induced tensional failure inrock, J. Geophys. Res., 98, 1185–1203.
Ai, H. A., and T. J. Ahrens (2004), Dynamic tensile strength of terrestrialrocks and application to impact cratering, Meteorit. Planet. Sci., 39(2),233–246.
Anderson, D. L., B. Minster, and D. Cole (1974), The effect of orientedcracks on seismic velocities, J. Geophys. Res., 79, 4011–4015.
Ashby, M., and C. Sammis (1990), The damage mechanics of brittle solidsin compression, Pure Appl. Geophys., 133, 489–521.
Berge, P. A., J. G. Berryman, and B. P. Bonner (1993), Influence of micro-structure on rock elastic properties, Geophys. Res. Lett., 20, 2619–2622.
Dvorak, J., and R. Phillips (1977), The nature of the gravity anomaliesassociated with large young lunar craters,Geophys. Res. Lett., 4, 380–382.
Eshelby, J. (1957), The determination of the elastic field of an ellipsoidalinclusion and related problems, Proc. R. Soc. London, Ser. A, 241, 376–396.
Fujiwara, A. (1980), On the mechanism of catastrophic destruction of minorplanets by high-velocity impact, Icarus, 31, 277–288.
Grady, D., and M. Kipp (1987), Dynamic rock fragmentation, in FractureMechanics of Rocks, edited by B. Atkinson, pp. 429–475, Elsevier, NewYork.
Hudson, J. A. (1990), Overall elastic properties of isotropic materials witharbitrary distribution of circular cracks, Geophys. J. R. Astron. Soc., 102,465–469.
Johnston, D. H., M. N. Toksoz, and A. Timur (1979), Attenuation ofseismic waves in dry and saturated rocks: I. Mechanisms, Geophysics,44, 691–711.
Kachanov, M. (1993), Elastic solids with many cracks and related pro-blems, Adv. Appl. Mech., 30, 259–445.
Levin, V., and M. Markvo (2005), Elastic properties of inhomogeneoustransversely isotropic rocks, Int. J. Solids Struct., 42, 393–408.
Liu, C., and T. J. Ahrens (1997), Stress wave attenuation in shock-damagedrock, J. Geophys. Res., 102, 5243–5250.
Nur, A. (1971), Effects of stress on velocity anisotropy in rocks with cracks,J. Geophys. Res., 76, 2022–2034.
O’Connell, R. J., and B. Budiansky (1974), Seismic velocities in dry andsaturated cracked solids, J. Geophys. Res., 79, 5412–5426.
Polanskey, C. A., and T. J. Ahrens (1990), Impact spallation experiments:Fracture patterns and spall velocities, Icarus, 87, 140–155.
Simmons, G., T. Todd, and H. Wang (1973), The 25-km discontinuity:Implications for lunar history, Science, 182, 158–161.
Tompkins, M. J., and N. I. Christensen (2001), Ultrasonic p- and s-waveattenuation in oceanic basalt, Geophys. Int., 145, 172–186.
Weidner, D. J. (1987), Elastic properties of rocks and minerals, in Methodsof Experimental Physics, edited by C. Sammis and T. Henyey, pp. 1–28,Elsevier, New York.
Wepfer, W., and N. Christensen (1990), Compressional wave attenuation inoceanic basalts, J. Geophys. Res., 95, 17,431–17,439.
Winkler, K., and T. Plona (1982), Technique for measuring ultrosonicvelocity and attenuation spectra in rocks under pressure, J. Geophys.Res., 87, 10,776–10,780.
�����������������������T. J. Ahrens and H. A. Ai, Department of Geological and Planetary