university of copenhagen Københavns Universitet Effects of short-term warming on low and high latitude forest ant communities Pelini, Shannon L.; Boudreau, Mark; McCoy, Neil; Ellison, Aaron M.; Gotelli, Nicholas J.; Sanders, Nate; Dunn, Robert R. Published in: Ecosphere (Washington, D.C.) DOI: 10.1890/ES11-00097.1 Publication date: 2011 Document Version Publisher's PDF, also known as Version of record Citation for published version (APA): Pelini, S. L., Boudreau, M., McCoy, N., Ellison, A. M., Gotelli, N. J., Sanders, N., & Dunn, R. R. (2011). Effects of short-term warming on low and high latitude forest ant communities. Ecosphere (Washington, D.C.), 2(5), 1-12. DOI: 10.1890/ES11-00097.1 Download date: 12. apr.. 2018
Transcript
u n i ve r s i t y o f co pe n h ag e n
Københavns Universitet
Effects of short-term warming on low and high latitude forest ant communities
Pelini, Shannon L.; Boudreau, Mark; McCoy, Neil; Ellison, Aaron M.; Gotelli, Nicholas J.;Sanders, Nate; Dunn, Robert R.Published in:Ecosphere (Washington, D.C.)
DOI:10.1890/ES11-00097.1
Publication date:2011
Document VersionPublisher's PDF, also known as Version of record
Citation for published version (APA):Pelini, S. L., Boudreau, M., McCoy, N., Ellison, A. M., Gotelli, N. J., Sanders, N., & Dunn, R. R. (2011). Effects ofshort-term warming on low and high latitude forest ant communities. Ecosphere (Washington, D.C.), 2(5), 1-12.DOI: 10.1890/ES11-00097.1
Effects of short-term warming on low and high latitudeforest ant communities
SHANNON L. PELINI,1,� MARK BOUDREAU,2,5 NEIL MCCOY,2 AARON M. ELLISON,1 NICHOLAS J. GOTELLI,3
NATHAN J. SANDERS,4 AND ROBERT R. DUNN2
1Harvard Forest, Harvard University, Petersham, Massachusetts 01366 USA2Department of Biology, North Carolina State University, Raleigh, North Carolina 27695 USA
3Department of Biology, University of Vermont, Burlington, Vermont 05405 USA4Department of Ecology and Evolutionary Biology, University of Tennessee, Knoxville, Tennessee 37996 and Center for Macroecology,
Evolution and Climate, Department of Biology, University of Copenhagen, Denmark
Abstract. Climatic change is expected to have differential effects on ecological communities in different
geographic areas. However, few studies have experimentally demonstrated the effects of warming on
communities simultaneously at different locales. We manipulated air temperature with in situ passive
warming and cooling chambers and quantified effects of temperature on ant abundance, diversity, and
foraging activities (predation, scavenging, seed dispersal, nectivory, granivory) in two deciduous forests at
358 and 438 N latitude in the eastern U.S. In the southern site, the most abundant species, Crematogaster
lineolata, increased while species evenness, most ant foraging activities, and abundance of several other ant
species declined with increasing temperature. In the northern site, species evenness was highest at
intermediate temperatures, but no other metrics of diversity or foraging activity changed with temperature.
Regardless of temperature, ant abundance and foraging activities at the northern site were several orders of
magnitude lower than those in the southern site.
Key words: climate change; community composition; foraging; Formicidae; warming experiment.
Received 12 April 2011; accepted 26 April 2011; published 27 May 2011. Corresponding Editor: R. Irwin.
Citation: Pelini, S. L., M. Boudreau, N. McCoy, A. M. Ellison, N. J. Gotelli, N. J. Sanders, and R. R. Dunn. 2011. Effects of
short-term warming on low and high latitude forest ant communities. Ecosphere 2(5):art62. doi:10.1890/ES11-00097.1
Copyright: � 2011 Pelini et al. This is an open-access article distributed under the terms of the Creative Commons
Attribution License, which permits restricted use, distribution, and reproduction in any medium, provided the original
author and sources are credited.5 Present address: Department of Biological and Agricultural Engineering, University of Georgia, Griffin, Georgia 30223
The ecological impacts of projected climaticchange are likely to have a strong geographic
signal. For species that have geographic rangesconstrained by temperature, warming may facil-
itate population increases and range expansions
at high latitudes while simultaneously decreas-ing population sizes and contracting ranges at
low latitudes (Parmesan and Yohe 2003). Otherstudies suggest that the consequences of warm-
ing will be more severe at lower latitudes, where
organisms may be more sensitive to fluctuating
temperatures (Deutsch et al. 2008, Tewksbury etal. 2008, Dillon et al. 2010). Differential responsesof populations to warming at high versus lowlatitudes also can be accompanied by communi-
ty-level changes such as increases in speciesdiversity at high latitudes and decreases inspecies diversity at low latitudes (Menendez etal. 2006, Wilson et al. 2007).
Other factors may obscure, or even ameliorate,the geographic signal of climate change onecological communities. For example, tempera-ture increases are expected to be more pro-
nounced at high latitudes (Solomon et al. 2007).
v www.esajournals.org 1 May 2011 v Volume 2(5) v Article 62
Local adaptation to historical climates, andcorresponding maladaptation to new climates,also may be more pronounced at high latitudes(Pelini et al. 2009). Although individual organ-isms at low latitudes may be more sensitive toclimatic change than those at high latitudes,ecological communities at low latitudes could bemore resilient to environmental change becausethey are generally more diverse (Wittebolle et al.2009). Yet, because most experimental studies ofthe effects of warming have been conducted atsingle sites (but see Doak and Morris 2010), it isunclear whether warming will have differentialeffects on the structure and function of similarcommunities and ecosystems across latitude anddiversity gradients. Here, we report the results ofa temperature manipulation experiment on antcommunity composition and foraging activity indeciduous forests that was conducted simulta-neously at two sites, separated by 8 degrees oflatitude (;1000 km), in the eastern United States.
We focused on ants because they are numer-ically dominant in many terrestrial ecosystems,and their foraging activities, including seeddispersal, nectivory, granivory, predation, andscavenging, cut across many trophic levels andcan affect ecosystem processes such as nutrientcycling (cf. Holldobler and Wilson 1990, Folgarait1998). We experimentally manipulated a keycomponent of climatic change—atmosphericwarming—because temperature is correlatedwith patterns of ant diversity and abundance(Kaspari et al. 2003, Sanders et al. 2007, Dunn etal. 2009), seasonal patterns of activity (Dunn et al.2007), foraging behavior (Ruano et al. 2000), andthe outcomes of interactions between species(Cerda et al. 1997, Holway et al. 2002). Wehypothesized that changes in air temperaturewould have different effects on ant abundance,species richness, species evenness, and foragingactivities at the two sites. We expected that antabundance, diversity and foraging activitieswould increase in the northern site, where coolertemperatures may be limiting, while ant abun-dance, diversity and foraging may decrease at thesouthern site, where many ant species arealready exposed to temperatures near theirthermal limits.
METHODS
Study sitesThe warming experiment was conducted si-
multaneously at two sites, Harvard Forest(‘‘northern site’’) and Duke Forest (‘‘southernsite’’). Harvard Forest is in central Massachusettsin the northern hardwood hemlock-white pinetransition zone (4283104800 N, 7281102400 W, 300 melevation above sea level (a.s.l.)). The meanannual temperature at Harvard Forest is 7.18Cand the mean annual precipitation is 1066 mm.Our experimental site at Harvard Forest is in an;70-yr-old oak-maple stand in the Prospect HillTract. Duke Forest is near Hillsborough, NorthCarolina (358520000 N, 7985904500 W, 130 m a.s.l.), inthe Piedmont region. The mean annual temper-ature at Duke Forest is 15.58C and mean annualprecipitation is 1140 mm. Our experimental siteat Duke Forest is in an ;80-yr-old oak-hickorystand within the Eno River Unit.
Harvard Forest and Duke Forest share morethan 30 ant species but they differ substantially inant diversity and abundance (Pelini et al. 2011).An additional 65 species have been recorded atDuke Forest but not at Harvard Forest, and anadditional 12 species have been recorded atHarvard Forest but not at Duke Forest. Antsare active at Harvard Forest April throughNovember while those at Duke Forest are activeyear-round, but peak abundance occurs May–August at both sites. In our experimentalchambers during the six months of this experi-ment, we captured 16,000 individuals from 28species at Duke Forest and fewer than 1000individuals from 9 species at Harvard Forest.Only one species, Aphaenogaster rudis, occurred inthe experimental chambers at both sites.
Minichamber design and deploymentWe altered air temperatures in the forest
understory near the forest floor by using pas-sively heated and cooled minichambers (Lessardet al. 2010, Wittman et al. 2010). Each minicham-ber was a table-shaped frame of 1.3-cm-diameterPVC pipe that supported a 1 3 1 m open-topframe 57 cm above the ground. Previous work onant communities has documented ant responsesto both abiotic and biotic changes caused bythese treatments in similar sized plots (e.g.,Kaspari et al. 2003, Sanders et al. 2007, McGlynn
v www.esajournals.org 2 May 2011 v Volume 2(5) v Article 62
PELINI ET AL.
et al. 2009). A common ant at both sites,Aphaenogaster rudis, has foraging and nest emi-gration distances shorter than 1 m (Smallwood1982). To reduce temperatures, we covered thetop frame of 10 of the minichambers at each sitewith a 1 3 1 m piece of shade cloth mesh thatreduced solar gain by 80% but allowed for rainpenetration to the soil surface. To raise temper-atures in 10 of the minichambers at each site, weattached clear polyethylene sheeting to the topand along each side down to a height of 9 cmabove the soil. We punched 25 6-mm-diameterholes in a uniform pattern in the top polyethyl-ene to allow for rain penetration. We alsoestablished 10 control minichambers, which werePVC frames only. We secured the legs of theminichambers to the ground with iron rods.
Under the forest canopy at both sites, wearranged the 30 minichambers in a completelyrandomized design, with neighboring minicham-bers being separated by at least five meters. Wedeployed the minichambers in April 2009, whenmany ant species actively move their nests(Smallwood 1982). We left the minichambers inplace until the experiment was ended in Septem-ber 2009.
TemperatureWe recorded air and soil temperatures in all of
the northern minichambers with thermistorsconnected to a Campbell Scientific data logger(CR100, Logan, Utah). At the southern site, wemeasured air temperature in seven randomly-chosen minichambers of each treatment (i.e., 21out of the 30 minichambers) using iButtont
electronic temperature sensors (Dallas Semicon-ductors, Dallas, Texas). We shielded all airtemperature sensors from direct sun and rainand placed them 5 cm above the litter layerbeneath the minichambers.
Though the minichamber treatments wereimplemented as one-factor ANOVA design withthree treatment levels (cooling, warming, con-trol), there was substantial variation in temper-ature within treatment groups due tomicrohabitat and other variables not manipulat-ed in this study. Thus, we treated the tempera-ture manipulation as a continuous variable andused regression to determine the effects ofvariation in temperature on ant assemblagecomposition and foraging activities (Inouye
2001, Cottingham et al. 2005). We note that bothregression and ANOVA are linear models ofidentical mathematical form, and unlikeANOVA, regression analysis can identify poten-tial nonlinearities in associations between tem-perature and ant response variables (Cottinghamet al. 2005, Meyers et al. 2009).
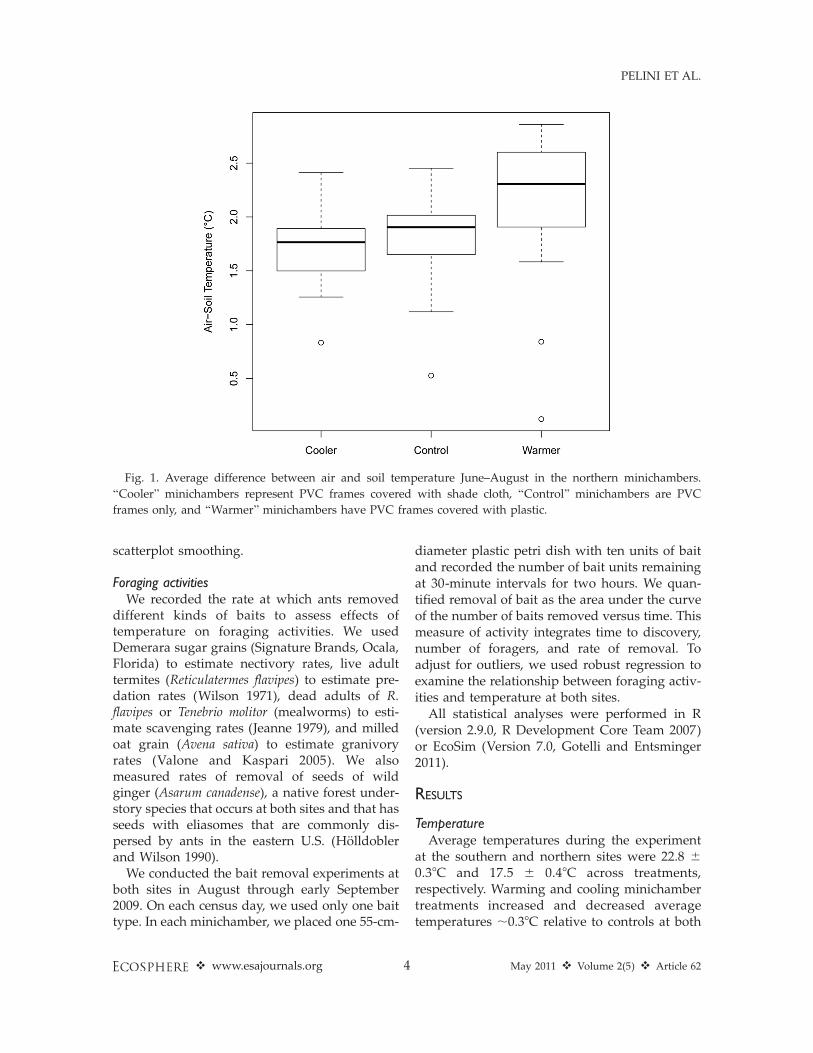
Though variation in soil temperature is also animportant determinant of ant community struc-ture and foraging activities, we used air temper-ature data in analyses of temperature effects onant composition and activity because soil tem-perature was not measured at the southern site.Soil temperatures did track air temperaturessimilarly in the three minichamber treatments(i.e., the differences between average soil and airtemperatures were the same in the three treat-ments) at Harvard Forest (ANOVA: F2,37¼ 1.6, P¼ 0.21; Fig. 1). We are confident that theassociations we report between air temperatureand ant community structure and foragingactivities reflect real responses to temperaturechange. Finally, we also calculated the averagedaily range of temperatures by subtracting thedaily minimum from the maximum for eachminichamber and used this variable to testwhether or not diurnal variation in temperatureaffected the ant communities that we studied.
Ant community compositionIn September 2009, we terminated the exper-
iment and collected all of the leaf litter withineach minichamber to sample ants. We extracted,identified and counted ants from all organicmatter and loose surface soil in the 1 m2 areausing Winkler extractors (Fisher 1998). We usedgeneral linear models with Poisson error distri-butions to examine relationships between totalant abundance and species richness with averagetemperature and diurnal variation in tempera-ture at both sites. We estimated species evennessusing Hurlbert’s PIE (probability of an interspe-cific encounter; Hurlbert 1971) for each mini-chamber. This diversity index is equivalent to theslope of an individual-based rarefaction curvemeasured at its base (Olsweski 2004). We usedgeneral linear models to examine the relationshipbetween PIE and temperature in the southernsite, but because of strong departures fromnormality in data from the northern site, weexamined these latter data using locally weighted
v www.esajournals.org 3 May 2011 v Volume 2(5) v Article 62
PELINI ET AL.
scatterplot smoothing.
Foraging activitiesWe recorded the rate at which ants removed
different kinds of baits to assess effects oftemperature on foraging activities. We usedDemerara sugar grains (Signature Brands, Ocala,Florida) to estimate nectivory rates, live adulttermites (Reticulatermes flavipes) to estimate pre-dation rates (Wilson 1971), dead adults of R.flavipes or Tenebrio molitor (mealworms) to esti-mate scavenging rates (Jeanne 1979), and milledoat grain (Avena sativa) to estimate granivoryrates (Valone and Kaspari 2005). We alsomeasured rates of removal of seeds of wildginger (Asarum canadense), a native forest under-story species that occurs at both sites and that hasseeds with eliasomes that are commonly dis-persed by ants in the eastern U.S. (Holldoblerand Wilson 1990).
We conducted the bait removal experiments atboth sites in August through early September2009. On each census day, we used only one baittype. In each minichamber, we placed one 55-cm-
diameter plastic petri dish with ten units of baitand recorded the number of bait units remainingat 30-minute intervals for two hours. We quan-tified removal of bait as the area under the curveof the number of baits removed versus time. Thismeasure of activity integrates time to discovery,number of foragers, and rate of removal. Toadjust for outliers, we used robust regression toexamine the relationship between foraging activ-ities and temperature at both sites.
All statistical analyses were performed in R(version 2.9.0, R Development Core Team 2007)or EcoSim (Version 7.0, Gotelli and Entsminger2011).
RESULTS
TemperatureAverage temperatures during the experiment
at the southern and northern sites were 22.8 6
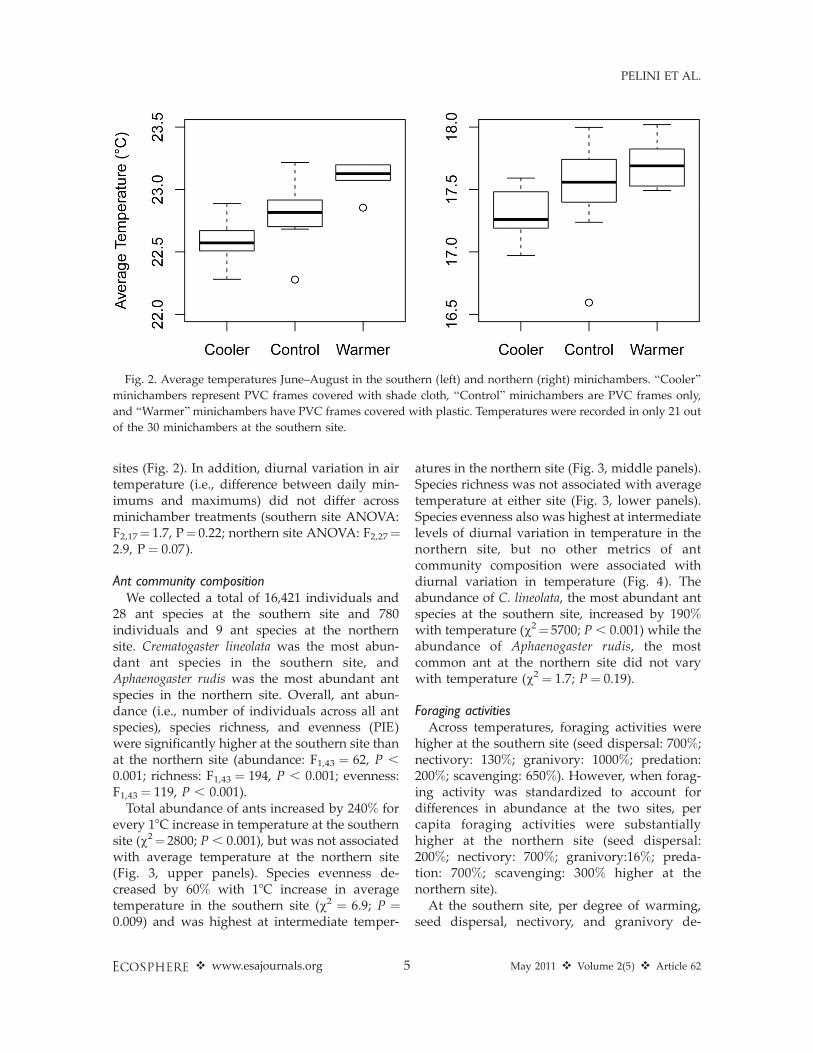
0.38C and 17.5 6 0.48C across treatments,respectively. Warming and cooling minichambertreatments increased and decreased averagetemperatures ;0.38C relative to controls at both
Fig. 1. Average difference between air and soil temperature June–August in the northern minichambers.
‘‘Cooler’’ minichambers represent PVC frames covered with shade cloth, ‘‘Control’’ minichambers are PVC
frames only, and ‘‘Warmer’’ minichambers have PVC frames covered with plastic.
v www.esajournals.org 4 May 2011 v Volume 2(5) v Article 62
PELINI ET AL.
sites (Fig. 2). In addition, diurnal variation in airtemperature (i.e., difference between daily min-imums and maximums) did not differ acrossminichamber treatments (southern site ANOVA:F2,17¼ 1.7, P¼ 0.22; northern site ANOVA: F2,27¼2.9, P ¼ 0.07).
Ant community compositionWe collected a total of 16,421 individuals and
28 ant species at the southern site and 780individuals and 9 ant species at the northernsite. Crematogaster lineolata was the most abun-dant ant species in the southern site, andAphaenogaster rudis was the most abundant antspecies in the northern site. Overall, ant abun-dance (i.e., number of individuals across all antspecies), species richness, and evenness (PIE)were significantly higher at the southern site thanat the northern site (abundance: F1,43 ¼ 62, P ,
0.001; richness: F1,43 ¼ 194, P , 0.001; evenness:F1,43¼ 119, P , 0.001).
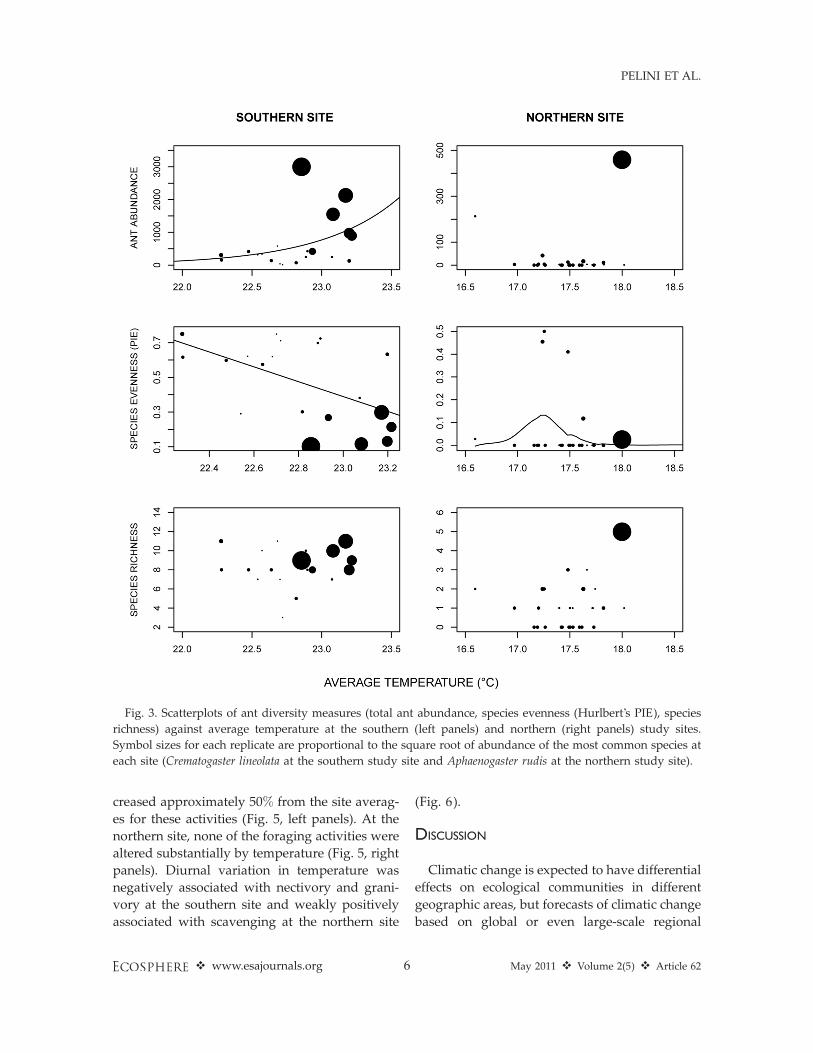
Total abundance of ants increased by 240% forevery 18C increase in temperature at the southernsite (v2¼ 2800; P , 0.001), but was not associatedwith average temperature at the northern site(Fig. 3, upper panels). Species evenness de-creased by 60% with 18C increase in averagetemperature in the southern site (v2 ¼ 6.9; P ¼0.009) and was highest at intermediate temper-
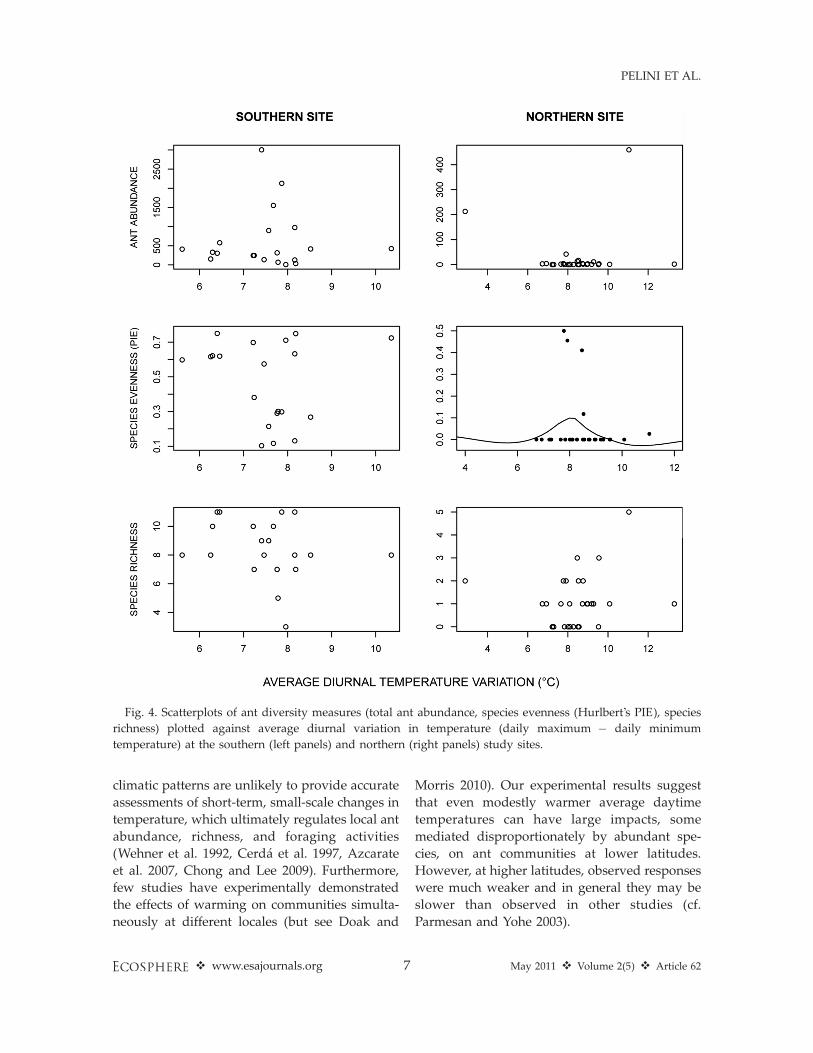
atures in the northern site (Fig. 3, middle panels).Species richness was not associated with averagetemperature at either site (Fig. 3, lower panels).Species evenness also was highest at intermediatelevels of diurnal variation in temperature in thenorthern site, but no other metrics of antcommunity composition were associated withdiurnal variation in temperature (Fig. 4). Theabundance of C. lineolata, the most abundant antspecies at the southern site, increased by 190%with temperature (v2¼ 5700; P , 0.001) while theabundance of Aphaenogaster rudis, the mostcommon ant at the northern site did not varywith temperature (v2 ¼ 1.7; P ¼ 0.19).
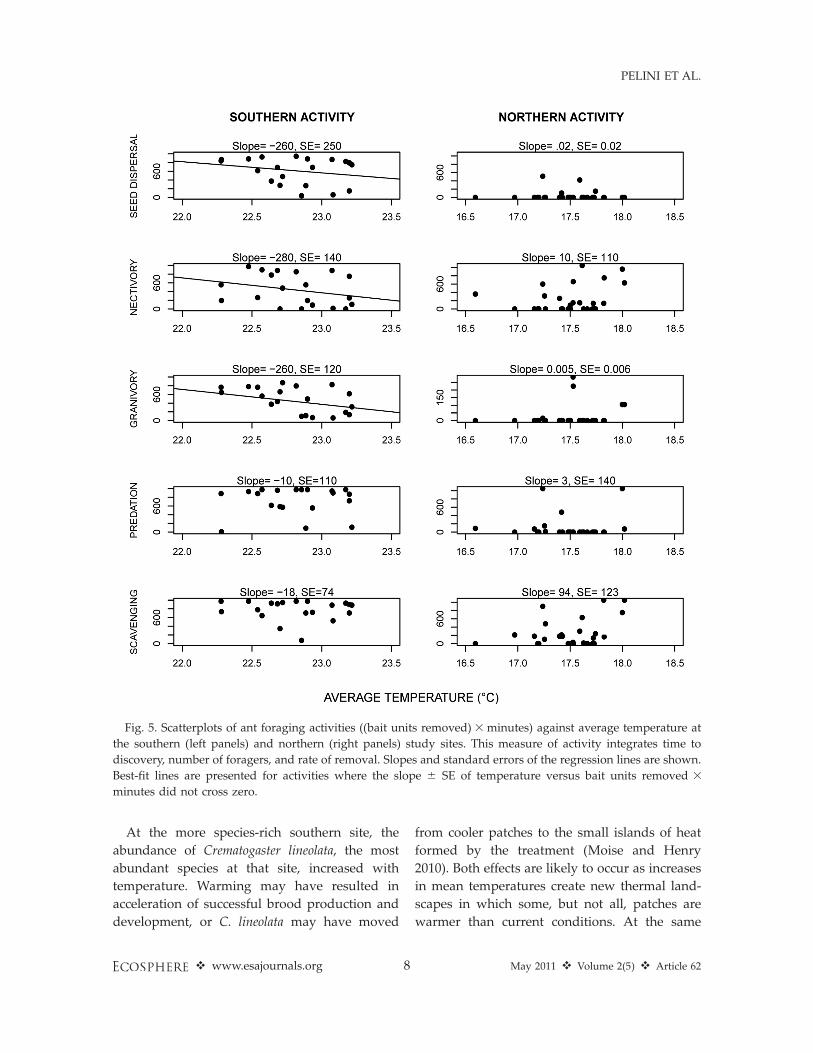
Foraging activitiesAcross temperatures, foraging activities were
higher at the southern site (seed dispersal: 700%;nectivory: 130%; granivory: 1000%; predation:200%; scavenging: 650%). However, when forag-ing activity was standardized to account fordifferences in abundance at the two sites, percapita foraging activities were substantiallyhigher at the northern site (seed dispersal:200%; nectivory: 700%; granivory:16%; preda-tion: 700%; scavenging: 300% higher at thenorthern site).
At the southern site, per degree of warming,seed dispersal, nectivory, and granivory de-
Fig. 2. Average temperatures June–August in the southern (left) and northern (right) minichambers. ‘‘Cooler’’
minichambers represent PVC frames covered with shade cloth, ‘‘Control’’ minichambers are PVC frames only,
and ‘‘Warmer’’minichambers have PVC frames covered with plastic. Temperatures were recorded in only 21 out
of the 30 minichambers at the southern site.
v www.esajournals.org 5 May 2011 v Volume 2(5) v Article 62
PELINI ET AL.
creased approximately 50% from the site averag-
es for these activities (Fig. 5, left panels). At the
northern site, none of the foraging activities were
altered substantially by temperature (Fig. 5, right
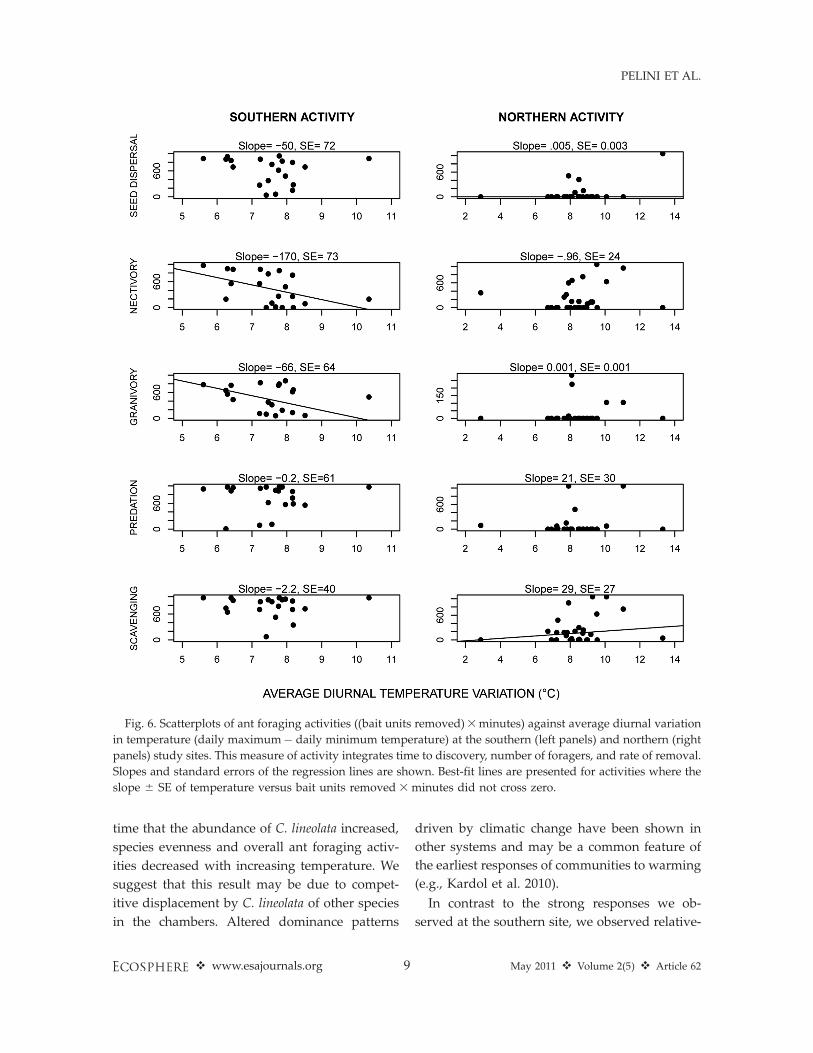
panels). Diurnal variation in temperature was
negatively associated with nectivory and grani-
vory at the southern site and weakly positively
associated with scavenging at the northern site
(Fig. 6).
DISCUSSION
Climatic change is expected to have differential
effects on ecological communities in different
geographic areas, but forecasts of climatic change
based on global or even large-scale regional
Fig. 3. Scatterplots of ant diversity measures (total ant abundance, species evenness (Hurlbert’s PIE), species
richness) against average temperature at the southern (left panels) and northern (right panels) study sites.
Symbol sizes for each replicate are proportional to the square root of abundance of the most common species at
each site (Crematogaster lineolata at the southern study site and Aphaenogaster rudis at the northern study site).
v www.esajournals.org 6 May 2011 v Volume 2(5) v Article 62
PELINI ET AL.
climatic patterns are unlikely to provide accurate
assessments of short-term, small-scale changes in
temperature, which ultimately regulates local ant
abundance, richness, and foraging activities
(Wehner et al. 1992, Cerda et al. 1997, Azcarate
et al. 2007, Chong and Lee 2009). Furthermore,
few studies have experimentally demonstrated
the effects of warming on communities simulta-
neously at different locales (but see Doak and
Morris 2010). Our experimental results suggest
that even modestly warmer average daytime
temperatures can have large impacts, some
mediated disproportionately by abundant spe-
cies, on ant communities at lower latitudes.
However, at higher latitudes, observed responses
were much weaker and in general they may be
slower than observed in other studies (cf.
Parmesan and Yohe 2003).
Fig. 4. Scatterplots of ant diversity measures (total ant abundance, species evenness (Hurlbert’s PIE), species
richness) plotted against average diurnal variation in temperature (daily maximum � daily minimum
temperature) at the southern (left panels) and northern (right panels) study sites.
v www.esajournals.org 7 May 2011 v Volume 2(5) v Article 62
PELINI ET AL.
At the more species-rich southern site, the
abundance of Crematogaster lineolata, the most
abundant species at that site, increased with
temperature. Warming may have resulted in
acceleration of successful brood production and
development, or C. lineolata may have moved
from cooler patches to the small islands of heat
formed by the treatment (Moise and Henry
2010). Both effects are likely to occur as increases
in mean temperatures create new thermal land-
scapes in which some, but not all, patches are
warmer than current conditions. At the same
Fig. 5. Scatterplots of ant foraging activities ((bait units removed) 3 minutes) against average temperature at
the southern (left panels) and northern (right panels) study sites. This measure of activity integrates time to
discovery, number of foragers, and rate of removal. Slopes and standard errors of the regression lines are shown.
Best-fit lines are presented for activities where the slope 6 SE of temperature versus bait units removed 3
minutes did not cross zero.
v www.esajournals.org 8 May 2011 v Volume 2(5) v Article 62
PELINI ET AL.
time that the abundance of C. lineolata increased,
species evenness and overall ant foraging activ-
ities decreased with increasing temperature. We
suggest that this result may be due to compet-
itive displacement by C. lineolata of other species
in the chambers. Altered dominance patterns
driven by climatic change have been shown in
other systems and may be a common feature of
the earliest responses of communities to warming
(e.g., Kardol et al. 2010).
In contrast to the strong responses we ob-
served at the southern site, we observed relative-
Fig. 6. Scatterplots of ant foraging activities ((bait units removed)3minutes) against average diurnal variation
in temperature (daily maximum� daily minimum temperature) at the southern (left panels) and northern (right
panels) study sites. This measure of activity integrates time to discovery, number of foragers, and rate of removal.
Slopes and standard errors of the regression lines are shown. Best-fit lines are presented for activities where the
slope 6 SE of temperature versus bait units removed 3 minutes did not cross zero.
v www.esajournals.org 9 May 2011 v Volume 2(5) v Article 62
PELINI ET AL.
ly weak responses at the northern site, eventhough foraging of colonies at the northern site islikely to be limited by cold temperatures (cf.Holldobler and Wilson 1990). Among communi-ty measures, only species evenness was associat-ed with temperature, reaching highest values atintermediate temperatures. These responses wereopposite of our initial predictions. It is possiblethat the overall low ant abundance at thenorthern site limits the ability to detect responses.Greater increases in temperature may be neededbefore the abundances of northern populationsincrease. Alternatively, it may be the case that thestructure and dynamics of more temperate antcommunities are not limited exclusively bytemperature. Several studies now exist in whichnorthern populations of insects do not experiencechanges in population sizes with warming (e.g.,Adler et al. 2007, Pelini et al. 2009).
The different responses of ant communities totemperature at our two study sites also could beassociated with other factors that co-vary withlatitude. Although the two study sites do sharemany ant species and occur in similar deciduousforests, they differ dramatically in ant abun-dance, diversity and foraging activity. Further-more, historical differences in climate,particularly temperature, and differences inseasonality may have been strong selectiveagents that constrain responses to temperature.For example, cold temperate species may havehigher thermal maxima relative to ambienttemperatures (Deutch et al.) such that species athigher latitudes have to be warmed more toexperience fitness consequences.
By manipulating temperature only duringspring and summer, we focused on the effectsof warming on rates of foraging, developmentand potentially mortality during the activeperiod of ants in the two regions and avoidedpotential confounding effects of warming onwinter survival. When ants are most active, theyrespond to warming by shifts in foraging (andfood intake) and/or shifts in development in theirpresent locations. At the hottest temperatures weobserved at the southern site, they may alsorespond through reduced activity or even mor-tality. Ants also may track environmental condi-tions by moving their colonies. Such a responseto climatic change is also seen in other animals(Moise and Henry 2010). Outside of the mini-
chambers at both sites, we have observedmultiple, within-season relocations of colonysites by Aphaenogaster rudis, and other studiesprovide similar evidence for the redistribution ofant colonies during a single season (Holldoblerand Wilson 1990, Foitzik et al. 2004, McGlynn etal. 2009, Lessard et al. 2010). Just as for birds andmammals, actual responses to climatic changeinevitably reflect a mix of behavioral responses towarming, such as local shifts in habitat use, anddemographic responses. A third possibility isthat individual foragers may move into treat-ments areas to forage. Future studies shouldconsider the effects of warming during coolerperiods on ant community composition andactivity.
As the climate changes, trophic cascades andecosystem processes dependent on ants are likelyto change in tandem. (Folgarait 1998, Petchey etal. 1999, Lensing and Wise 2006, Suttle et al. 2007,Barton et al. 2009, Harmon et al. 2009, O’Connoret al. 2009, Gilman et al. 2010, Traill et al. 2010).We found this to be the case at our southern site,where we observed decreases in rates of grani-vory, seed dispersal, and nectivory. Such changessuggest that ant responses to climatic changemay have cascading consequences for speciesdependent upon particular ants, such as ant-dispersed plants (Gove et al. 2007) or insectstended for honeydew in exchange for protectionby ants (Stadler and Dixon 2008). More detailed,long-term studies of the responses of ants toclimatic change, both observational and experi-mental, are needed to improve the forecasts ofthese changes.
ACKNOWLEDGMENTS
Funding was provided by a US DOE PER award(DE-FG02-08ER64510) to R.R. Dunn, A. M. Ellison, N.J. Gotelli and N. J. Sanders. We thank A. Koltz, M.VanScoy, I. Del Toro, S. Menke, C. Hirsch, J. Boudreau,R. Tizon, C. Hart, D. Rodriguez, J. Chandler and J.Trombley for field assistance and technical support.
LITERATURE CITED
Adler, L. S., P. De Valpine, J. Harte, and J. Call. 2007.Effects of long-term experimental warming onaphid density in the field. Journal of the KansasEntomological Society 80:156–168.
Azcarate, F. M., E. Kovacs, and B. Peco. 2007.Microclimatic conditions regulate surface activity
v www.esajournals.org 10 May 2011 v Volume 2(5) v Article 62
PELINI ET AL.
in harvester ants Messor barbarus. Journal of InsectBehavior 20:315–329.
Barton, B. T., A. P. Beckerman, and O. J. Schmitz. 2009.Climate warming strengthens indirect interactionsin an old-field food web. Ecology 90:2346–2351.
Cerda, X., J. Retana, and S. Cros. 1997. Thermaldisruption of transitive hierarchies in Mediterra-nean ant communities. Journal of Animal Ecology66:363–374.
Chong, K. F. and C. Y. Lee. 2009. Influences oftemperature, relative humidity and light intensityon the foraging activity of field populations of thelonglegged ant, Anoplolepis gracilipes (Hymenop-tera: Formicidae). Sociobiology 54:531–539.
Cottingham, K. L., J. T. Lennon, and B. L. Brown. 2005.Regression versus ANOVA: Response. Frontiers inEcology and the Environment 3:358–358.
Deutsch, C. A., J. J. Tewksbury, R. B. Huey, K. S.Sheldon, C. K. Ghalambor, D. C. Haak, and P. R.Martin. 2008. Impacts of climate warming onterrestrial ectotherms across latitude. Proceedingsof the National Academy of Sciences of the UnitedStates of America 105:6668–6672.
Dillon, M. E., G. Wang, and R. B. Huey. 2010. Globalmetabolic impacts of recent climate warming.Nature 467:704–706.
Doak, D. F., and W. F. Morris. 2010. Demographiccompensation and tipping points in climate-in-duced range shifts. Nature 467:959–962.
Dunn, R. R., C. R. Parker, M. Geraghty, and N. J.Sanders. 2007. Reproductive phenologies in adiverse temperate ant fauna. Ecological Entomolo-gy 32:135–142.
Dunn, R. R., et al. 2009. Climatic drivers of hemispher-ic asymmetry in global patterns of ant speciesrichness. Ecology Letters 12:324–333.
Fisher, B. L. 1998. Ant diversity patterns along anelevational gradient in the Reserve NaturelleIntegrale dAndringitra and on the western MasoalaPeninsula, Madagascar. Fieldiana (Zoology) 90:39–67.
Folgarait, P. J. 1998. Ant biodiversity and its relation-ship to ecosystem functioning: a review. Biodiver-sity and Conservation 7:1221–1244.
Foitzik, S., V. L. Backus, A. Trindl, and J. M. Herbers.2004. Ecology of Leptothorax ants: impact of food,nest sites, and social parasites. Behavioral Ecologyand Sociobiology 55:484–493.
Gilman, S. E., M. C. Urban, J. Tewksbury, G. W.Gilchrist, and R. D. Holt. 2010. A framework forcommunity interactions under climate change.Trends in Ecology & Evolution 25:325–331.
Gotelli, N. J., and G. L. Entsminger. 2011. EcoSim: Nullmodels software for ecology. Version 7.0. AcquiredIntelligence Inc. & Kesey-Bear. hhttp://homepages.together.net/;gentsmin/ecosim.htmi
Gove, A. D., J. D. Majer, and R. R. Dunn. 2007. A
keystone ant species promotes seed dispersal in a‘‘diffuse’’ mutualism. Oecologia 153:687–697.
Harmon, J. P., N. A. Moran, and A. R. Ives. 2009.Species response to environmental change: impactsof food web interactions and evolution. Science323:1347–1350.
Holldobler, B., and E. O. Wilson. 1990. The ants.Belknap Press, Cambridge, Massachusetts, USA.
Holway, D. A., A. V. Suarez, and T. J. Case. 2002. Roleof abiotic factors in governing susceptibility toinvasion: A test with Argentine ants. Ecology83:1610–1619.
Hurlbert, S. H. 1971. Nonconcept of species diversity:Critique and alternative parameters. Ecology52:577.
Inouye, B. D. 2001. Response surface experimentaldesigns for investigating interspecific competition.Ecology 82:2696–2706.
Jeanne, R. L. 1979. A latitudinal gradient in rates of antpredation. Ecology 60:1211–1224.
Kardol, P., C. E. Campany, L. Souza, R. J. Norby, J. F.Weltzin, and A. T. Classen. 2010. Climate changeeffects on plant biomass alter dominance patternsand community evenness in an experimental old-field ecosystem. Global Change Biology 16:2676–2687.
Kaspari, M., M. Yuan, and L. Alonso. 2003. Spatialgrain and the causes of regional diversity gradientsin ants. American Naturalist 161:459–477.
Lensing, J. R. and D. H. Wise. 2006. Predicted climatechange alters the indirect effect of predators on anecosystem process. Proceedings of the NationalAcademy of Sciences of the United States ofAmerica 103:15502–15505.
Lessard, J. P., T. E. Sackett, W. N. Reynolds, D. A.Fowler, and N. J. Sanders. 2010. Determinants ofthe detrital arthropod community structure: theeffects of temperature and resources along anenvironmental gradient. Oikos 120:333–343.
McGlynn, T. P., R. M. Fawcett, and D. A. Clark. 2009.Litter biomass and nutrient determinants of antdensity, nest size, and growth in a Costa Ricantropical wet forest. Biotropica 41:234–240.
Menendez, R., A. G. Megias, J. K. Hill, B. Braschler,S. G. Willis, Y. Collingham, R. Fox, D. B. Roy, andC. D. Thomas. 2006. Species richness changes lagbehind climate change. Proceedings of the RoyalSociety B-Biological Sciences 273:1465–1470.
Meyers, R. H., D. C. Montgomery, and C. M. Ander-son-Cook. 2009. Response surface methodology:process and product optimization using designedexperiments. Third edition. John Wiley & Sons,New York, USA.
Moise, E. R. D. and H. A. L. Henry. 2010. Like moths toa street lamp: exaggerated animal densities in plot-level global change field experiments. Oikos119:791–795.
v www.esajournals.org 11 May 2011 v Volume 2(5) v Article 62
PELINI ET AL.
O’Connor, M. I., M. F. Piehler, D. M. Leech, A. Anton,and J. F. Bruno. 2009. Warming and resourceavailability shift food web structure and metabo-lism. Plos Biology 7: e1000178.
Olsweski, T. D. 2004. A unified mathematical frame-work for the measurement of richness and even-ness within and among multiple communities.Oikos 104:377–387.
Parmesan, C. and G. Yohe. 2003. A globally coherentfingerprint of climate change impacts acrossnatural systems. Nature 421:37–42.
Pelini, S. L., J. D. K. Dzurisin, K. M. Prior, C. M.Williams, T. D. Marsico, B. J. Sinclair, and J. J.Hellmann. 2009. Translocation experiments withbutterflies reveal limits to enhancement of pole-ward populations under climate change. Proceed-ings of the National Academy of Sciences of theUnited States of America 106:11160–11165.
Pelini, S. L., F. P. Bowles, A. M. Ellison, N. J. Gotelli,N. J. Sanders, and R. Dunn. 2011. Heating up theforest: Open-top chamber warming manipulationof arthropod communities at Harvard and Dukeforests. Methods in Ecology and Evolution [doi: 10.1111/j.2041-210X.2011.00100.x]
Petchey, O. L., P. T. McPhearson, T. M. Casey, and P. J.Morin. 1999. Environmental warming alters food-web structure and ecosystem function. Nature402:69–72.
R Development Core Team. 2007. R: a language andenvironment for statistical computing. R Founda-tion for Statistical Computing, Vienna, Austria.
Ruano, F., A. Tinaut, and J. J. Soler. 2000. High surfacetemperatures select for individual foraging in ants.Behavioral Ecology 11:396–404.
Sanders, N. J., J. P. Lessard, M. C. Fitzpatrick, and R. R.Dunn. 2007. Temperature, but not productivity orgeometry, predicts elevational diversity gradientsin ants across spatial grains. Global Ecology andBiogeography 16:640–649.
Smallwood, J. 1982. Nest relocation in ants. InsectesSociaux 29:138–147.
Solomon, S. et al., editors. 2007. Contribution ofWorking Group I to the Fourth Assessment Reportof the Intergovernmental Panel on Climate Change.Cambridge University Press, New York, USA.
Stadler, B., and A. F. G. Dixon. 2008. Mutualism: Antsand their insect partners. Cambridge UniversityPress, Cambridge, UK.
Suttle, K. B., M. A. Thomsen, and M. E. Power. 2007.Species interactions reverse grassland responses tochanging climate. Science 315:640–642.
Tewksbury, J. J., R. B. Huey, and C. A. Deutsch. 2008.Ecology: Putting the heat on tropical animals.Science 320:1296–1297.
Traill, L. W., M. L. M. Lim, N. S. Sodhi, and C. J. A.Bradshaw. 2010. Mechanisms driving change:altered species interactions and ecosystem functionthrough global warming. Journal of Animal Ecol-ogy 79:937–947.
Wehner, R., A. C. Marsh, and S. Wehner. 1992. Desertants on a thermal tightrope. Nature 357:586–587.
Wilson, E. O. 1971. The insect societies. HarvardUniversity Press, Cambridge, Massachusetts, USA.
Wilson, R. J., D. Gutierrez, J. Gutierrez, and V. J.Monserrat. 2007. An elevational shift in butterflyspecies richness and composition accompanyingrecent climate change. Global Change Biology13:1873–1887.
Wittebolle, L., M. Marzorati, L. Clement, A. Balloi, D.Daffonchio, K. Heylen, P. De Vos, W. Verstraete,and N. Boon. 2009. Initial community evennessfavours functionality under selective stress. Nature458:623–626.
Wittman, S. E., N. J. Sanders, A. M. Ellison, E. S. Jules,J. S. Ratchford, and N. J. Gotelli. 2010. Speciesinteractions and thermal constraints on ant com-munity structure. Oikos 119:1056–1056.
Valone, T. J. and M. Kaspari. 2005. Interactionsbetween granivorous and omnivorous ants in adesert grassland: results from a long-term experi-ment. Ecological Entomology 30:116–121.
v www.esajournals.org 12 May 2011 v Volume 2(5) v Article 62