i EFFECTS OF SUPERMARKETS ON FRESH FRUIT AND VEGETABLES SMALL-SCALE FARMERS IN CENTRAL KENYA. CLARIS KARIMI RIUNGU A Thesis submitted to the Graduate School in partial fulfillment for the requirements of the Master of Science Degree in Agricultural and Applied Economics of Egerton University EGERTON UNIVERSITY APRIL, 2011
Transcript
i
EFFECTS OF SUPERMARKETS ON FRESH FRUIT AND VEGETABLES
SMALL-SCALE FARMERS IN CENTRAL KENYA.
CLARIS KARIMI RIUNGU
A Thesis submitted to the Graduate School in partial fulfillment for the requirements of
the Master of Science Degree in Agricultural and Applied Economics of Egerton University
EGERTON UNIVERSITY
APRIL, 2011
ii
iii
COPYRIGHT
No part of this thesis may be reproduced, stored, in any retrieval system or transmitted in any
form or by any means, electronic, mechanical, photocopying, and recording without prior written
permission of the author or Egerton University on that behalf.
1.1 Background Information ....................................................................................................... 1
1.2 Statement of the Problem ...................................................................................................... 2
1.3 Objective of the Study........................................................................................................... 3
1.4 Research Questions ............................................................................................................... 3
1.5 Justification of the study ....................................................................................................... 3
1.6 Limitation and Scope of the Study........................................................................................ 4
1.7 Definition of Terms............................................................................................................... 4CHAPTER TWO .......................................................................................................................... 5
LITERATURE REVIEW ............................................................................................................ 5
2.1 Trend of Supermarkets Revolution in Developing Countries............................................... 5
2.2 Diffusion Wave of Supermarkets in Developing Countries.................................................. 5
2.3 Evolution of Supermarket Procurement Systems ................................................................. 6
2.4 Expansion of Supermarkets in Kenya ................................................................................... 7
2.5 Supply Factors That Led To Spread of Supermarkets .......................................................... 9
2.6 Demand Factors That Led To Spread of Supermarkets ...................................................... 10
2.7 Effects of Expanding Supermarket Industry ....................................................................... 11
2.8 Supermarkets and Small-scale Farmers: Opportunities and Challenges for Small- scale Farmers...................................................................................................................................... 11
RESEARCH METHODOLOGY .............................................................................................. 18
3.1 Study Area........................................................................................................................... 18
3.2 Sources of Data ................................................................................................................... 18
3.3 Sampling Methods and Sample Size................................................................................... 18
3.4 Data Collection.................................................................................................................... 20
3.5 Data Analysis and Procedure .............................................................................................. 20CHAPTER FOUR....................................................................................................................... 22
RESULTS AND DISCUSSION ................................................................................................. 22
4.1 Characteristics of the farmer respondents ........................................................................... 224.1.1 Gender of the Farmer Respondents .............................................................................. 224.1.2 Age of the Farmer Respondents ................................................................................... 224.1.3 Level of Education........................................................................................................ 234.1.4 Land Tenure Systems ................................................................................................... 244.1.5 Land Holding Sizes ...................................................................................................... 254.1.6 Membership of Farmer Group...................................................................................... 254.1.7 Access to Extension Services ....................................................................................... 264.1.8 Accessibility to Credit .................................................................................................. 274.1.9 Ownership of Farm Machinery and Equipment ........................................................... 274.1.10 Types of Commodities Produced By Farmers............................................................ 28
4.2 Characteristics of Trader Respondents................................................................................ 29
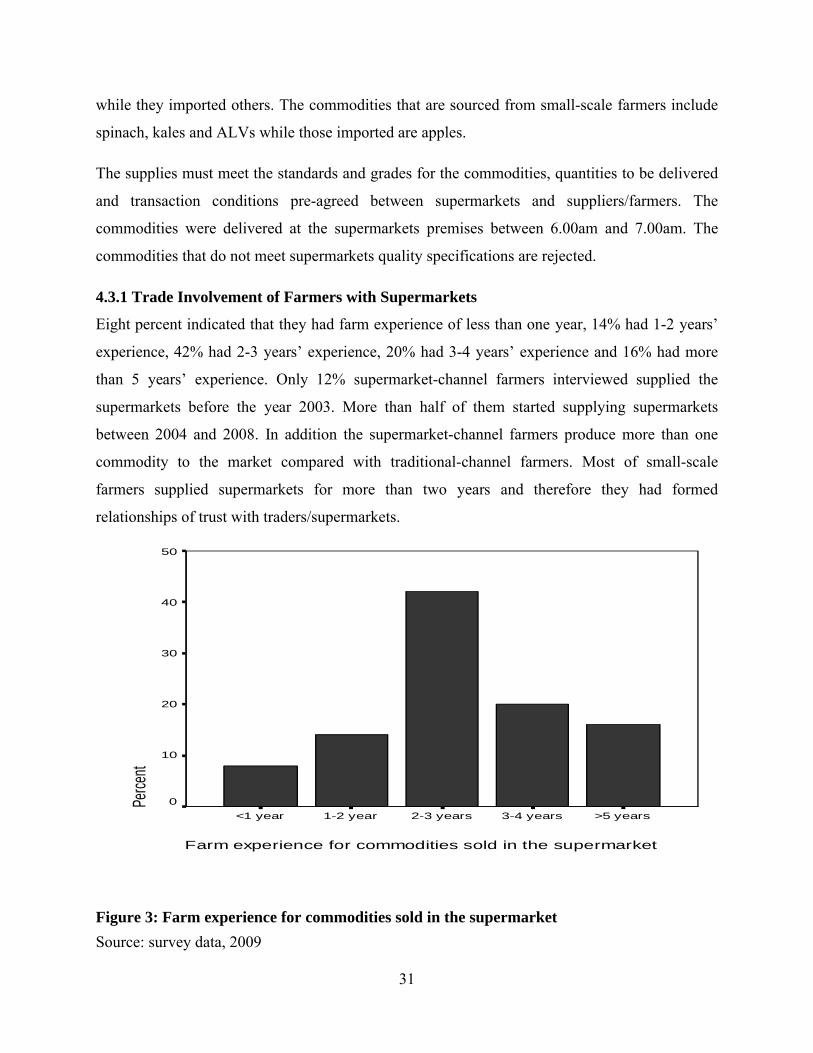
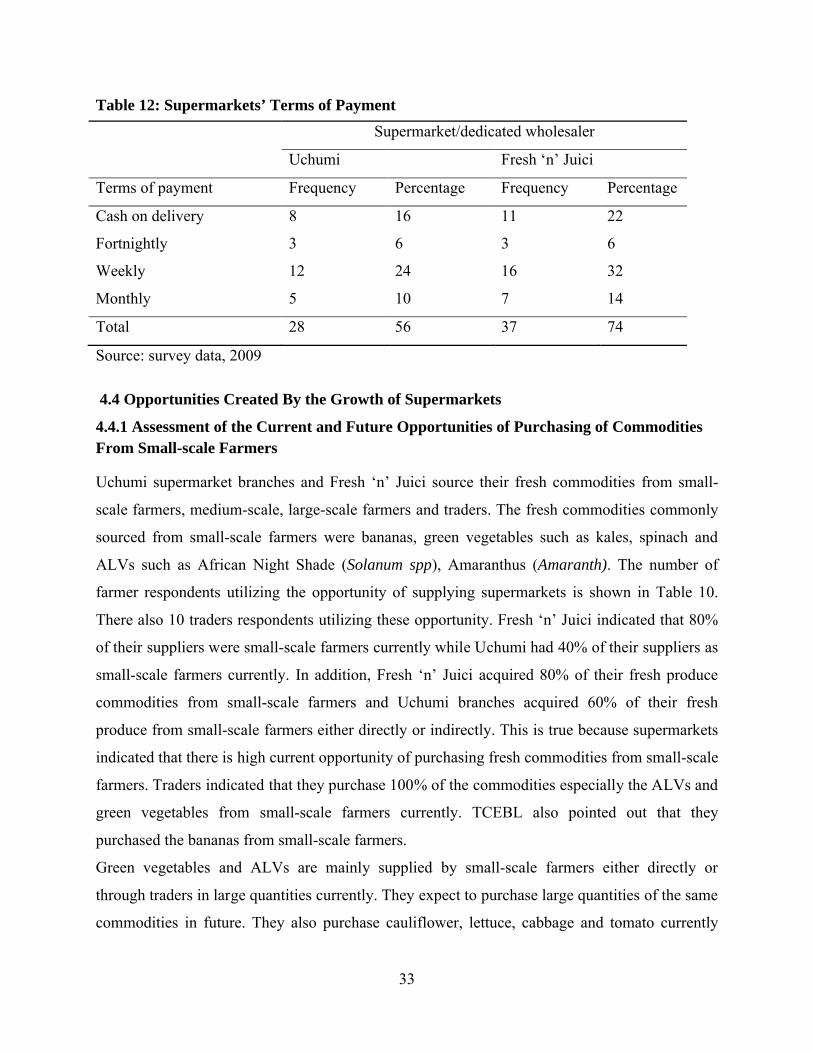
4.3 Procurement Systems of Supermarkets............................................................................... 304.3.1 Trade Involvement of Farmers with Supermarkets ...................................................... 314.3.2 Access to Information about Supermarkets.................................................................. 324.3.3 Supermarkets’ Terms of payment................................................................................. 32
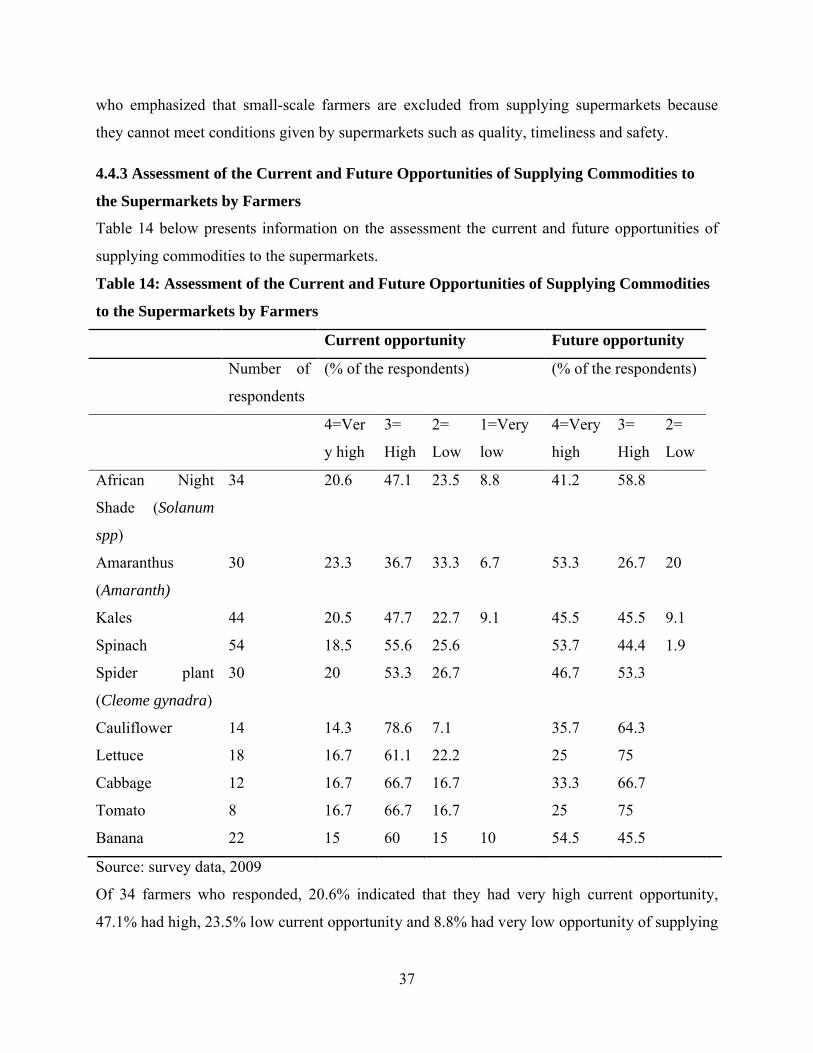
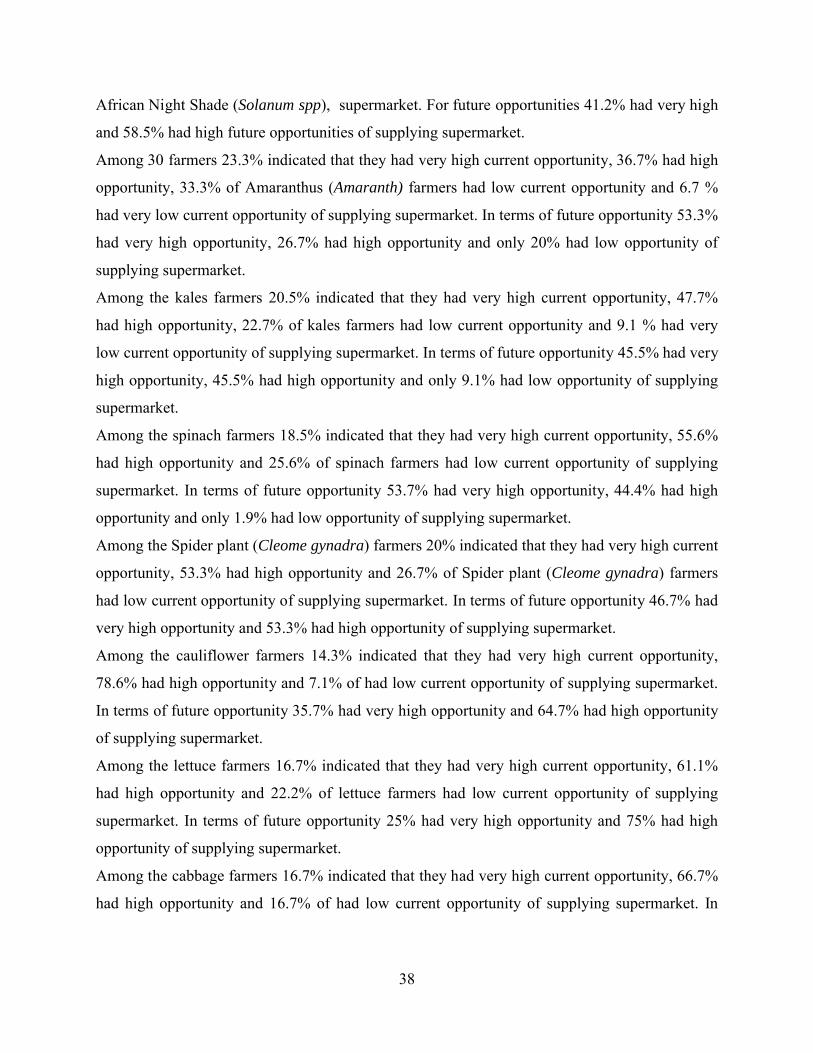
4.4 Opportunities Created By the Growth of Supermarkets ..................................................... 334.4.1 Assessment of the Current and Future Opportunities of Purchasing of Commodities From Small-scale Farmers..................................................................................................... 334.4.2 Assessment of the Current and Future Opportunities of Supplying Commodities to the Supermarkets By Traders ...................................................................................................... 344.4.3 Assessment of the Current and Future Opportunities of Supplying Commodities to the Supermarkets by Farmers ...................................................................................................... 37
ix
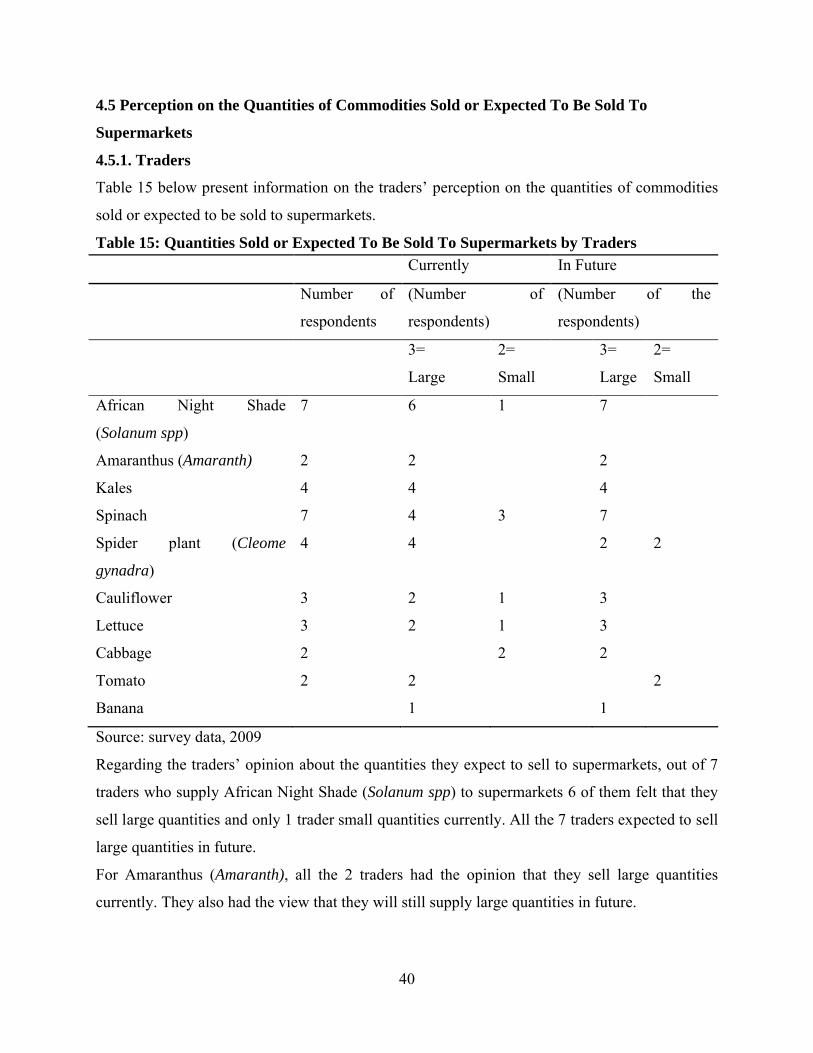
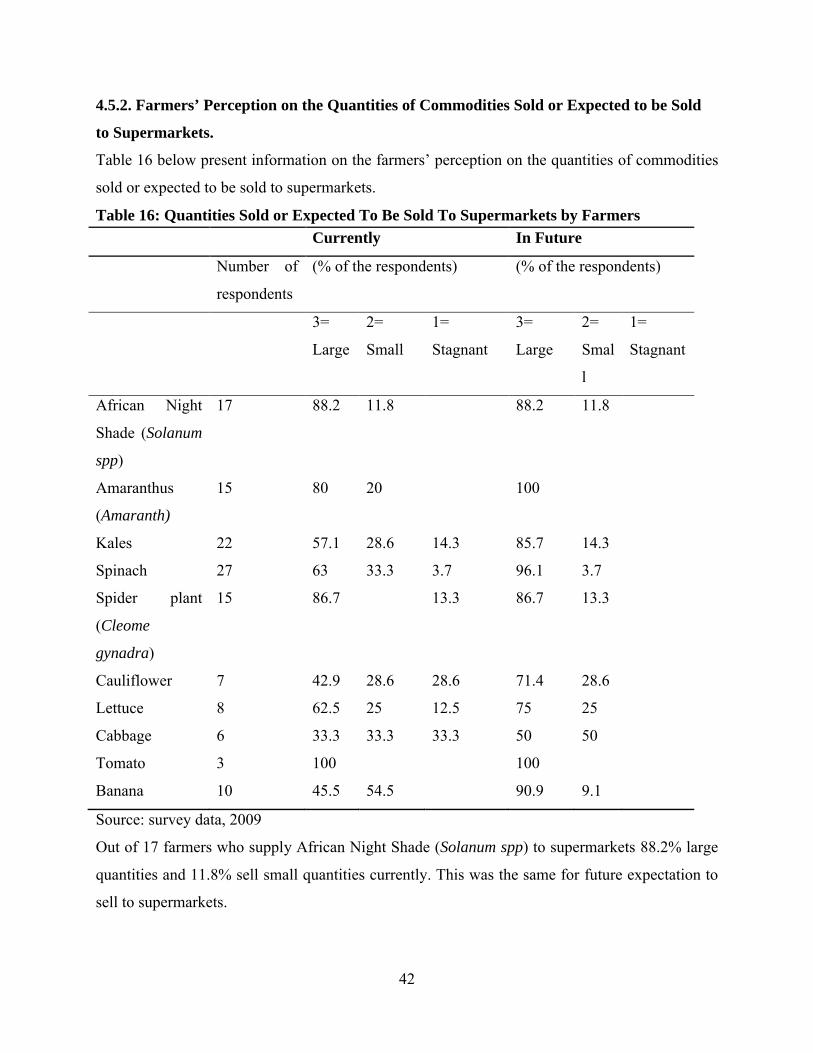
4.5 Perception on the Quantities of Commodities Sold or Expected To Be Sold To Supermarkets............................................................................................................................. 40
4.5.1. Traders ......................................................................................................................... 404.5.2. Farmers’ Perception on the Quantities of Commodities Sold or Expected to be Sold to Supermarkets. ........................................................................................................................ 42
4.6 Farmers’ Perception on the Ease of Selling Commodities to Supermarkets....................... 44
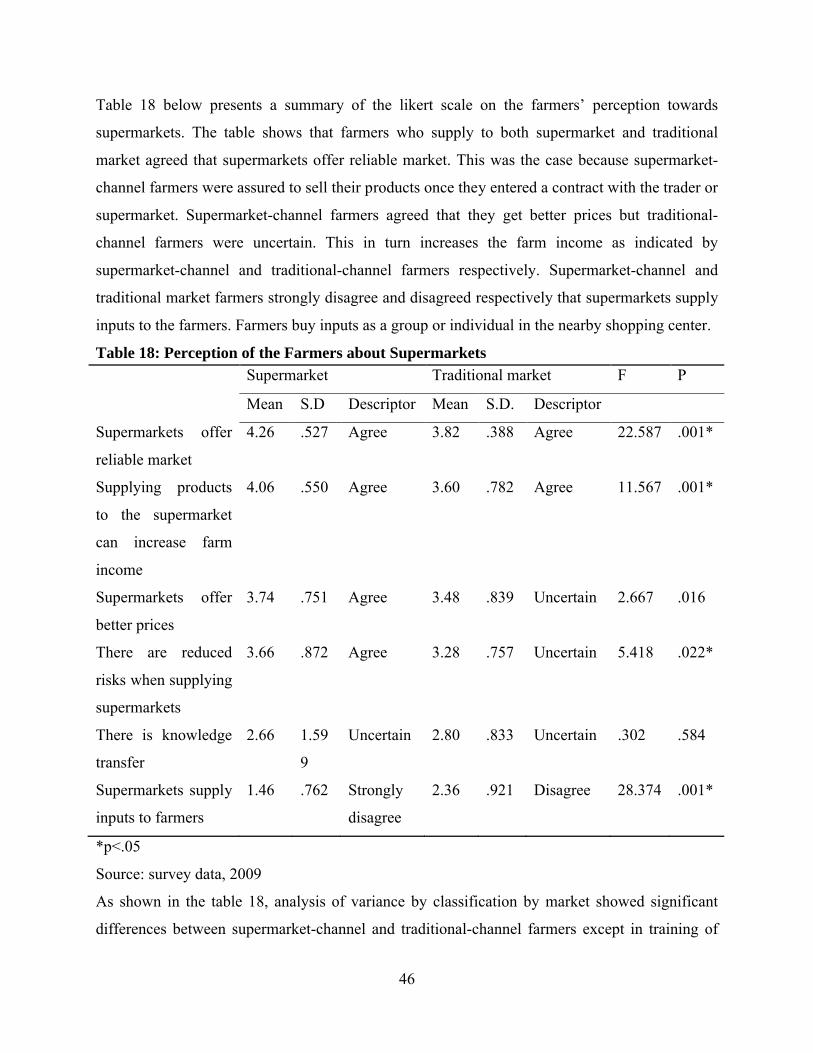
4.7 Perception of the Farmers about Supermarkets................................................................... 45
4.8 Strategies Used By Farmers Supplying Supermarket ......................................................... 47
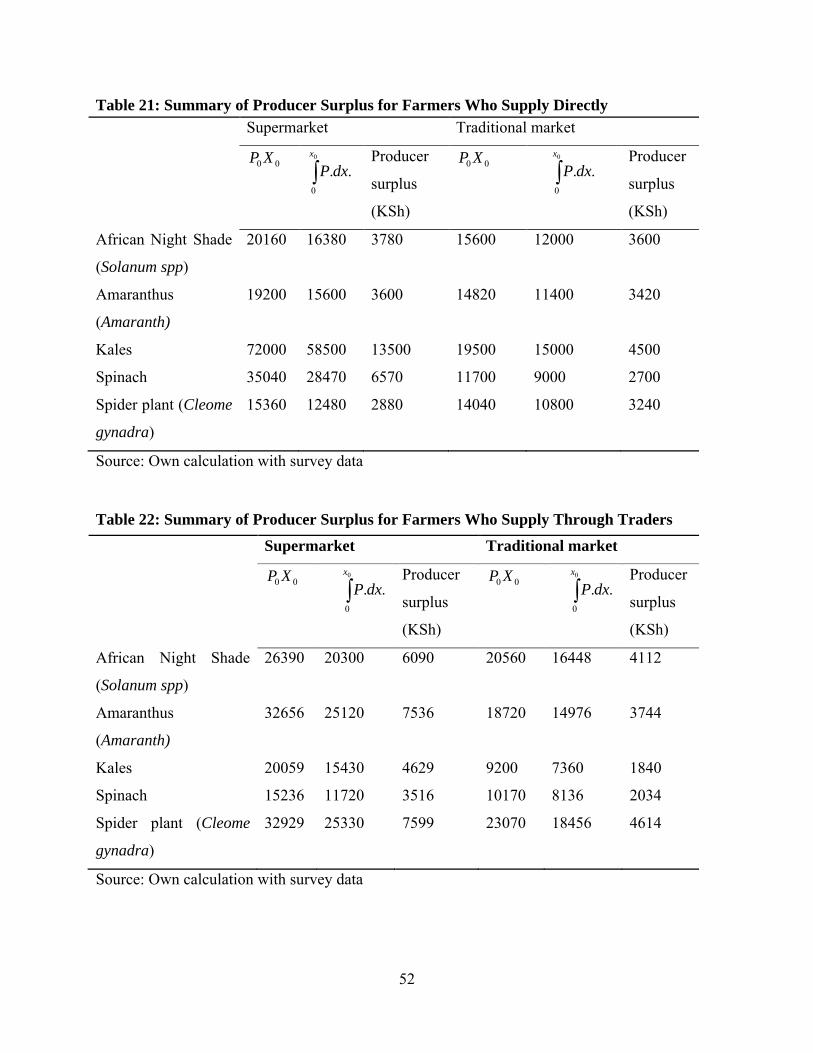
4.9 Economic benefits ............................................................................................................... 48CHAPTER FIVE ........................................................................................................................ 53
SUMMARY, CONCLUSION AND RECOMMENDATION................................................. 53
Figure 3: Farm experience for commodities sold in the supermarket .......................................... 31
xii
ACRONYMS AND ABBREVIATION
ALV African Leafy Vegetables
CMAAE Collaborative Masters in Agricultural and Applied Economics
FAO Food and Agriculture Organization of the United Nations
FDI Foreign Direct Investment
GAIN Global Agriculture Information Network
GoK Government of Kenya
IFPRI International Food Policy Research Institute
KSh Kenyan Shillings
USA United States of America
US$ United States Dollars
SC Supermarket Channel
TCBEL Tee Cee Banana Enterprises Limited
1
CHAPTER ONE
INTRODUCTION
1.1 Background Information
Supermarkets have been spreading very rapidly in developing countries for the past decade.
During the last years, the role of supermarkets in food distribution in developing countries has
increased. The rise in supermarkets was most significant in South Africa, Kenya and Nigeria
(Reardon et al., 2003). Kenya is the second advanced country in terms of presence of
supermarkets, after South Africa. The growth of supermarkets was 18-20% between 1993 and
2003 (Weatherspoon et al., 2007). Kenya’s advancement in supermarkets is evident in its top
five cities which are Nairobi, Mombasa, Nakuru, Eldoret, and Kisumu. Kenya had over 206
supermarkets and 10 hypermarkets in 2002 (Weatherspoon and Reardon 2002) which have
increased to 494 supermarkets and 17 hypermarkets in 2008 (GAIN, 2008). In Kenya the
majority of supermarkets are established in Nairobi, but due to further expansion, supermarkets
are now outside Nairobi. Supermarkets are being introduced in the medium-sized cities and
larger towns (Botha & Schalkwyk, 2007). Supermarkets in Kenya have spread beyond the
middle class into the food markets of the urban working poor which build the initial base.
Supermarkets in Kenya have also expanded to other countries within the East African region. For
example, Nakumatt is now operating in Rwanda in an attempt to broaden their annual turnover.
This pattern of first penetrating upper class urban market and then moving into lower income and
rural-town markets shows that there will be a steady and rapid increase in supermarkets in East
Africa and specifically Kenya (Weatherspoon and Reardon 2002).
The drivers of supermarkets growth are change of lifestyles, urbanization, policies that attract
FDI investment by most of developing countries, and growing economy with an average growth
rate of over 5% between 2004 and 2007 and market liberalization (Kamau, 2008). Kinsey (1999)
explains how households became more heterogeneous, becoming smaller and richer, and being
more likely to have a female household member in the labour force. Longer working hours,
diminishing leisure time, the greater role played by women in the work place and greater
availability of information have had a significant influence on the world’s food market place.
Other consumer considerations that have been brought about by information are concerns about
food safety and the impact of food production on the environment.
2
As noted by Neven and Reardon (2003), there were two market leaders in 2003 which were
Uchumi and Nakumatt supermarkets, which together controlled nearly 50% of the supermarket
sector. However, after the collapse of Uchumi, Nakumatt and Tuskys are now the leading retail
market (GAIN, 2008). Nakumatt is now the market leader and it has opened its stores in East and
Central Africa, Tuskys is second, Uchumi is the third while Ukwala now ranks as fourth in the
retail market. Metro Cash & Carry made an exit in 2005. These modern supermarkets continue to
play an important role in transforming Kenya’s food distribution system by offering high-quality
services such as bookstores, banking services, and fresh agricultural produce section, bakeries.
Supermarkets buy three times more produce from local farmers than Kenya exports to the rest of
the world (FAO, 2003). Supermarkets already account for around 5-12 percent of food sold in
Kenya and the government is aiming at increasing it to 30 percent by 2012 (Government of
Kenya, 2008). Supermarkets have their suppliers which are; preferred list supplier-farmers,
specialized wholesalers dedicated to sourcing from farmers and wholesale markets. However, the
selection of suppliers by supermarkets is influenced by factors such as traceability, feasibility,
potential for production in terms of quantity and quality, prices, proximity, and reliability which
tend to raise concern about the exclusion of small-scale producers. Also, supermarkets seek a
steady year-round supply and reliable deliveries (Hernandez et al., 2006).
In Kenya, most of the supermarket-channel farmers are located in favorable fresh produce zones
within a radius of 100km around Nairobi (Neven et al., 2005). The small-scale farmers use
supermarket supply channels especially in fresh produce, since it can be direct marketed to
supermarkets by producers. Neven, focusing on Uchumi and Nakumatt supermarkets noted that
25 percent of the supermarket-channel farmers are small-scale producers.
1.2 Statement of the Problem
Supermarkets have been increasing tremendously since 2003 and thus competition has increased.
To survive and make profits in a competitive environment, each firm must deliver a distinct
advantage to its customers. Each supermarket has developed its distinct competitive strategies
and procurement approaches. Growth in supermarket business has involved increase in the
variety of products offered for sale, including agricultural produce. Supermarket businesses are
expected to have effects on farmers, and specifically agricultural farmers in the form of increased
3
market opportunities and economic benefits. How these agricultural producers have responded to
these opportunities and the strategies that enable them effectively exploit the potential is not
clear.
1.3 Objective of the Study
The main objective of this study was to examine the effects of supermarkets on small-scale
farmers.
The specific objectives were;
1. To identify opportunities created by the growth of the supermarkets.
2. To identify the strategies applied by small scale farmers to effectively exploit the
potential created by the supermarkets.
3. To determine the economic benefits brought about by the growth of the supermarkets on
small scale farmers.
1.4 Research Questions
1. What are the opportunities created by the growth of supermarkets?
2. What are the strategies that are employed by the small-scale farmers to effectively exploit
the potential created by the supermarkets?
3. Are there differences in economic benefits between small-scale farmers marketing
through the supermarkets and those using alternative channels?
1.5 Justification of the study
The rapid growth of supermarkets in Kenya has widened the market for commodities produced
locally. This implies that unless the smallholder farmers perceive it as an opportunity, they will
not be able to supply these commodities. This study generated information on opportunities
created by supermarkets. This study has also provided the strategies employed so as to supply
supermarkets. Supermarkets provide a stable and dependable market for farmers' produce which
boost self-employment for farmers in the study area. In addition, this research has also provided
a recommendation on how the farmers can network together so as to give them more links to
supermarkets. The results generated will also contribute in policy making by ensuring that
enabling policies are enacted to support the smallholder farmers by integrating them hence
improving supply chain by 2030. This will in turn strengthen the chains between producers,
4
retailers and consumers and increase market share of products sold through formal channels like
supermarkets.
1.6 Limitation and Scope of the Study
This study focused on selected three leading supermarkets in Nairobi which have 80% of the
total supermarket share. The study was confined to getting information from smallholder farmers
who supply to both supermarkets and traditional markets, in a small geographical area in the
peri-urban; the results may not apply to others. This study focused mainly on opportunities
created by growth of supermarkets and economic benefits to farmers supplying supermarkets.
Peri-urban small-scale farmers, wholesalers, traditional markets and supermarkets that make up
the agricultural supply chain formed the target population. The study restricted itself to fresh
produce which are commodities that the small-scale farmers directly supply to both supermarkets
and traditional markets. The study was restricted to smallholder farmers who sell to supermarket
and traditional markets. The farmers were selected from peri-urban areas. The conclusions drawn
from the analysis of the effects of the leading three supermarkets may not be valid to other parts
of the country.
1.7 Definition of Terms
Small-scale farmers: Farmers whose landholding is less than 2 Hectares (5 acres).
Supermarket: This is a self-service store offering a wide variety food items and household
merchandise, organized into departments with a selling area of at least 150m2. It is headed by
board of directors.
Traditional markets: These are other marketing channels other than supermarkets. They
include the open-air market, kiosks and others.
Fresh vegetables: These include vegetables for example, cabbages, spinach, African Leafy
Vegetables, Asian vegetables, tomatoes, and others.
Supermarket-channel: This is a channel whereby a farmers supply their commodities to
supermarket either directly or indirectly.
Traditional-channel: This is a channel whereby farmers supply their commodities to the
traditional market either directly or indirectly.
5
CHAPTER TWO
LITERATURE REVIEW
2.1 Trend of Supermarkets Revolution in Developing Countries
Hagen (2003) highlighted that retail modernization can either have positive or negative
consequences for some traditional retailers, producers, and distributors. Traditionally,
supermarkets were viewed as markets for rich consumers. For a long time, they were only found
in large cities of the developed world and middle-income countries. However, urbanization and
increasing incomes in the developing world, including the Sub-Saharan Africa (SSA), have
inevitably invited supermarkets into the region. Supermarkets have been spreading rapidly in the
East and Southern African region since the early 1990s. The development of these supermarkets
has taken place in three stages as it appeared in the Latin America and East Asia scenarios ten
years earlier. These three stages are discussed below:
The first stage is the development of supermarkets in ‘richest’ country within the region. The
second stage involves the flow of FDI from the rich country, leading to the establishment of
supermarkets in poorer countries within the region. The third is the extension of the
supermarkets into poor neighborhoods of large cities and towns in all the countries.
In East and Southern Africa, South Africa continues to play the major role in the spread of
supermarkets in the region (Weatherspoon and Reardon 2002). The FDI from South Africa,
which is the richest country in the region, is the major driving force in the rapid proliferation of
supermarkets across East and Southern Africa. Thus, supermarkets started in upper-income
niches in large cities of South Africa and then spread into middle-class and then poorer consumer
markets, and from large cities to secondary cities to towns within South Africa. Supermarkets
then spread from South Africa to ‘poorer’ and less urbanized countries, like Kenya, Malawi,
Zambia, and Mozambique. In Kenya, supermarkets are now slowly spreading to secondary cities
and small towns (Neven & Reardon, 2003).
2.2 Diffusion Wave of Supermarkets in Developing Countries
Reardon et al., (2002) noted the diffusion rates have varied over regions and they are
characterized by four waves which are discussed below:
6
The first wave started small in the early-to-mid-1990s and had built to a major force in retail by
the end of the 1990s in South America, East Asia outside China and Japan, Northern-Central
Europe, and South Africa.
The second-wave countries include parts of Southeast Asia and Central America, Mexico, and
Southern-Central Europe, where the share went from circa 5 to 10 percent in 1990 to 30 to 50
percent by the early 2000s, with the takeoff occurring in the mid-to-late 1990s.
The third-wave countries include countries where the supermarket revolution takeoff started only
in the late 1990s or early 2000s, reaching about 10 to 20 percent of national food retail by 2003.
They include some countries in Central and South America (such as Nicaragua, Peru, and
Bolivia), Southeast Asia (such as Vietnam), China, India, and Russia.
The fourth wave has just started in Mozambique, Tanzania, Uganda and Angola.
According to Swinnen et al (2004) diffusion occurs at differential rates over inter-country space.
Diffusion also occurs at different rates over the space within a country and over socioeconomic
strata. The diffusion path is from large to middle to small cities and then even to rural towns, and
from upper to middle class and then even to the poor. Sub-Saharan Africa presents a very diverse
picture, with only one country, that is South Africa, firmly in the first wave of supermarket
penetration, but the rest of the countries are either in the early phase of the third wave takeoff of
diffusion or in fourth wave. Kenya, Zambia, and Zimbabwe are in the early phase of the third
wave and have substantial numbers of supermarkets, initiated by both domestic investment and
FDI from South Africa (Reardon et al., 2003). In South Africa and Kenya, supermarkets have
spread beyond the middle class into the food markets of the urban working poor.
2.3 Evolution of Supermarket Procurement Systems
Many studies such as Weatherspoon et al., (2002), Neven et al., (2003) and Reardon et al.,
(2003a) have concluded that expansion of supermarkets have led to continuous and rapid change
in procurement systems in the supermarket sector in developing countries. The supermarkets
choose farmers and wholesalers as well as influence the incentives facing and capacities of
farmers regarding participation in the supermarket market channel. However, procurement
system change has occurred at sharply different rates over chains in every country, with the three
to four leading chains undertaking the lion’s share of the procurement innovations.
7
As supermarket diffusion occurs, the situation reverses, and farmers face a food market
dominated by leading supermarket chains that have or are modernizing their procurement
systems in ways described below. The patterns of technological, organizational, and institutional
innovation observed can be described as the “four pillars” of procurement system change
(Berdegué et al., 2005; Reardon et al., 2003):
The first is a trend toward centralizing procurement, from a fragmented per-store procurement
system to distribution centers serving several stores. The second rests on supermarkets
increasingly working with specialized wholesalers that can meet their specific needs, thereby
transforming the traditional wholesale system. The third is a shift from spot markets to preferred
suppliers with implicit contracts, which serve as incentives to suppliers to work with the buyer
on a continuing basis. Finally, the fourth is the rapid implementation of quality and safety
standards of food products by supermarkets and large-scale food manufacturers. These private
standards work as instruments of coordination in the supply chain. Such standards can lower
transaction costs, ensure that consumers’ demands are met and reinforce the notion that products
are superior in quality to that of competitors.
Although the rise of supermarkets may raise returns for small-scale farmers by expanding market
size, it also creates several challenges. To stay competitive, farmers must invest in logistics and
quality improvements to meet the requirements of supermarkets’ procurement systems. This
trend of centralization results in a decrease in procurement from and support of regional/local
economies, through local agricultural producers, local suppliers, local institutions and local
consumers (Senauer and Goetz, 2003).
2.4 Expansion of Supermarkets in Kenya
In East Africa, Kenya is the most advanced in terms of presence of supermarkets. Kenya’s
advancement in supermarkets is evident from the fact that its top five cities which are Nairobi,
Mombasa, Nakuru, Eldoret, and Kisumu have supermarkets (Weatherspoon and Reardon 2002).
The Kenyan supermarket sector is composed of five domestic chains: Nakumatt, Tuskys,
Uchumi Ukwala and Naivas in descending order of size (GAIN, 2007 & GAIN, 2008). It was
noted that the majority of supermarkets are in Nairobi. However, about one-quarter of the
supermarkets is already outside Nairobi but it is projected that they are still expanding to major
8
towns. These major towns include Mombasa, Nakuru, Eldoret, Kisumu, Kisii, Meru and other
small towns (Neven and Reardon, 2003).
Over the years, Kenyan retail food sector has been dominated by two major supermarkets
namely Uchumi and Nakumatt (Neven & Reardon, 2004). Both chains reportedly had a
combined market share of 70 per cent. The other 30 per cent was shared between second tier and
independent stores such as Tusker Mattresses (now Tuskys), Ukwala Supermarkets, Skymart,
and Woolmart (Neven et al., 2003). However, this has changed over time. The sector has
experienced rapid growth both in sales volume and number of retail outlets opened countrywide.
The market has also experienced dynamic shifts in customer and brand loyalty. This was as a
result of competitive pricing, comprehensive product range and introduction of non-traditional
conveniences such as pharmacies, bookstores, automated teller machines, and delicatessens,
fresh produce section, bakeries and even in-store restaurants (GAIN, 2006). As a result of the
rapid growth, some of the less competitive supermarkets such as Metro Cash and Carry (South
African) have closed. In addition, local Kenyan supermarkets have become strong enough to
make it difficult for foreign competitors to get into the market.
According to Gain Report 2008, the following are the main supermarkets in Kenya:
Nakumatt: This is a privately owned entity that is at the moment the leading and largest
supermarket chain in Kenya. It has over 20 outlets strategically situated around the country in
major cities like in Nairobi, Mombasa, Kisumu, Meru, Kisii and Eldoret town with annual sales
of US$350 million in 2007. There are 10 outlets in Nairobi.
Tuskys: This is a family owned business that targets the middle and low-income consumers. It
has 14 outlets with 7 in Nairobi, 2 in Nakuru, 1 each in Eldoret, Meru, Athi River and Ongata
Rongai with annual sales of US$ 193 million in 2007.
Uchumi: (Swahili for Economy) was once the largest and most popular chain in the country, and
with it a very strong retail heritage. However, the supermarket’s popularity and size has waned
since the October 30, 2001 earnings announcement of a 68 per cent decline which precipitated a
downward spiral. A rescue campaign by the government eventually saw various groups and
individuals come together to help revive the once robust Uchumi. The chain has since reopened
most of its branches. It has 15 outlets with 10 in Nairobi, 1 each in Eldoret, Nakuru, Meru, Athi
River and Ongata Rongai with annual sales of US$ 104 million in 2007.
9
Ukwala: This is family owned businesses which like Tuskys, targets the middle and low-income
consumers. In total the chain store has 12 outlets, 5 in Nairobi, 3 in Eldoret and 1 in Nakuru with
annual sales of US$ 120 million in 2007.
Naivas: This is owned by Naivasha stores. It is relatively young but it is emerging to become one
of the major players in the fiercely competitive retail business sector in Kenya. They have seven
stores all over the country so far and great potential for further growth.
Chandarana is an independent store which is locally owned. It has 4 outlets which are within
Nairobi area.
According to GAIN, 2008, the four major supermarket chains which include Nakumatt, Tuskys,
Uchumi, and Ukwala account for 80 percent of the total supermarket market share. Therefore the
first three supermarkets will be used for this study because they constitute of the largest share of
the supermarket. In addition, they offer high quality market services such as fresh produce
section, bakeries, bookstores, and pharmacies. The location of branches in strategic places
encompassing a good catchment area combined with long operating hours including weekends
and public holidays allows everyone especially the working person the convenience to shop.
Three Nakumatt stores and one Tuskys stores open 24 hours, Uchumi has extended operations in
some of its stores till 10.00 pm, other Tuskys branches and other supermarkets close at 8.30 pm
after opening at 8.30 am.
2.5 Supply Factors That Led To Spread of Supermarkets
According to Weatherspoon et al., (2002), there are three main supply factors that led to spread
of supermarkets. The liberalization of most African countries’ markets was one of the factors.
FDI was crucial for the takeoff of supermarkets. Changes and improved political stability in
various African countries including Kenya also contributed to more favorable investment
opportunities. The 1990’s liberalizing international investment policies and the appropriate
timing thereof created an enabling environment for expansion of supermarkets. Changes in
political conditions also contribute to change in capacity and incentive for FDI to or from certain
countries.
The second factor was the revolution of retail procurement logistics technology and inventory
management in the 1990s. This was the use of computers for inventory control and supplier-
10
retailer coordination. That dramatically reduced costs, allowing supermarkets to extend beyond
high-price luxury niches in the markets to penetrate the mass market for food.
The third factor is the innovation by domestic supermarkets which has led to centralization of
procurement and consolidating distribution in order to cut costs hence increasing profits for
supermarkets. For this reason the supermarkets have been able to reduce prices to consumers of
essential food products.
2.6 Demand Factors That Led To Spread of Supermarkets
According to Weatherspoon et al., (2002) and Kinsey, (1999), the demand factors that drive the
diffusion of supermarkets are urbanization where there are more women who are entering into
the workforce outside their homes and increased opportunity costs of women’s time and their
incentive to seek shopping convenience. In Kenya particularly, Nyoro, (2004) indicated that
there are more women in gainful employment in the formal and informal sectors. There is
increased demand for food in the supermarkets with rise per capita incomes. There is reduction
of transaction costs through access or acquisition of private or collective capital that reduce the
cost to access supermarkets e.g. ownership of refrigerators, growing access to cars and public
transport (Chen et al., 2005 and Reardon et al., 2003).
The evolving consumer trends such as population demographics and globalization has also led to
spread of supermarkets. Consumers have become more health conscious hence they take into
consideration food safety and the impact of food production on the environment. According to
Hughes (2004), the population has become more educated and informed household numbers are
increasing as household size decreases and increasing numbers of women participate in the
labour force, resulting in dual-income households. These factors have led to a demand for more
convenient and high quality food. The demand has become highly sophisticated and shifted
towards added convenience and specific broadened choices. The demand for new foods, new
ingredients and high taste profiles are consequences of demographic and lifestyle changes. Lord,
(2005) also identified household income increase has led for demand for convenience.
According to Tschirley (2007), changing demand incentives are characterized by the current
urbanization and general westernization trend of the African population. Hagen (2002) confirms
that trends such as industrialization in developing countries increase consumers’ dependency on
11
supermarket services. Longer working hours, diminishing leisure time, the greater role played by
women in the work place and greater availability of information have had a significant influence
on the world’s food market place.
Hughes (2004) explains that, on a smaller scale, increasing numbers of people in developing
countries are relocating to urban areas. The main reason for doing this is their search for more
and better educational and employment opportunities. There is change in consumer
demographics have been caused by a greater number of women becoming economically active.
2.7 Effects of Expanding Supermarket Industry
The rapid spread of supermarkets is driving many traditional food retailers, such as small corner
stores and public market places out of business (Reardon et al, 2003). Traditional food retail
outlets face serious competition from supermarkets mainly because of their low-price appeal to
consumers (Henson et al, 2005). Martens et al. (2005) stated that shoppers shop at traditional
markets less often as they shift some of their purchases to supermarkets, and that this shift is
moving sales from small markets to larger ones which are supermarkets and forcing small
grocers to close.
Hagen (2003) argues that supermarkets are more buyer-driven as opposed to producer-driven
supply chains or value chains. They have sophisticated forms of coordination and integration,
and rules of participation.
2.8 Supermarkets and Small-scale Farmers: Opportunities and Challenges for Small- scaleFarmersThe growth of supermarkets offers opportunities as well as challenges to small-scale producers.
This is an opportunity because there is a scope to increase their revenue if they produce and
supply to the supermarkets (Kirsten & Emongor, 2006). They also indicated that in Zambia,
small-scale farmers negotiate contracts and supply the supermarkets. They may supply fresh
produce directly to the supermarkets or to the distributing centre of each store. In South Africa,
local procurement with small farmers triggers benefits in terms of freshness of vegetable produce
with an acceptable quality level and low transportation cost (Louw et al, 2008). He also indicated
that farmers form groups to jointly market outputs hence reducing transaction costs and
increasing negotiation power. There are other benefits which include loans, investments in
12
farming assets, improved technical knowledge, improved fresh quality produce and higher yields
hence high income (Vermeulen & Bienabe, 2008)
For small-scale producers and dairy farmers in developing countries, who usually deliver their
goods directly to open markets or to local wholesalers, dealing with the procurement system of a
supermarket chain can be a painful shock (Balsevich et al, 2003). If they succeeded in growing
the goods demanded, the supermarket procurement officers might reject a high percentage of
produce as being of low quality. For goods that are accepted, payment may often be delayed up
to 60 days after product delivery which is too long for many small farmers to wait. The farmers
also find it difficult to meet the increasing demand for certification that the goods were produced
using sustainable farming practices and strict labor standards. By imposing tough new quality
standards for dairy products while also lowering costs, supermarkets in Latin America increased
the demand for milk and yoghurt during the 1990s( Vorley, 2004).
Supermarkets have adversely affected smallholder farmers who cannot cope up with stringent
requirements for quality, quantity, consistency, and safety standards (Neven and Reardon, 2004;
Balsevich et al., 2003; Weatherspoon and Reardon, 2003; and Reardon and Berdegué, 2002).
According to Reardon and Neven (2004) the rise of supermarkets in Kenya gave rise to a new
group of small-scale and medium-sized farms managed by well-educated farmers. They focused
on kale and on the two leading supermarkets and showed that supermarket-channel farmers have
the capacity to supply larger volumes year round and have transportation vehicles, an irrigation
system, a packing shed, a cellular phone which are the capital which farmers must have in order
to access supermarkets. While most traditional-channel kale farmers sell to brokers and get a
price that lets them break-even at best, supermarket-channel farmers have a 40% gross profit
margin (Neven et al., 2005). These margins and lower market risks in the supermarket channel
have resulted in a strong growth dynamic of supermarket-channel farmers which have doubled
the size of their operations over the last five years. There is need for infrastructure to comply
with service and logistical requirements, such as delivery trucks, computer and Internet access
for product orders (Mainville 2004). However, there is a need for a study to find out if the above
still holds after the supermarkets situation changed in Kenya.
The selection of suppliers by supermarkets is influenced by factors such as traceability,
feasibility, and potential for production in terms of quantity and quality, prices, proximity, and
13
reliability. Concerns are based on the efforts of fresh produce procurement managers to provide
consumers with a stable, year-round supply of safe, high quality produce at competitive prices.
Smallholder farmers are challenged and are unable to remain on preferred supplier lists on a
sustained basis. Preferred suppliers differ among supermarkets. For instance; Nakumatt prefers
to be supplied by its subsidiary company while medium sized supermarkets prefer to use brokers
(Vorley et al, 2004 & Tschirley, 2007). This study will focus on whether this has changed after
the supermarkets have grown greatly.
Makoka, (2005) indicated that supermarkets in Malawi offer great opportunities for local
producer and small supplies to broaden their markets and increase their incomes. However, they
faced several challenges like meeting supermarkets requirements. The supermarket supply
channel farmers deliver their products at the backdoor of the supermarkets. He also indicated that
suppliers supplying the supermarkets procure the products from small-scale farmers within their
neighborhood.
Roe et al. (2005) acknowledges that the rapid adjustment in the food marketing chain associated
with the growth of supermarkets has raised concern about the plight of smaller, traditional
farmers who cannot meet the more demanding market channel standards, and therefore become
the “loser farmers”. These farmers will typically supply local, more traditional retail outlets.
There are certain noteworthy benefits for the “winning farmers”, such as higher prices and more
markets.
2.9 Farmers’ Perception
According to Smith (1994), marketing mechanisms lead to relationship between producer and
retailer. He indicated that farmers’ perception is influenced by their current knowledge about a
market. There is also a relationship between distance and market awareness. The farther the
market, the less interesting it is to the farmers as they pose additional transportation costs. There
is evidence that seasonality and perishability of commodities contribute to market choice. Highly
perishable commodities are sold to nearby market which the farmers can rely on. Price variation
was noted by Schulz (1964). When given a hypothetical choice between two markets with a clear
price variation, price was seen as significant. The structure of the market is also important. Thus
one large organized outlet is generally favoured over series of scattered markets with irregular
demand schedules. Farmers’ perception of a market is important in influencing marketing
14
decisions. Studies such as Neven et al., (200) analysed farmers’ or farm characteristics as they
affect farmer’s choice on a market. However, less attention has been given to farmers’ perception
on supermarkets attributes and opportunities opening through supermarkets. Therefore, this study
analysed farmers’ perception about supermarkets. These marketing decisions are influenced by
factors such as distance, prices, reliability of the market, transportation costs, perishability of
commodities, farm size, years of farm experience and terms of payment.
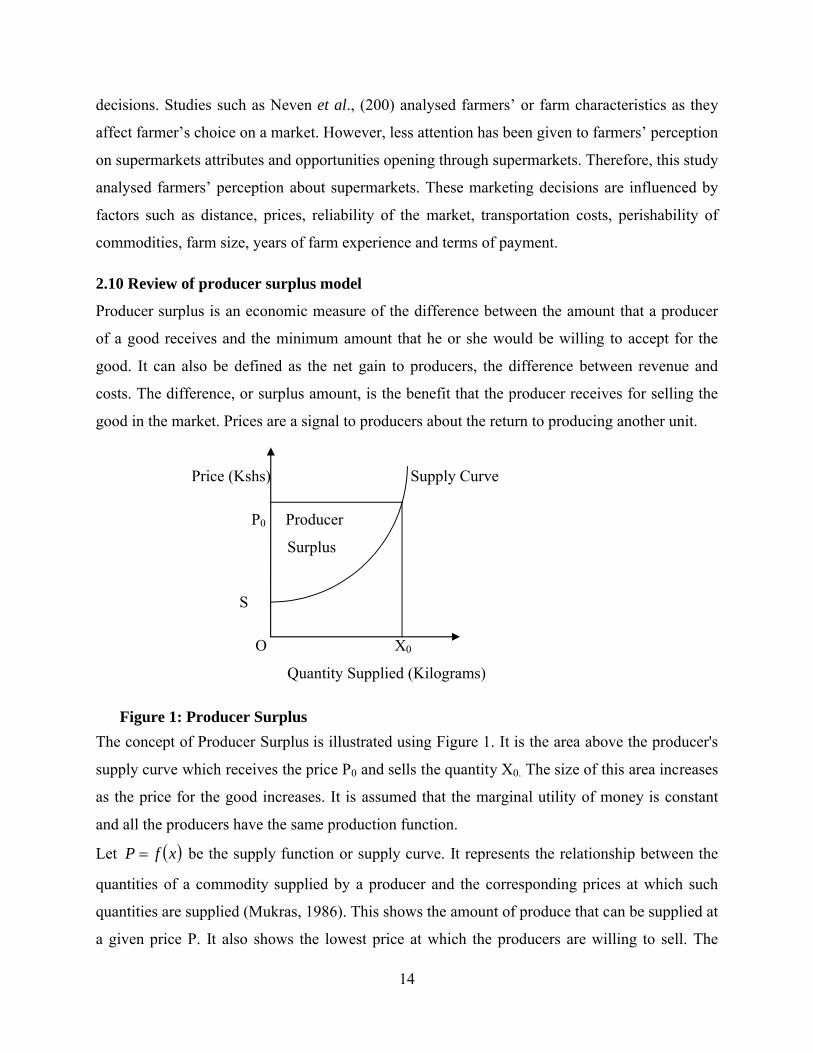
2.10 Review of producer surplus model
Producer surplus is an economic measure of the difference between the amount that a producer
of a good receives and the minimum amount that he or she would be willing to accept for the
good. It can also be defined as the net gain to producers, the difference between revenue and
costs. The difference, or surplus amount, is the benefit that the producer receives for selling the
good in the market. Prices are a signal to producers about the return to producing another unit.
Price (Kshs) Supply Curve
P0 Producer
Surplus
S
O X0
Quantity Supplied (Kilograms)
Figure 1: Producer Surplus
The concept of Producer Surplus is illustrated using Figure 1. It is the area above the producer's
supply curve which receives the price P0 and sells the quantity X0. The size of this area increases
as the price for the good increases. It is assumed that the marginal utility of money is constant
and all the producers have the same production function.
Let xfP be the supply function or supply curve. It represents the relationship between the
quantities of a commodity supplied by a producer and the corresponding prices at which such
quantities are supplied (Mukras, 1986). This shows the amount of produce that can be supplied at
a given price P. It also shows the lowest price at which the producers are willing to sell. The
15
lowest price at which producers would be willing to sell is the marginal cost of production, that
is, the cost of producing another unit of good. Suppose the price P0 and the quantity X0 is set at a
competitive market system. The competitive price does not necessarily reflect the price every
producer may be willing to accept for his products. For instance, if a producer is willing to
supply his price at a price level below P0, then that producer will gain if he sells at P0. The area
OSTX0 is the total cost of variable factors or the producers’ total revenue when he sells the
produce at a lower price than P0. The area OP0TX0 is the gross revenue. The difference between
the two areas, SP0T is the revenue above the variable costs which is the producer surplus
(Sadoulet and Janvry, 1995). The standard method of measuring producer surplus using market
price and quantity data was used. The assumption was the farmers will not change their
marketing behavior in the short run. Variable costs vary with output. This required a detailed
costs and earnings for a representative farmer.
The total cost of X0 units of production for a particular firm, is the area under producers’ supply
curve between zero and X0. Marginal cost is the cost of producing one more unit of the product,
given a particular level of production already. Marginal cost is approximated by the height of the
supply curve as long as the definition of an extra unit is sufficiently small.
Conclusion
Studies have been done in different areas touching different aspects of the rapid rise of
supermarkets. Most studies have concluded that adherence to strict supermarkets requirements
by the suppliers lead to being listed by the supermarkets, hence making it possible for some
farmers to be left out supplying supermarket. However, there are small-scale producers who are
supplying supermarkets directly especially the fresh produce. Given the fact that there may be
economic benefits that come with selling in the supermarkets and there are many small-scale
farmers in Kenya, it was important to verify if indeed they are benefitting from supplying the
supermarkets hence filling the information gap.
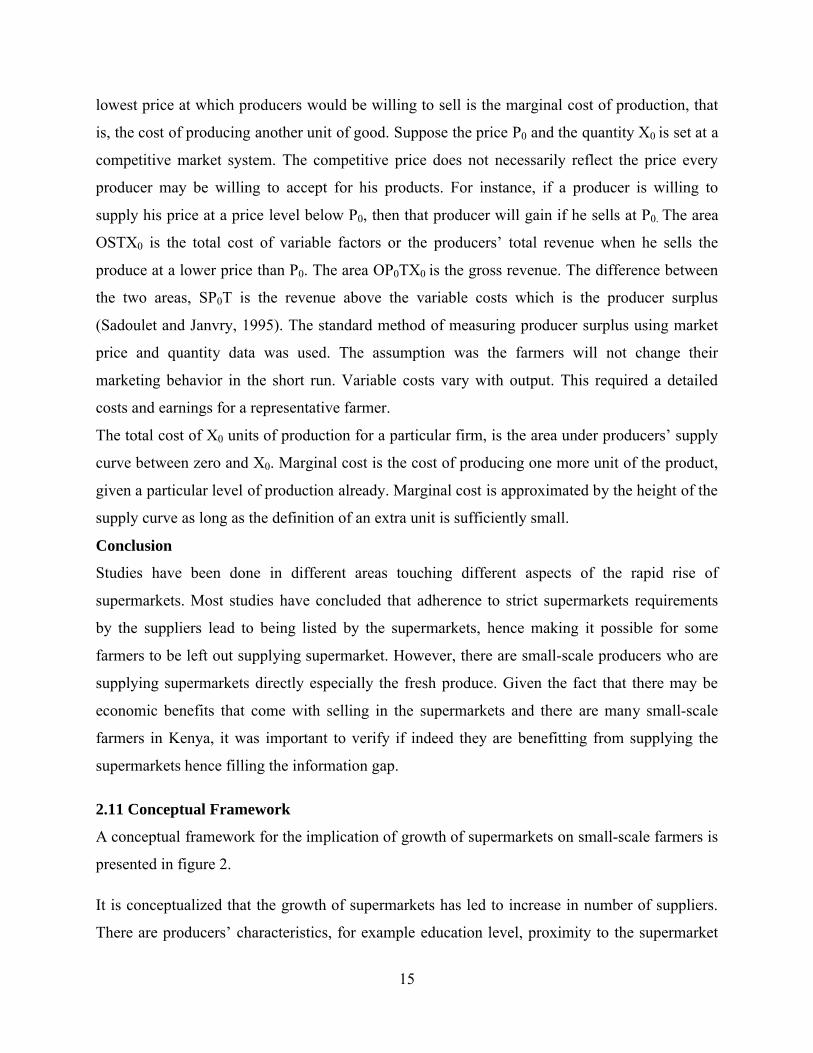
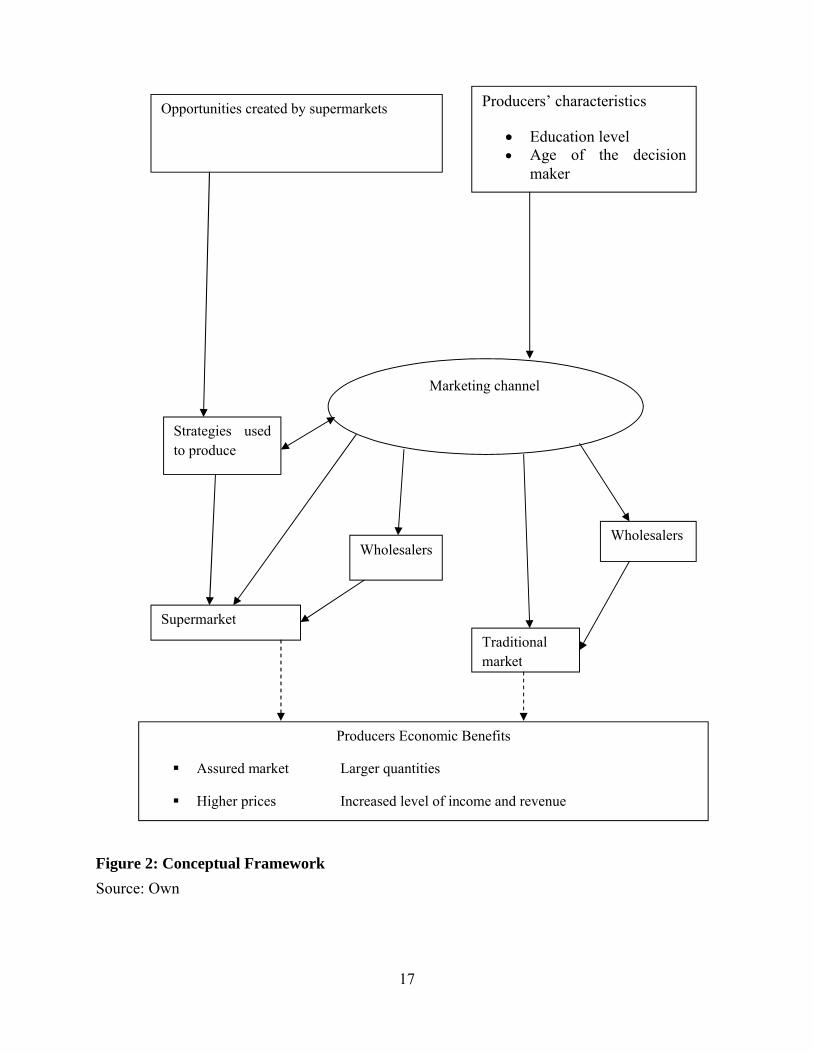
2.11 Conceptual Framework
A conceptual framework for the implication of growth of supermarkets on small-scale farmers is
presented in figure 2.
It is conceptualized that the growth of supermarkets has led to increase in number of suppliers.
There are producers’ characteristics, for example education level, proximity to the supermarket
16
that influences a producer to use supermarket channel or not. Institutional factors, for example,
group membership and access to information affect the farmers’ perception about supermarkets
in comparison to other channels which in turn lead to a decision on which channel to use. In
addition, the producers’ characteristics influence the marketing channel decision.
Price has a central role in influencing a farmer’s decision to produce and what product to
produce. After production the producer decides on which marketing channel to use. The
producers’ perception about supermarkets also affects the decision of market channel. The
producer may use supermarket or traditional channel. The producer may supply to the
supermarket or traditional channel directly or through wholesalers. If the producer uses the
supermarket channel, it will lead to increase in food products share in the supermarket. Each
channel has economic benefits. Generally, farmers’ participation in either channel has its own
benefits, for example, reliable markets and better prices hence increase in the level of revenue
and income.
17
Figure 2: Conceptual Framework
Source: Own
Opportunities created by supermarkets
Producers Economic Benefits
Assured market Larger quantities
Higher prices Increased level of income and revenue
Producers’ characteristics
Education level Age of the decision
maker
Strategies used to produce
Marketing channel
Supermarket
Wholesalers
Traditional market
Wholesalers
18
CHAPTER THREE
RESEARCH METHODOLOGY
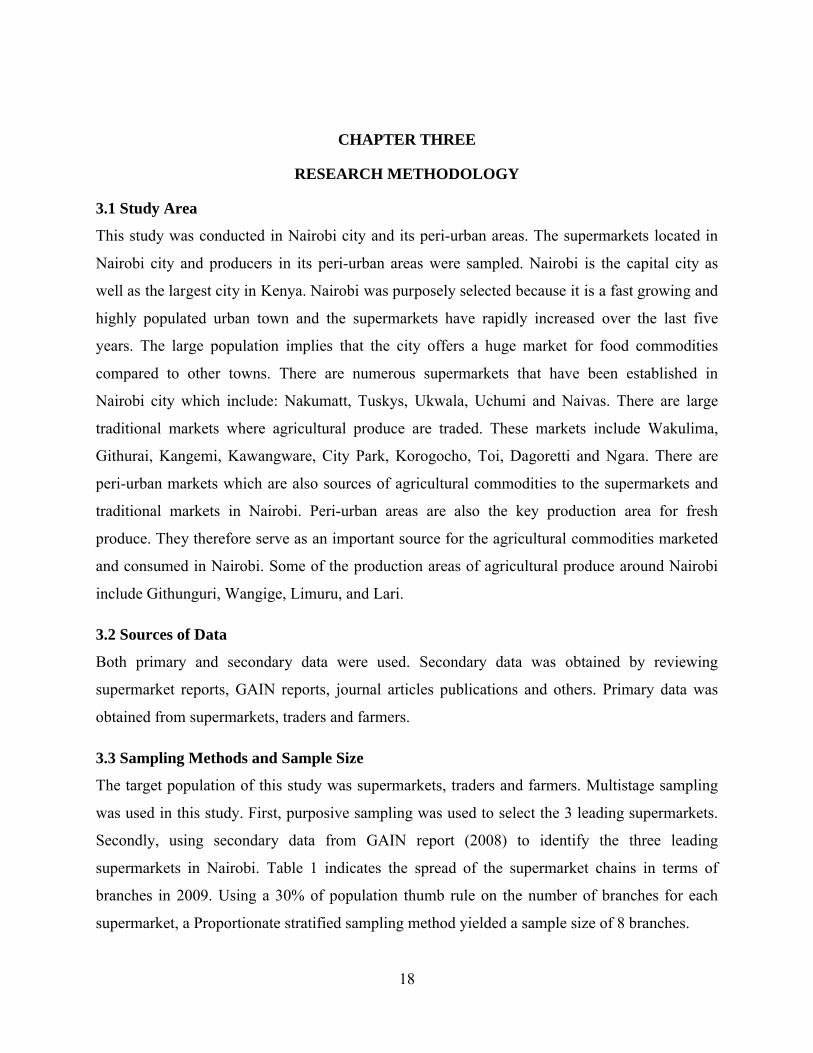
3.1 Study Area
This study was conducted in Nairobi city and its peri-urban areas. The supermarkets located in
Nairobi city and producers in its peri-urban areas were sampled. Nairobi is the capital city as
well as the largest city in Kenya. Nairobi was purposely selected because it is a fast growing and
highly populated urban town and the supermarkets have rapidly increased over the last five
years. The large population implies that the city offers a huge market for food commodities
compared to other towns. There are numerous supermarkets that have been established in
Nairobi city which include: Nakumatt, Tuskys, Ukwala, Uchumi and Naivas. There are large
traditional markets where agricultural produce are traded. These markets include Wakulima,
Githurai, Kangemi, Kawangware, City Park, Korogocho, Toi, Dagoretti and Ngara. There are
peri-urban markets which are also sources of agricultural commodities to the supermarkets and
traditional markets in Nairobi. Peri-urban areas are also the key production area for fresh
produce. They therefore serve as an important source for the agricultural commodities marketed
and consumed in Nairobi. Some of the production areas of agricultural produce around Nairobi
include Githunguri, Wangige, Limuru, and Lari.
3.2 Sources of Data
Both primary and secondary data were used. Secondary data was obtained by reviewing
supermarket reports, GAIN reports, journal articles publications and others. Primary data was
obtained from supermarkets, traders and farmers.
3.3 Sampling Methods and Sample Size
The target population of this study was supermarkets, traders and farmers. Multistage sampling
was used in this study. First, purposive sampling was used to select the 3 leading supermarkets.
Secondly, using secondary data from GAIN report (2008) to identify the three leading
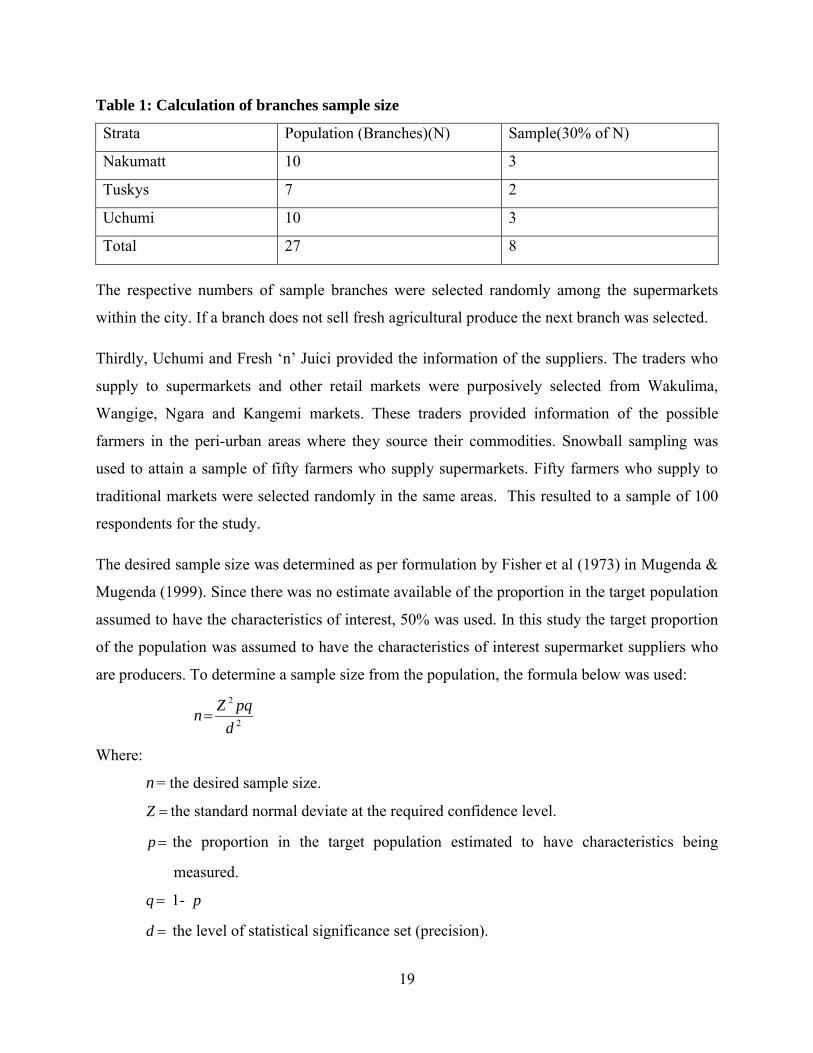
supermarkets in Nairobi. Table 1 indicates the spread of the supermarket chains in terms of
branches in 2009. Using a 30% of population thumb rule on the number of branches for each
supermarket, a Proportionate stratified sampling method yielded a sample size of 8 branches.
19
Table 1: Calculation of branches sample size
Strata Population (Branches)(N) Sample(30% of N)
Nakumatt 10 3
Tuskys 7 2
Uchumi 10 3
Total 27 8
The respective numbers of sample branches were selected randomly among the supermarkets
within the city. If a branch does not sell fresh agricultural produce the next branch was selected.
Thirdly, Uchumi and Fresh ‘n’ Juici provided the information of the suppliers. The traders who
supply to supermarkets and other retail markets were purposively selected from Wakulima,
Wangige, Ngara and Kangemi markets. These traders provided information of the possible
farmers in the peri-urban areas where they source their commodities. Snowball sampling was
used to attain a sample of fifty farmers who supply supermarkets. Fifty farmers who supply to
traditional markets were selected randomly in the same areas. This resulted to a sample of 100
respondents for the study.
The desired sample size was determined as per formulation by Fisher et al (1973) in Mugenda &
Mugenda (1999). Since there was no estimate available of the proportion in the target population
assumed to have the characteristics of interest, 50% was used. In this study the target proportion
of the population was assumed to have the characteristics of interest supermarket suppliers who
are producers. To determine a sample size from the population, the formula below was used:
2
2
d
pqZn
Where:
n = the desired sample size.
Z the standard normal deviate at the required confidence level.
p the proportion in the target population estimated to have characteristics being
measured.
q 1- p
d the level of statistical significance set (precision).
20
Since the proportion of the population is not known 5.0p , 5.05.01 q the Z statistics =
1.96 and a desired accuracy level at the 9.8%. This results to a sample of 100 respondents.
100098.0
5.5.96.12
2
n respondents.
3.4 Data Collection
Secondary data and other relevant information were collected from supermarkets reports,
journals, publications and others.
Primary data was collected by direct observation and use of questionnaires. Direct observation
was used to see if the branch stocks and sells fresh produce. Three sets of questionnaires were
used to collect information; one for supermarket managers, one for wholesalers/traders and the
other for farmers. The managers of supermarkets were interviewed about the suppliers, and the
products they procure directly from the farmers and wholesalers. The farmers’ questionnaire
focused on opportunities brought growth of supermarket, the strategies they use so as supplying
the supermarkets and the economic benefits. The interviews took place on the farm for both
farmers who supply to supermarket and traditional market. The wholesale suppliers were
interviewed at their premises.
3.5 Data Analysis and Procedure
Data was analyzed using descriptive statistics, likert scale techniques and producer surplus. A
Likert scale was used to assess perception of farmers about supermarket. Producer surplus was
used to determine the economic benefits that the farmer gets if they supply product to the
supermarket respectively. The statistical package for social scientists (SPSS) computer software
was used to generate summary statistics.
Descriptive analysis was used to analyse characteristics of the respondents, opportunities created
by the growth of the supermarkets and strategies employed by the farmers to effectively exploit
the potential created by the supermarkets. The mean, median, percentages and crosstabs were
used for analysis.
Likert scale was used to estimate perception of the producers about perceptions about
supermarkets. Predetermined opinions were presented to the respondents and the likert scaling
technique was used to rate the opinions. Each opinion was given a scale of one to five such as
21
strongly agree will take a scale of 5, agree a scale of 4, no idea a scale of 3, disagree a scale of 2,
and strongly disagree a scale of 1. Supermarkets attributes that were used in this study are
reliable market, better prices, supply of inputs/credit, knowledge transfer, reduced risks and
distance to supermarket.
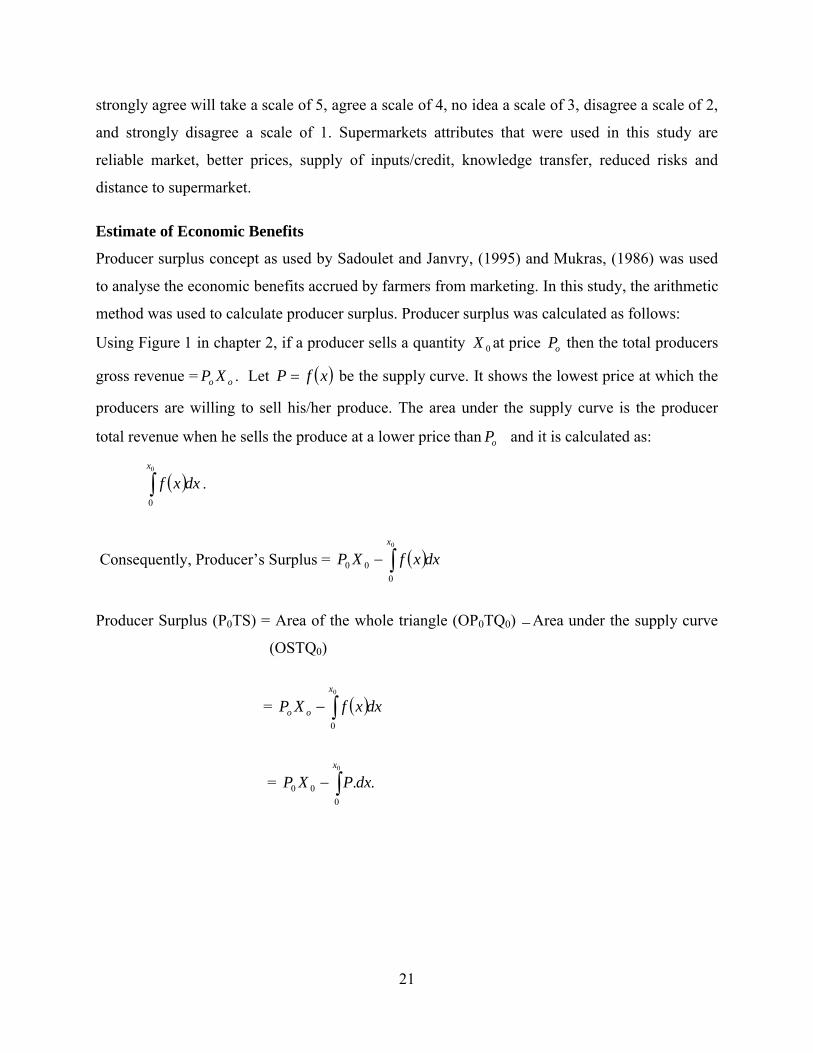
Estimate of Economic Benefits
Producer surplus concept as used by Sadoulet and Janvry, (1995) and Mukras, (1986) was used
to analyse the economic benefits accrued by farmers from marketing. In this study, the arithmetic
method was used to calculate producer surplus. Producer surplus was calculated as follows:
Using Figure 1 in chapter 2, if a producer sells a quantity 0X at price oP then the total producers
gross revenue = oo XP . Let xfP be the supply curve. It shows the lowest price at which the
producers are willing to sell his/her produce. The area under the supply curve is the producer
total revenue when he sells the produce at a lower price than oP and it is calculated as:
dxxfx
0
0
.
Consequently, Producer’s Surplus = dxxfXPx
0
0
00
Producer Surplus (P0TS) = Area of the whole triangle (OP0TQ0) Area under the supply curve
(OSTQ0)
= dxxfXPx
oo 0
0
= 0
0
00 ..x
dxPXP
22
CHAPTER FOUR
RESULTS AND DISCUSSION
4.1 Characteristics of the farmer respondents
4.1.1 Gender of the Farmer Respondents
Forty percent of the farmer respondents from supermarket-channel were female while 60% were
male. In the traditional-channel, 46% were female and 54% were male as shown in table 1
below.
Table 1: Gender Status of Farmer RespondentsSupermarket Traditional market
Frequency Percentage Frequency Percentage
Male 30 60 27 54
Female 20 40 23 46
Total 50 100 50 100
Source: survey data, 2009
4.1.2 Age of the Farmer Respondents
Table 2 below shows the distribution of age between the supermarket-channel and traditional-
channel. As shown below that 6% of supermarket-channel farmers were aged between 20-30
years, 36% was aged 30-40 years, 34% aged between 40-50 years, 22% were aged between 50-
60 years and 2% over 60 years. 4% of traditional-channel farmers were aged between 20-30
years, 8% were aged 30-40 years, 44% aged between 40-50 years, 34% were aged between 50-
60 years and 10% over 60 years. About 98% of the supermarket-channel farmers were aged
between 20-60 years. The majority of supermarket-channel farmers are relatively young. Chi –
square tests was conducted to assess if there was any significant difference between
supermarket-channel and traditional-channel farmers with respect to their age and the results
were not significant at 95% confidence interval (χ2= 4.291, p = .008) as represented in table 2
below.
23
Table 2: Age of Respondents
Supermarket Traditional market
Frequency Percentage Frequency Percentage
20-30 years 3 6 2 4
30-40 years 18 36 4 8
40-50 years 17 34 22 44
50-60 years 11 22 17 34
>60 years 1 2 5 10
Total 50 100 50 100
χ2 =13.702 p=.008
Source: survey data, 2009
Farm activities are greatly affected by age. Most supermarkets farmers are relatively young
hence wanted to do farming as a business other than for subsistence. They also tend to be
innovative entrepreneurial farmers who produced in response to the supermarket demands
(Kamau, 2008).
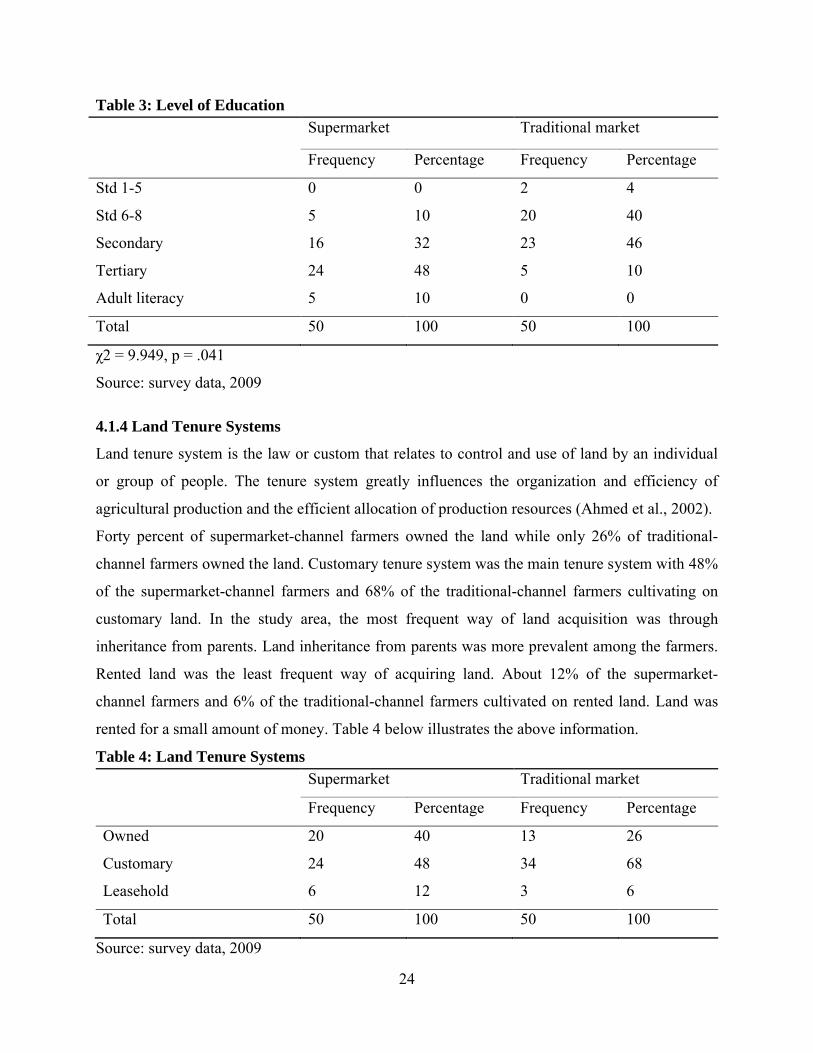
4.1.3 Level of Education
In the Table 3 below 10% of the supermarket-channel had attained an education level of standard
6-8, 32% had secondary school education, 48% had tertiary education and 10% had adult
literacy. In the traditional-channel farmers, 4% had attained standard 1-5, 40% standard 6-8, 46%
secondary education, 10% tertiary education. Chi – square tests was conducted to assess if there
was any significant difference between supermarket-channel and traditional-channel market with
respect to their education level and the results were significant at 95% confidence interval (χ2 =
9.949, p = .041) as represented in table 5 below. 80% of supermarket-channel farmers had at
least secondary education. This means that the supermarket-channel farmers were elite and more
informed. These farmers have the ability to negotiate contracts. They also tend to understand the
requirements of the contracts. Higher education also means more information on potential
sources of credit for investment in farming and better management of credit facilities as shown in
Table 8. Hassine (2008) focused on the agricultural sector and found strong evidence that the
level of education affects agricultural productivity growth by increasing the capacity to adopt
foreign technologies.
24
Table 3: Level of Education
Supermarket Traditional market
Frequency Percentage Frequency Percentage
Std 1-5 0 0 2 4
Std 6-8 5 10 20 40
Secondary 16 32 23 46
Tertiary 24 48 5 10
Adult literacy 5 10 0 0
Total 50 100 50 100
χ2 = 9.949, p = .041
Source: survey data, 2009
4.1.4 Land Tenure Systems
Land tenure system is the law or custom that relates to control and use of land by an individual
or group of people. The tenure system greatly influences the organization and efficiency of
agricultural production and the efficient allocation of production resources (Ahmed et al., 2002).
Forty percent of supermarket-channel farmers owned the land while only 26% of traditional-
channel farmers owned the land. Customary tenure system was the main tenure system with 48%
of the supermarket-channel farmers and 68% of the traditional-channel farmers cultivating on
customary land. In the study area, the most frequent way of land acquisition was through
inheritance from parents. Land inheritance from parents was more prevalent among the farmers.
Rented land was the least frequent way of acquiring land. About 12% of the supermarket-
channel farmers and 6% of the traditional-channel farmers cultivated on rented land. Land was
rented for a small amount of money. Table 4 below illustrates the above information.
Table 4: Land Tenure Systems
Supermarket Traditional market
Frequency Percentage Frequency Percentage
Owned 20 40 13 26
Customary 24 48 34 68
Leasehold 6 12 3 6
Total 50 100 50 100
Source: survey data, 2009
25
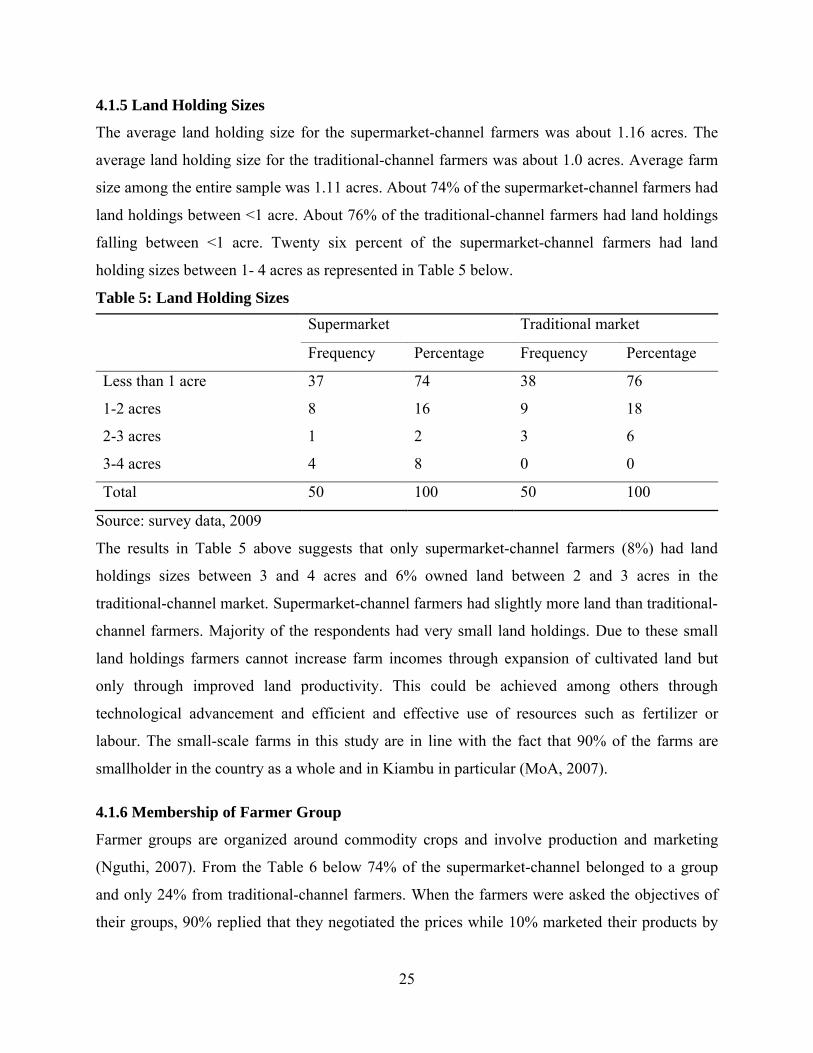
4.1.5 Land Holding Sizes
The average land holding size for the supermarket-channel farmers was about 1.16 acres. The
average land holding size for the traditional-channel farmers was about 1.0 acres. Average farm
size among the entire sample was 1.11 acres. About 74% of the supermarket-channel farmers had
land holdings between <1 acre. About 76% of the traditional-channel farmers had land holdings
falling between <1 acre. Twenty six percent of the supermarket-channel farmers had land
holding sizes between 1- 4 acres as represented in Table 5 below.
Table 5: Land Holding Sizes
Supermarket Traditional market
Frequency Percentage Frequency Percentage
Less than 1 acre 37 74 38 76
1-2 acres 8 16 9 18
2-3 acres 1 2 3 6
3-4 acres 4 8 0 0
Total 50 100 50 100
Source: survey data, 2009
The results in Table 5 above suggests that only supermarket-channel farmers (8%) had land
holdings sizes between 3 and 4 acres and 6% owned land between 2 and 3 acres in the
traditional-channel market. Supermarket-channel farmers had slightly more land than traditional-
channel farmers. Majority of the respondents had very small land holdings. Due to these small
land holdings farmers cannot increase farm incomes through expansion of cultivated land but
only through improved land productivity. This could be achieved among others through
technological advancement and efficient and effective use of resources such as fertilizer or
labour. The small-scale farms in this study are in line with the fact that 90% of the farms are
smallholder in the country as a whole and in Kiambu in particular (MoA, 2007).
4.1.6 Membership of Farmer Group
Farmer groups are organized around commodity crops and involve production and marketing
(Nguthi, 2007). From the Table 6 below 74% of the supermarket-channel belonged to a group
and only 24% from traditional-channel farmers. When the farmers were asked the objectives of
their groups, 90% replied that they negotiated the prices while 10% marketed their products by
26
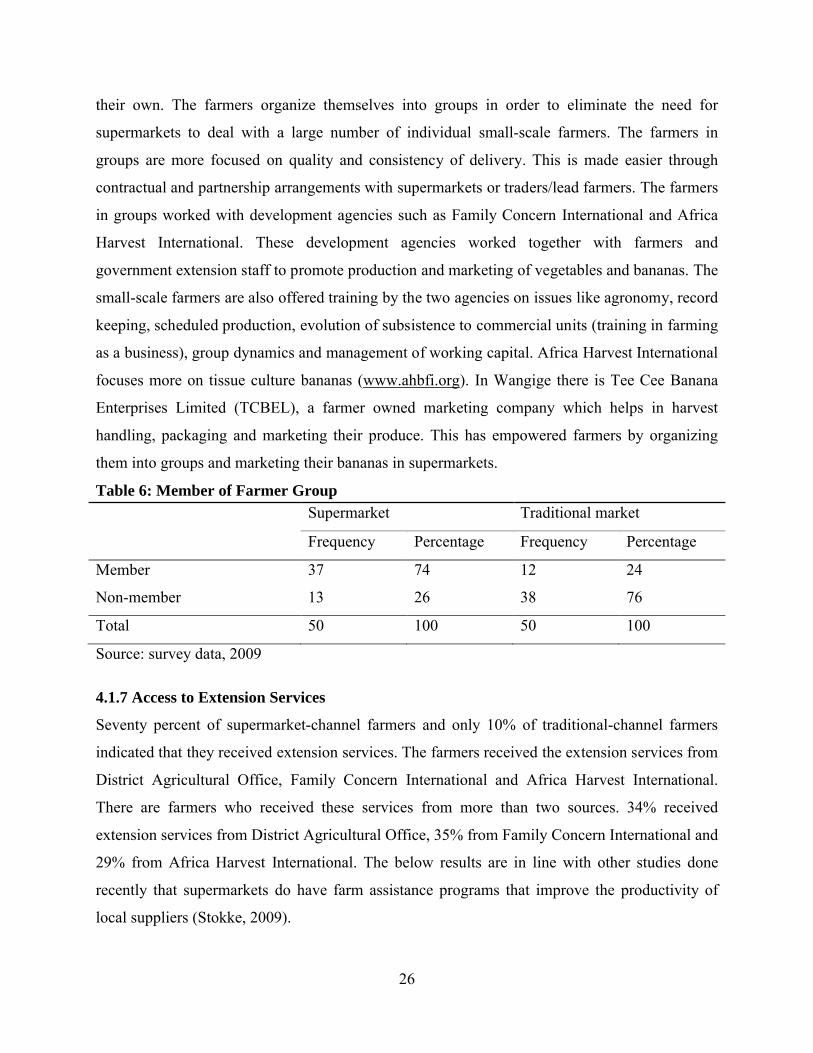
their own. The farmers organize themselves into groups in order to eliminate the need for
supermarkets to deal with a large number of individual small-scale farmers. The farmers in
groups are more focused on quality and consistency of delivery. This is made easier through
contractual and partnership arrangements with supermarkets or traders/lead farmers. The farmers
in groups worked with development agencies such as Family Concern International and Africa
Harvest International. These development agencies worked together with farmers and
government extension staff to promote production and marketing of vegetables and bananas. The
small-scale farmers are also offered training by the two agencies on issues like agronomy, record
keeping, scheduled production, evolution of subsistence to commercial units (training in farming
as a business), group dynamics and management of working capital. Africa Harvest International
focuses more on tissue culture bananas (www.ahbfi.org). In Wangige there is Tee Cee Banana
Enterprises Limited (TCBEL), a farmer owned marketing company which helps in harvest
handling, packaging and marketing their produce. This has empowered farmers by organizing
them into groups and marketing their bananas in supermarkets.
Table 6: Member of Farmer GroupSupermarket Traditional market
Frequency Percentage Frequency Percentage
Member 37 74 12 24
Non-member 13 26 38 76
Total 50 100 50 100
Source: survey data, 2009
4.1.7 Access to Extension Services
Seventy percent of supermarket-channel farmers and only 10% of traditional-channel farmers
indicated that they received extension services. The farmers received the extension services from
District Agricultural Office, Family Concern International and Africa Harvest International.
There are farmers who received these services from more than two sources. 34% received
extension services from District Agricultural Office, 35% from Family Concern International and
29% from Africa Harvest International. The below results are in line with other studies done
recently that supermarkets do have farm assistance programs that improve the productivity of
local suppliers (Stokke, 2009).
27
Table 7: Access to Extension Services
Supermarket Traditional market
Frequency Percentage Frequency Percentage
Yes = 1 35 70 5 10
No = 0 15 30 45 90
Total 50 100 50 100
Source: survey data, 2009
4.1.8 Accessibility to Credit
Sixty four percent of supermarket-channel farmers acquired loans so as to finance agricultural
activities while none of the traditional-channel farmers had acquired loan from any organisation.
This is probably because the supermarket-channel farmers are more educated. Eighteen percent
of the farmers who acquired credit got it from Africa Harvest International, 40.6% from
microfinance institution, and only 1% from the bank. Most of the farmers had access to credit in
Africa and microfinance institutions because collateral is not needed as long as one is in a group.
However, supermarkets do not extend credit to producers. The farmers had acquired credit so as
to purchase inputs and other assets.
Table 8: Accessibility to CreditSupermarket Traditional market
Frequency Percentage Frequency Percentage
Yes=1 32 64 50 100
No=0 18 36 0 0
Total 50 100 50 100
Source: survey data, 2009
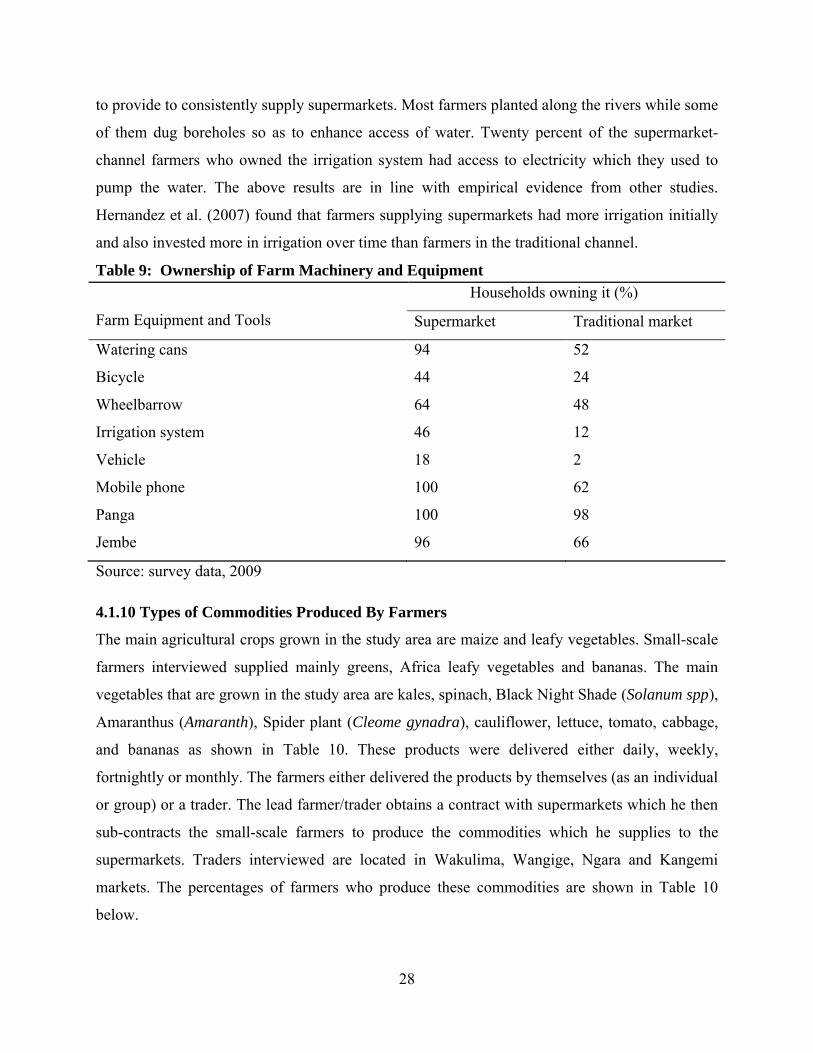
4.1.9 Ownership of Farm Machinery and Equipment
None of the households owned tractor. Table 9 indicates that most respondents owned panga and
Jembe (100% and 98% from supermarket and traditional market and 96% and 66% from
supermarket and traditional market respectively). Ninety six percent of supermarket-channel
farmers own mobile phones, 46% have sprinkler irrigation while 62% of traditional-channel
farmers own mobile phones and only 12% had sprinkler irrigation. Ninety four percent of
supermarket-channel farmers had watering cans to irrigate the products. This is because they had
28
to provide to consistently supply supermarkets. Most farmers planted along the rivers while some
of them dug boreholes so as to enhance access of water. Twenty percent of the supermarket-
channel farmers who owned the irrigation system had access to electricity which they used to
pump the water. The above results are in line with empirical evidence from other studies.
Hernandez et al. (2007) found that farmers supplying supermarkets had more irrigation initially
and also invested more in irrigation over time than farmers in the traditional channel.
Table 9: Ownership of Farm Machinery and Equipment
Farm Equipment and Tools
Households owning it (%)
Supermarket Traditional market
Watering cans 94 52
Bicycle 44 24
Wheelbarrow 64 48
Irrigation system 46 12
Vehicle 18 2
Mobile phone 100 62
Panga 100 98
Jembe 96 66
Source: survey data, 2009
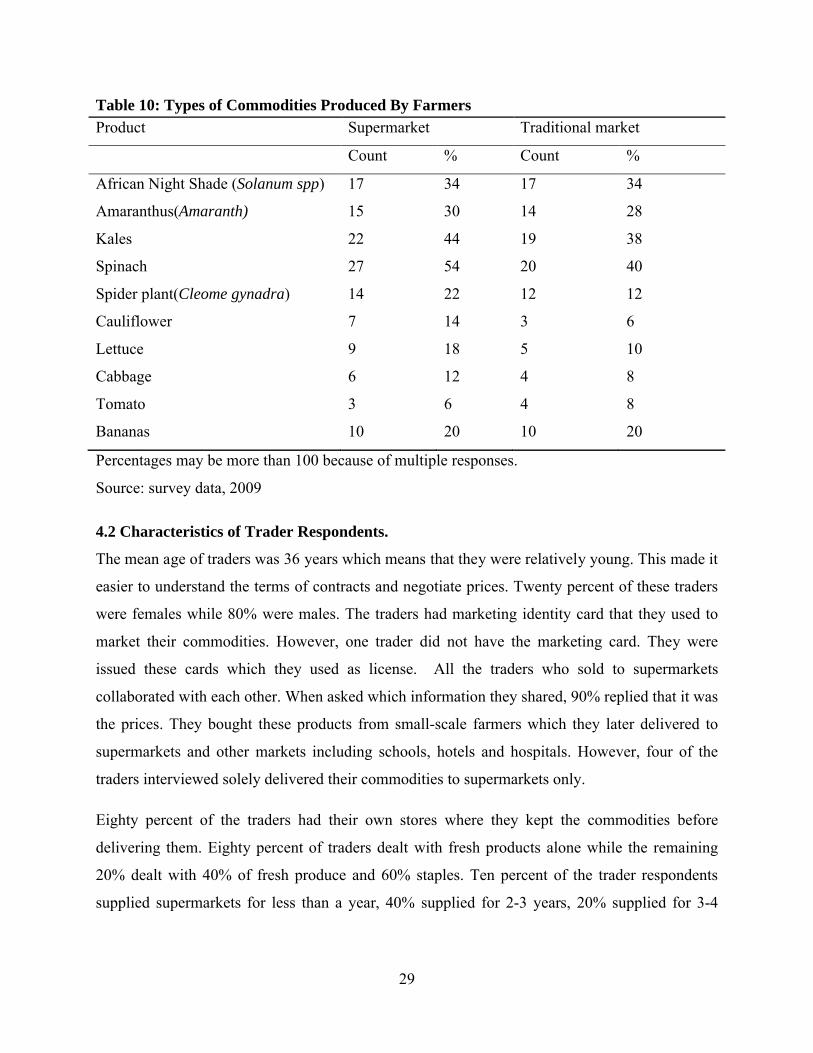
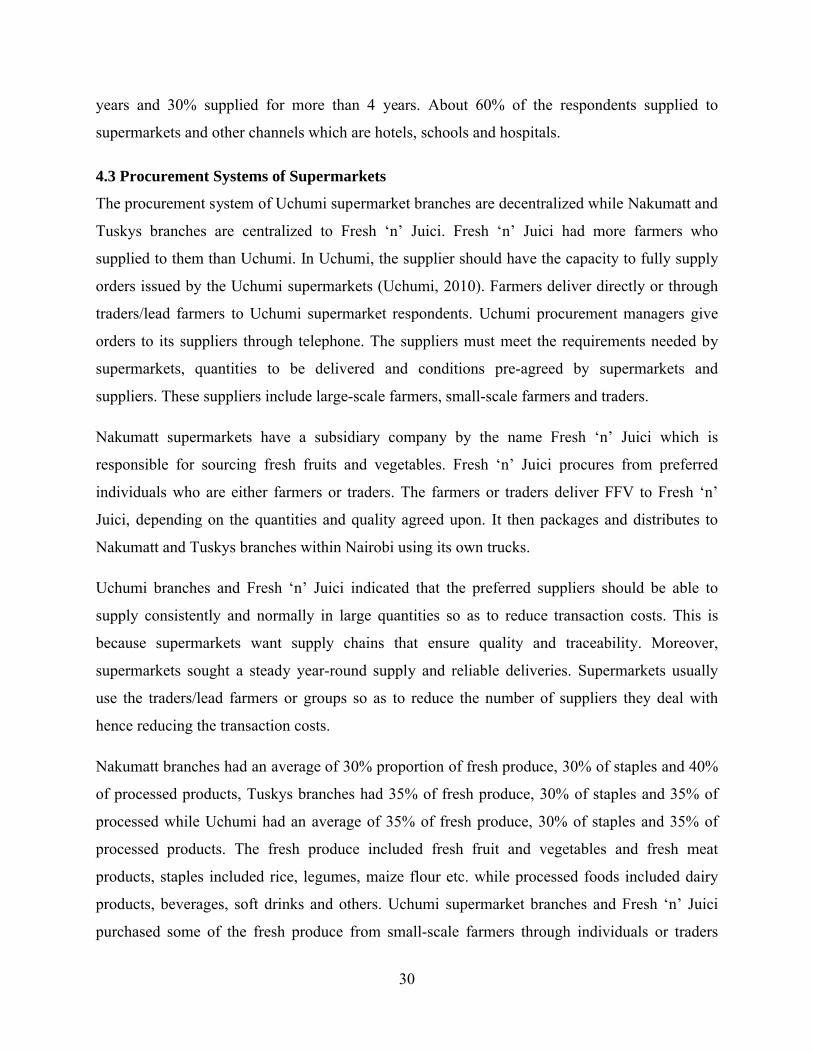
4.1.10 Types of Commodities Produced By Farmers
The main agricultural crops grown in the study area are maize and leafy vegetables. Small-scale
farmers interviewed supplied mainly greens, Africa leafy vegetables and bananas. The main
vegetables that are grown in the study area are kales, spinach, Black Night Shade (Solanum spp),
Vermeulen, H. and Bienabe, E. (2008). New trends in supermarkets procurement system in South
Africa: the case of local procurement schemes from small-scale farmers by rural-based
retail chain store. University of Pretoria and CIRAD, UMR Innovation.
Vorley, B., Andrew, F and Derek, R. (2004). A Place for Small-Scale Producers in Modern
Agrifood Chains? International Institute for Environment and Development.
Vorley, B. and Fox, T. (June 2004). Global Food Chains—Constraints and Opportunities for
Smallholders. OECD DAC POVNET. Helsinki Workshop.
Weatherspoon, D.D. and Reardon, T. (2002). The Rise of Supermarkets in Africa: Implications
for Agrifood systems and the rural poor. Development Policy Review, 21(3), 333.
Wiggerthale, M. (2008). Supermarket Expansion in the South-A Threat to Small Farmers?
English Summary. EED (Church Development Service). Germany.
60
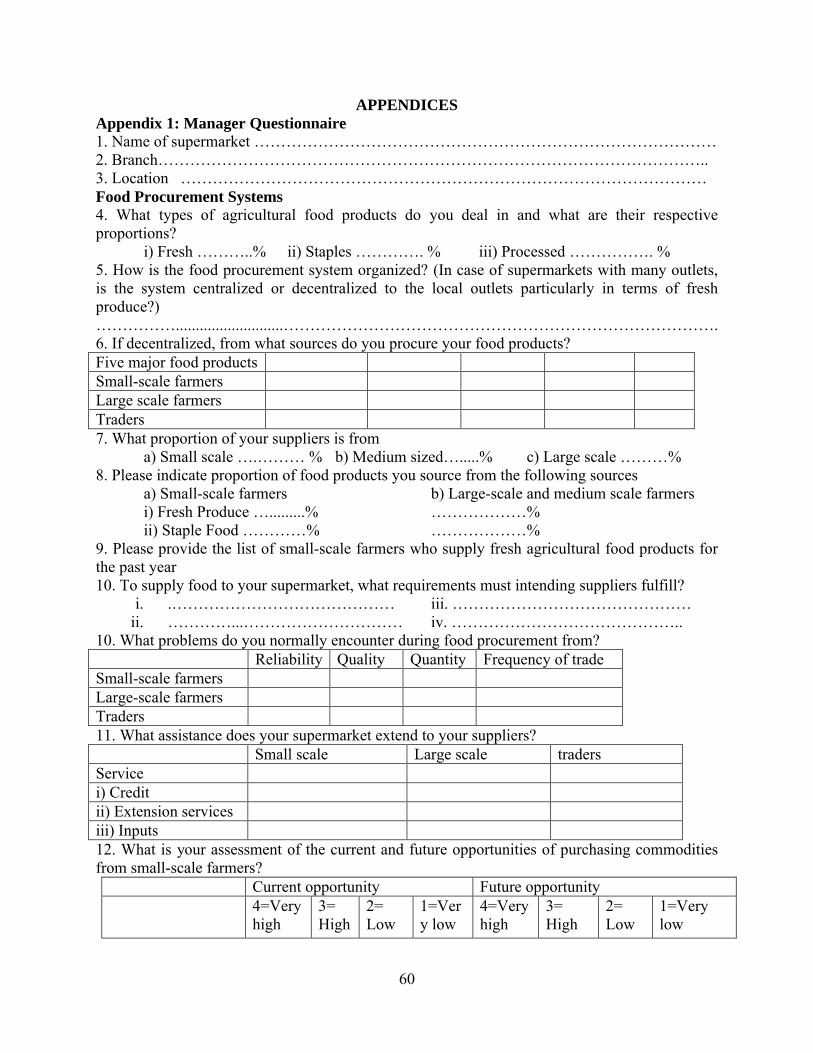
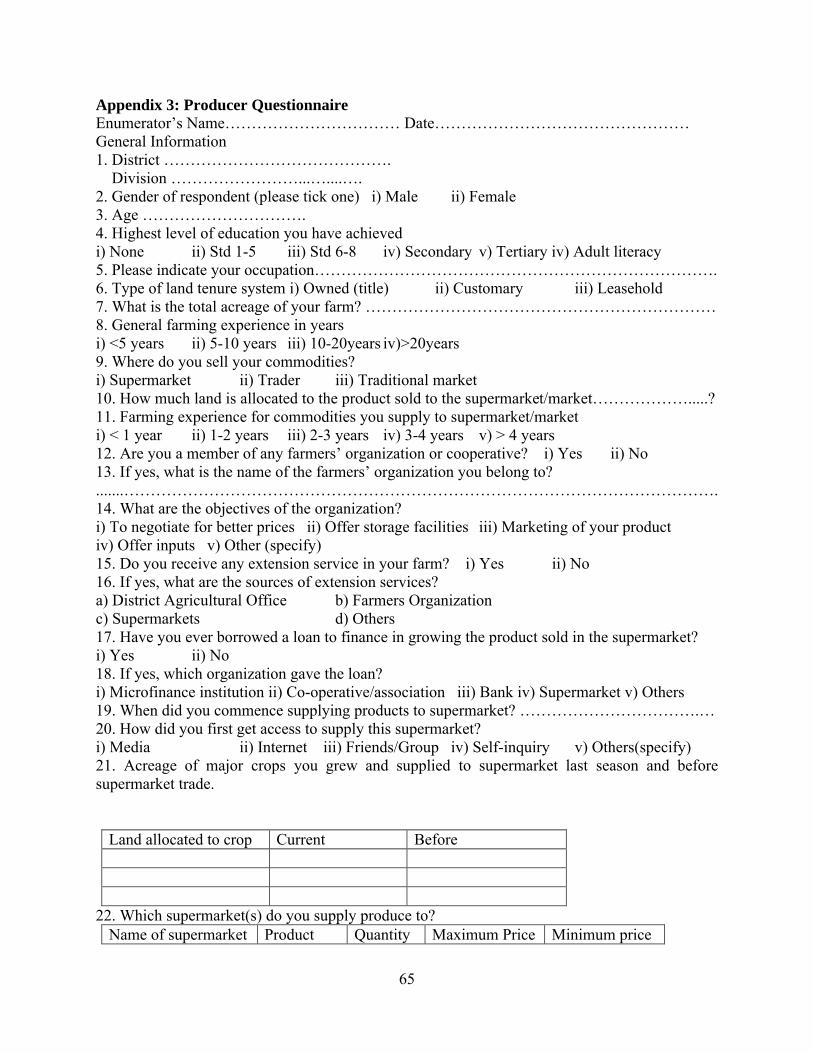
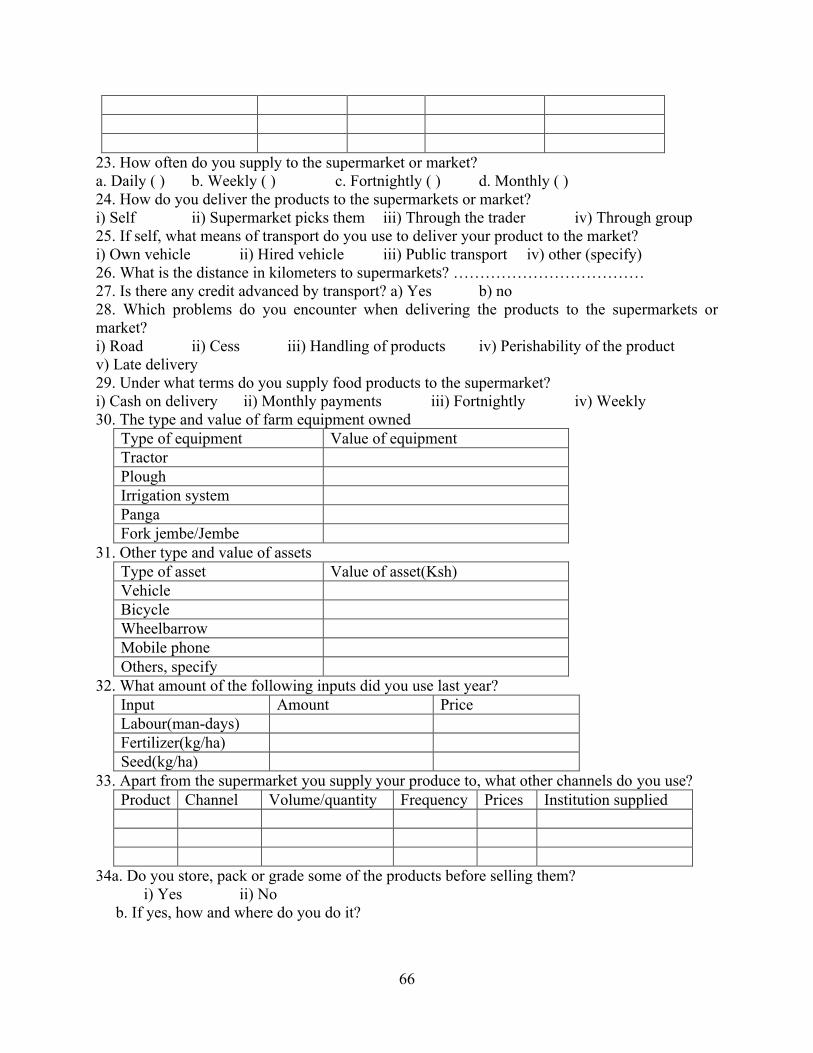
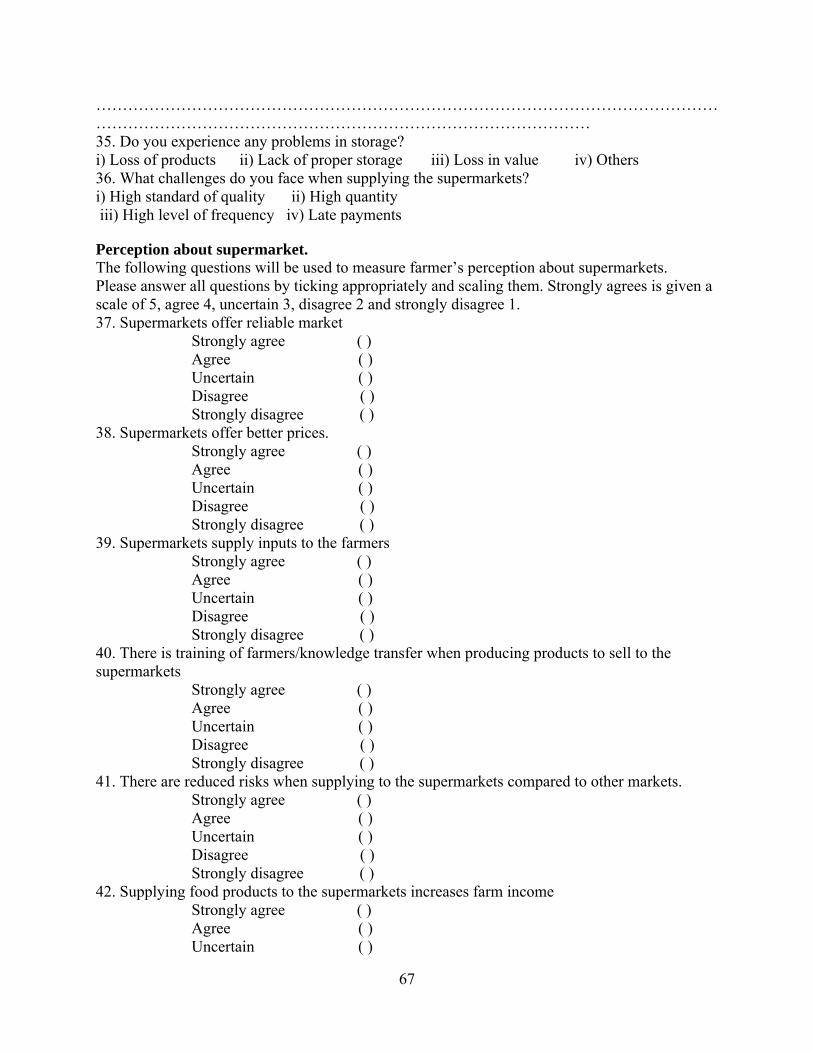
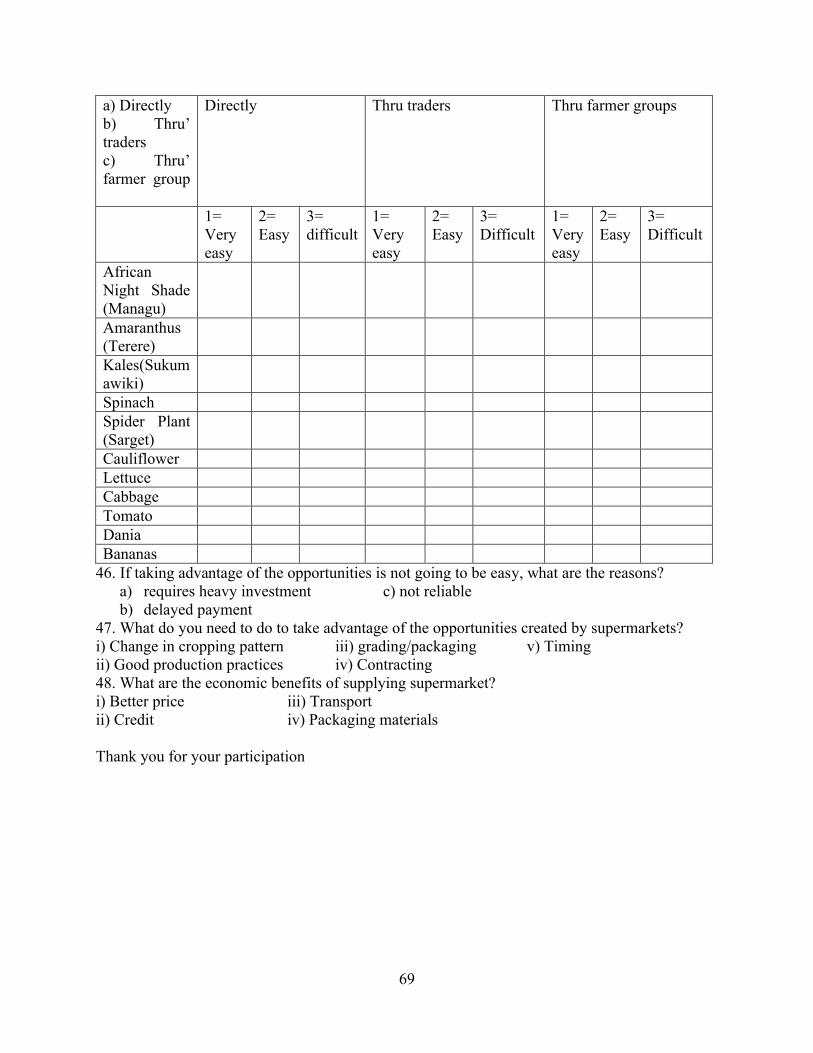
APPENDICESAppendix 1: Manager Questionnaire1. Name of supermarket ……………………………………………………………………………2. Branch…………………………………………………………………………………………..3. Location ………………………………………………………………………………………Food Procurement Systems4. What types of agricultural food products do you deal in and what are their respective proportions?
i) Fresh ………..% ii) Staples …………. % iii) Processed ……………. %5. How is the food procurement system organized? (In case of supermarkets with many outlets, is the system centralized or decentralized to the local outlets particularly in terms of fresh produce?)……………...........................……………………………………………………………………….6. If decentralized, from what sources do you procure your food products?Five major food productsSmall-scale farmersLarge scale farmersTraders7. What proportion of your suppliers is from
a) Small scale ….……… % b) Medium sized….....% c) Large scale ………% 8. Please indicate proportion of food products you source from the following sources
a) Small-scale farmers b) Large-scale and medium scale farmersi) Fresh Produce ….........% ………………%ii) Staple Food …………% ………………%
9. Please provide the list of small-scale farmers who supply fresh agricultural food products for the past year 10. To supply food to your supermarket, what requirements must intending suppliers fulfill?
i. .…………………………………… iii. ………………………………………ii. …………...………………………… iv. ……………………………………..
10. What problems do you normally encounter during food procurement from?Reliability Quality Quantity Frequency of trade
Small-scale farmersLarge-scale farmersTraders11. What assistance does your supermarket extend to your suppliers?
Small scale Large scale tradersServicei) Creditii) Extension servicesiii) Inputs12. What is your assessment of the current and future opportunities of purchasing commodities from small-scale farmers?
Current opportunity Future opportunity 4=Very high
3=High
2=Low
1=Very low
4=Very high
3=High
2=Low
1=Very low
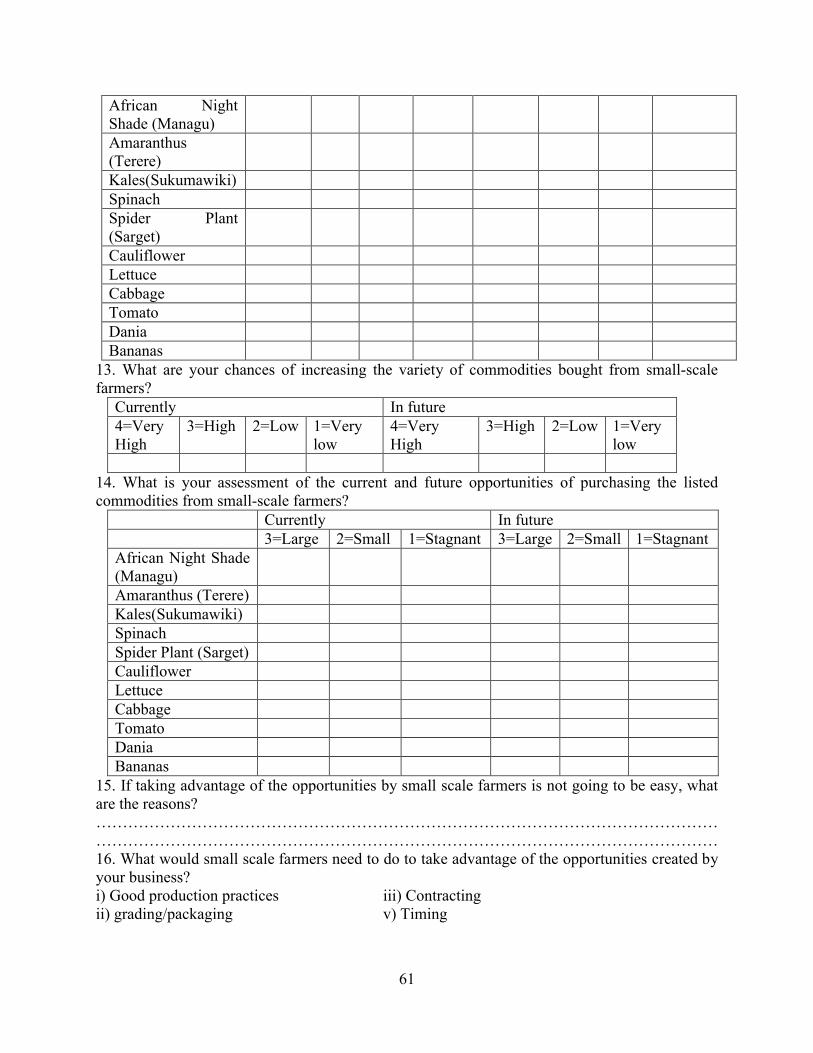
61
African Night Shade (Managu)Amaranthus(Terere)Kales(Sukumawiki)SpinachSpider Plant(Sarget)CauliflowerLettuceCabbageTomatoDania Bananas
13. What are your chances of increasing the variety of commodities bought from small-scale farmers?
Currently In future4=Very High
3=High 2=Low 1=Very low
4=Very High
3=High 2=Low 1=Very low
14. What is your assessment of the current and future opportunities of purchasing the listed commodities from small-scale farmers?
Currently In future3=Large 2=Small 1=Stagnant 3=Large 2=Small 1=Stagnant
African Night Shade(Managu)Amaranthus (Terere)Kales(Sukumawiki)SpinachSpider Plant (Sarget)CauliflowerLettuceCabbageTomatoDaniaBananas
15. If taking advantage of the opportunities by small scale farmers is not going to be easy, what are the reasons? ………………………………………………………………………………………………………………………………………………………………………………………………………………16. What would small scale farmers need to do to take advantage of the opportunities created by your business? i) Good production practices iii) Contractingii) grading/packaging v) Timing
62
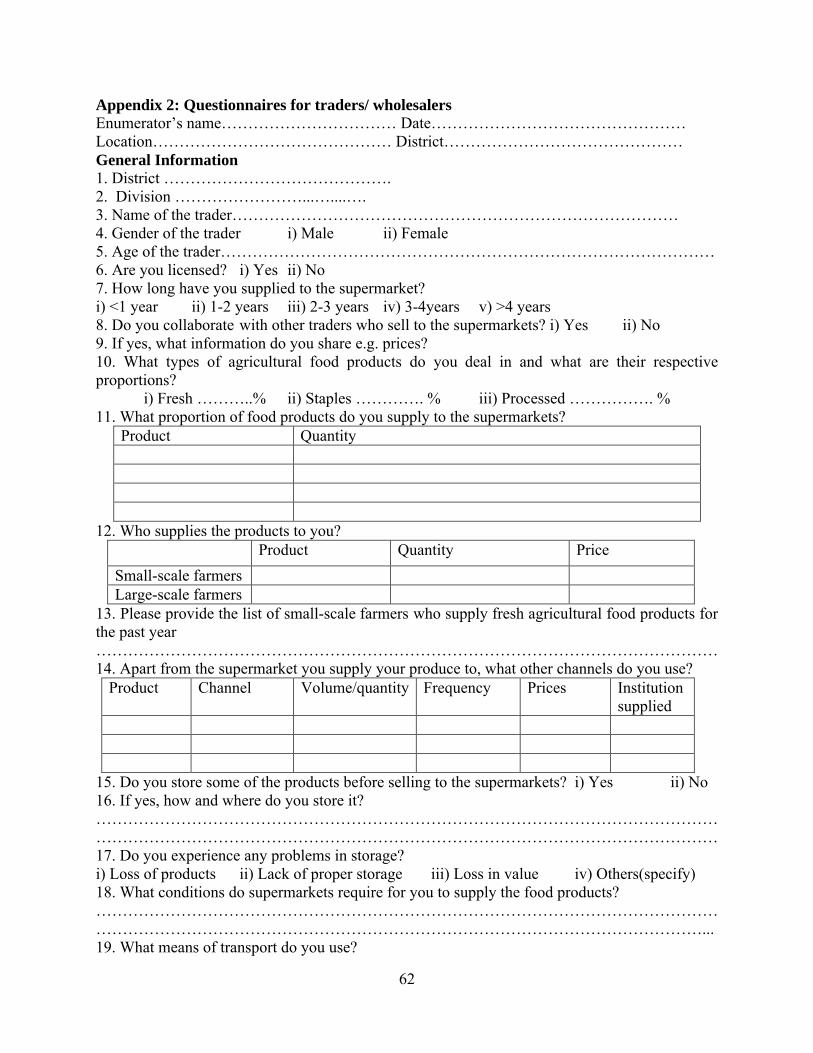
Appendix 2: Questionnaires for traders/ wholesalersEnumerator’s name…………………………… Date…………………………………………Location……………………………………… District………………………………………General Information1. District ……………………………………. 2. Division ……………………...…....…. 3. Name of the trader…………………………………………………………………………4. Gender of the trader i) Male ii) Female5. Age of the trader…………………………………………………………………………………6. Are you licensed? i) Yes ii) No7. How long have you supplied to the supermarket?i) <1 year ii) 1-2 years iii) 2-3 years iv) 3-4years v) >4 years8. Do you collaborate with other traders who sell to the supermarkets? i) Yes ii) No9. If yes, what information do you share e.g. prices?10. What types of agricultural food products do you deal in and what are their respective proportions?
i) Fresh ………..% ii) Staples …………. % iii) Processed ……………. %11. What proportion of food products do you supply to the supermarkets?
Product Quantity
12. Who supplies the products to you? Product Quantity Price
Small-scale farmersLarge-scale farmers
13. Please provide the list of small-scale farmers who supply fresh agricultural food products for the past year………………………………………………………………………………………………………14. Apart from the supermarket you supply your produce to, what other channels do you use?
Product Channel Volume/quantity Frequency Prices Institution supplied
15. Do you store some of the products before selling to the supermarkets? i) Yes ii) No16. If yes, how and where do you store it? ………………………………………………………………………………………………………………………………………………………………………………………………………………17. Do you experience any problems in storage? i) Loss of products ii) Lack of proper storage iii) Loss in value iv) Others(specify)18. What conditions do supermarkets require for you to supply the food products?……………………………………………………………………………………………………………………………………………………………………………………………………………...19. What means of transport do you use?
63
i) Own ii)Hired iii)public transport iv)others(specify)20. Are you a member of an organization? i) Yes ii) No21. If yes, what are the benefits?i) Negotiation of better prices ii) Access to storage facilities iii) others (specify)22. If no, why?i) High registration fee ii) Have capability of marketing on my own) iii) Others (specify)23. Do you encounter any problems when dealing with farmers?i) Poor quality of product ii) Do not meet the demand iii) Other (specify24. Do you offer any extra service to farmers? i) Yes ii) No25. If yes, which one?i) Transportation ii) Credit iii) Storage iv) Others (specify)26. What are the constraints that farmers face when supplying products to you?i) Transportation ii) Good handling of the products iii) Packing iv) others (specify)27. Are you aware of opportunities created by growth of supermarket? i) Yes ii) no 28. What is your assessment of the current and future opportunities of supplying commodities to the supermarkets?
Current opportunity Future opportunity 4=Very high
3=High
2=Low 1=Very low
4=Very high
3=High 2=Low 1=Very low
African Night Shade (Managu)Amaranthus(Terere)Kales(Sukumawiki)SpinachSpider Plant(Sarget)CauliflowerLettuceCabbageTomatoDania Bananas
29. If taking advantage of the opportunities is not going to be easy, what are the reasons? a) requires heavy investmentb) delayed paymentc) not reliable
30. On a scale below, with 3=high, 2=small and 1=stagnant, how would you rate the quantities of products you a) sell currently to supermarkets?
b) Expect to sell in future? (Large, small, and stagnant)Currently In future3=Large 2=Small 1=Stagnant 3=Large 2=Small 1=Stagnant
31. What do you need to do to take advantage of the opportunities created by supermarkets? i) grading/packaging iii) Timingii) Contracting32. What are the benefits of supplying supermarket?i) Better price iii) Transportii) Credit iv) Packaging materials
Thank you for your participation
65
Appendix 3: Producer QuestionnaireEnumerator’s Name…………………………… Date…………………………………………General Information1. District ……………………………………. Division ……………………...…....…. 2. Gender of respondent (please tick one) i) Male ii) Female3. Age ………………………….4. Highest level of education you have achievedi) None ii) Std 1-5 iii) Std 6-8 iv) Secondary v) Tertiary iv) Adult literacy5. Please indicate your occupation…………………………………………………………………. 6. Type of land tenure system i) Owned (title) ii) Customary iii) Leasehold7. What is the total acreage of your farm? …………………………………………………………8. General farming experience in years i) <5 years ii) 5-10 years iii) 10-20years iv)>20years9. Where do you sell your commodities?i) Supermarket ii) Trader iii) Traditional market10. How much land is allocated to the product sold to the supermarket/market……………….....?11. Farming experience for commodities you supply to supermarket/marketi) < 1 year ii) 1-2 years iii) 2-3 years iv) 3-4 years v) > 4 years12. Are you a member of any farmers’ organization or cooperative? i) Yes ii) No13. If yes, what is the name of the farmers’ organization you belong to?.......………………………………………………………………………………………………….14. What are the objectives of the organization?i) To negotiate for better prices ii) Offer storage facilities iii) Marketing of your productiv) Offer inputs v) Other (specify)15. Do you receive any extension service in your farm? i) Yes ii) No16. If yes, what are the sources of extension services?a) District Agricultural Office b) Farmers Organizationc) Supermarkets d) Others 17. Have you ever borrowed a loan to finance in growing the product sold in the supermarket?i) Yes ii) No18. If yes, which organization gave the loan?i) Microfinance institution ii) Co-operative/association iii) Bank iv) Supermarket v) Others19. When did you commence supplying products to supermarket? …………………………….…20. How did you first get access to supply this supermarket?i) Media ii) Internet iii) Friends/Group iv) Self-inquiry v) Others(specify)21. Acreage of major crops you grew and supplied to supermarket last season and before supermarket trade.
Land allocated to crop Current Before
22. Which supermarket(s) do you supply produce to?Name of supermarket Product Quantity Maximum Price Minimum price
66
23. How often do you supply to the supermarket or market?a. Daily ( ) b. Weekly ( ) c. Fortnightly ( ) d. Monthly ( )24. How do you deliver the products to the supermarkets or market?i) Self ii) Supermarket picks them iii) Through the trader iv) Through group25. If self, what means of transport do you use to deliver your product to the market?i) Own vehicle ii) Hired vehicle iii) Public transport iv) other (specify) 26. What is the distance in kilometers to supermarkets? ………………………………27. Is there any credit advanced by transport? a) Yes b) no28. Which problems do you encounter when delivering the products to the supermarkets or market?i) Road ii) Cess iii) Handling of products iv) Perishability of the productv) Late delivery29. Under what terms do you supply food products to the supermarket?i) Cash on delivery ii) Monthly payments iii) Fortnightly iv) Weekly30. The type and value of farm equipment owned
Type of equipment Value of equipmentTractorPloughIrrigation systemPangaFork jembe/Jembe
31. Other type and value of assetsType of asset Value of asset(Ksh)VehicleBicycleWheelbarrowMobile phoneOthers, specify
32. What amount of the following inputs did you use last year? Input Amount Price Labour(man-days)Fertilizer(kg/ha)Seed(kg/ha)
33. Apart from the supermarket you supply your produce to, what other channels do you use?Product Channel Volume/quantity Frequency Prices Institution supplied
34a. Do you store, pack or grade some of the products before selling them?i) Yes ii) No
b. If yes, how and where do you do it?
67
…………………………………………………………………………………………………………………………………………………………………………………………35. Do you experience any problems in storage? i) Loss of products ii) Lack of proper storage iii) Loss in value iv) Others36. What challenges do you face when supplying the supermarkets?i) High standard of quality ii) High quantity iii) High level of frequency iv) Late payments
Perception about supermarket.The following questions will be used to measure farmer’s perception about supermarkets.Please answer all questions by ticking appropriately and scaling them. Strongly agrees is given a scale of 5, agree 4, uncertain 3, disagree 2 and strongly disagree 1.37. Supermarkets offer reliable market
41. There are reduced risks when supplying to the supermarkets compared to other markets.Strongly agree ( )Agree ( )Uncertain ( )Disagree ( )Strongly disagree ( )
42. Supplying food products to the supermarkets increases farm income Strongly agree ( )Agree ( )Uncertain ( )
68
Disagree ( )Strongly disagree ( )
43. What is your assessment of the current and future opportunities of supplying commodities to the supermarkets?
Current opportunity Future opportunity 4=Very high
3=High 2=Low 1=Very low
4=Very high
3=High 2=Low
1=Very low
African Night Shade (Managu)Amaranthus(Terere)Kales(Sukumawiki)SpinachSpider Plant(Sarget)CauliflowerLettuceCabbageTomatoDania Bananas
44. On a scale below, with 3=high, 2=small and 1=stagnant, how would you rate the quantities of products you a) sell currently to supermarkets?
b) Expect to sell in future? (Large, small, and stagnant)Currently Available in future3=Large 2=Small 1=Stagnant 3=Large 2=Small 1=Stagnant
African Night Shade (Managu)Amaranthus (Terere)Kales(Sukumawiki)SpinachSpider Plant (Sarget)CauliflowerLettuceCabbageTomatoDaniaBananas
45. What do you think about the ease of selling to the supermarkets your commodities to supermarkets?
69
a) Directlyb) Thru’ tradersc) Thru’ farmer group
Directly Thru traders Thru farmer groups
1=Very easy
2=Easy
3=difficult
1=Very easy
2=Easy
3=Difficult
1=Very easy
2=Easy
3=Difficult
African Night Shade (Managu)Amaranthus(Terere)Kales(Sukumawiki)SpinachSpider Plant(Sarget)CauliflowerLettuceCabbageTomatoDaniaBananas
46. If taking advantage of the opportunities is not going to be easy, what are the reasons?a) requires heavy investment c) not reliableb) delayed payment
47. What do you need to do to take advantage of the opportunities created by supermarkets? i) Change in cropping pattern iii) grading/packaging v) Timingii) Good production practices iv) Contracting48. What are the economic benefits of supplying supermarket?i) Better price iii) Transportii) Credit iv) Packaging materials